
Biodegradation of Inosine and Guanosine by Bacillus paranthracis YD01

Abstract
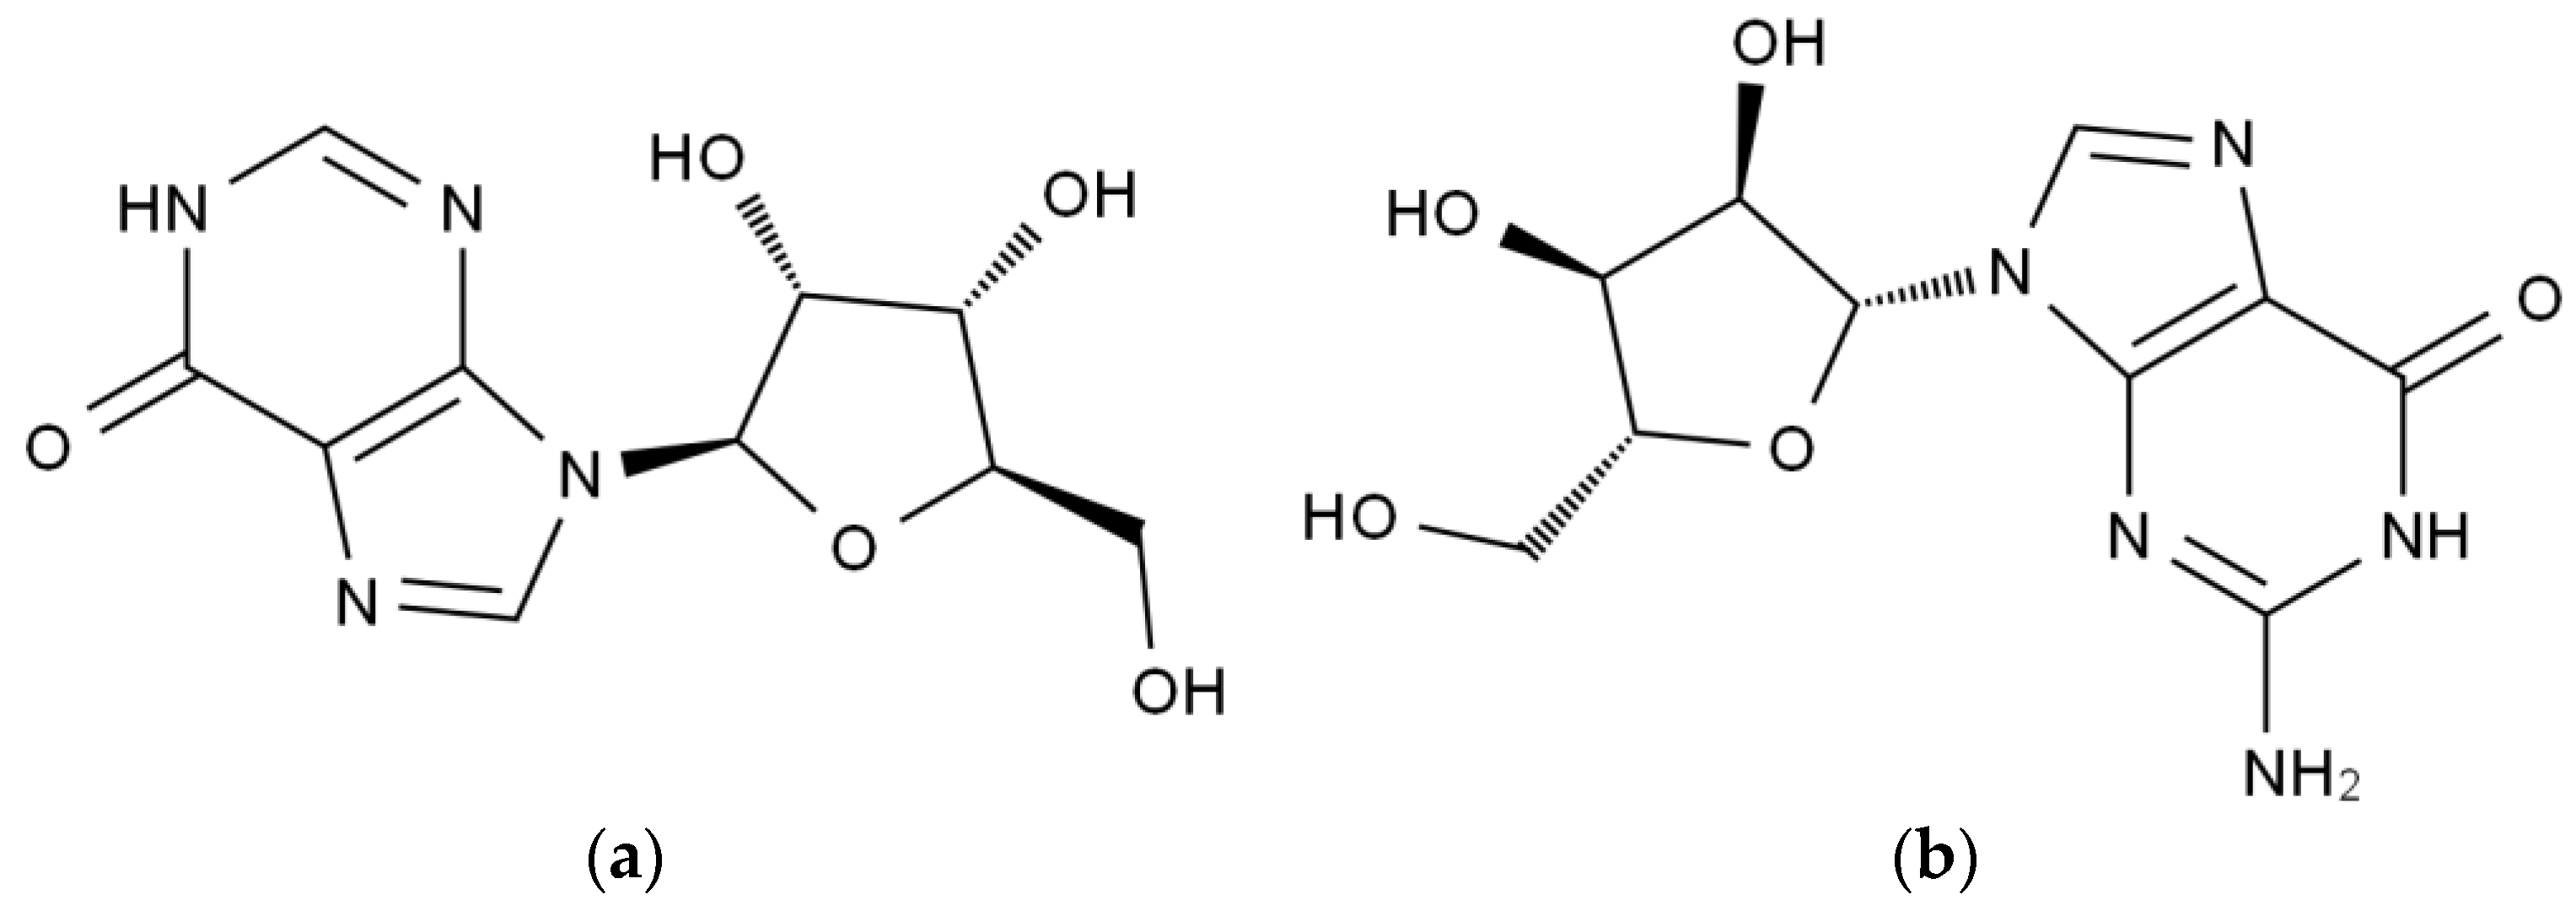
:1. Introduction
2. Results and Discussion
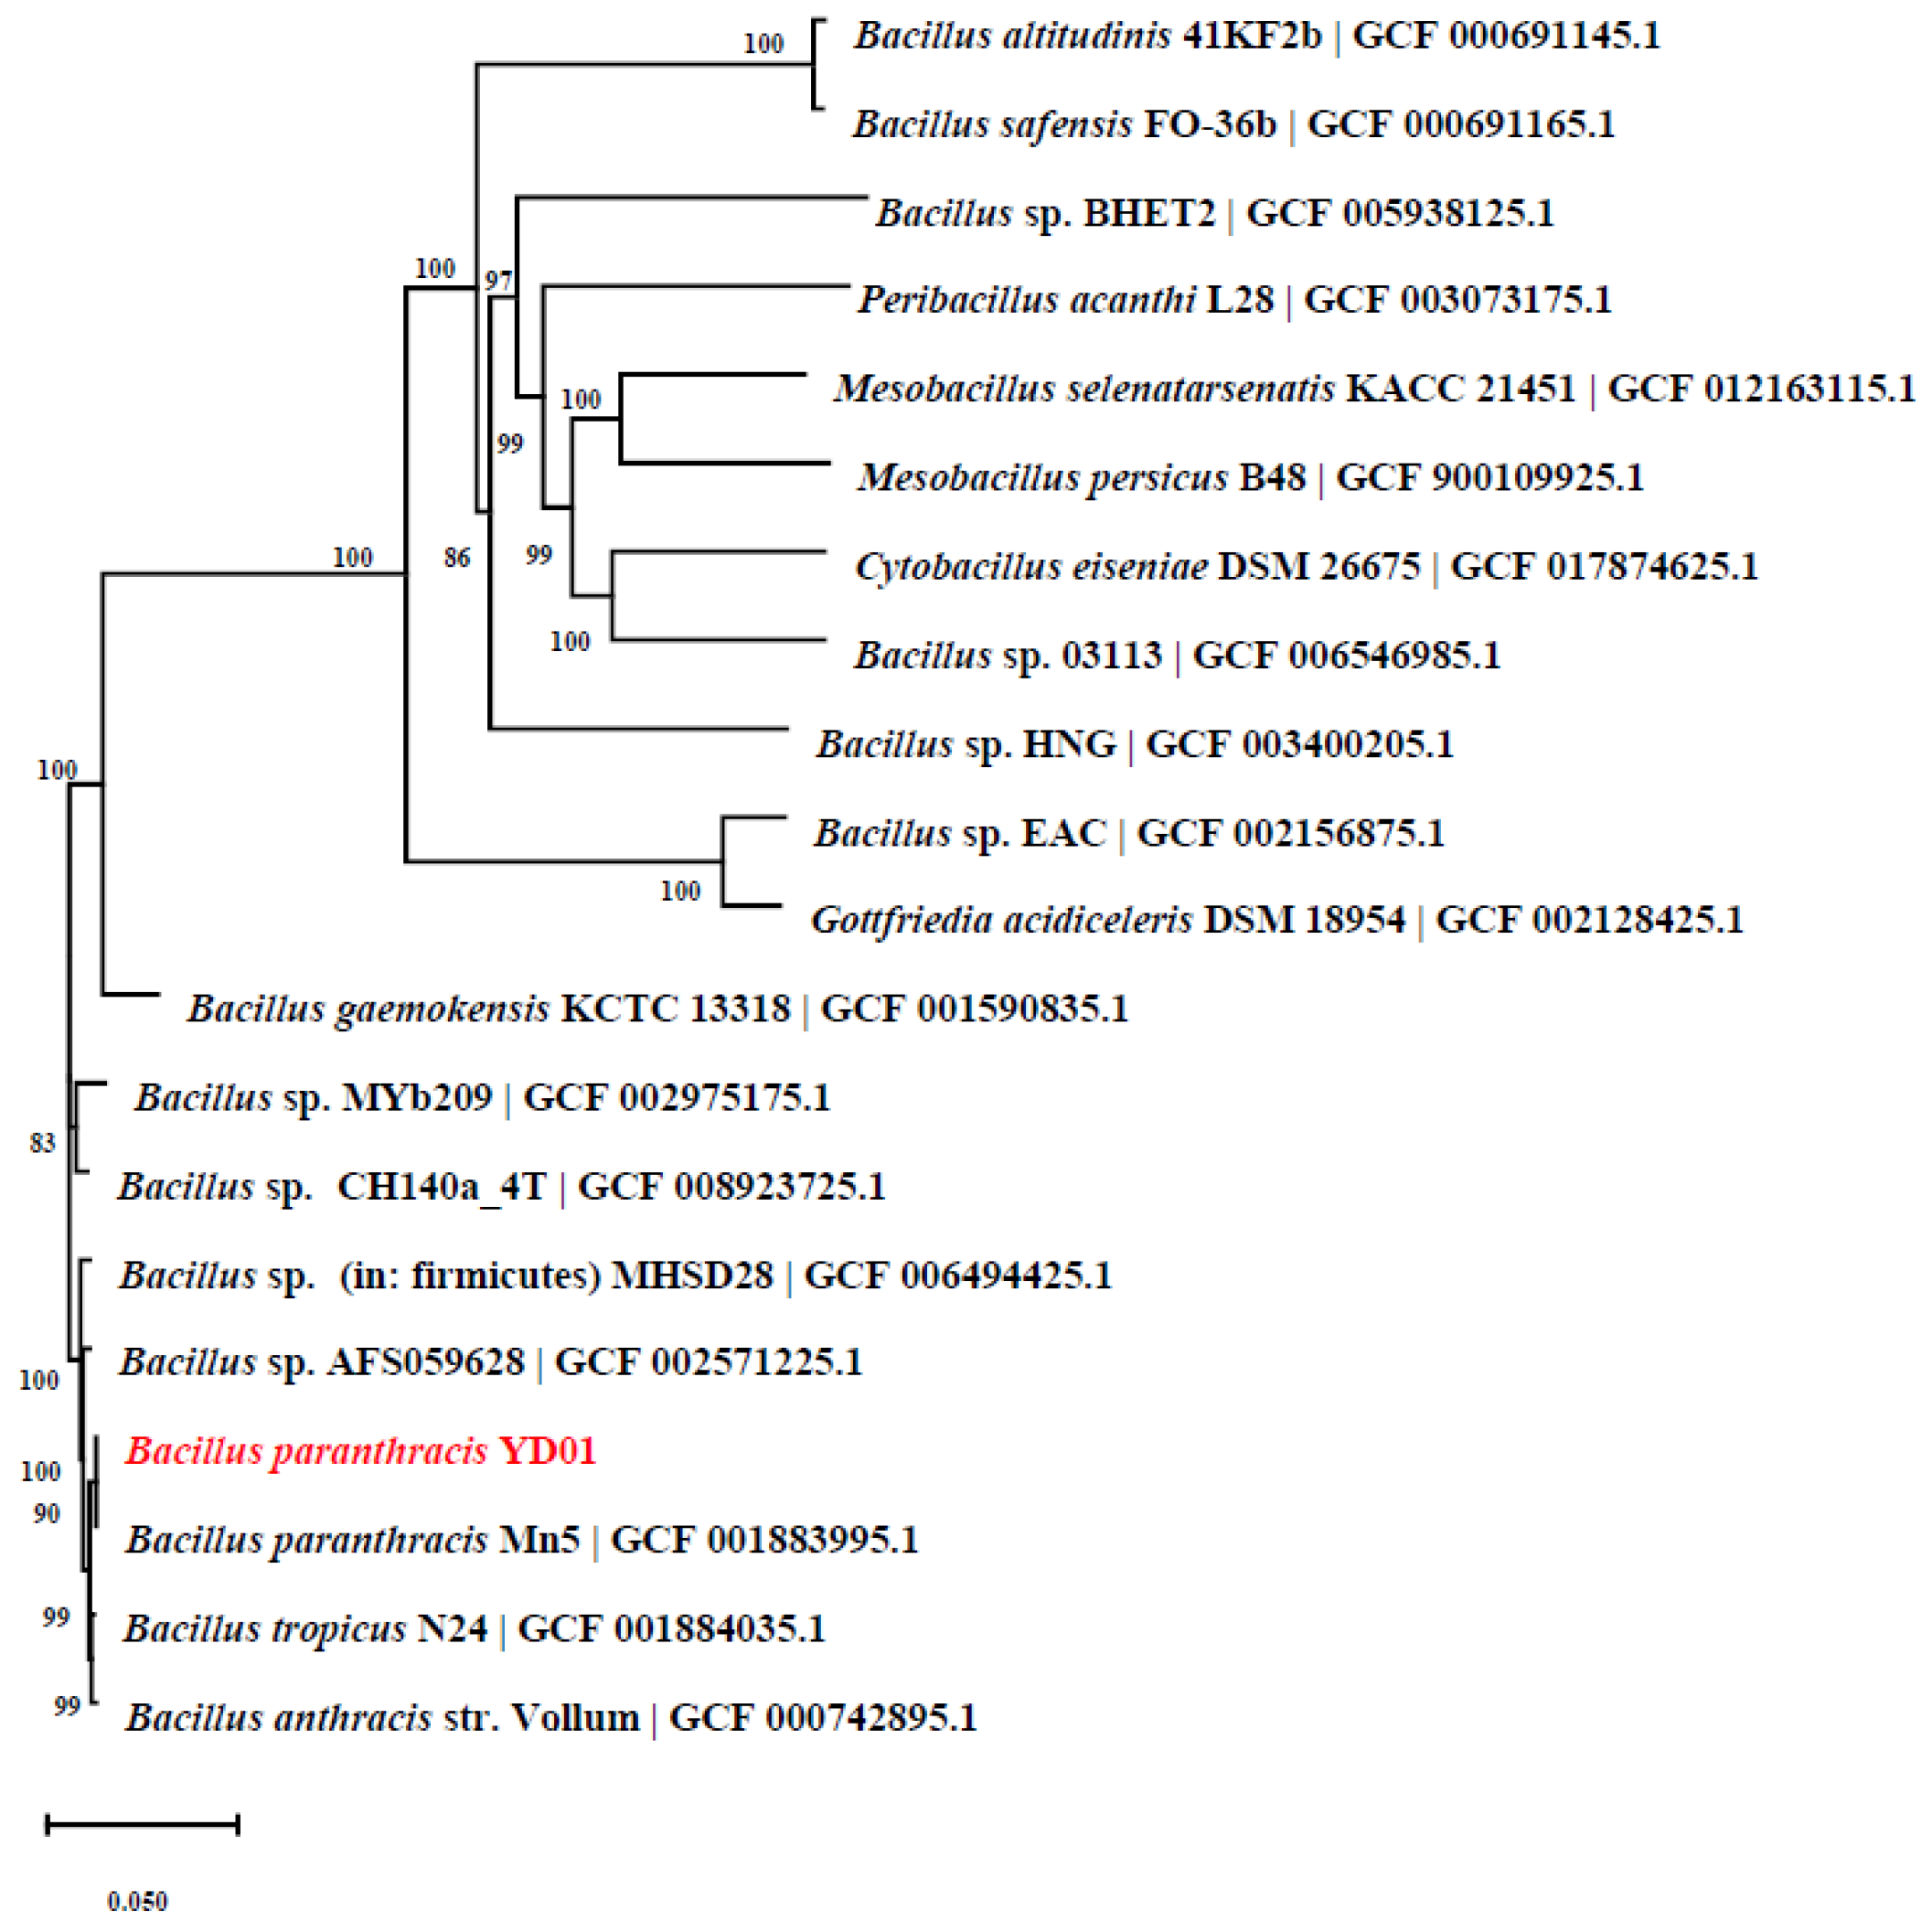
2.1. Isolation and Identification of Strain
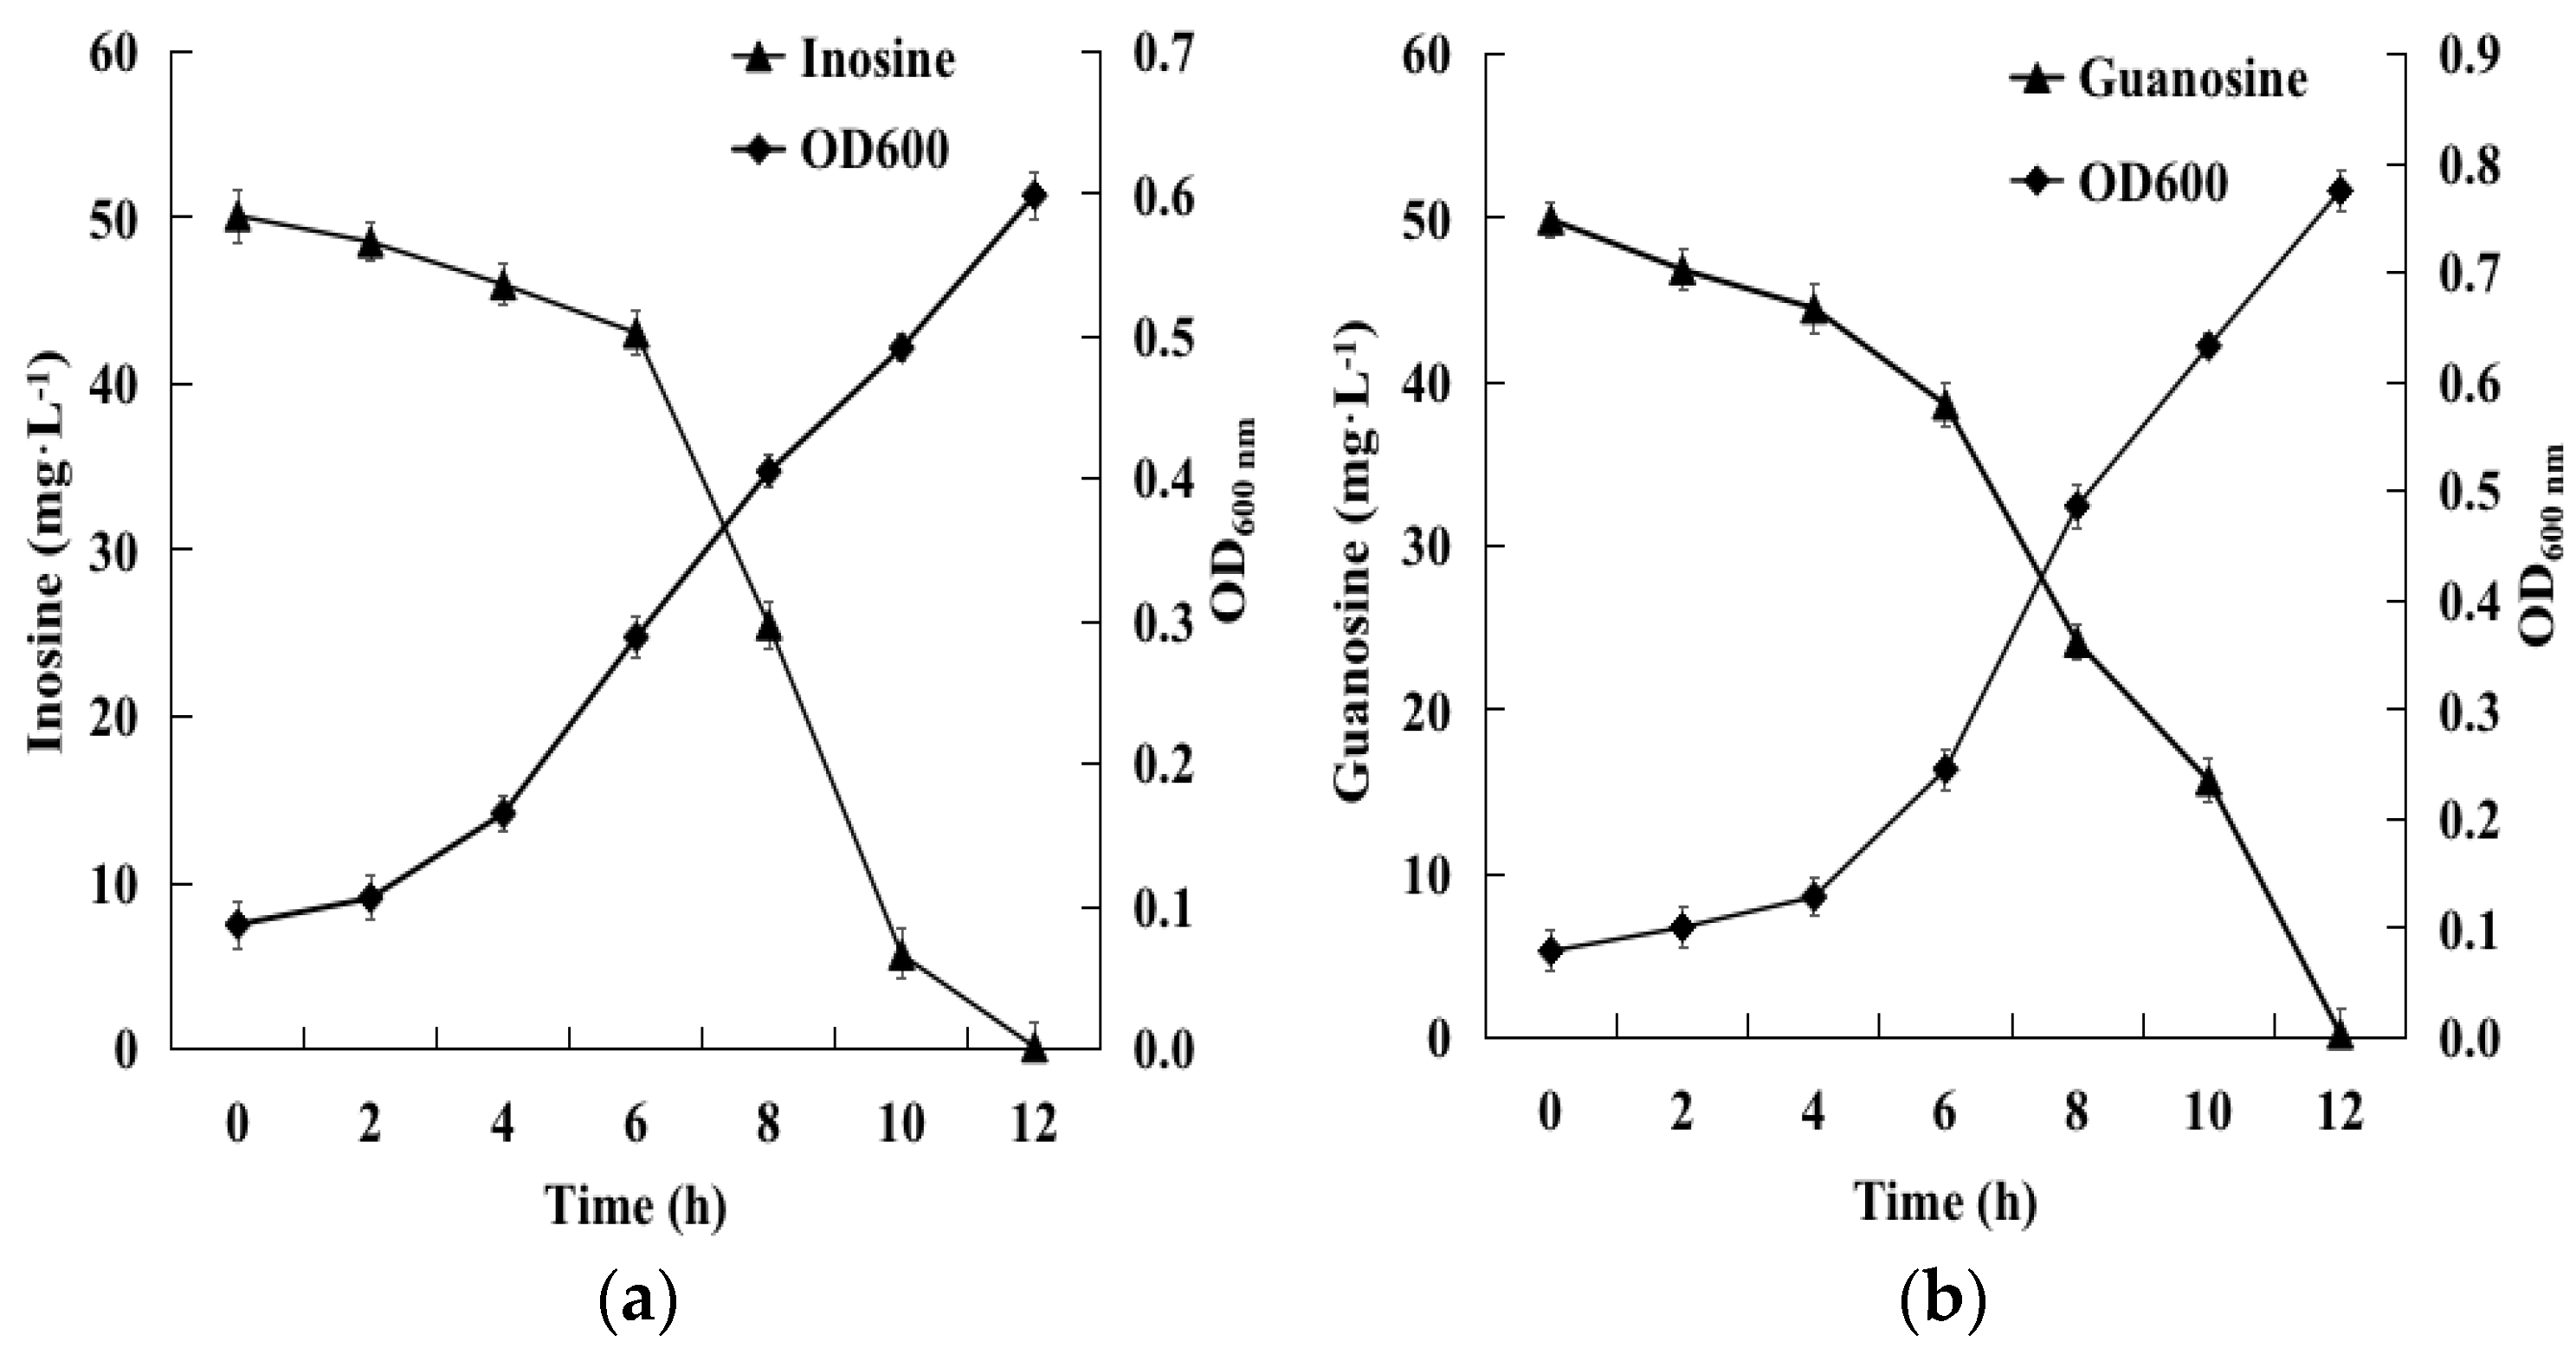
2.2. Biodegradation of Inosine and Guanosine Using B. paranthracis YD01
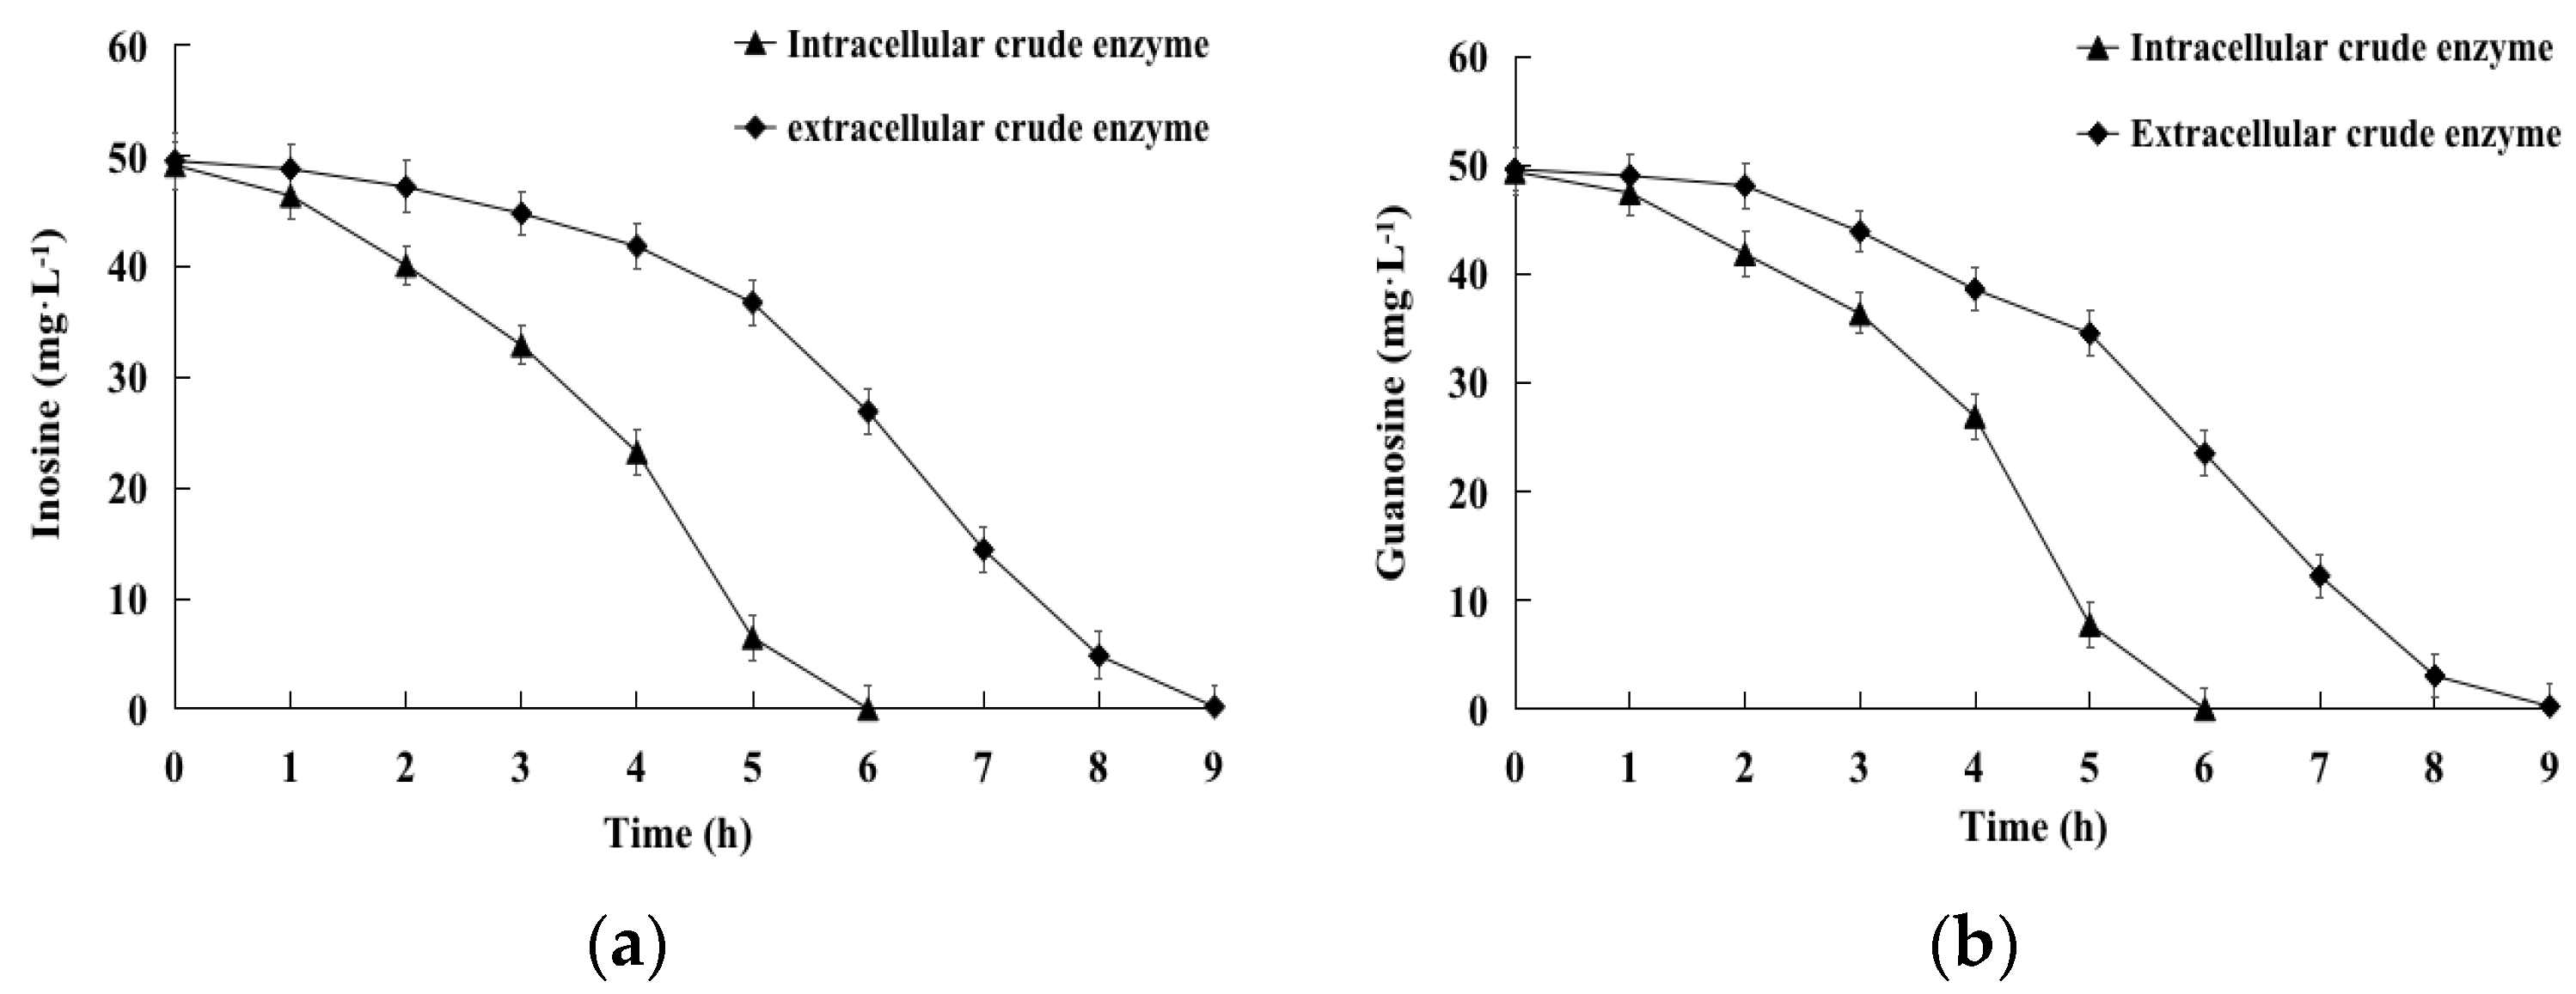
2.3. Biodegradation of Inosine and Guanosine by Intracellular and Extracellular Crude Enzymes
2.4. Genome Assembly and Prediction of YD01
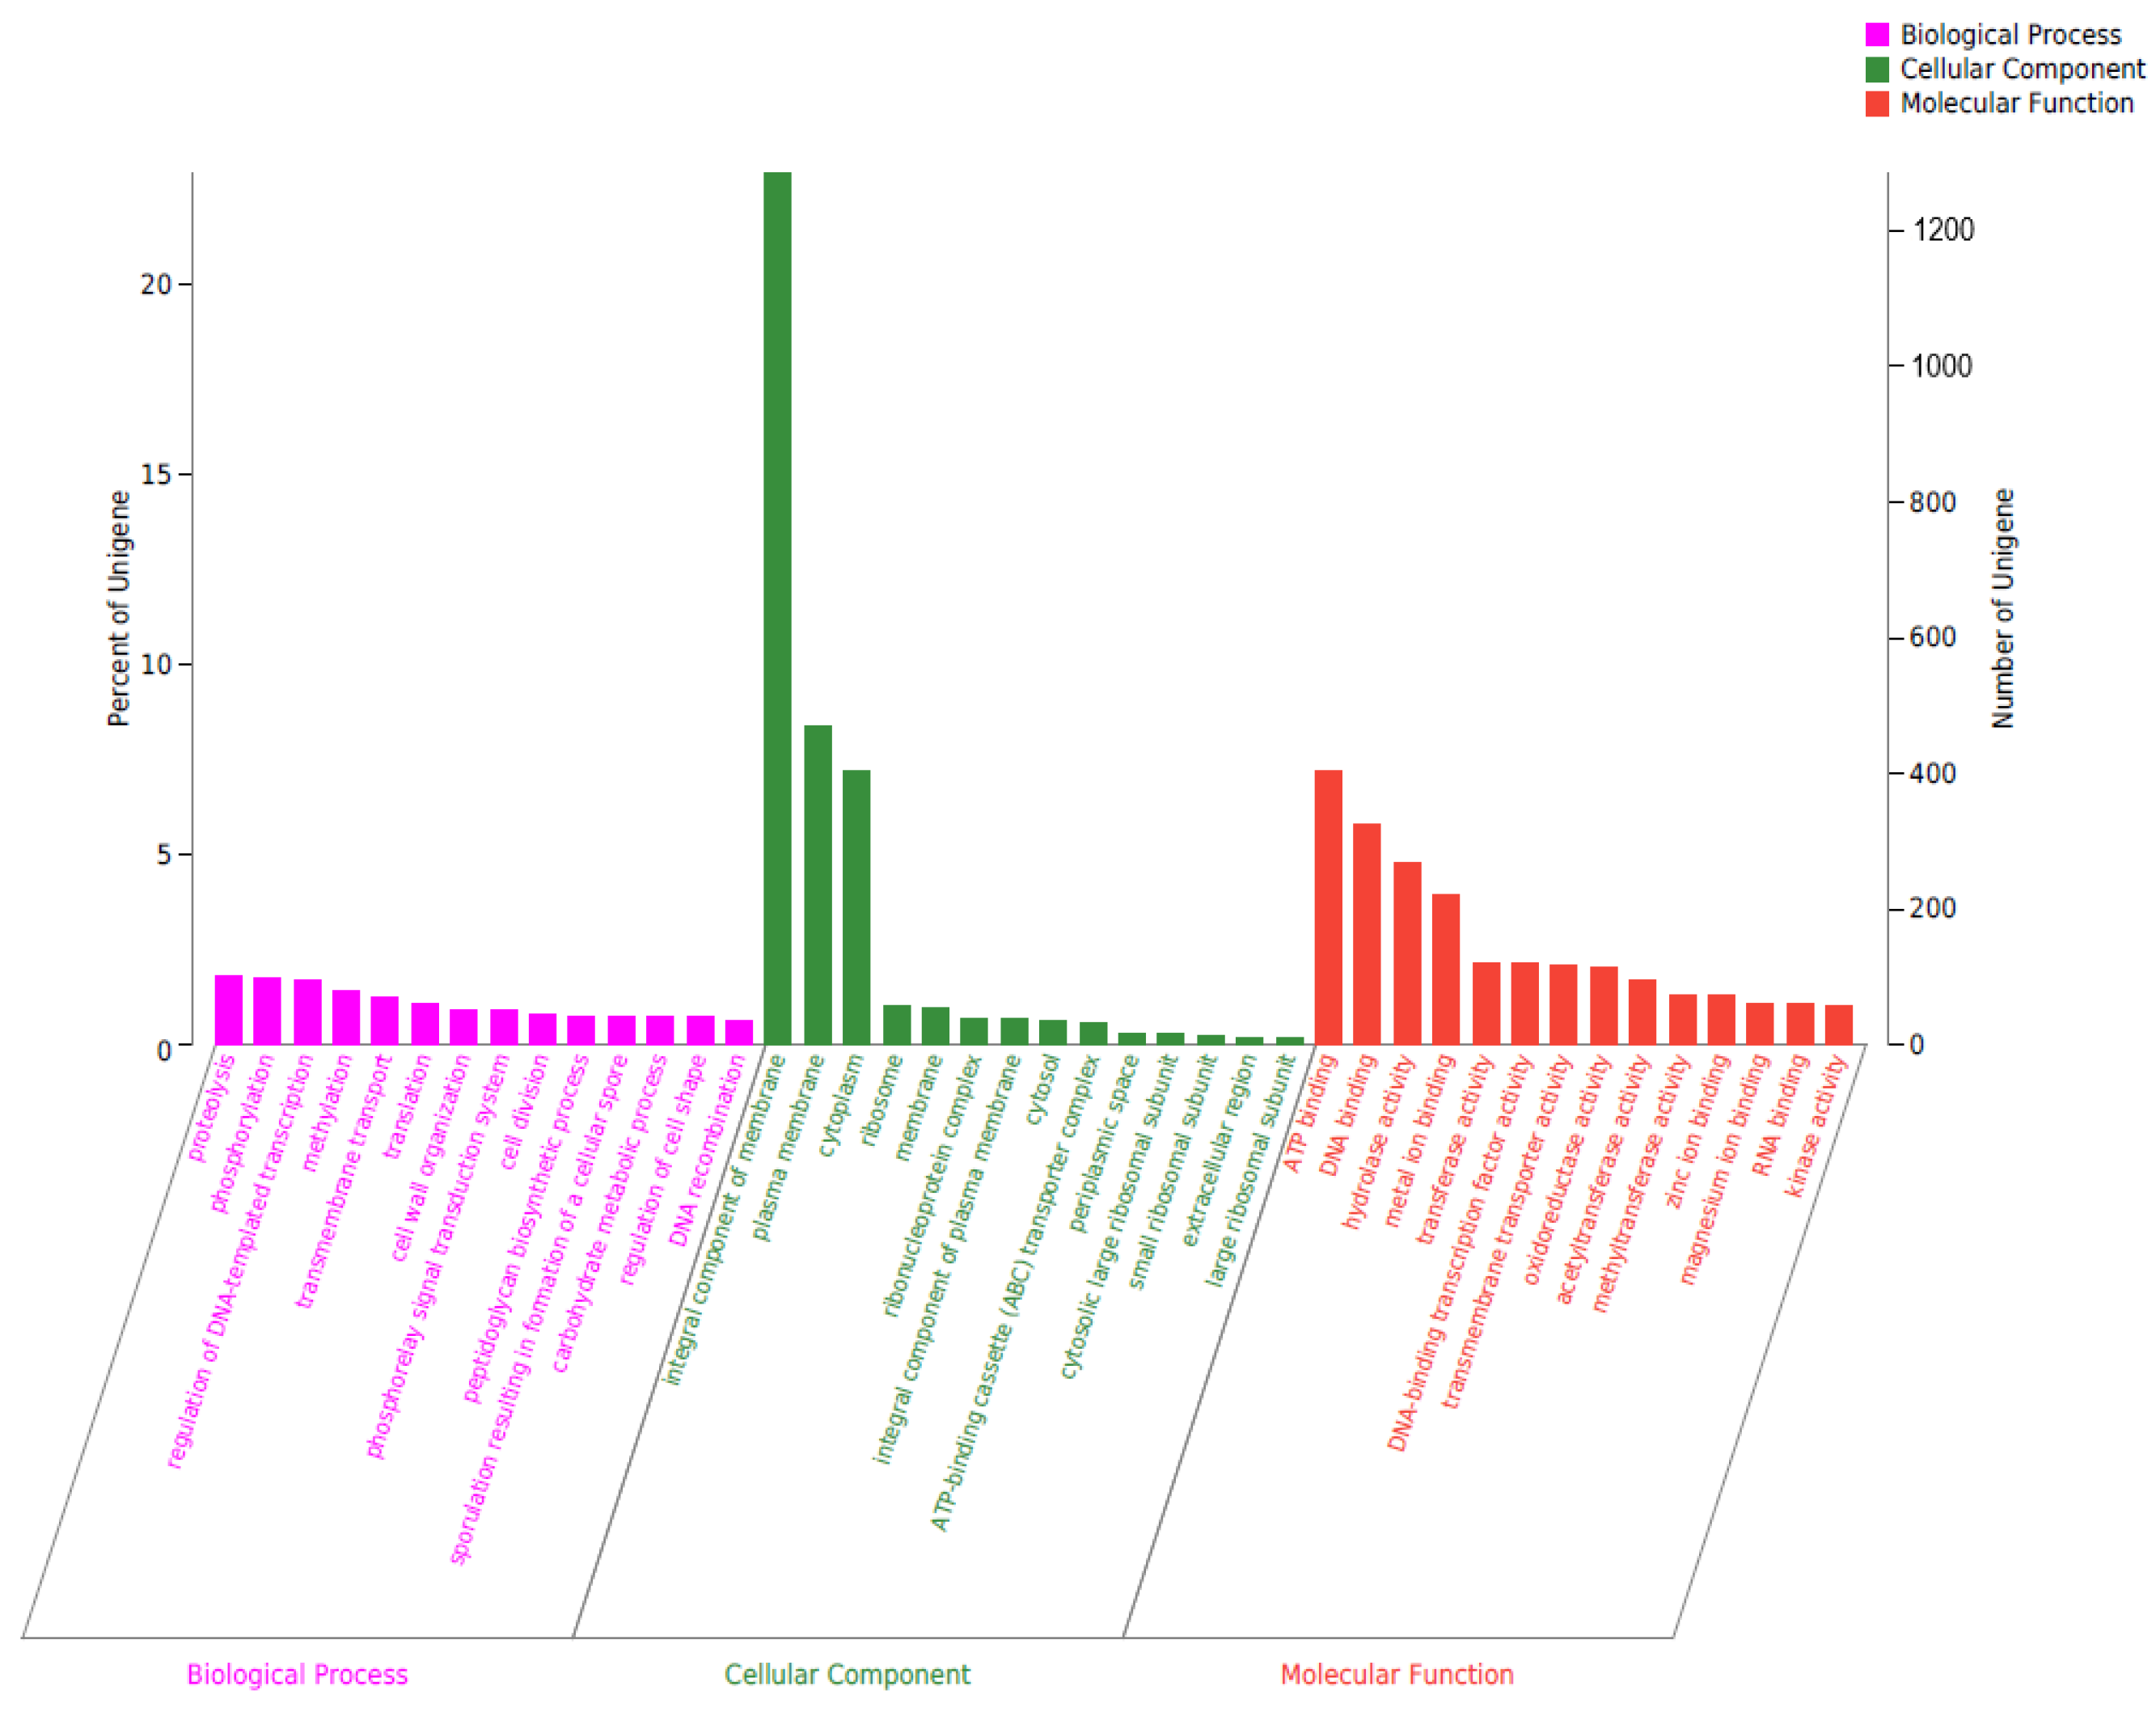
2.5. Genomic Circle Map Analysis and Gene Annotation of YD01
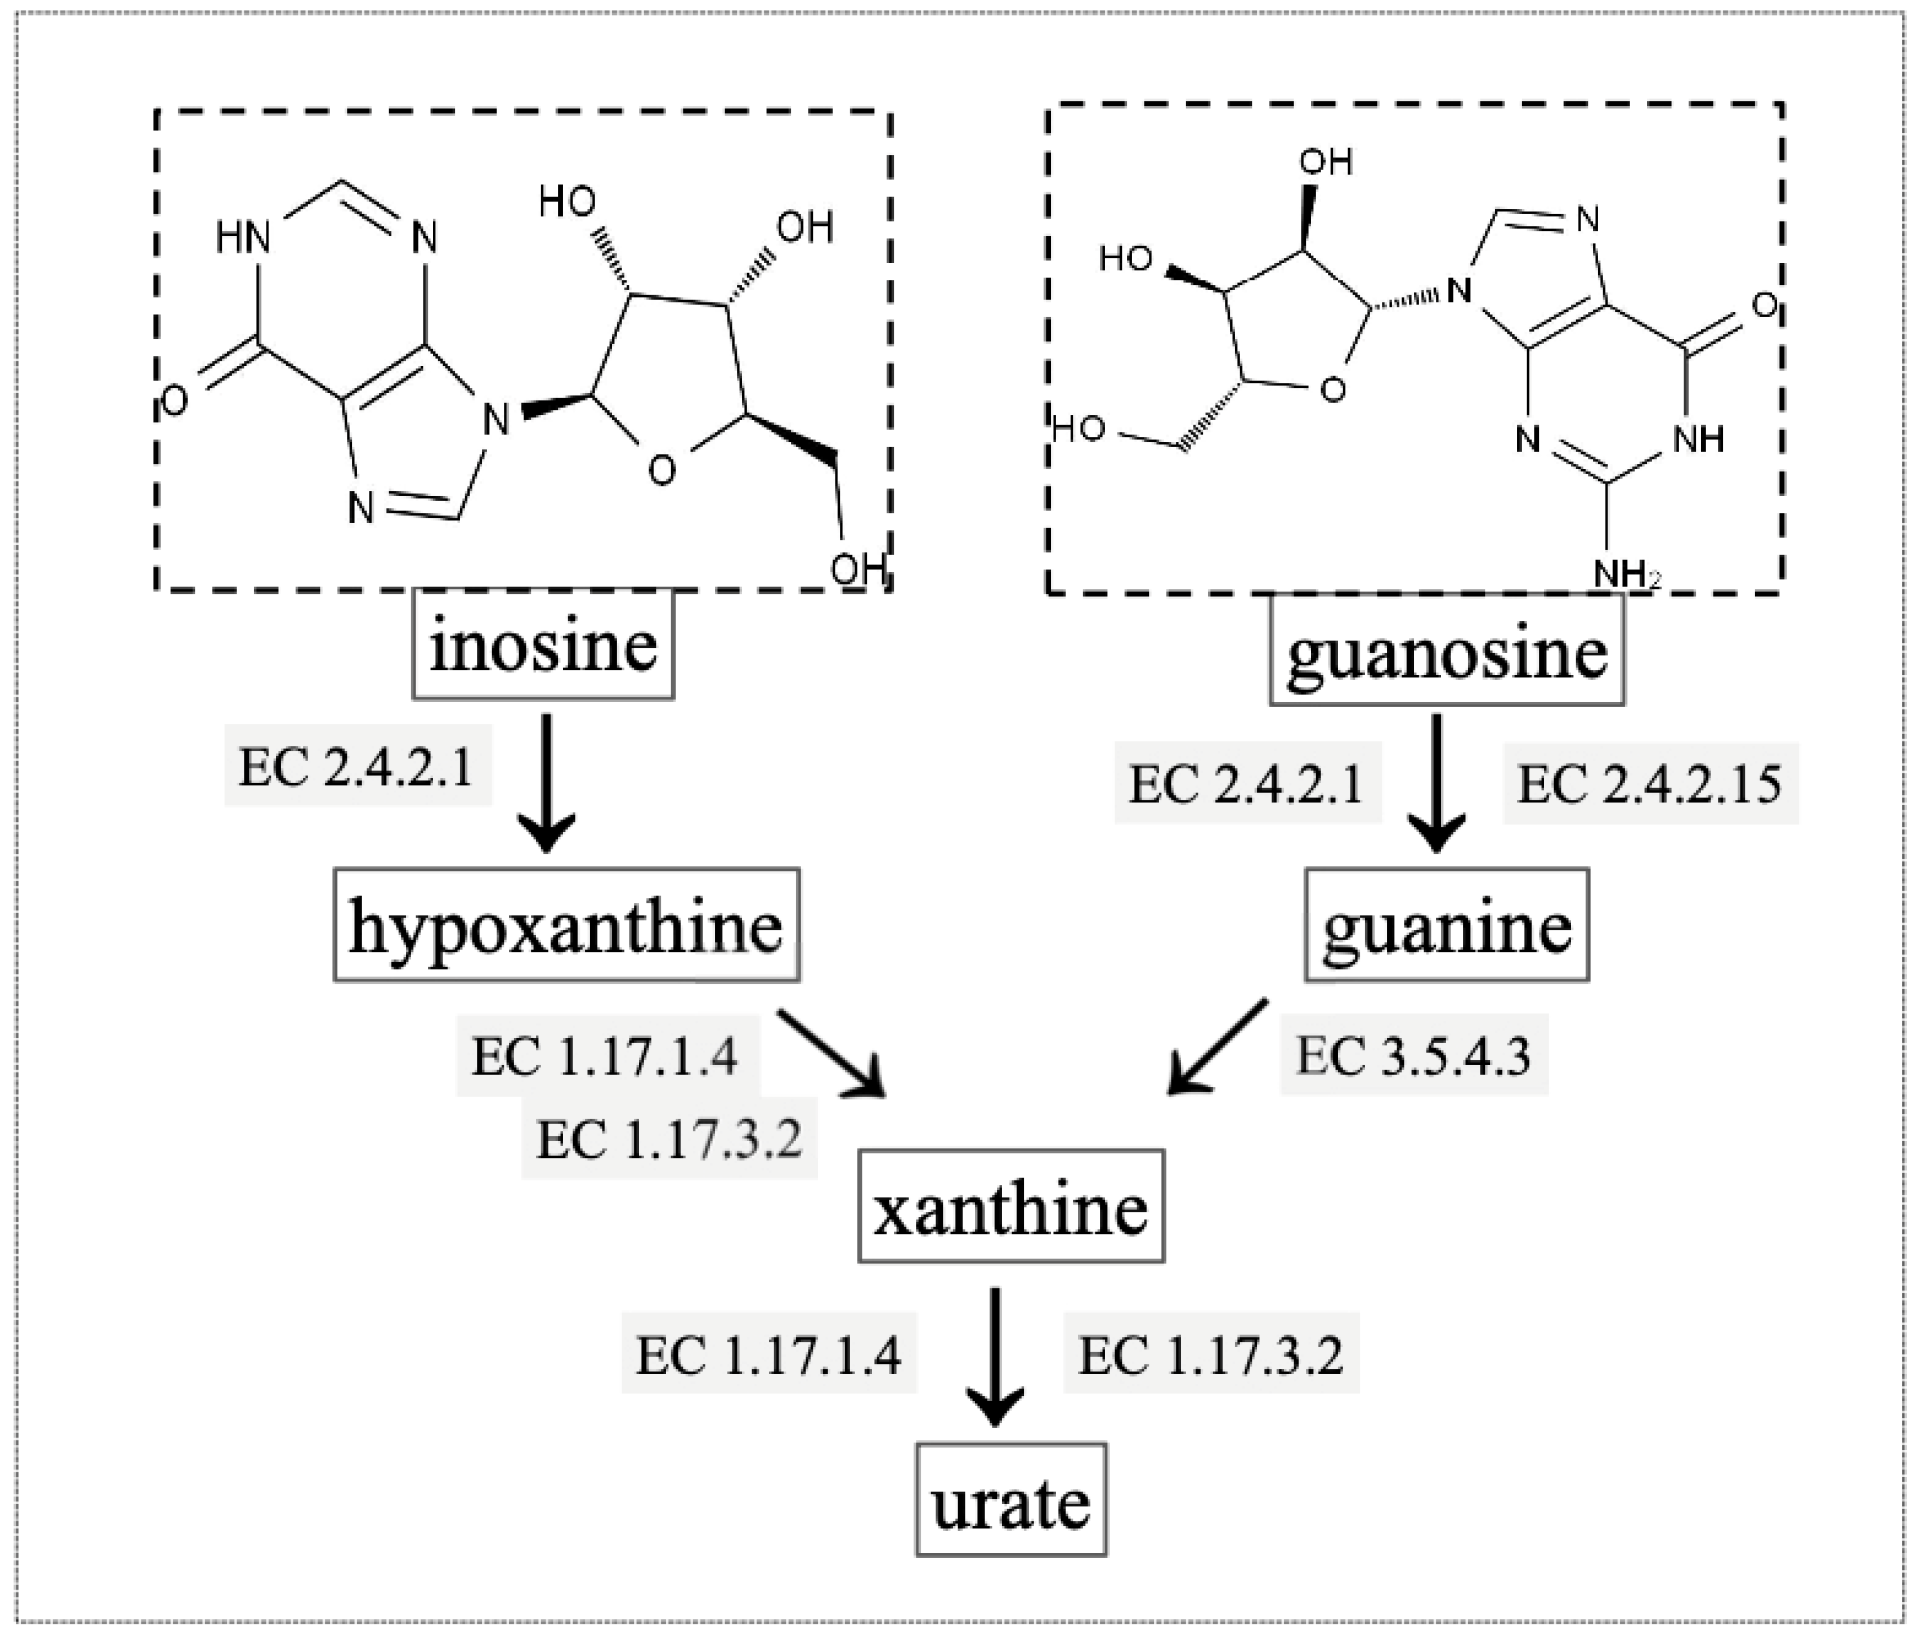
2.6. Gene Annotation of Biodegrading Enzyme of YD01
3. Materials and Methods
3.1. Materials
3.2. Culture Medium and Conditions
3.3. Isolation of Inosine and Guanosine Biodegrading Strain
3.4. Identification and Genome Sequencing of YD01
3.5. Preparation of Intracellular and Extracellular Crude Enzymes of YD01
3.6. Analysis of Inosine and Guanosine by HPLC
4. Conclusions
Author Contributions
Funding
Institutional Review Board Statement
Informed Consent Statement
Data Availability Statement
Conflicts of Interest
References
- Hong, F.; Zheng, A.; Xu, P.; Wang, J.; Xue, T.; Dai, S.; Pan, S.; Guo, Y.; Xie, X.; Li, L.; et al. High-Protein Diet Induces Hyperuricemia in a New Animal Model for Studying Human Gout. Int. J. Mol. Sci. 2020, 21, 2147. [Google Scholar] [CrossRef] [PubMed]
- Wen, S.; Wang, D.; Yu, H.; Liu, M.; Chen, Q.; Bao, R.; Liu, L.; Zhang, Y.; Wang, T. The Time-Feature of Uric Acid Excretion in Hyperuricemia Mice Induced by Potassium Oxonate and Adenine. Int. J. Mol. Sci. 2020, 21, 5178. [Google Scholar] [CrossRef] [PubMed]
- Jin, M.; Yang, F.; Yang, I.; Yin, Y.; Luo, J.J.; Wang, H.; Yang, X.F. Uric Acid, Hyperuricemia and Vascular Diseases. Front. Biosci. 2012, 17, 656–669. [Google Scholar] [CrossRef]
- Khadka, B.P.M.; Karki, L. Correlation of Uric Acid with Glomerular Filtration Rate in Chronic Kidney Disease. J. Nepal Med. Assoc. 2018, 56, 724–727. [Google Scholar] [CrossRef]
- Petreski, T.; Ekart, R.; Hojs, R.; Bevc, S. Hyperuricemia, the Heart, and the Kidneys—To Treat or Not to Treat? Ren. Fail 2020, 42, 978–986. [Google Scholar] [CrossRef] [PubMed]
- Yanai, H.; Adachi, H.; Hakoshima, M.; Katsuyama, H. Molecular Biological and Clinical Understanding of the Pathophysiology and Treatments of Hyperuricemia and Its Association with Metabolic Syndrome, Cardiovascular Diseases and Chronic Kidney Disease. Int. J. Mol. Sci. 2021, 22, 9221. [Google Scholar] [CrossRef] [PubMed]
- Garcia-Nieto, V.M.; Claverie-Martin, F.; Moraleda-Mesa, T.; Perdomo-Ramirez, A.; Tejera-Carreno, P.; Cordoba-Lanus, E.; Luis-Yanes, M.I.; Ramos-Trujillo, E.; en representacion del Grupo, R. Gout Associated with Reduced Renal Excretion of Uric Acid. Renal Tubular Disorder That Nephrologists Do Not Treat. Nefrol. Engl. Ed. 2022, 42, 273–279. [Google Scholar] [CrossRef] [PubMed]
- Kaneko, K.; Aoyagi, Y.; Fukuuchi, T.; Inazawa, K.; Yamaoka, N. Total Purine and Purine Base Content of Common Foodstuffs for Facilitating Nutritional Therapy for Gout and Hyperuricemia. Biol. Pharm. Bull. 2014, 37, 709–721. [Google Scholar] [CrossRef]
- Saito, Y.; Tanaka, A.; Node, K.; Kobayashi, Y. Uric Acid and Cardiovascular Disease: A Clinical Review. J. Cardiol. 2021, 78, 51–57. [Google Scholar] [CrossRef]
- Gherghina, M.E.; Peride, I.; Tiglis, M.; Neagu, T.P.; Niculae, A.; Checherita, I.A. Uric Acid and Oxidative Stress-Relationship with Cardiovascular, Metabolic, and Renal Impairment. Int. J. Mol. Sci. 2022, 23, 3188. [Google Scholar] [CrossRef]
- So, A.; Thorens, B. Uric Acid Transport and Disease. J. Clin. Investig. 2010, 120, 1791–1799. [Google Scholar] [CrossRef] [PubMed]
- Mahor, D.; Priyanka, A.; Prasad, G.S.; Thakur, K.G. Functional and Structural Characterization of Purine Nucleoside Phosphorylase from Kluyveromyces lactis and Its Potential Applications in Reducing Purine Content in Food. PLoS ONE 2016, 11, e0164279. [Google Scholar] [CrossRef] [PubMed]
- Zhang, Y.; Chen, S.; Yuan, M.; Xu, Y.; Xu, H. Gout and Diet: A Comprehensive Review of Mechanisms and Management. Nutrients 2022, 14, 3525. [Google Scholar] [CrossRef] [PubMed]
- Alseth, I.; Dalhus, B.; Bjoras, M. Inosine in DNA and Rna. Curr. Opin. Genet. Dev. 2014, 26, 116–123. [Google Scholar] [CrossRef] [PubMed]
- Srinivasan, S.; Torres, A.G.; Ribas de Pouplana, L. Inosine in Biology and Disease. Genes 2021, 12, 600. [Google Scholar] [CrossRef] [PubMed]
- Bettio, L.E.; Gil-Mohapel, J.; Rodrigues, A.L. Guanosine and Its Role in Neuropathologies. Purinergic Signal 2016, 12, 411–426. [Google Scholar] [CrossRef] [PubMed]
- De Almeida, R.F.; Pocharski, C.B.; Rodrigues, A.L.S.; Elisabetsky, E.; Souza, D.O. Guanosine Fast Onset Antidepressant-Like Effects in the Olfactory Bulbectomy Mice Model. Sci. Rep. 2020, 10, 8429. [Google Scholar] [CrossRef] [PubMed]
- Maiuolo, J.; Oppedisano, F.; Gratteri, S.; Muscoli, C.; Mollace, V. Regulation of Uric Acid Metabolism and Excretion. Int. J. Cardiol. 2016, 213, 8–14. [Google Scholar] [CrossRef]
- Su, H.Y.; Yang, C.; Liang, D.; Liu, H.F. Research Advances in the Mechanisms of Hyperuricemia-Induced Renal Injury. Biomed. Res. Int. 2020, 2020, 5817348. [Google Scholar] [CrossRef]
- Amorini, A.M.; Petzold, A.; Tavazzi, B.; Eikelenboom, J.; Keir, G.; Belli, A.; Giovannoni, G.; Di Pietro, V.; Polman, C.; D’Urso, S.; et al. Increase of Uric Acid and Purine Compounds in Biological Fluids of Multiple Sclerosis Patients. Clin. Biochem. 2009, 42, 1001–1006. [Google Scholar] [CrossRef]
- Cicero, A.F.G.; Fogacci, F.; Di Micoli, V.; Angeloni, C.; Giovannini, M.; Borghi, C. Purine Metabolism Dysfunctions: Experimental Methods of Detection and Diagnostic Potential. Int. J. Mol. Sci. 2023, 24, 7027. [Google Scholar] [CrossRef] [PubMed]
- Alvarez-Lario, B.; Alonso-Valdivielso, J.L. Hyperuricemia and Gout; the Role of Diet. Nutr. Hosp. 2014, 29, 760–770. [Google Scholar] [PubMed]
- Li, Q.; Li, X.; Wang, J.; Liu, H.; Kwong, J.S.W.; Chen, H.; Li, S. Diagnosis and Treatment for Hyperuricemia and Gout: A Systematic Review of Clinical Practice Guidelines and Consensus Statements. BMJ Open 2019, 9, e026677. [Google Scholar] [CrossRef] [PubMed]
- Danve, A.; Sehra, S.T.; Neogi, T. Role of Diet in Hyperuricemia and Gout. Best Pract. Res. Clin. Rheumatol. 2021, 35, 101723. [Google Scholar] [CrossRef] [PubMed]
- Uetake, D.; Ohno, I.; Ichida, K.; Yamaguchi, Y.; Saikawa, H.; Endou, H.; Hosoya, T. Effect of Fenofibrate on Uric Acid Metabolism and Urate Transporter 1. Intern. Med. 2010, 49, 89–94. [Google Scholar] [CrossRef] [PubMed]
- Higgins, P.; Dawson, J.; Lees, K.R.; McArthur, K.; Quinn, T.J.; Walters, M.R. Xanthine Oxidase Inhibition for the Treatment of Cardiovascular Disease: A Systematic Review and Meta-Analysis. Cardiovasc. Ther. 2012, 30, 217–226. [Google Scholar] [CrossRef]
- Mauer, M.; Doria, A. Uric Acid and Diabetic Nephropathy Risk. Contrib. Nephrol. 2018, 192, 103–109. [Google Scholar] [PubMed]
- Huang, W.; Jiao, S.; Chen, S.; Chen, Y.; Yang, Z.; Wang, W.; Cao, Z.; Li, Z.; Zhang, L. Design, Synthesis, and Biological Studies of Dual Urat1 Inhibitor and Fxr Agonist Based on Benzbromarone. Bioorg. Med. Chem. 2022, 75, 117073. [Google Scholar] [CrossRef]
- Linker, R.A.; Li, M.; Yang, D.; Mei, L.; Yuan, L.; Xie, A.; Yuan, J. Screening and Characterization of Purine Nucleoside Degrading Lactic Acid Bacteria Isolated from Chinese Sauerkraut and Evaluation of the Serum Uric Acid Lowering Effect in Hyperuricemic Rats. PLoS ONE 2014, 9, e105577. [Google Scholar]
- Wu, Y.; Ye, Z.; Feng, P.; Li, R.; Chen, X.; Tian, X.; Han, R.; Kakade, A.; Liu, P.; Li, X. Limosilactobacillus fermentum Jl-3 Isolated from “Jiangshui” Ameliorates Hyperuricemia by Degrading Uric Acid. Gut Microbes 2021, 13, 1–18. [Google Scholar] [CrossRef]
- Li, Y.; Zhu, J.; Lin, G.; Gao, K.; Yu, Y.; Chen, S.; Chen, L.; Chen, Z.; Li, L. Probiotic Effects of Lacticaseibacillus rhamnosus 1155 and Limosilactobacillus fermentum 2644 on Hyperuricemic Rats. Front. Nutr. 2022, 9, 993951. [Google Scholar] [CrossRef] [PubMed]
- Garcia-Arroyo, F.E.; Gonzaga, G.; Munoz-Jimenez, I.; Blas-Marron, M.G.; Silverio, O.; Tapia, E.; Soto, V.; Ranganathan, N.; Ranganathan, P.; Vyas, U.; et al. Probiotic Supplements Prevented Oxonic Acid-Induced Hyperuricemia and Renal Damage. PLoS ONE 2018, 13, e0202901. [Google Scholar] [CrossRef] [PubMed]
- Gao, L.; Wang, B.; Pan, Y.; Lu, Y.; Cheng, R. Cardiovascular Safety of Febuxostat Compared to Allopurinol for the Treatment of Gout: A Systematic and Meta-Analysis. Clin. Cardiol. 2021, 44, 907–916. [Google Scholar] [CrossRef] [PubMed]
- Cao, J.; Liu, Q.; Hao, H.; Bu, Y.; Tian, X.; Wang, T.; Yi, H. Lactobacillus paracasei X11 Ameliorates Hyperuricemia and Modulates Gut Microbiota in Mice. Front. Immunol. 2022, 13, 940228. [Google Scholar] [CrossRef] [PubMed]
- Zhao, H.; Lu, Z.; Lu, Y. The Potential of Probiotics in the Amelioration of Hyperuricemia. Food Funct. 2022, 13, 2394–2414. [Google Scholar] [CrossRef]
- Yamanaka, H.; Taniguchi, A.; Tsuboi, H.; Kano, H.; Asami, Y. Hypouricaemic Effects of Yoghurt Containing Lactobacillus gasseri PA-3 in Patients with Hyperuricaemia and/or Gout: A Randomised, Double-Blind, Placebo-Controlled Study. Mod. Rheumatol. 2019, 29, 146–150. [Google Scholar] [CrossRef]
- Wang, H.; Mei, L.; Deng, Y.; Liu, Y.; Wei, X.; Liu, M.; Zhou, J.; Ma, H.; Zheng, P.; Yuan, J.; et al. Lactobacillus brevis DM9218 Ameliorates Fructose-Induced Hyperuricemia through Inosine Degradation and Manipulation of Intestinal Dysbiosis. Nutrition 2019, 62, 63–73. [Google Scholar] [CrossRef]
- Kuo, Y.W.; Hsieh, S.H.; Chen, J.F.; Liu, C.R.; Chen, C.W.; Huang, Y.F.; Ho, H.H. Lactobacillus reuteri TSR332 and Lactobacillus fermentum TSF331 Stabilize Serum Uric Acid Levels and Prevent Hyperuricemia in Rats. PeerJ 2021, 9, e11209. [Google Scholar] [CrossRef]
- Bettisworth, B.; Stamatakis, A. Root Digger: A Root Placement Program for Phylogenetic Trees. BMC Bioinform. 2021, 22, 225. [Google Scholar] [CrossRef]
- Daisuke Fukuda, C.N.-H. Draft Genome Sequence of Bacillus paranthracis Strain DB-4, Isolated from Nukadoko, Fermented Rice Bran for Japanese Pickles. Microbiol. Resour. Announc. 2021, 10, e00705–e00721. [Google Scholar]
- Bukharin, O.V.; Perunova, N.B.; Andryuschenko, S.V.; Ivanova, E.V.; Bondarenko, T.A.; Chainikova, I.N. Genome Sequence Announcement of Bacillus paranthracis Strain ICIS-279, Isolated from Human Intestine. Microbiol. Resour. Announc. 2019, 8, e00662-19. [Google Scholar] [CrossRef]
- Diale, M.O.; Kayitesi, E.; Serepa-Dlamini, M.H. Genome in Silico and in Vitro Analysis of the Probiotic Properties of a Bacterial Endophyte, Bacillus paranthracis Strain MHSD3. Front. Genet. 2021, 12, 672149. [Google Scholar] [CrossRef]
- de Sousa, L.P. Genomic and Pathogenicity of a Bacillus paranthracis Isolated from Book Page Surface. Infect. Genet. Evol. 2021, 92, 104867. [Google Scholar] [CrossRef]
- Liu, C.; Xu, Q.; Zhao, Z.; Zhang, H.; Liu, X.; Yin, C.; Liu, Y.; Yan, H. Genomic Analysis of Sphingopyxis sp. USTB-05 for Biodegrading Cyanobacterial Hepatotoxins. Toxins 2022, 14, 333. [Google Scholar] [CrossRef]


| Attribute | Value |
|---|---|
| Total Scaf No. | 50 |
| Total Bases in Scaf (bp) | 54,88,402 |
| Largest Scaf Len (bp) | 1,583,563 |
| Total Ctg No. | 66 |
| Total Bases in Ctg (bp) | 5,488,159 |
| Largest Ctg Len (bp) | 1,299,460 |
| Attribute | Value |
|---|---|
| Gene No. | 5600 |
| Gene Total Len (bp) | 4,654,437 |
| Gene Average Len (bp) | 831.15 |
| Gene Density | 1.02 |
| Gene Len/Genome (%) | 84.80 |
| Database | Gene No. |
|---|---|
| NR | 5594 |
| Swiss-Prot | 4043 |
| Pfam | 4613 |
| COG | 4161 |
| GO | 3824 |
| KEGG | 2691 |
| Gene ID | Location | Enzyme |
|---|---|---|
| gene0825, gene1511, gene5057, gene5657, gene5546, gene5703 | Scaffold1, Scaffold1, Scaffold15, Scaffold33, Scaffold23, Scaffold47 | purine nucleosidase [EC:3.2.2.1] |
| gene1091, gene4107, gene4389 | Scaffold1, Scaffold7, Scaffold8 | 5′-nucleotidase [EC:3.1.3.5] |
| gene2567, gene5357 | Scaffold3, Scaffold19 | hypoxanthine phosphoribosyltransferase [EC:2.4.2.8] |
| gene1682 | Scaffold2 | xanthine phosphoribosyltransferase [EC:2.4.2.22] |
| gene3002 | Scaffold3 | adenine phosphoribosyltransferase [EC:2.4.2.7] |
Disclaimer/Publisher’s Note: The statements, opinions and data contained in all publications are solely those of the individual author(s) and contributor(s) and not of MDPI and/or the editor(s). MDPI and/or the editor(s) disclaim responsibility for any injury to people or property resulting from any ideas, methods, instructions or products referred to in the content. |
© 2023 by the authors. Licensee MDPI, Basel, Switzerland. This article is an open access article distributed under the terms and conditions of the Creative Commons Attribution (CC BY) license (https://creativecommons.org/licenses/by/4.0/).
Share and Cite
Du, X.; Jiang, Y.; Sun, Y.; Cao, X.; Zhang, Y.; Xu, Q.; Yan, H. Biodegradation of Inosine and Guanosine by Bacillus paranthracis YD01. Int. J. Mol. Sci. 2023, 24, 14462. https://doi.org/10.3390/ijms241914462
Du X, Jiang Y, Sun Y, Cao X, Zhang Y, Xu Q, Yan H. Biodegradation of Inosine and Guanosine by Bacillus paranthracis YD01. International Journal of Molecular Sciences. 2023; 24(19):14462. https://doi.org/10.3390/ijms241914462
Chicago/Turabian StyleDu, Xinyue, Yao Jiang, Yawen Sun, Xiaoyu Cao, Yu Zhang, Qianqian Xu, and Hai Yan. 2023. "Biodegradation of Inosine and Guanosine by Bacillus paranthracis YD01" International Journal of Molecular Sciences 24, no. 19: 14462. https://doi.org/10.3390/ijms241914462
APA StyleDu, X., Jiang, Y., Sun, Y., Cao, X., Zhang, Y., Xu, Q., & Yan, H. (2023). Biodegradation of Inosine and Guanosine by Bacillus paranthracis YD01. International Journal of Molecular Sciences, 24(19), 14462. https://doi.org/10.3390/ijms241914462