
High Prolactin Concentration Induces Ovarian Granulosa Cell Oxidative Stress, Leading to Apoptosis Mediated by L-PRLR and S-PRLR

Abstract
1. Introduction
2. Results
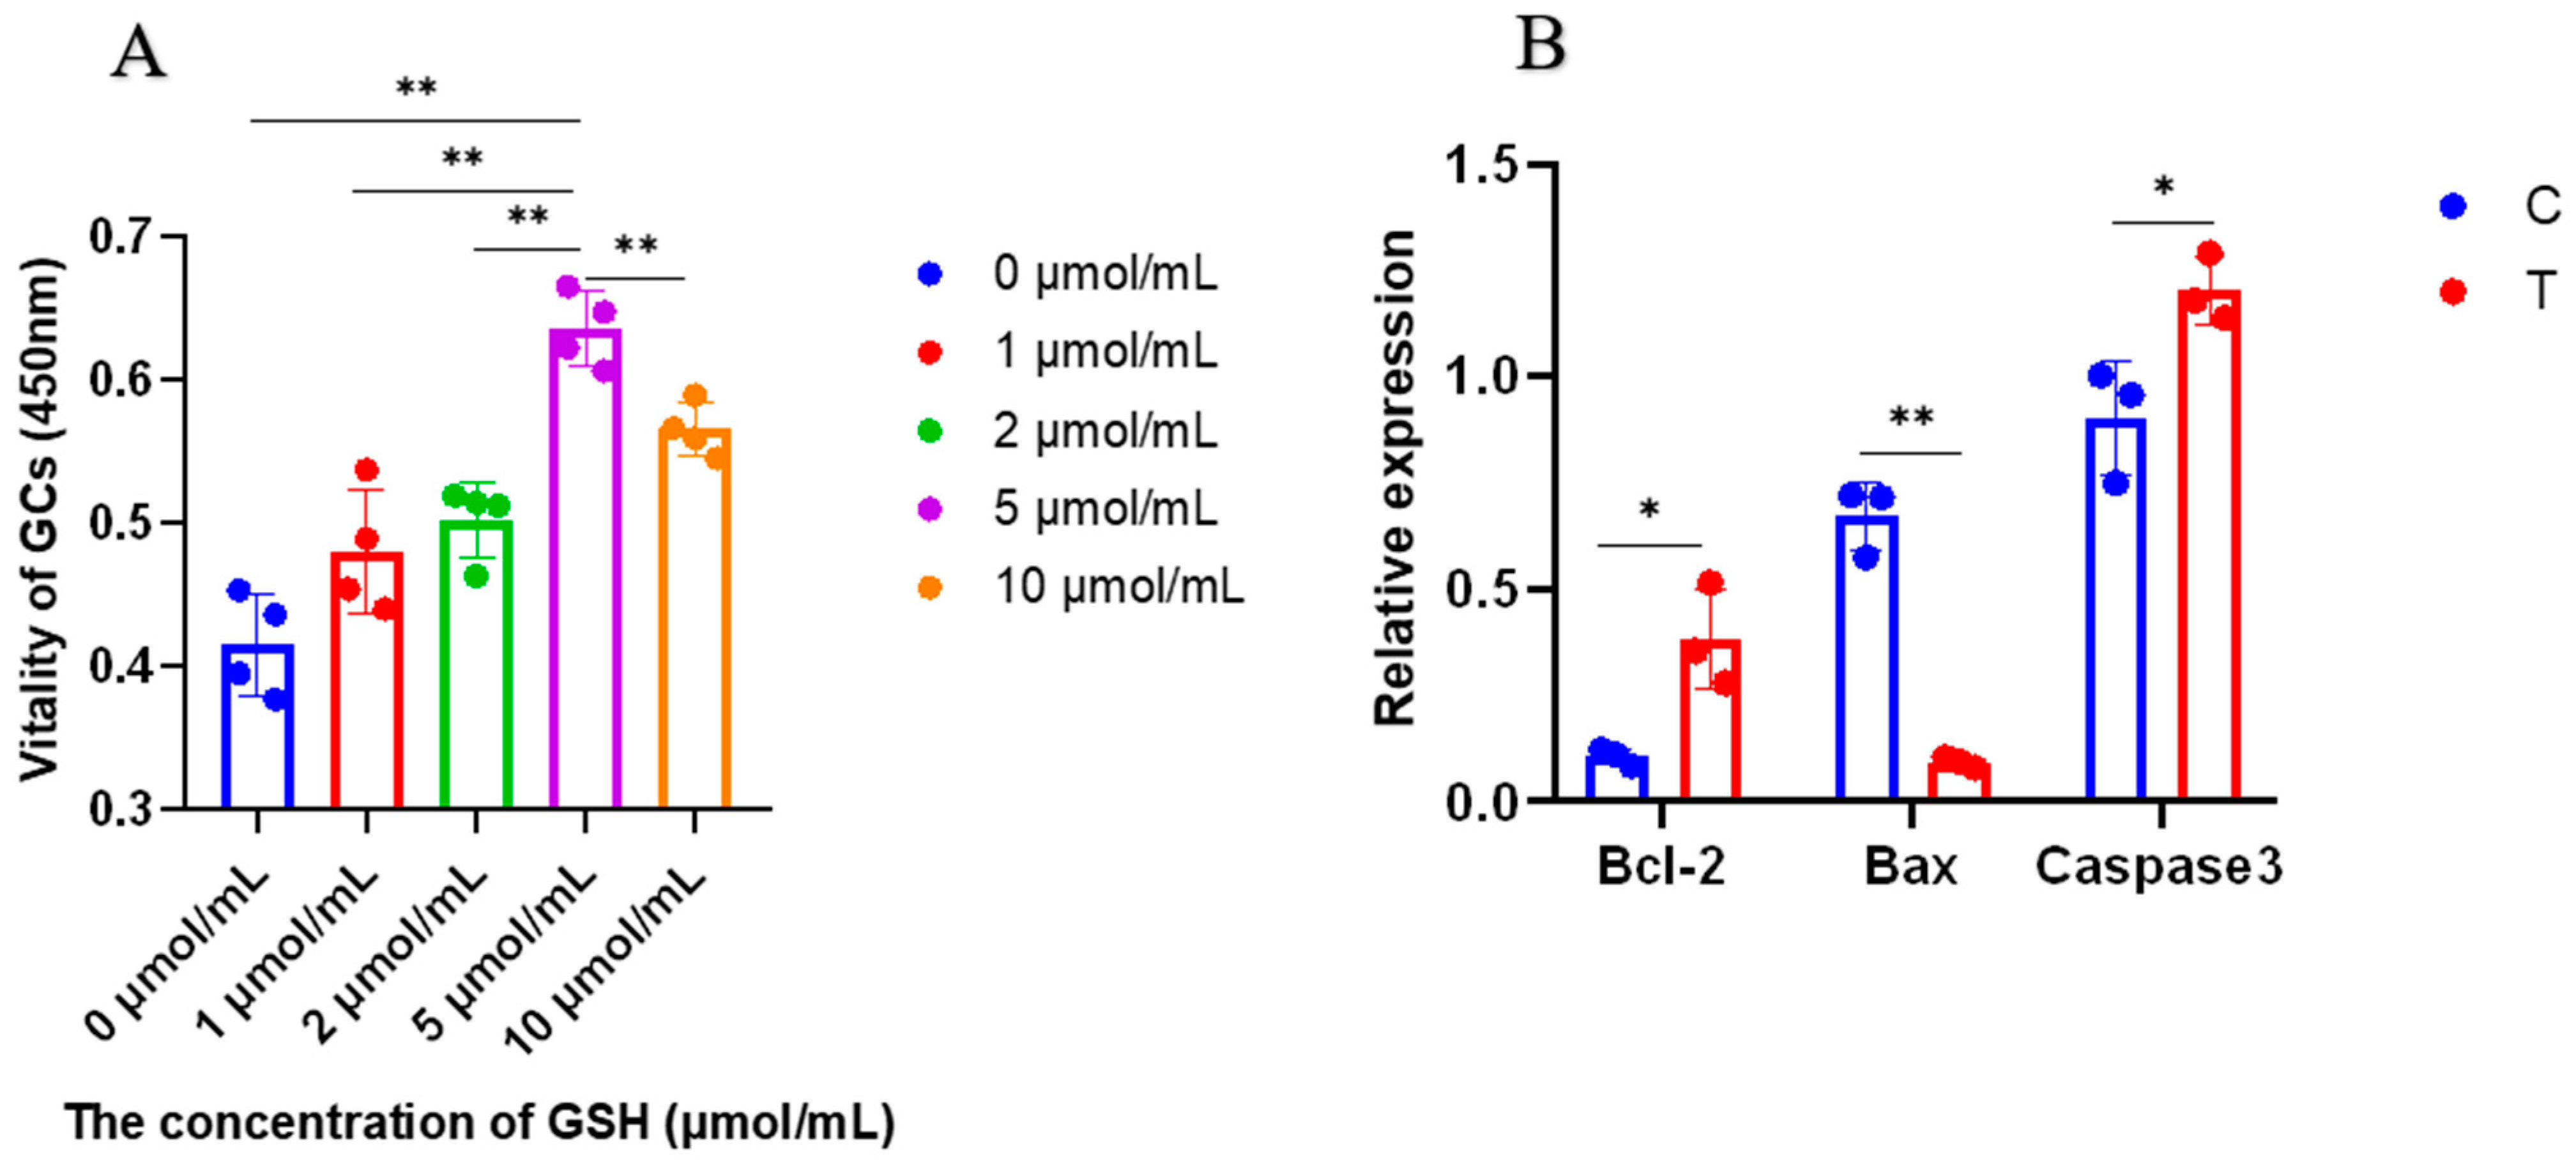
2.1. Cell Proliferation and Expression of Apoptosis-Related Genes
2.2. Identification of Knockdown and Overexpression of L-PRLR and S-PRLR
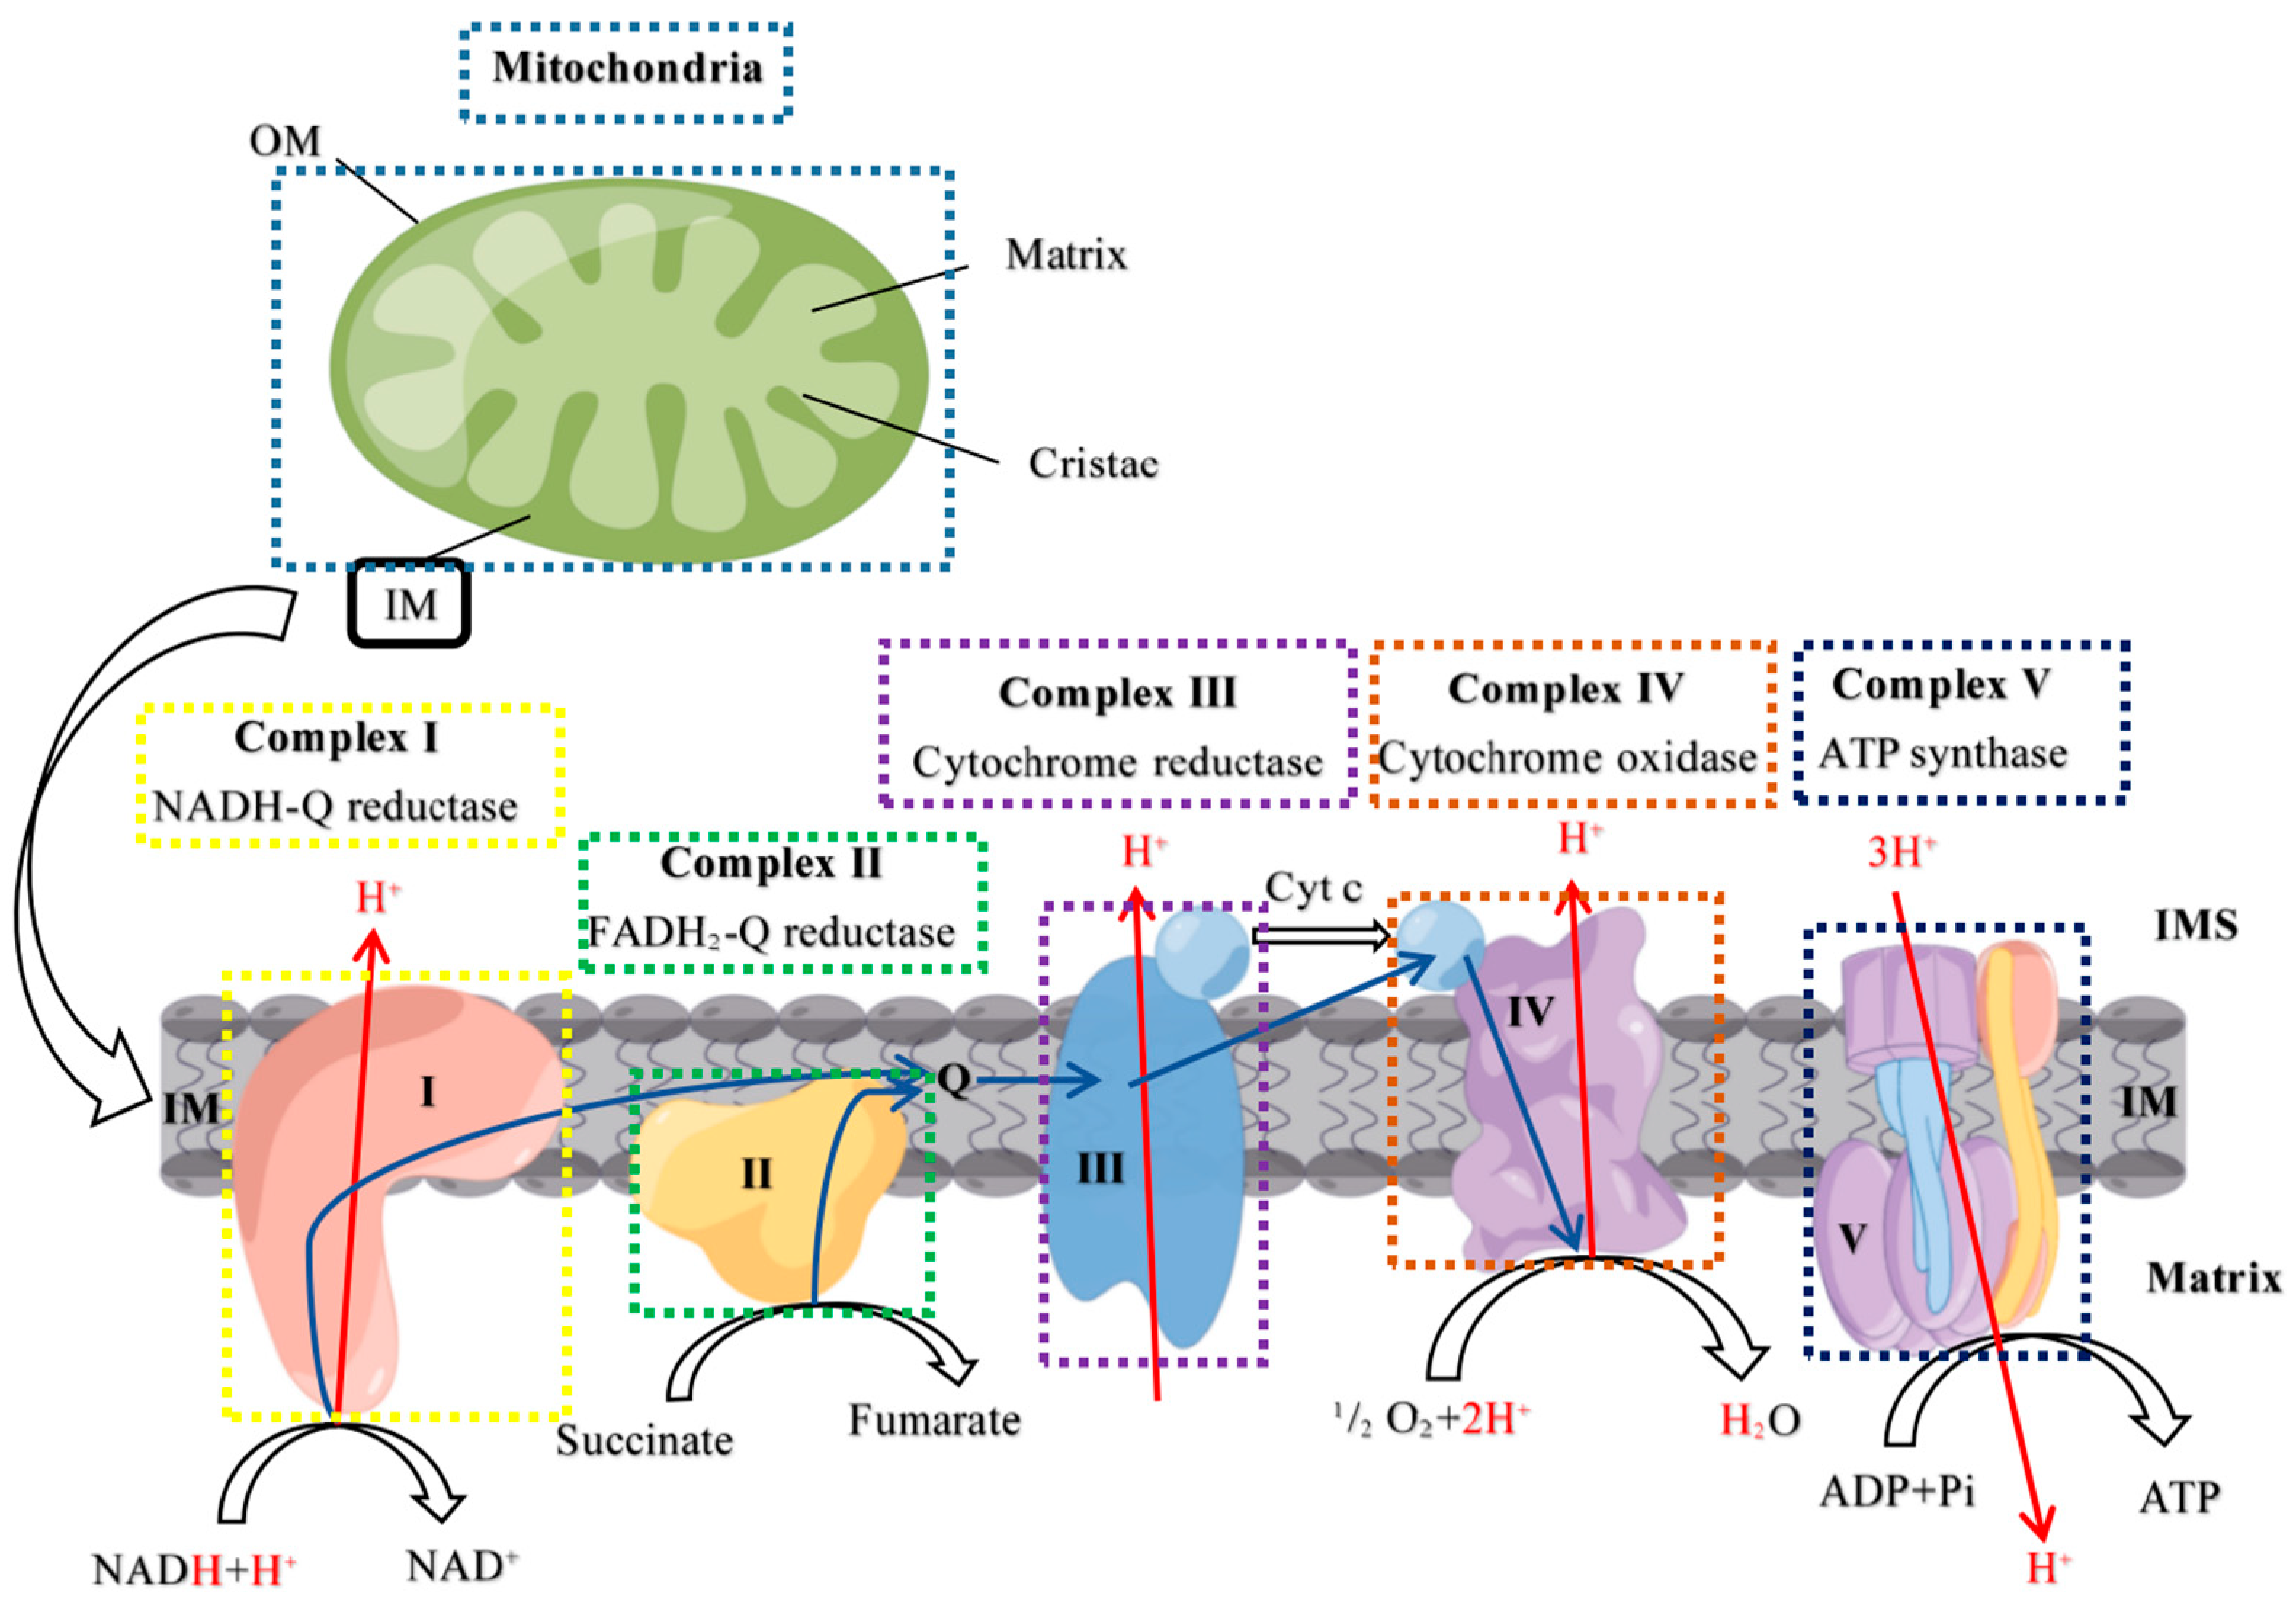
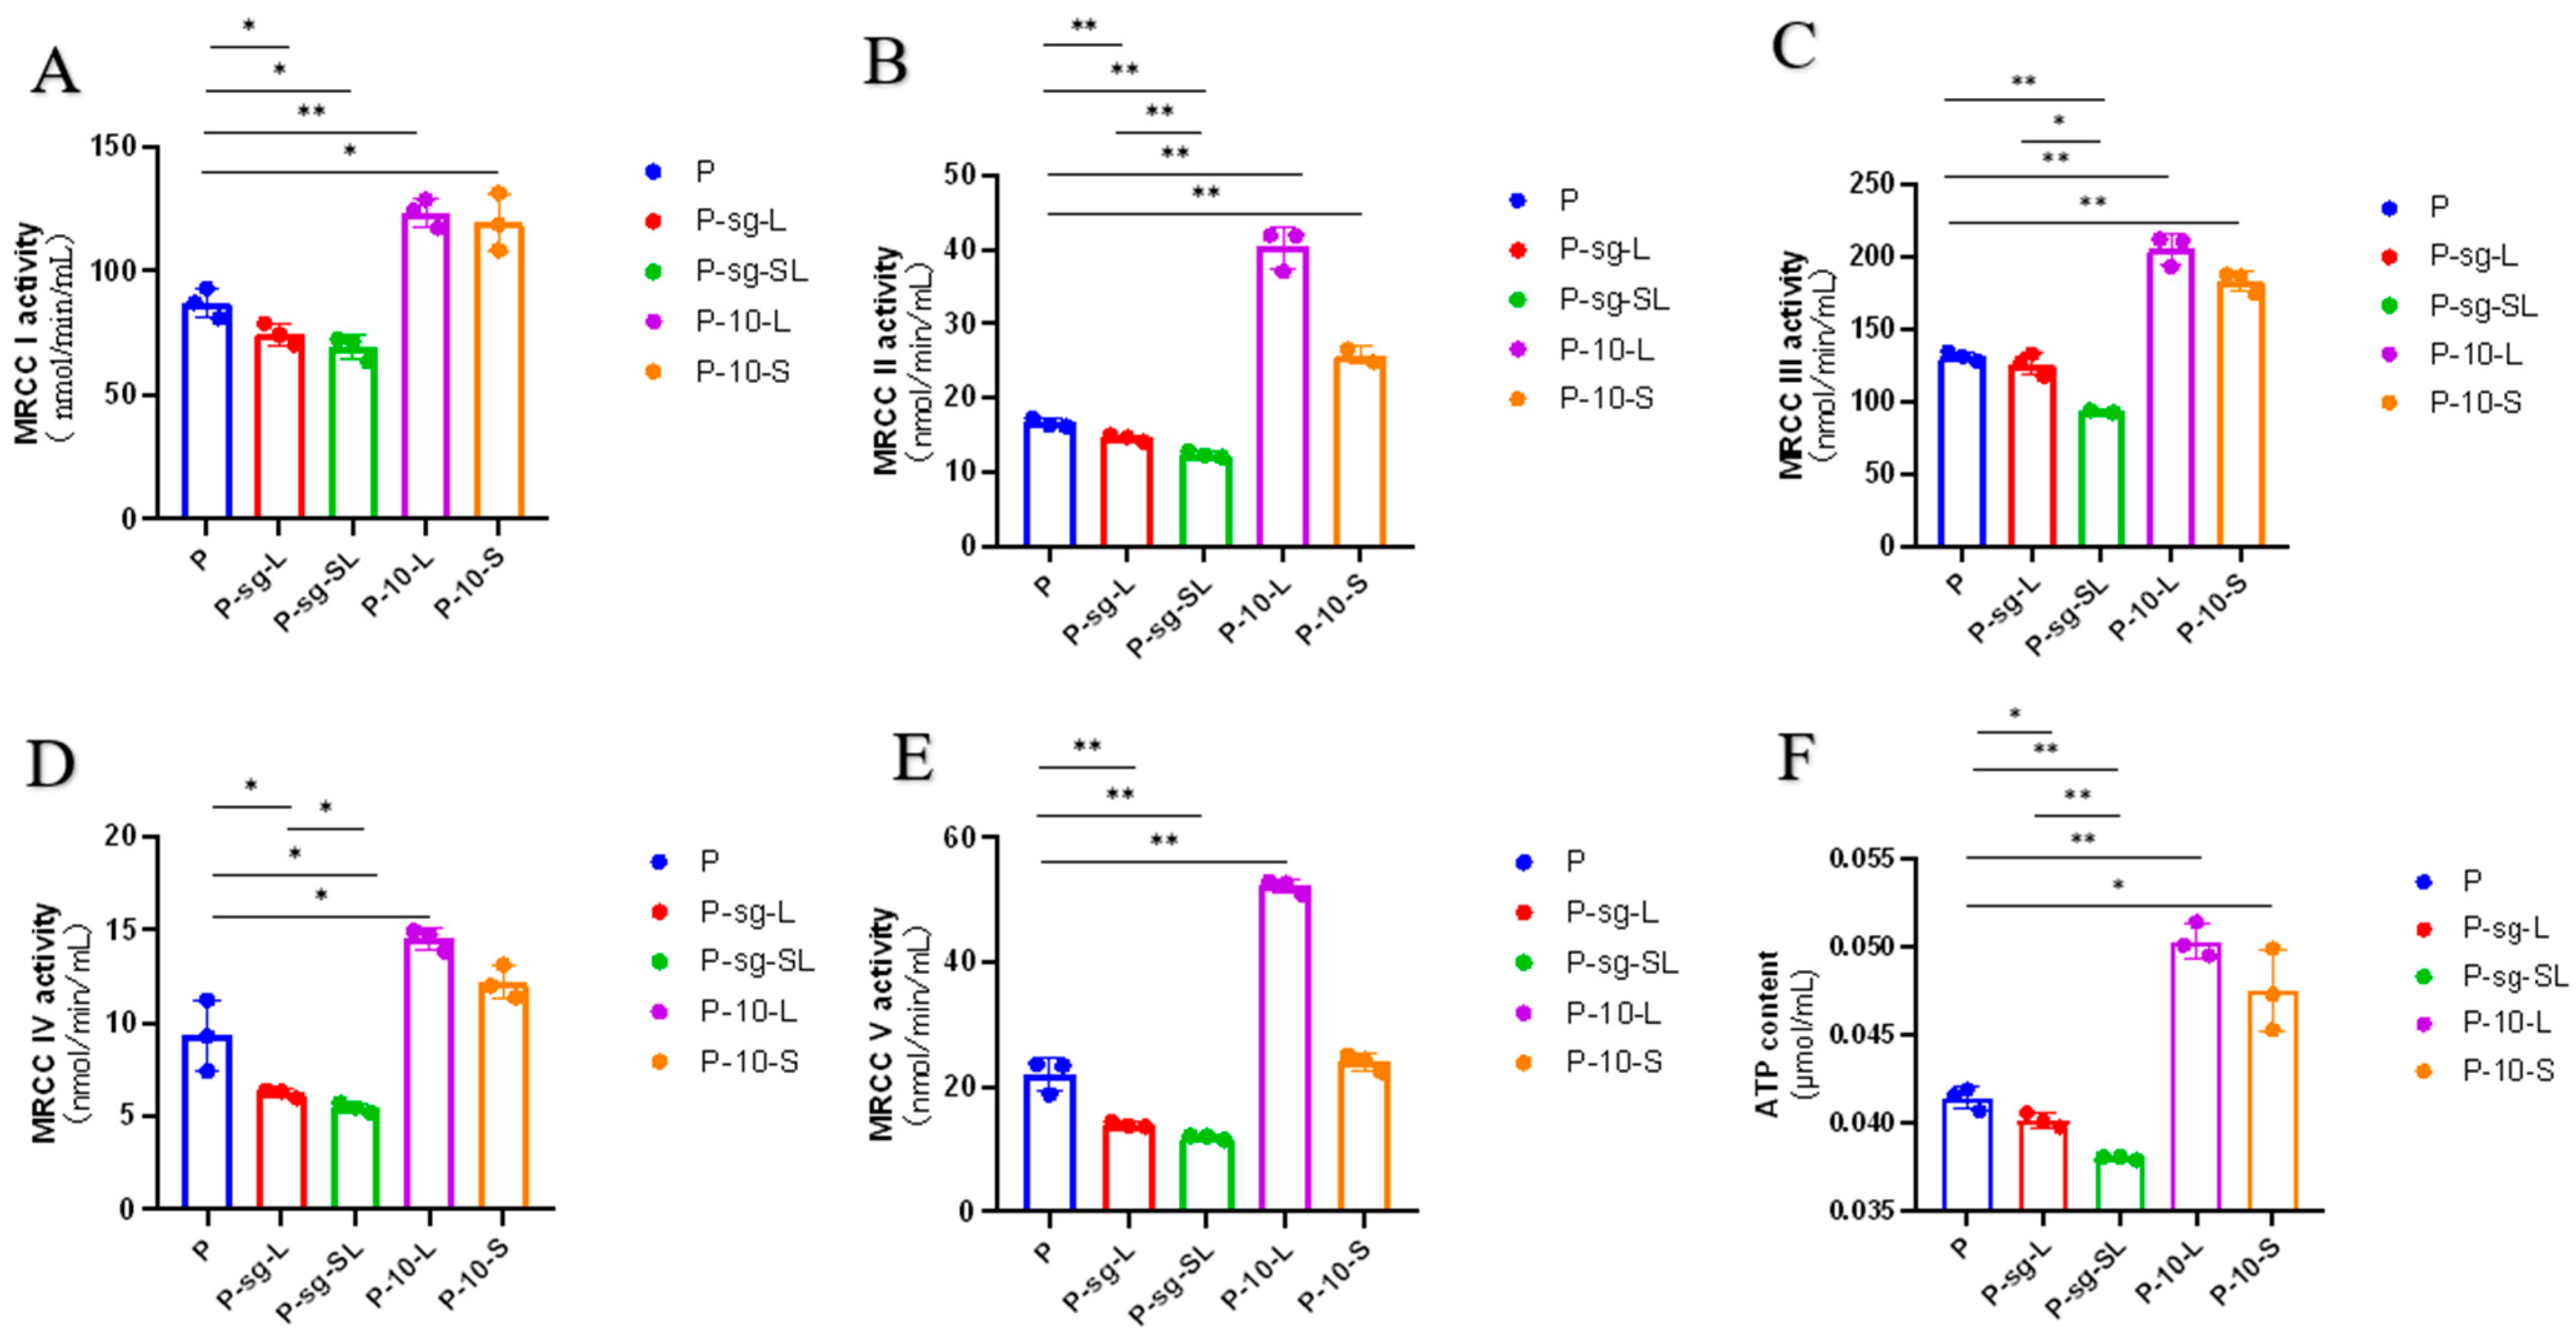
2.3. Mitochondrial Complex Activity Analysis
2.4. Oxidative Stress Parameters Analysis
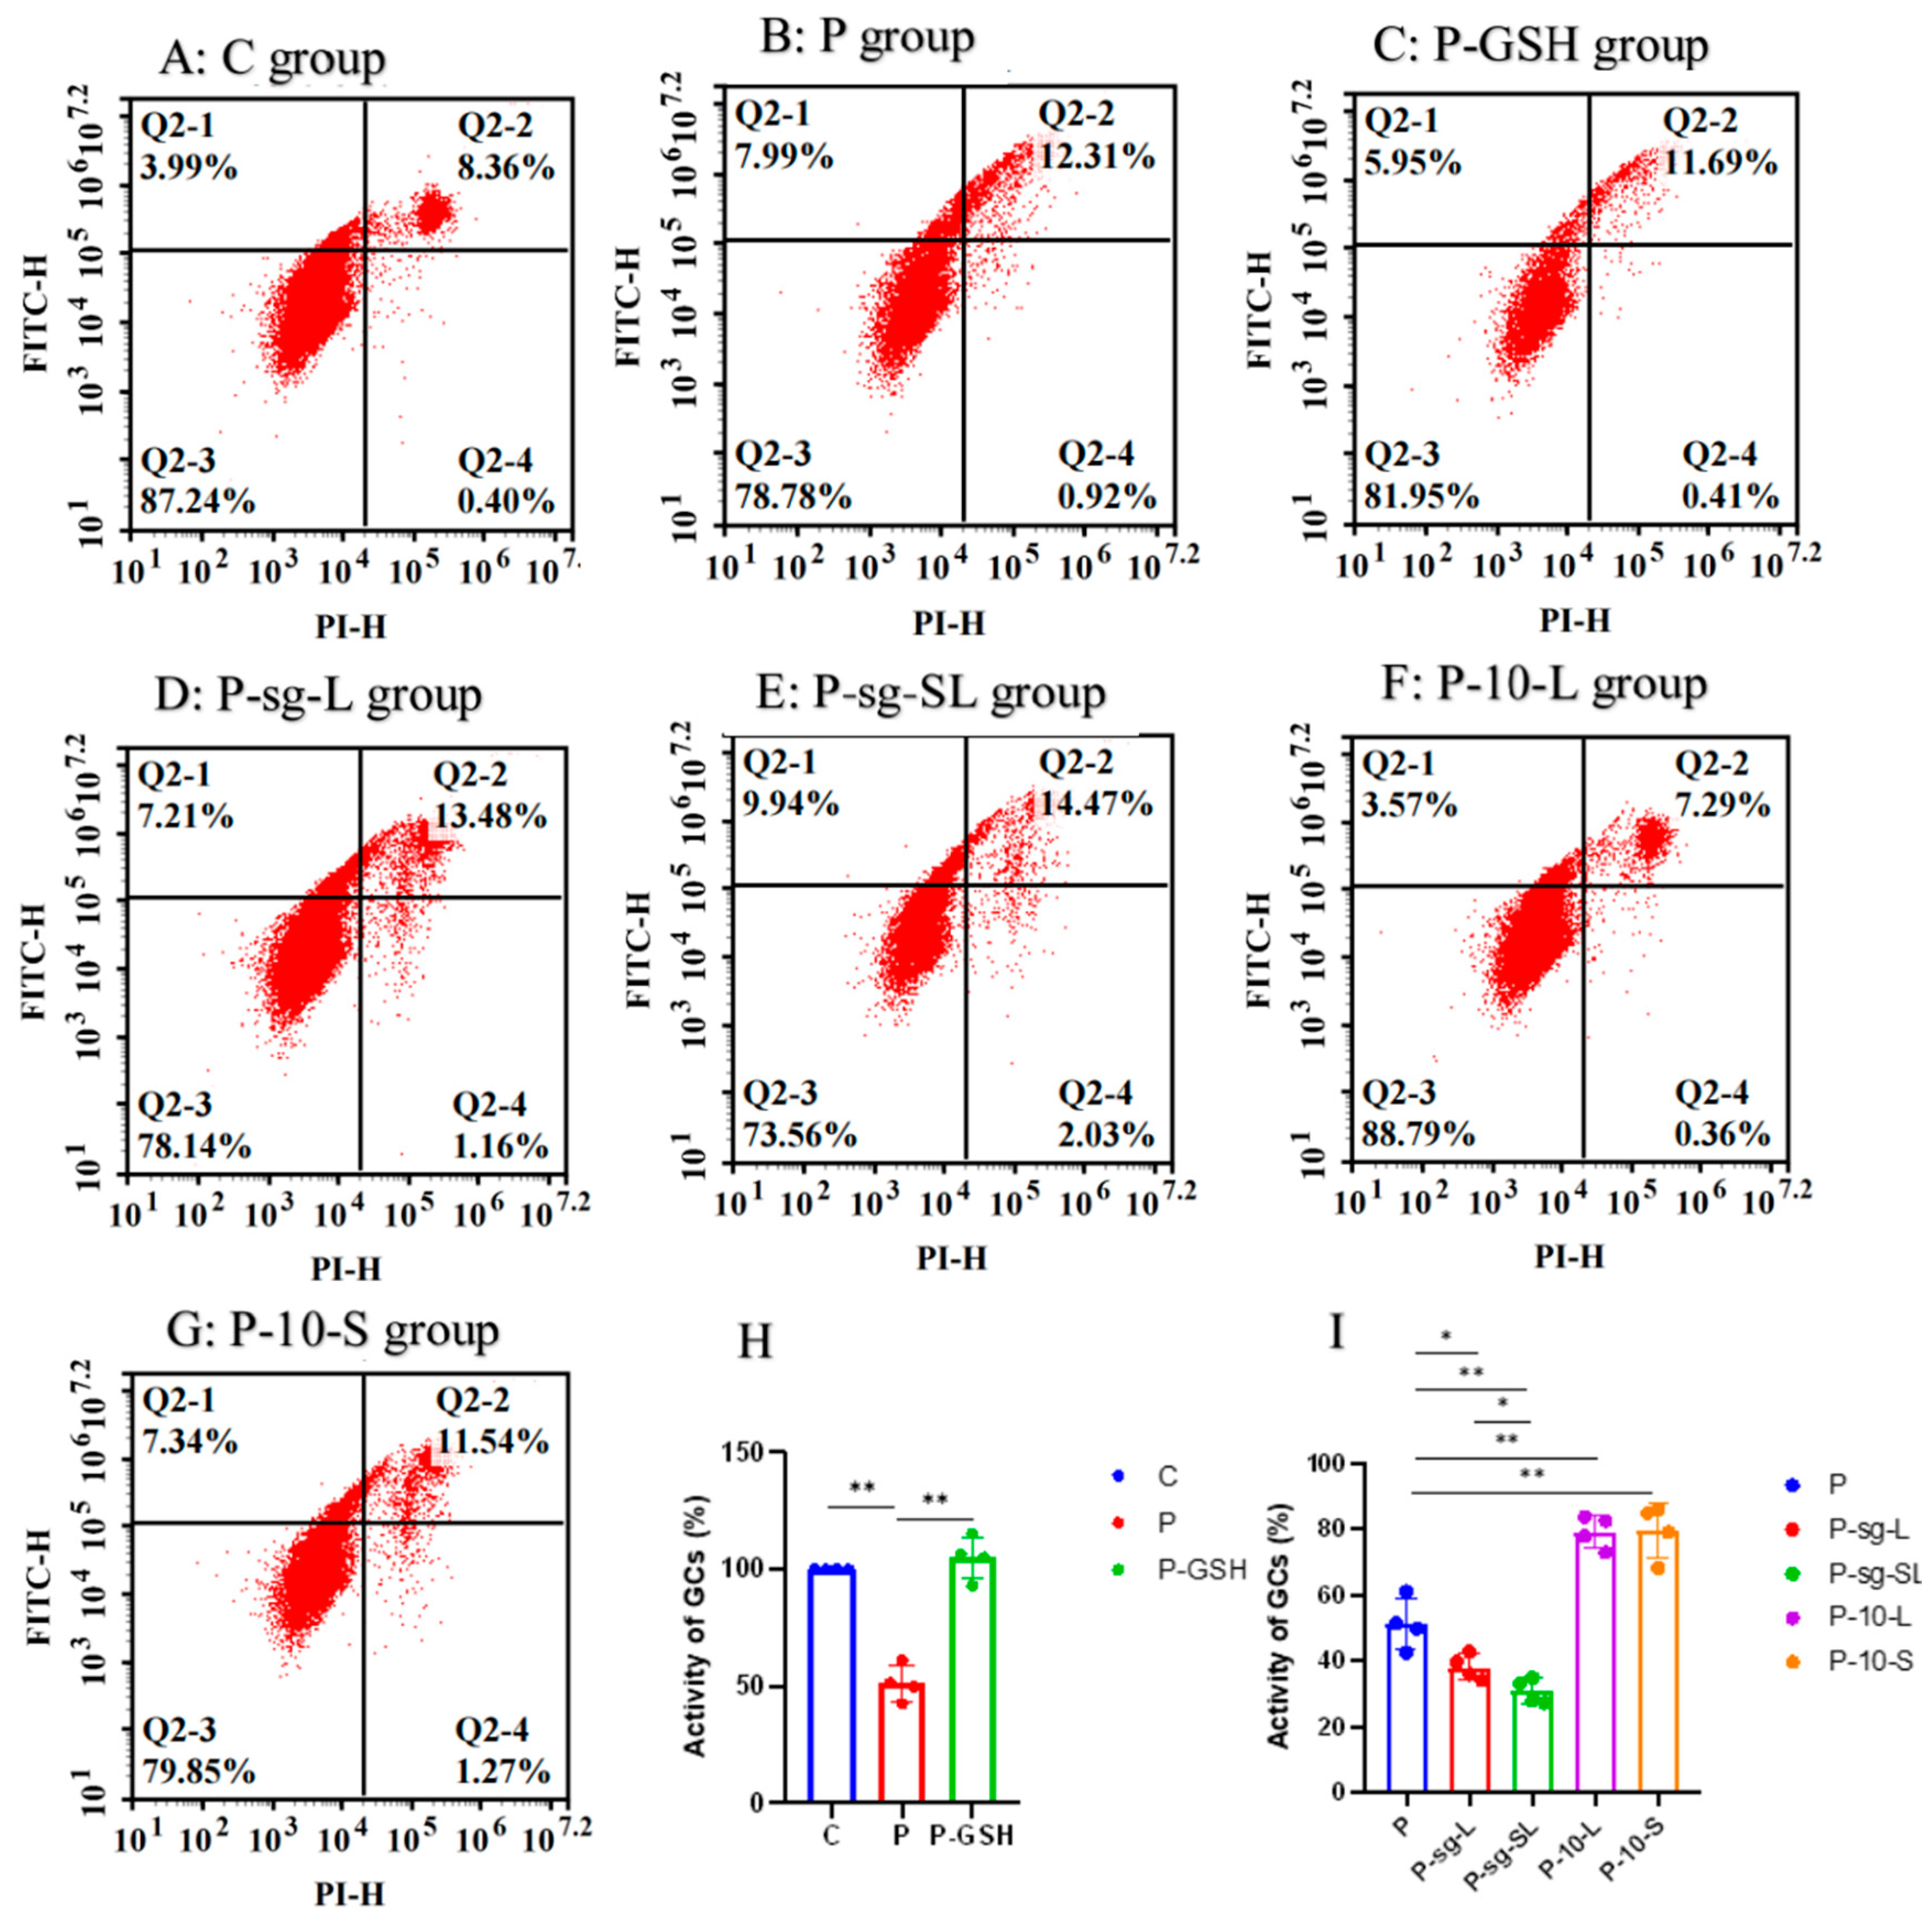
2.5. Apoptosis and Cell Viability Assay
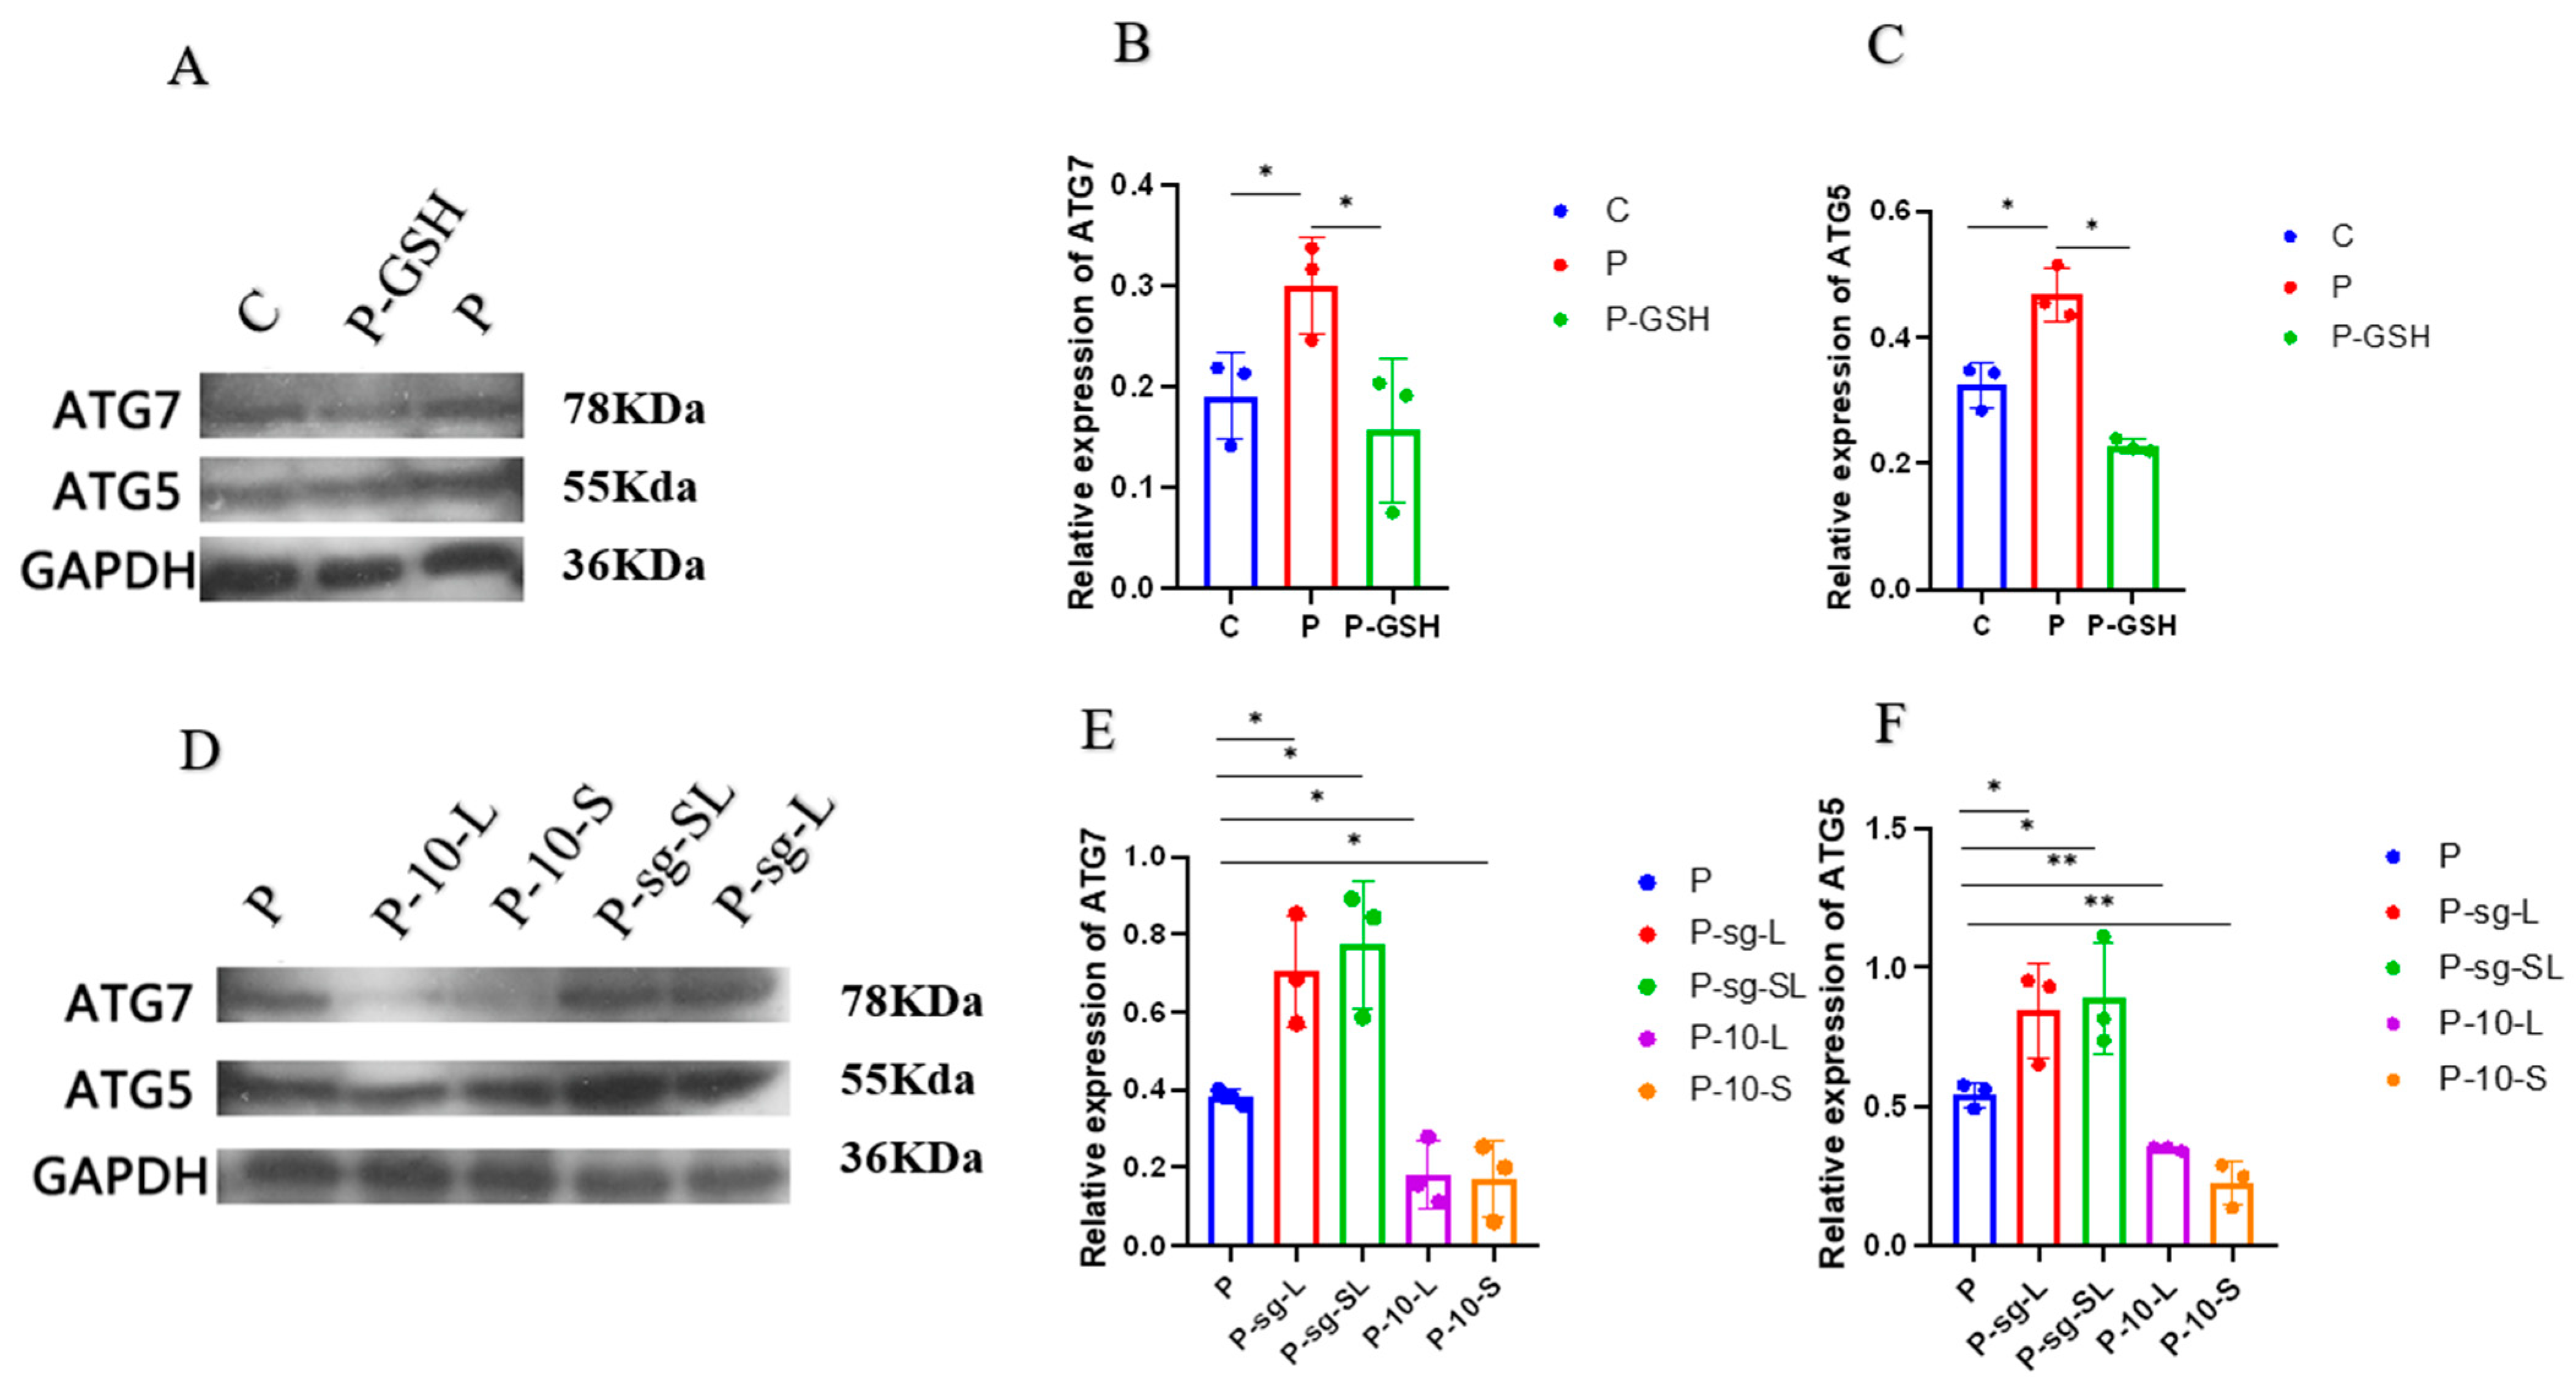
2.6. Autophagy Associated Proteins Analysis
3. Discussion
3.1. High PRL Concentrations Caused Mitochondrial Damage in Ovine Ovarian GCs and Excessive ROS
3.2. High PRL Concentrations Induced Ovine Ovarian GC Apoptosis by Promoting Oxidative Stress and Autophagy
3.3. PRL Regulated Oxidative Stress, Autophagy, and Apoptosis by Binding with L-PRLR and S-PRLR
4. Materials and Methods
4.1. Experimental Design
4.2. Experiment 1: The Optimal Concentration of Glutathione to Promote GC Proliferation
4.2.1. Cell Proliferation and Expression of Apoptosis-Related Genes
4.2.2. RNA Extraction and Quantitative Real-Time Polymerase Chain Reaction (PCR)
4.3. Experiment 2: The Mechanism of Apoptosis Induced by High PRL Concentration through Oxidative Stress
4.3.1. Sample Collection
4.3.2. Lentivirus Envelope and GC Infection
4.3.3. Mitochondrial Complex Activity
4.3.4. ROS Detection
4.3.5. Oxidative Stress Assay
4.3.6. Apoptosis and Cell Activity Assay
4.3.7. Western Blotting
4.4. Statistical Analysis
5. Conclusions
Supplementary Materials
Author Contributions
Funding
Institutional Review Board Statement
Informed Consent Statement
Data Availability Statement
Acknowledgments
Conflicts of Interest
References
- Schwarzler, P.; Untergasser, G.; Hermann, M.; Dirnhofer, S.; Abendstein, B.; Berger, P. Prolactin gene expression and prolactin protein in premenopausal and postmenopausal human ovaries. Fertil. Steril. 1997, 68, 696–701. [Google Scholar] [CrossRef] [PubMed]
- Perego, M.C.; Bellitto, N.; Maylem, E.R.S.; Caloni, F.; Spicer, L.J. Effects of selected hormones and their combination on progesterone and estradiol production and proliferation of feline granulosa cells cultured in vitro. Theriogenology 2021, 168, 1–12. [Google Scholar] [CrossRef] [PubMed]
- Hrabia, A.; Wolak, D.; Sechman, A. Response of the matrix metalloproteinase system of the chicken ovary to prolactin treatment. Theriogenology 2021, 169, 21–28. [Google Scholar] [CrossRef] [PubMed]
- Chen, J.; Yang, S.; Ma, B.; Wang, J.; Chen, J. Di-isononyl phthalate induces apoptosis and autophagy of mouse ovarian granulosa cells via oxidative stress. Ecotoxicol. Environ. Saf. 2022, 242, 113898. [Google Scholar] [CrossRef]
- Liu, X.; Song, Y.; Zhou, F.; Zhang, C.; Li, F.; Hu, R.; Ma, W.; Song, K.; Tang, Z.; Zhang, M. Network and experimental pharmacology on mechanism of Si-Wu-tang improving ovarian function in a mouse model of premature ovarian failure induced by cyclophosphamide. J. Ethnopharmacol. 2023, 301, 115842. [Google Scholar] [CrossRef]
- Esfandyari, S.; Aleyasin, A.; Noroozi, Z.; Taheri, M.; Khodarahmian, M.; Eslami, M.; Rashidi, Z.; Amidi, F. The Protective Effect of Sulforaphane against Oxidative Stress through Activation of NRF2/ARE Pathway in Human Granulosa Cells. Cell J. 2021, 23, 692–700. [Google Scholar] [CrossRef]
- Li, T.; Zhang, T.; Wang, H.; Zhang, Q.; Gao, H.; Liu, R.; Yin, C. The ADMA-DDAH1 axis in ovarian apoptosis of polycystic ovary syndrome. J. Steroid Biochem. Mol. Biol. 2023, 225, 106180. [Google Scholar] [CrossRef]
- de Oliveira, L.S.; da Silva, T.Q.M.; Barbosa, E.M.; Cordeiro, J.M.d.A.; Santos, L.C.; Henriques, P.C.; Santos, B.R.; Gusmao, D.d.O.; de Macedo, I.O.; Szawka, R.E.; et al. Kisspeptin Treatment Restores Ovarian Function in Rats with Hypothyroidism. Thyroid 2022, 32, 1568–1579. [Google Scholar] [CrossRef]
- Ito, M.; Tamaya, T. Unusual premature ovarian failure with hypogonadotropic hyperprolactinemia and 46, XX, 13ph+. J. Med. 1999, 30, 13–17. [Google Scholar]
- Hoekstra, A.; Yih, T.D.; Joosten, H.F.; Waalkens, D.H. The effects of chlorpromazine, mianserin and Org GC94 on reproductive function in the rat. Drug Chem. Toxicol. 1984, 7, 11–22. [Google Scholar] [CrossRef]
- Kazemi, M.; Lalooha, F.; Nooshabadi, M.R.; Dashti, F.; Kavianpour, M.; Haghighian, H.K. Randomized double blind clinical trial evaluating the Ellagic acid effects on insulin resistance, oxidative stress and sex hormones levels in women with polycystic ovarian syndrome. J. Ovarian Res. 2021, 14, 100. [Google Scholar] [CrossRef] [PubMed]
- Hu, S.Q.; Zadworny, D. Effects of nonglycosylated and glycosylated prolactin on basal and gonadotropin-stimulated steroidogenesis in chicken ovarian follicles. Domest. Anim. Endocrinol. 2017, 61, 27–38. [Google Scholar] [CrossRef] [PubMed]
- Tian, R.-H.; Bai, Y.; Li, J.-Y.; Guo, K.-M. Reducing PRLR expression and JAK2 activity results in an increase in BDNF expression and inhibits the apoptosis of CA3 hippocampal neurons in a chronic mild stress model of depression. Brain Res. 2019, 1725, 146472. [Google Scholar] [CrossRef] [PubMed]
- Arumugam, R.; Fleenor, D.; Freemark, M. Knockdown of prolactin receptors in a pancreatic beta cell line: Effects on DNA synthesis, apoptosis, and gene expression. Endocrine 2014, 46, 568–576. [Google Scholar] [CrossRef] [PubMed]
- Yang, R.; Duan, C.; Guo, Y.; Ma, Y.; Niu, N.; Zhang, Y.; Liu, Y. Sequence analysis and mRNA expression of prolactin receptor gene isoforms in different tissues of sheep during lactation and the post-weaning period. Peerj 2021, 9, e11868. [Google Scholar] [CrossRef]
- Geng, Y.; Qiu, Y.; Liu, X.; Chen, X.; Ding, Y.; Liu, S.; Zhao, Y.; Gao, R.; Wang, Y.; He, J. Sodium fluoride activates ERK and JNK via induction of oxidative stress to promote apoptosis and impairs ovarian function in rats. J. Hazard. Mater. 2014, 272, 75–82. [Google Scholar] [CrossRef]
- Hirakawa, Y.; Nangaku, M. Targeting oxidative stress in diabetic kidney disease: A novel drug in an old pathway. Kidney Int. 2018, 94, 1038–1039. [Google Scholar] [CrossRef]
- Zargari, F.; Rahaman, M.S.; KazemPour, R.; Hajirostamlou, M. Arsenic, Oxidative Stress and Reproductive System. J. Xenobiotics 2022, 12, 214–222. [Google Scholar] [CrossRef]
- Saeed-Zidane, M.; Linden, L.; Salilew-Wondim, D.; Held, E.; Neuhoff, C.; Tholen, E.; Hoelker, M.; Schellander, K.; Tesfaye, D. Cellular and exosome mediated molecular defense mechanism in bovine granulosa cells exposed to oxidative stress. PLoS ONE 2017, 12, e0187569. [Google Scholar] [CrossRef]
- Karabulut, S.; Korkmaz, O.; Kutlu, P.; Gozel, H.E.; Keskin, I. Effects o follicular fluid oxidative status on human mural granulosa cells, oocyte competency and ICSI parameters. Eur. J. Obstet. Gynecol. Reprod. Biol. 2020, 252, 127–136. [Google Scholar] [CrossRef]
- Kumariya, S.; Ubba, V.; Jha, R.K.; Gayen, J.R. Autophagy in ovary and polycystic ovary syndrome: Role, dispute and future perspective. Autophagy 2021, 17, 2706–2732. [Google Scholar] [CrossRef] [PubMed]
- Gunkov, S.; Tatarchuk, T.; Zhminko, P.; Regeda, S. Effect of manganese and nickel on prolactin levels in women with polycystic ovary syndrome. Georgian Med. News 2019, 289, 21–25. [Google Scholar]
- Tao, T.; Xu, H. Autophagy and Obesity-Related Reproductive Dysfunction. In Autophagy: Biology and Diseases: Clinical Science; Le, W., Ed.; Springer: Singapore, 2020; Volume 1207, pp. 463–466. [Google Scholar]
- Kruman, I.; BruceKeller, A.J.; Bredesen, D.; Waeg, G.; Mattson, M.P. Evidence that 4-hydroxynonenal mediates oxidative stress-induced neuronal apoptosis. J. Neurosci. 1997, 17, 5089–5100. [Google Scholar] [CrossRef] [PubMed]
- Chu, Q.; Yang, K.; Wang, A. Research progress on oxidative stress and apoptosis. Wei Sheng Yan Jiu J. Hyg. Res. 2003, 32, 276–279. [Google Scholar]
- Fitzwalter, B.E.; Thorburn, A. FOXO3 links autophagy to apoptosis. Autophagy 2018, 14, 1467–1468. [Google Scholar] [CrossRef]
- Marino, G.; Niso-Santano, M.; Baehrecke, E.H.; Kroemer, G. Self-consumption: The interplay of autophagy and apoptosis. Nat. Rev. Mol. Cell Biol. 2014, 15, 81–94. [Google Scholar] [CrossRef]
- Yang, R.; Zhang, S.; Duan, C.; Guo, Y.; Shan, X.; Zhang, X.; Yue, S.; Zhang, Y.; Liu, Y. Effect of prolactin on cytotoxicity and oxidative stress in ovine ovarian granulosa cells. Peerj 2023, 11, e15629. [Google Scholar] [CrossRef]
- Felix, L.; Carreira, P.; Peixoto, F. Effects of chronic exposure of naturally weathered microplastics on oxidative stress level, behaviour, and mitochondrial function of adult zebrafish (Danio rerio). Chemosphere 2023, 310, 136895. [Google Scholar] [CrossRef]
- Pareek, G. AAA plus proteases: The first line of defense against mitochondrial damage. Peerj 2022, 10, e14350. [Google Scholar] [CrossRef]
- Zhang, Y.; Wu, N.; Li, Q.; Hu, X.; Wang, L.; Sun, J.-G.; Wang, Z.; Sun, X.-H. Neuroprotective effect of the somatostatin receptor 5 agonist L-817,818 on retinal ganglion cells in experimental glaucoma. Exp. Eye Res. 2021, 204, 108449. [Google Scholar] [CrossRef]
- Ikawa, M.; Yoneda, M. Mitochondrial dysfunction as a promoting factor of senescence. Nihon Rinsho Jpn. J. Clin. Med. 2009, 67, 1321–1325. [Google Scholar]
- Suturina, L.; Atalyan, A.; Lazareva, L.; Sholokhov, L.; Rashidova, M.; Kolesnikova, L. Infertility in Women with Idiopathic Hyperprolactinemia is Associated with Oxidative Stress. Reprod. Sci. 2019, 26, 281A. [Google Scholar]
- Veena, B.S.; Upadhya, S.; Adiga, S.K.; Pratap, K.N. Evaluation of oxidative stress, antioxidants and prolactin in infertile women. Indian J. Clin. Biochem. IJCB 2008, 23, 186–190. [Google Scholar] [CrossRef] [PubMed][Green Version]
- Day, A.M.; Brown, J.D.; Taylor, S.R.; Rand, J.D.; Morgan, B.A.; Veal, E.A. Inactivation of a Peroxiredoxin by Hydrogen Peroxide Is Critical for Thioredoxin-Mediated Repair of Oxidized Proteins and Cell Survival. Mol. Cell 2012, 45, 398–408. [Google Scholar] [CrossRef]
- Wu, C.; Zhang, W.; Mai, K.; Xu, W.; Zhong, X. Effects of dietary zinc on gene expression of antioxidant enzymes and heat shock proteins in hepatopancreas of abalone Haliotis discus hannai. Comp. Biochem. Physiol. C-Toxicol. Pharmacol. 2011, 154, 1–6. [Google Scholar] [CrossRef]
- Khalaf, H.A.; Elmorsy, E.; Mahmoud, E.-H.M.; Aggour, A.M.; Amer, S.A. The role of oxidative stress in ovarian toxicity induced by haloperidol and clozapine-a histological and biochemical study in albino rats. Cell Tissue Res. 2019, 378, 371–383. [Google Scholar] [CrossRef]
- Wang, J.; Wu, J.; Zhang, Y.; Zhang, J.; Xu, W.; Wu, C.; Zhou, P. Growth hormone protects against ovarian granulosa cell apoptosis: Alleviation oxidative stress and enhancement mitochondrial function. Reprod. Biol. 2021, 21, 100504. [Google Scholar] [CrossRef]
- Gioacchini, G.; Valle, L.D.; Benato, F.; Fimia, G.M.; Nardacci, R.; Ciccosanti, F.; Piacentini, M.; Borini, A.; Carnevali, O. Interplay between autophagy and apoptosis in the development of Danio rerio follicles and the effects of a probiotic. Reprod. Fertil. Dev. 2013, 25, 1115–1125. [Google Scholar] [CrossRef]
- Zhou, J.; Yao, W.; Liu, K.; Wen, Q.; Wu, W.; Liu, H.; Li, Q. MicroRNA let-7g regulates mouse granulosa cell autophagy by targeting insulin-like growth factor 1 receptor. Int. J. Biochem. Cell Biol. 2016, 78, 130–140. [Google Scholar] [CrossRef]
- Yu, J.; Lou, Y.; He, K.; Yang, S.; Yu, W.; Han, L.; Zhao, A. Goose broodiness is involved in granulosa cell autophagy and homeostatic imbalance of follicular hormones. Poult. Sci. 2016, 95, 1156–1164. [Google Scholar] [CrossRef]
- Li, M.; Tan, J.; Miao, Y.; Lei, P.; Zhang, Q. The dual role of autophagy under hypoxia-involvement of interaction between autophagy and apoptosis. Apoptosis 2015, 20, 769–777. [Google Scholar] [CrossRef] [PubMed]
- Wang, L.; Li, X.; Yang, Z.; Zhu, M.; Xie, J. Autophagy induced by low concentrations of crotonaldehyde promotes apoptosis and inhibits necrosis in human bronchial epithelial cells. Ecotoxicol. Environ. Saf. 2019, 167, 169–177. [Google Scholar] [CrossRef] [PubMed]
- Xi, H.; Wang, S.; Wang, B.; Hong, X.; Liu, X.; Li, M.; Shen, R.; Dong, Q. The role of interaction between autophagy and apoptosis in tumorigenesis (Review). Oncol. Rep. 2022, 48, 208. [Google Scholar] [CrossRef] [PubMed]
- Binart, N.; Bachelot, A.; Bouilly, J. Impact of prolactin receptor isoforms on reproduction. Trends Endocrinol. Metab. 2010, 21, 362–368. [Google Scholar] [CrossRef] [PubMed]
- Di Carlo, R.; Meli, R.; Romano Carratelli, C.; Galdiero, M.; Nuzzo, I.; Bentivoglio, C. Interference of prolactin on some processes of nonspecific immunity. Pharmacol. Res. 1992, 26 (Suppl. S2), 32–33. [Google Scholar] [CrossRef] [PubMed]
- Bignon, C.; Binart, N.; Ormandy, C.; Schuler, L.A.; Kelly, P.A.; Djiane, J. Long and short forms of the ovine prolactin receptor: cDNA cloning and genomic analysis reveal that the two forms arise by different alternative splicing mechanisms in ruminants and in rodents. J. Mol. Endocrinol. 1997, 19, 109–120. [Google Scholar] [CrossRef]
- Walker, A.M. Prolactin receptor antagonists. Curr. Opin. Investig. Drugs 2005, 6, 378–385. [Google Scholar]
- Gauthier, M.F.; de Andrade, A.A.; Fisch, J.; Feistauer, V.; Moras, A.M.; Reinhardt, L.S.; de Moura, A.C.; Moura, D.J.; de Almeida, S.; Guedes, R.P.; et al. Dietary interventions in mice affect oxidative stress and gene expression of the Prlr and Esr1 in the adipose tissue and hypothalamus of dams and their offspring. J. Physiol. Biochem. 2022, 78, 271–282. [Google Scholar] [CrossRef]
- Dandawate, P.; Kaushik, G.; Ghosh, C.; Standing, D.; Sayed, A.A.A.; Choudhury, S.; Subramaniam, D.; Manzardo, A.; Banerjee, T.; Santra, S.; et al. Diphenylbutylpiperidine Antipsychotic Drugs Inhibit Prolactin Receptor Signaling to Reduce Growth of Pancreatic Ductal Adenocarcinoma in Mice. Gastroenterology 2020, 158, 1433–1449. [Google Scholar] [CrossRef]
- Wen, Y.; Zand, B.; Ozpolat, B.; Szczepanski, M.J.; Lu, C.; Yuca, E.; Carroll, A.R.; Alpay, N.; Bartholomeusz, C.; Tekedereli, I.; et al. Antagonism of Tumoral Prolactin Receptor Promotes Autophagy-Related Cell Death. Cell Rep. 2014, 7, 488–500. [Google Scholar] [CrossRef][Green Version]
- Lopez-Pulido, E.I.; Munoz-Valle, J.F.; Del Toro-Arreola, S.; Jave-Suarez, L.F.; Bueno-Topete, M.R.; Estrada-Chavez, C.; Laura Pereira-Suarez, A. High expression of prolactin receptor is associated with cell survival in cervical cancer cells. Cancer Cell Int. 2013, 13, 103. [Google Scholar] [CrossRef] [PubMed]
- Hartwell, H.J.; Petrosky, K.Y.; Fox, J.G.; Horseman, N.D.; Rogers, A.B. Prolactin prevents hepatocellular carcinoma by restricting innate immune activation of c-Myc in mice. Proc. Natl. Acad. Sci. USA 2014, 111, 11455–11460. [Google Scholar] [CrossRef]
- Kaltungo, B.Y.; Musa, I.W. A Review of Some Protozoan Parasites Causing Infertility in Farm Animals. ISRN Trop. Med. 2013, 2013, 782609. [Google Scholar] [CrossRef]
- Clarke, H.; Dhillo, W.S.; Jayasena, C.N. Comprehensive Review on Kisspeptin and Its Role in Reproductive Disorders. Endocrinol. Metab. 2015, 30, 124–141. [Google Scholar] [CrossRef] [PubMed]
- Dehghan, E.; Namiranian, N.; Ghadiri-Anari, A.; Kazem Razavi Ratki, S.; Azizi, R. Evaluation of hyperprolactinemia risk factors in infertile women referred to Yazd Infertility Center: A cross-sectional study. Int. J. Reprod. Biomed. 2021, 19, 1085–1090. [Google Scholar] [CrossRef] [PubMed]
- Yang, R.; Duan, C.; Zhang, S.; Liu, Y.; Zhang, Y. Prolactin Regulates Ovine Ovarian Granulosa Cell Apoptosis by Affecting the Expression of MAPK12 Gene. Int. J. Mol. Sci. 2023, 24, 10269. [Google Scholar] [CrossRef]
- Puntel, R.L.; Roos, D.H.; Seeger, R.L.; Rocha, J.B.T. Mitochondrial electron transfer chain complexes inhibition by different organochalcogens. Toxicol. In Vitro 2013, 27, 59–70. [Google Scholar] [CrossRef]
- Shimada, S.; Maeda, S.; Hikita, M.; Mieda-Higa, K.; Uene, S.; Nariai, Y.; Shinzawa-Itoh, K. Solubilization conditions for bovine heart mitochondrial membranes allow selective purification of large quantities of respiratory complexes I, III, and V. Protein Expr. Purif. 2018, 150, 33–43. [Google Scholar] [CrossRef]
- Denker, N.; Harders, A.R.; Arend, C.; Dringen, R. Consumption and Metabolism of Extracellular Pyruvate by Cultured Rat Brain Astrocytes. Neurochem. Res. 2023, 48, 1438–1454. [Google Scholar] [CrossRef]


| Items | Group | SEM | p-Value | ||||||
|---|---|---|---|---|---|---|---|---|---|
| C | P | P-GSH | P-sg-L | P-sg-SL | P-10-L | P-10-S | |||
| Early apoptotic cells rate | 7.55 d | 12.57 b | 11.45 c | 14.31 a | 14.71 a | 7.25 d | 10.55 c | 0.366 | <0.001 |
| Late apoptotic or necrotic cells rate | 0.35 d | 0.97 c | 0.39 d | 1.17 b | 2.08 a | 0.38 d | 1.16 b | 0.0342 | <0.001 |
| Total apoptotic rate | 7.91 e | 13.87 c | 11.84 d | 15.48 b | 16.79 a | 7.67 e | 11.71 d | 0.386 | <0.001 |
Disclaimer/Publisher’s Note: The statements, opinions and data contained in all publications are solely those of the individual author(s) and contributor(s) and not of MDPI and/or the editor(s). MDPI and/or the editor(s) disclaim responsibility for any injury to people or property resulting from any ideas, methods, instructions or products referred to in the content. |
© 2023 by the authors. Licensee MDPI, Basel, Switzerland. This article is an open access article distributed under the terms and conditions of the Creative Commons Attribution (CC BY) license (https://creativecommons.org/licenses/by/4.0/).
Share and Cite
Yang, R.; Duan, C.; Zhang, S.; Guo, Y.; Shan, X.; Chen, M.; Yue, S.; Zhang, Y.; Liu, Y. High Prolactin Concentration Induces Ovarian Granulosa Cell Oxidative Stress, Leading to Apoptosis Mediated by L-PRLR and S-PRLR. Int. J. Mol. Sci. 2023, 24, 14407. https://doi.org/10.3390/ijms241914407
Yang R, Duan C, Zhang S, Guo Y, Shan X, Chen M, Yue S, Zhang Y, Liu Y. High Prolactin Concentration Induces Ovarian Granulosa Cell Oxidative Stress, Leading to Apoptosis Mediated by L-PRLR and S-PRLR. International Journal of Molecular Sciences. 2023; 24(19):14407. https://doi.org/10.3390/ijms241914407
Chicago/Turabian StyleYang, Ruochen, Chunhui Duan, Shuo Zhang, Yunxia Guo, Xinyu Shan, Meijing Chen, Sicong Yue, Yingjie Zhang, and Yueqin Liu. 2023. "High Prolactin Concentration Induces Ovarian Granulosa Cell Oxidative Stress, Leading to Apoptosis Mediated by L-PRLR and S-PRLR" International Journal of Molecular Sciences 24, no. 19: 14407. https://doi.org/10.3390/ijms241914407
APA StyleYang, R., Duan, C., Zhang, S., Guo, Y., Shan, X., Chen, M., Yue, S., Zhang, Y., & Liu, Y. (2023). High Prolactin Concentration Induces Ovarian Granulosa Cell Oxidative Stress, Leading to Apoptosis Mediated by L-PRLR and S-PRLR. International Journal of Molecular Sciences, 24(19), 14407. https://doi.org/10.3390/ijms241914407