Article

Photocatalytic and Cathode Active Abilities of Ni-Substituted α-FeOOH Nanoparticles

1
Department of Chemistry, Graduate School of Science, Tokyo Metropolitan University, Tokyo 192-0397, Japan
2
Institute of Chemistry, Eötvos Loránd University, 1117 Budapest, Hungary
3
Division of Materials Chemistry, Ruđer Bošković Institute, 10000 Zagreb, Croatia
4
Faculty of Chemical Engineering and Technology, University of Zagreb, Marulićev trg 20, 10000 Zagreb, Croatia
*
Author to whom correspondence should be addressed.
Int. J. Mol. Sci. 2023, 24(18), 14300; https://doi.org/10.3390/ijms241814300
Submission received: 16 August 2023 / Revised: 12 September 2023 / Accepted: 15 September 2023 / Published: 19 September 2023

Abstract

:
The present study investigates the relationship between the local structure, photocatalytic ability, and cathode performances in sodium-ion batteries (SIBs) and lithium-ion batteries (LIBs) using Ni-substituted goethite nanoparticles (NixFe1−xOOH NPs) with a range of ‘x’ values from 0 to 0.5. The structural characterization was performed applying various techniques, including X-ray diffractometry (XRD); thermogravimetry differential thermal analysis (TG-DTA); Fourier transform infrared spectroscopy (FT-IR); X-ray absorption spectroscopy (XANES/EXAFS), both measured at room temperature (RT); 57Fe Mössbauer spectroscopy recorded at RT and low temperatures (LT) from 20 K to 300 K; Brunauer–Emmett–Teller surface area measurement (BET), and diffuse reflectance spectroscopy (DRS). In addition, the electrical properties of NixFe1−xOOH NPs were evaluated by solid-state impedance spectroscopy (SS-IS). XRD showed the presence of goethite as the only crystalline phase in prepared samples with x ≤ 0.20, and goethite and α-Ni(OH)2 in the samples with x > 0.20. The sample with x = 0.10 (Ni10) showed the highest photo-Fenton ability with a first-order rate constant value (k) of 15.8 × 10⁻³ min−1. The 57Fe Mössbauer spectrum of Ni0, measured at RT, displayed a sextet corresponding to goethite, with an isomer shift (δ) of 0.36 mm s−1 and a hyperfine magnetic distribution (Bhf) of 32.95 T. Moreover, the DC conductivity decreased from 5.52 × 10⁻¹⁰ to 5.30 × 10⁻¹² (Ω cm)–1 with ‘x’ increasing from 0.10 to 0.50. Ni20 showed the highest initial discharge capacity of 223 mAh g−1, attributed to its largest specific surface area of 174.0 m2 g−1. In conclusion, NixFe1−xOOH NPs can be effectively utilized as visible-light-activated catalysts and active cathode materials in secondary batteries.

1. Introduction

Metal oxide nanoparticles (MO NPs) exhibit a large surface area and a pronounced quantum size effect due to superparamagnetism and the quantum tunnelling phenomenon, distinguishing them from bulk MO materials. Among the wide array of MO NPs, iron oxide NPs have emerged as a novel functional material class that has gained considerable attention across various domains. These include biomedical applications, wherein they demonstrate antimicrobial and anticancer activities [1], as well as catalysts [2], photocatalysts [3,4], and agents for environmental purification [5].
In particular, goethite (α-FeOOH) NPs represent the most readily available form of iron oxyhydroxide in nature. Their crystal structure comprises interconnected FeO3(OH)3 octahedra with shared edge and vertex linkages. The versatile applications of α-FeOOH NPs encompass traditional roles as pigments, catalysts, photocatalysts [6], adsorbents, gas sensors, photoelectrodes [7], and battery electrodes [8,9]. Notably, the utilization of α-FeOOH NPs for wastewater purification and as secondary battery electrodes holds immense significance in realizing future sustainable development goals. This is primarily due to their ability, non-toxic nature, stability, electrical conductivity, and photocatalytic activity under visible-light exposure [10].
As for the UV- and visible-light-activated photocatalytic ability of α-FeOOH NPs, a first-order rate constant (k) of 7.4 × 10⁻⁴ min−1 was recorded for 15 mg of hematite (α-Fe2O3) NPs formed by the combustion method, in a reaction with 50 mL of an aqueous solution containing 10 mg of Rhodamine B (RhB) under UV light irradiation [3]. In this reaction, 95% of the RhB decomposed after 180 min [3]. In addition, the photocatalytic reaction between RhB–H2O2 aqueous solutions and 10 mg of powdered, 4 mol% Cu-doped goethites under exposure to visible light resulted in a 60% degradation of RhB in 1 h, which could be attributed to the combined effect of nanoneedle morphology and Cu doping [11].
In relation to the developments of visible-light-activated photocatalysts and secondary battery electrodes of iron oxide NPs, we confirmed the methylene blue (MB) degradation effect of a mixture of Fe NPs and γ-Fe2O3 NPs [12]. In this study, a 10-day MBaq degradation test using a 1:3 molar ratio of Fe NPs to γ-Fe2O3 NPs mixed powder showed a significant decrease in MB concentration from 20.0 to 0.85 μM with a maximum k value of 2.84 day−1, indicating that iron oxide NPs effectively degrade organic compounds [13]. This result proves that the nano size of Fe and γ-Fe2O3 showed larger reactivity because of their high surface area. Another result of methylene blue decomposition was reported on Sn-incorporated FeOOH NPs, showing a smaller band gap energy and higher decomposition performance compared to pure FeOOH. It is assumed that the band gap energy of α-FeOOH NPs decreased due to the introduction of SnIV [14].
On the other hand, as for the application of α-FeOOH as an electrode for a secondary battery, an excellent cycling performance with a reversible specific capacity of 870 mAh g−1 under the current rate of 100 mA g−1 of LIB was reported. The anode contained α-FeOOH corner-truncated prisms (CTPs) with a length of approximately 1 μm and a width of approximately 200 nm obtained by hydrothermal treatment [9].
An intriguing and notable characteristic of α-FeOOH NPs is their inherent capability to incorporate diverse metal cations into their crystal structure. This opens the field to the possibility of modifying various crystal properties, including morphology, size, crystallinity, and colour, by replacing Fe3+ ions within the structure. In particular, the doping of α-FeOOH NPs with a range of metal cations, such as Al3+, In3+, Cu2+, Cr2+, Mn2+, and Zn2+, was extensively investigated to enhance further the aforementioned physical properties [11,12]. These studies have explored the potential for improving and refining the characteristics of α-FeOOH NPs by introducing and incorporating these selected metal cations into their structure.
In addition, Cu2+-for-Fe3+ substitution in goethite caused a gradual elongation and narrowing of nanorods with the formation of nanoneedles, which led to a slight decrease in direct and indirect optical band gaps compared with the pure phases [11]. The introduction of nickel (Ni) as a dopant in α-FeOOH NPs is anticipated to impact their crystalline structure and oxidation state. Ni can substitute for Fe ions within the crystal lattice of α-FeOOH NPs [12]. This incorporation of Ni is likely to result in slight modifications of the crystalline structure, which predominantly consists of interconnected FeO6 octahedra with shared edges and vertices [11,12]. Upon doping with Ni, the dopant ions can occupy available sites within the lattice [11,12]. The extent of the structural changes depends on many factors such as the concentration of the dopant and its compatibility with the lattice structure of α-FeOOH [15].
The oxidation state of Ni within the doped α-FeOOH NPs primarily depends on the specific synthesis conditions and the prevailing redox environment [15]. Typically, Ni is commonly found in a +2-valence state. However, it is important to note that the local chemical environment and interactions with neighbouring atoms within the lattice structure can influence the oxidation state of the dopant ions.
Herein, we report the relationship between the structure, photocatalytic ability, and active cathode property of a secondary battery of Ni-substituted α-FeOOH NPs prepared by hydrothermal synthesis. For this purpose, structural characterization was performed by X-ray diffractometry (XRD), X-ray absorption spectroscopy (XANES/EXAFS), and 57Fe-Mössbaur spectroscopy. Moreover, for the properties of photocatalytic ability, electrochemical performance, and active cathode evaluation, Brunauer–Emmett–Teller (BET) surface area analysis, diffuse reflectance ultraviolet-visible (UV-Vis) spectroscopy, impedance spectroscopy (IS), and active cathode performance of LIBs and SIBs were carried out.

2. Results and Discussion

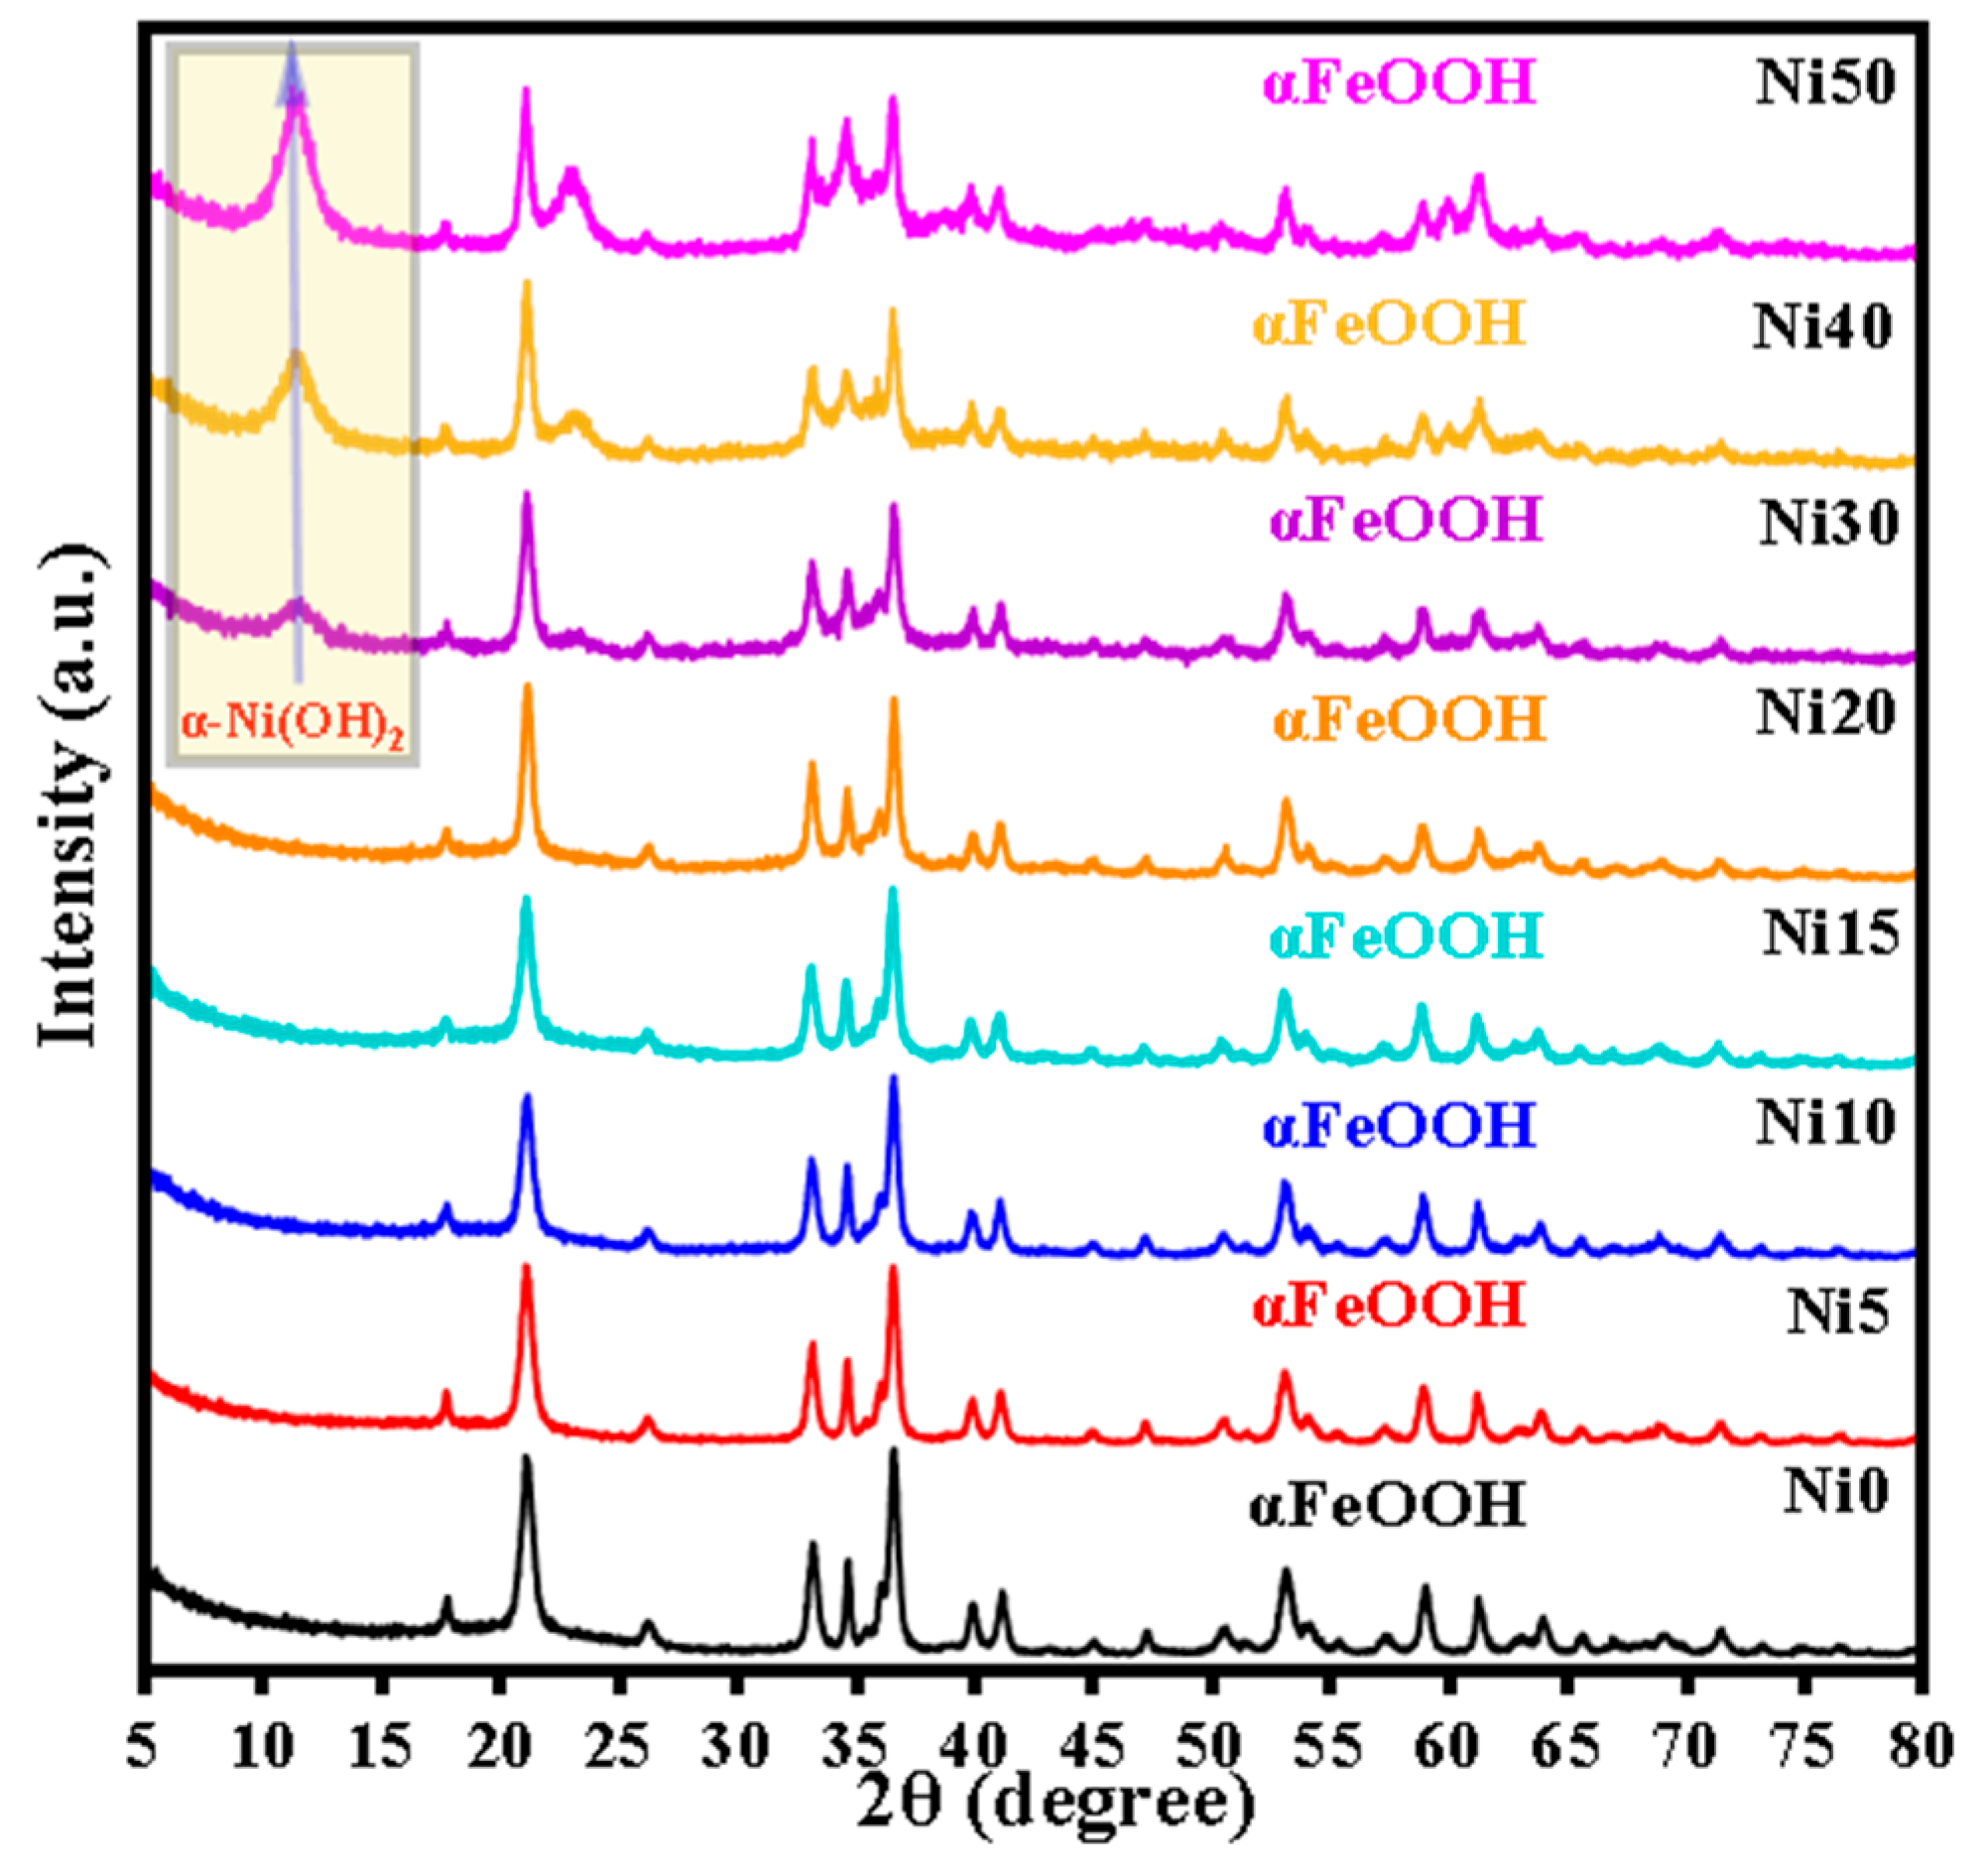
2.1. XRD Patterns of α-NixFe1−xOOH NPs

Figure 1 shows the XRD patterns of Ni0, Ni5, Ni10, Ni15, Ni20, Ni30, Ni40, and Ni50 samples. The XRD peaks of goethite (ICDD card No. 00-029-0713) with the space group (Pbnm) were observed in all XRD patterns with increasing Ni content. Moreover, a new peak appeared at 2θ = 11.56° corresponding to the (0 0 3) plane of α-Ni(OH)2 crystalline phase (ICDD card No.01-076-6904) with the space group (R3m: H), and the intensity of this peak increased with the increasing x content from 0.30 to 0.50, as shown in the yellow rectangle in Figure 1. The percentage of the α-Ni(OH)2 crystalline phase increased from 7.63% to 9.35% while ‘x’ increased from 0.30 to 0.50, as shown in Table 1. Additionally, the elevation of background intensity observed in the XRD patterns depicted in Figure 1, as the Ni content increased from 0.30 to 0.50, suggests the appearance of an amorphous Ni hydroxide phase. The diffraction lines of α-FeOOH were slightly shifted towards lower 2θ values with the increasing Ni content, implying a minor expansion in the unit cell due to Ni/Fe substitution. The unit cell parameters of goethite in the Ni0, Ni5, Ni10, Ni15, Ni20, Ni30, Ni40, and Ni50 samples obtained by Rietveld refinement of the XRD patterns are listed in Table 1. The slight variation in ionic radius between Fe3+ (0.645 Å) and Ni2+ (0.69 Å) [16] ions caused a small expansion of the unit cell of α-FeOOH. In line with the previous studies [17,18], it was observed that the expansion along the b-axis direction was most remarkable. The non-uniform expansion is likely to be attributed to different distortions in the octahedral sites occupied by Ni2+ and Fe3+ ions, stemming from their disparate electron configurations (3d8 and 3d5, respectively). The incorporation of Ni into α-FeOOH can be attributed partially to its incongruent release from the initial Fe-Ni hydroxide (Ni-ferrihydrite) [19]. The calculated average size of α-NixFe1−xOOH NPs by the Scherrer equation from the FWHM of the (110) diffraction line is summarized in Table 1.

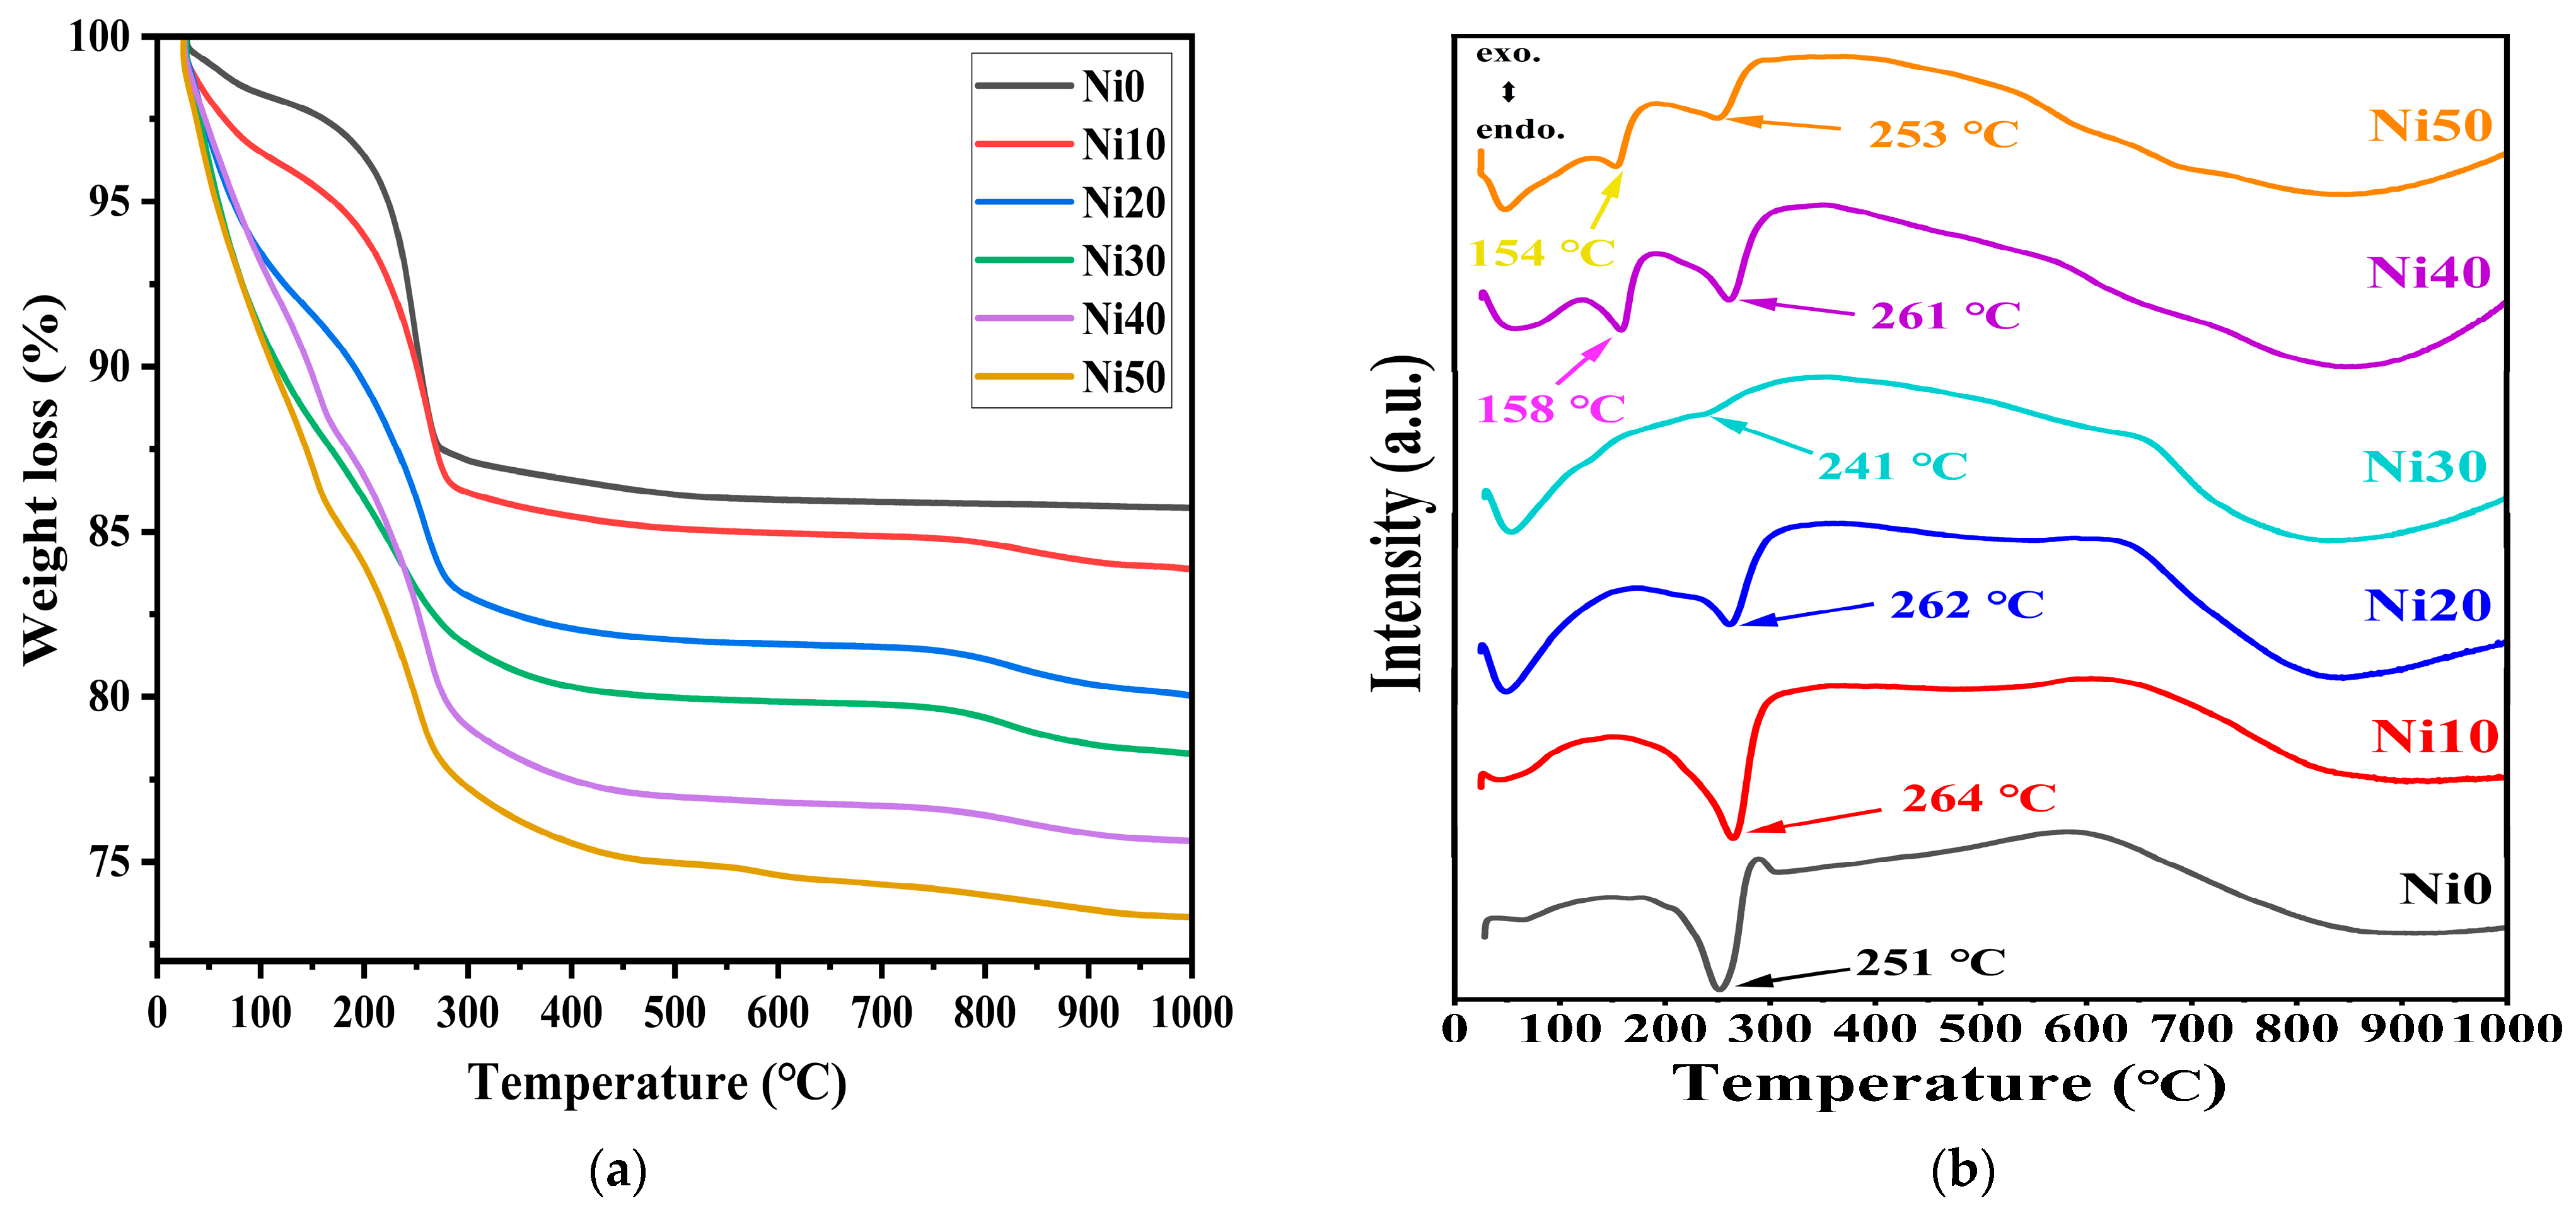
2.2. Thermogravimetric and Differential Thermal Analysis (TG-DTA) of α-NixFe1−xOOH

Thermogravimetric (TG) and differential thermal analysis (DTA) curves for NixFe1−xOOH NPs with ‘x’ 0, 0.10, 0.20, 0.30, 0.40, and 0.50 are shown in Figure 2a,b, respectively. The weight loss at temperatures up to approximately 140 °C corresponds to the release of H2O molecules adsorbed on the surface of NixFe1−xOOH NPs crystals or trapped within the interstitial spaces between them [19,20]. This low-temperature weight loss increased in the NixFe1−xOOH NPs samples with the increased Ni content, which can be explained by more adsorbed water in the NiFeOOH NPs samples with a large surface area [20]. Furthermore, different molar fractions of incorporated Ni2+ ions and different crystal facets in Ni-doped NixFe1−xOOH NPs crystals can also affect the amount of adsorbed water in NixFe1−xOOH NPs samples. The weight loss at temperatures between approximately 150 and 290 °C can be attributed to the dehydroxylation of the surface hydroxyl groups [18,19,20]. This weight loss also increases in the NixFe1−xOOH NPs with a higher Ni content due to the larger surface area. The total weight loss percentage for NixFe1−xOOH NPs in the temperature range from RT to 1000 °C increased when the Ni content increased, from 14.24% in Ni0 to 26.63% in Ni50, as shown in Figure 2a.
Figure 2b shows the DTA curves of the NixFe1−xOOH NPs with ‘x’ 0, 0.10, 0.20, 0.30, 0.40, and 0.50. The DTA curve of NixFe1−xOOH NPs showed a single endothermic peak in the temperature range from 230–300 °C due to the phase transformation from α-FeOOH to α-Fe2O3 [18,19]. As the amount of Ni increased from 0 to 20 mol%, the endothermic peak became smaller and somewhat shifted to higher temperatures from 251 °C in Ni0 to 262 °C in Ni20, while in Ni30, it shifted in the opposite direction and was observed at 241 °C. The intensity of the endothermic peak of Ni30 was highly diminished compared to the rest of the samples. It seems to be related to the appearance of a second minor α-Ni(OH)2 crystalline phase in Ni30, see Figure 1. As the Ni increases, a new endothermic peak appears in Ni40 and Ni50 at lower temperatures 150–200 °C, caused by the lower degree of crystallinity or the increased amorphous phase [19], in addition to the resolved second one at 250–260 °C. These results agree with the XRD data (see Figure 1 and Table 1).

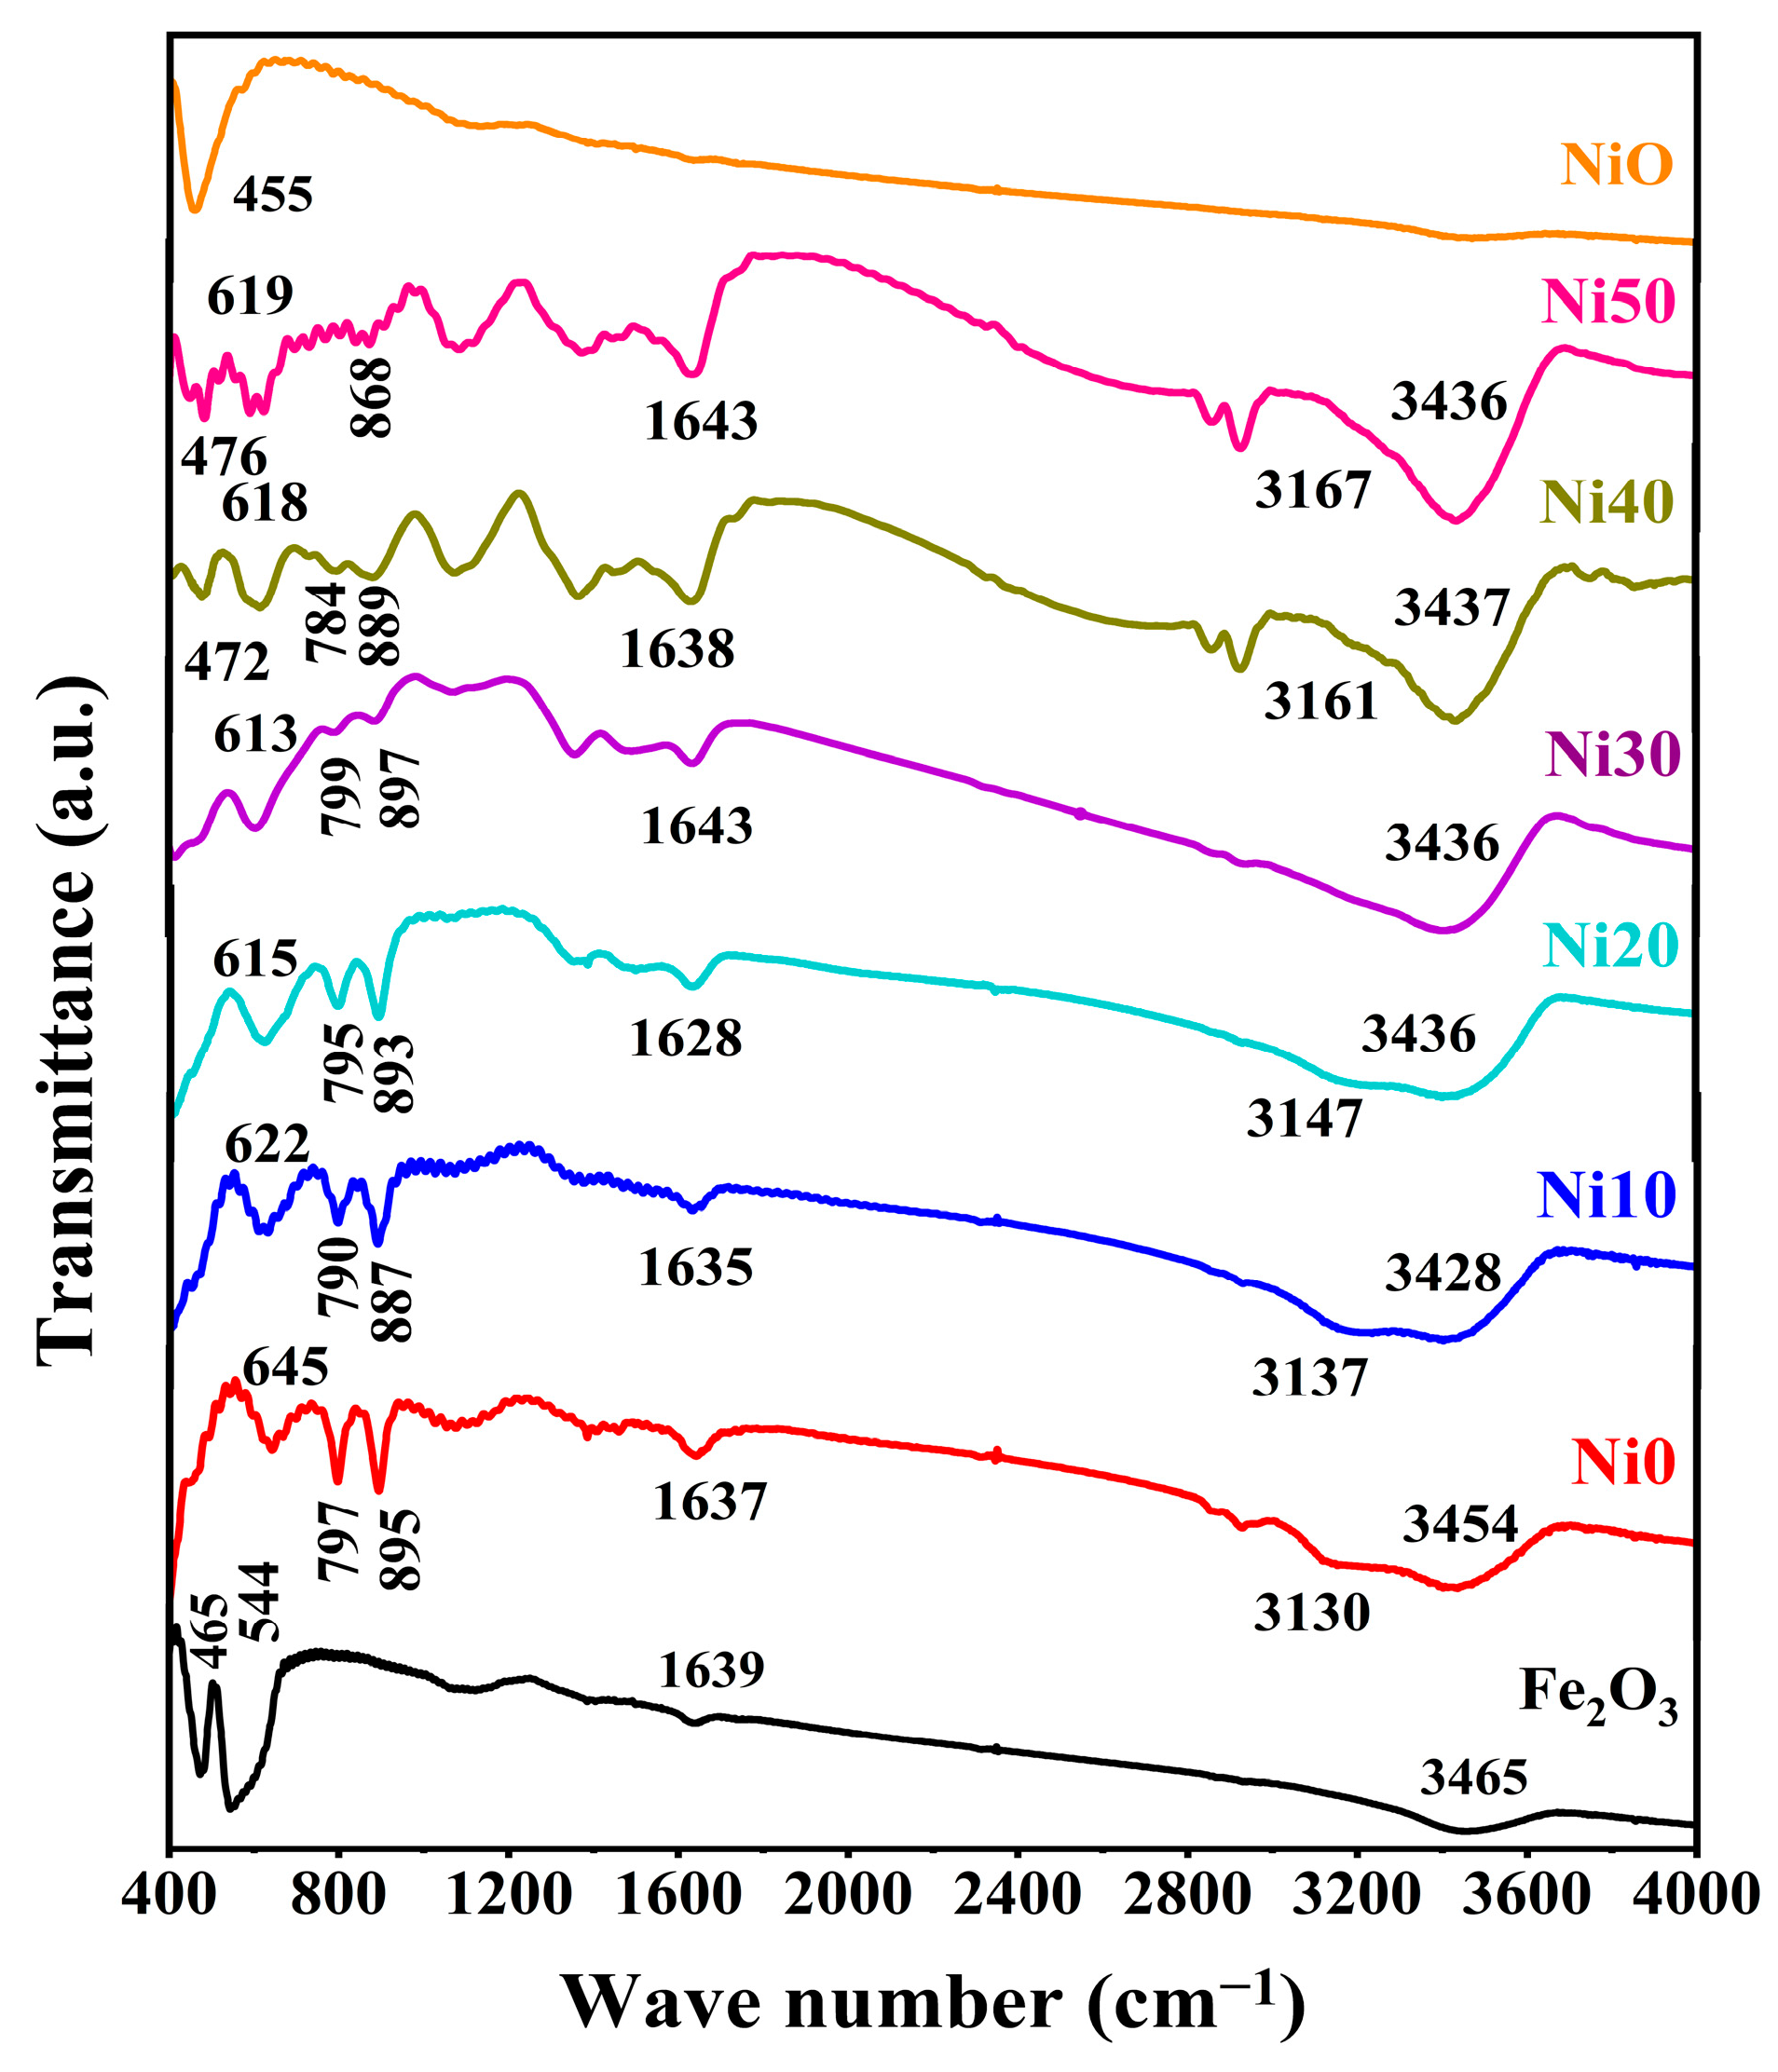
2.3. FTIR Spectra of α-NixFe1−xOOH NPs

The FTIR spectra of NixFe1−xOOH NPs with ‘x’ 0, 0.10, 0.20, 0.30, 0.40, and 0.50, and Fe2O3 and NiO as standard reference materials, carried out in the wave number range of 400–4000 cm−1, are shown in Figure 3. The transmission band showed approximately 3454 cm−1 ascribed to -OH [21] in Ni0 and shifted to a lower wave number, and the peak intensity increased with the increasing Ni content. The small transmission peak observed at 3130 cm−1 corresponds to the O-H stretching vibration of the hydroxyl group [18,22]. The band centre of the hydroxyl group gradually shifts to a higher wave number, and the peak intensity decreases with the increasing Ni content, as shown in Figure 3. The intense two transmission peaks were observed at 797 cm−1 and 895 cm−1 related to the Fe-O-H bending vibrations out of plane and in plane [17,18,19,22], respectively. The intensity of both transmission peaks gradually decreased with the Ni content. These two bands slightly shifted towards higher wave numbers with up to 30 mol% Ni content, and with high Ni content (40 and 50 mol%), the centre of these bands changed to lower wave numbers. It is known that the bending bands’ positions depend on the crystallinity degree and the transition metal substituted with Fe [17,22]. In this study, Ni substituted with Fe caused a shift toward lower wave numbers with the increasing Ni content from Ni0 to Ni30, while in Ni40 and Ni50, an increase in particle size caused a change to a higher wave number. These results agree with XRD and DTA (see Figure 1 and Figure 2). The transmission band was observed at 645 cm−1 in pure-FeOOH due to Fe-O symmetric stretching [22], and the band centre gradually shifted to a lower wave number with the increasing Ni content from 0 to 0.5. A new transmission peak appeared in higher Ni concentration samples (Ni40 and Ni50) at 472 and 476 cm−1, respectively. It was noted that the recent peak compared with that shown in the FTIR spectrum of NiO can be attributed to Ni-O [23]. The small transmission bands located at 1639 cm−1 in Fe2O3 are due to the stretching vibration of -OH from the absorbed water [21,23,24]. Furthermore, this peak showed in NixFe1−xOOH NPs at 1639 cm−1 in Ni0 and slightly shifted to 1643 cm−1, and the peak intensity gradually increased with the increasing Ni content.

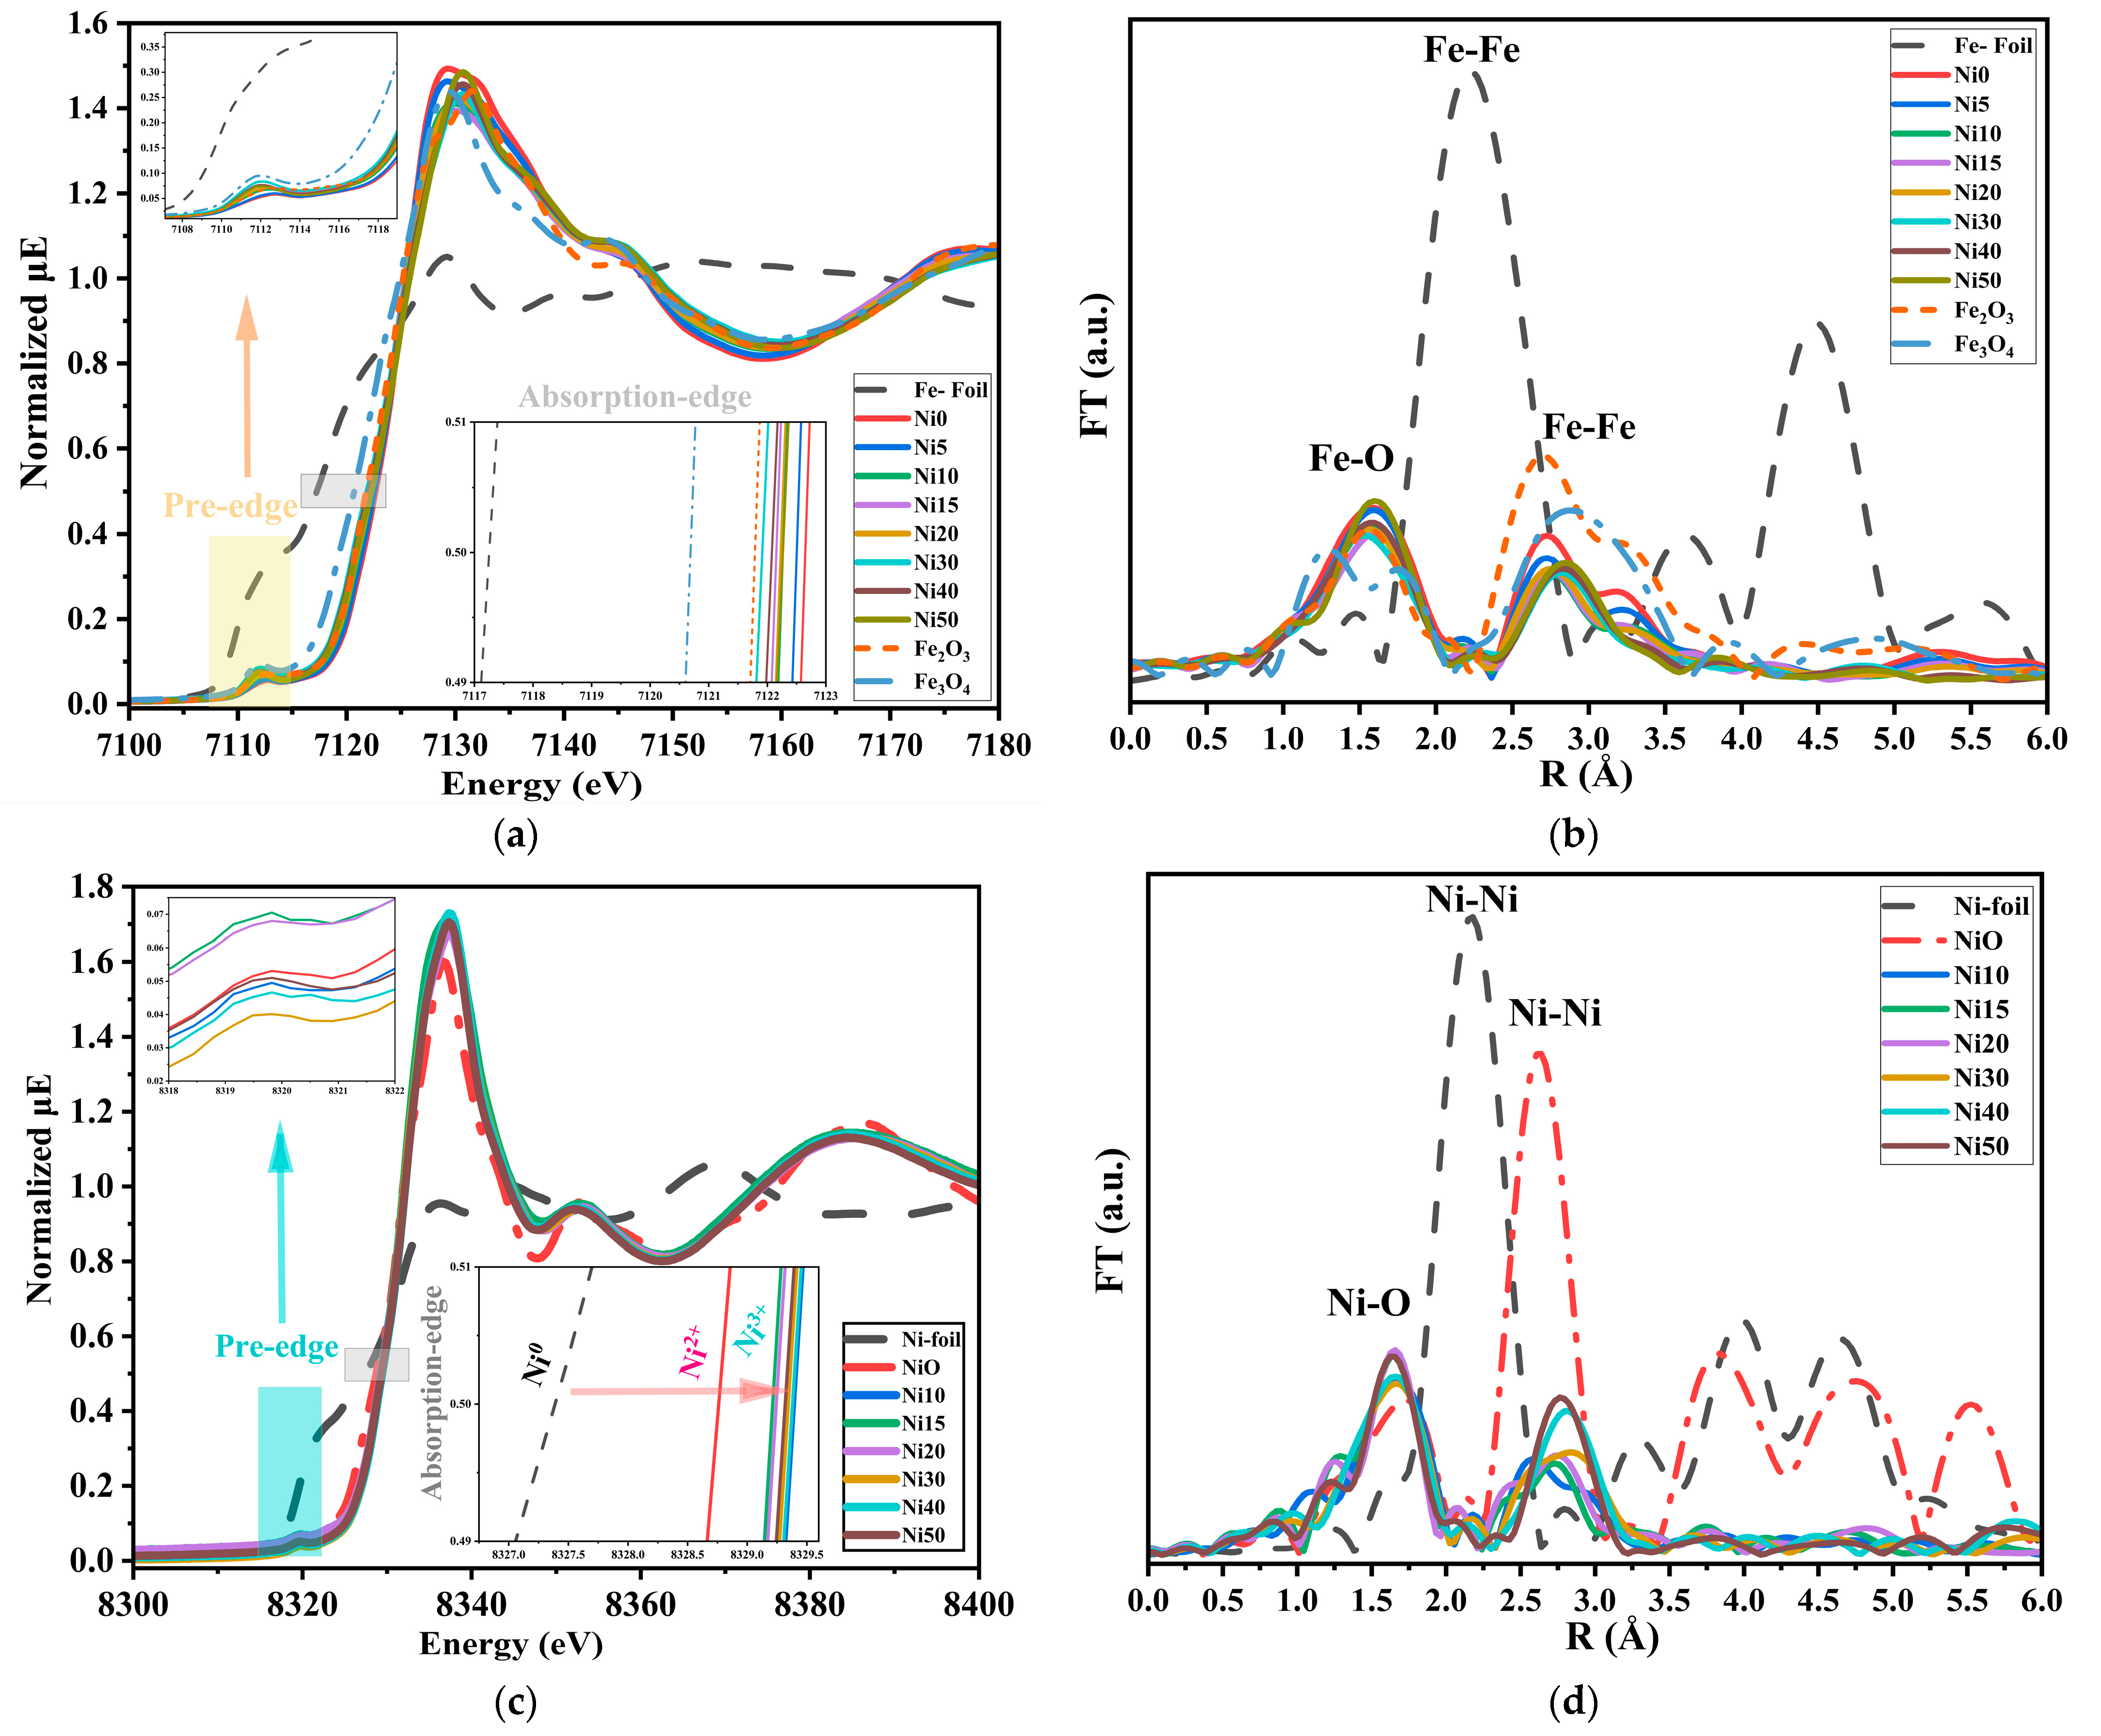
2.4. XAFS Spectra of α-NixFe1−xOOH NPs

The XAFS and EXAFS measurements are powerful tools for investigating the local atomic and electronic properties of materials, providing a comprehensive understanding of their structure and reactivity [25,26].
Figure 4 shows the XANES spectra and Fourier transforms of Fe-/Ni-K-edges of α-NixFe1−xOOH NPs with ‘x’ 0, 0.05, 0.10, 0.15, 0.20, 0.30, 0.40, and 0.50 and Fe foil, Fe3O4, and α-Fe2O3 as standard materials in the Fe K-edge and with ‘x’ from 0.10, 0.15, 0.20, 0.30, 0.40, and 0.50 and Ni-foil and NiO as reference materials at the Ni K-edge.
Figure 4a displays the normalized Fe K-edge XAFS spectra of α-NixFe1−xOOH NPs. The Fe K absorption edge was observed at a normalized intensity = 0.5 for Fe-foil, Fe3O4, and Fe2O3 being 7117.26 ± 0.02, 7120.67 ± 0.02, and 7121.79 ± 0.02 eV, respectively. The oxidation state in Fe-foil, Fe3O4, and α-Fe2O3 is 0, 2.66, and 3, respectively. The absorption edge of α-NixFe1−xOOH NPs was observed at 7122.65 ± 0.01, 7122.49 ± 0.01, 7122.27 ± 0.01, 7122.15 ± 0.01, 7122.23 ± 0.01, 7121.91 ± 0.01, 7122.08 ± 0.01, and 7122.28 ± 0.01 with ‘x’ 0, 0.05, 0.10, 0.15, 0.20, 0.30, 0.40, and 0.50, respectively, as shown in the insert figure in Figure 4a. The increasing oxidation state of Fe results in a shift of the absorption edge to higher energy [27]; according to the above, the values of the absorption edge of α-NixFe1−xOOH NPs are higher than the values of Fe2O3 (Fe3+), this implies that none of the α-NixFe1−xOOH NPs samples contained Fe2+, and they contained only Fe3+. The pre-edge peak was found at 7113 eV for α-NixFe1−xOOH NPs and at 7114 eV for both Fe-foil and Fe2O3, being designated as the absorption edge. The pre-edge features in the XANES spectrum reveal electronic states and symmetry of the unoccupied orbitals in the absorbing atom [27,28]. Analyzing the intensity, energy position, and shape of pre-edge peaks helps understand the electronic structure, oxidation state, and local environment of Fe atoms in the material [29]. The intensity of the pre-edge peak is lower when the octahedral site has high symmetry. α-FeOOH with the octahedral structure of FeO6 shows an increase in the pre-edge peak intensity and, therefore, a decrease in symmetry with the increasing Ni content.
Figure 4c displays the normalized Ni K-edge XANES spectra of NixFe1−xOOH NPs with ‘x’ 0.10, 0.15, 0.20, 0.30, 0.40, and 0.50 and Ni-foil and NiO as reference materials. The pre-edge peak of Ni foils, NiO, and NixFe1−xOOH NPs was shown at 8321.40, 8319.68, and 8319.48 eV, respectively [30]. The height of the pre-edge peak intensity of NiO and NixFe1−xOOH NPs has approximately the same value, and the change in the pre-edge is minimal. Therefore, we cannot find any significant difference in the oxidation state of Ni and the symmetry of the structure [31].
In contrast, the Ni-K normalized absorption peak of NixFe1−xOOH NPs and reference materials are shown in the inserted figure in Figure 4c. The absorption edge of Ni-foil, NixFe1−xOOH NPs, and NiO is at 8327.40, (8329.21–8329.48), and 8328.76 eV, respectively. According to the absorption edge’s higher value compared to NiO, the oxidation state of Ni in all NixFe1−xOOH NPs samples is higher than +2. Both Ni15 and Ni20 are samples containing less Ni3+, while Ni10 has the highest level of Ni3+.
Figure 4b shows the Fourier transform of Fe-K-edge EXAFS (FT-EXAFS) for α-NixFe1−xOOH NPs. The FT-EXAFS of α-NixFe1−xOOH NPs, in the first coordination, was observed at 1.57 Å, and the peak intensity decreased with the increasing ‘x’ from 0.10 to 0.50, and this peak could be attributed to Fe-O [29,30]. Moreover, the second peak of Fe-foil, Fe3O4, and Fe2O3 was shown at 2.21 Å, 2.91 Å, and 2.68 Å, respectively. The second peak of NixFe1−xOOH NPs was also shown between the Fe2O3 and Fe3O4. Furthermore, this peak was shifted to a higher Fe-Fe distance, and the peak intensity decreased by reducing the Fe content from 1 to 0.50. All observed peaks in this range (2.21–2.91) Å are attributed to Fe-Fe (or Fe-Ni) [32,33].
Figure 4d shows the Ni-K FT-EXAFS of NixFe1−xOOH NPs, and it was clear that the two peaks at 1.63 Å and 2.77 Å can be attributed to Ni-O and Ni-Me (Me = Ni or Fe), respectively [33,34,35]. The first peak was moved to a higher distance between Ni and O 1.75 Å, but the second peak shifted to a lower Ni-Me distance of 2.62 Å for NixFe1−xOOH NPs [35]. The intensity of the first peak decreased, and the peak position was moved to a higher radius with the increasing Ni content. These results obtained from Ni-K and Fe-K FT-EXAFS and XANES of the NixFe1−xOOH NPs agree with the XRD results.

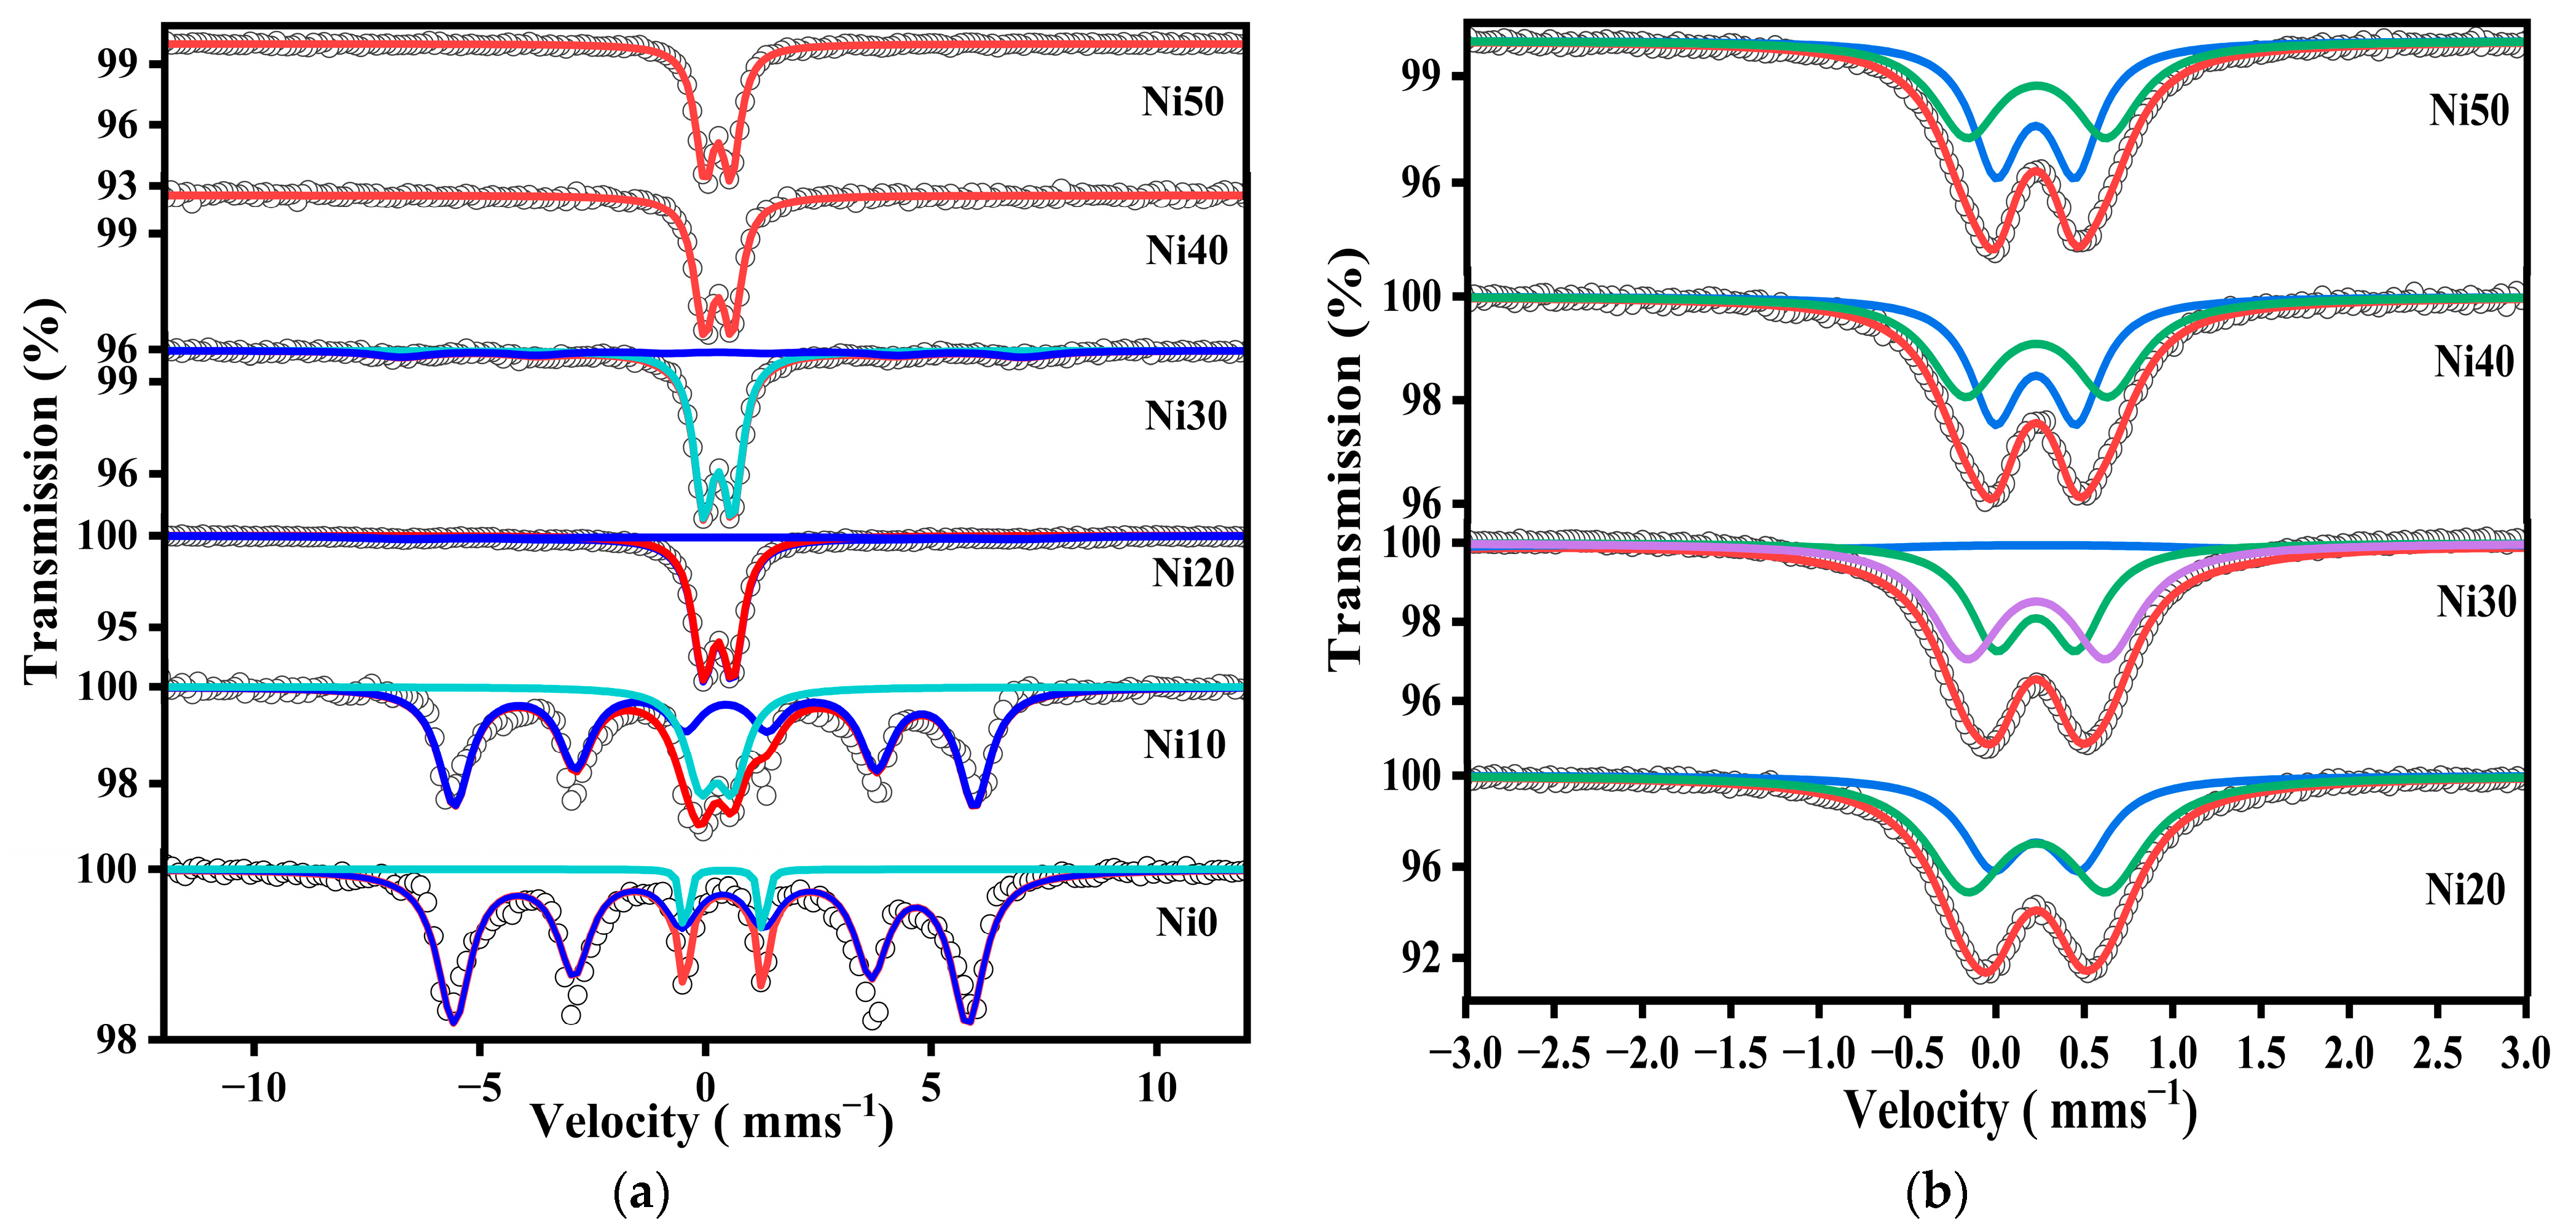
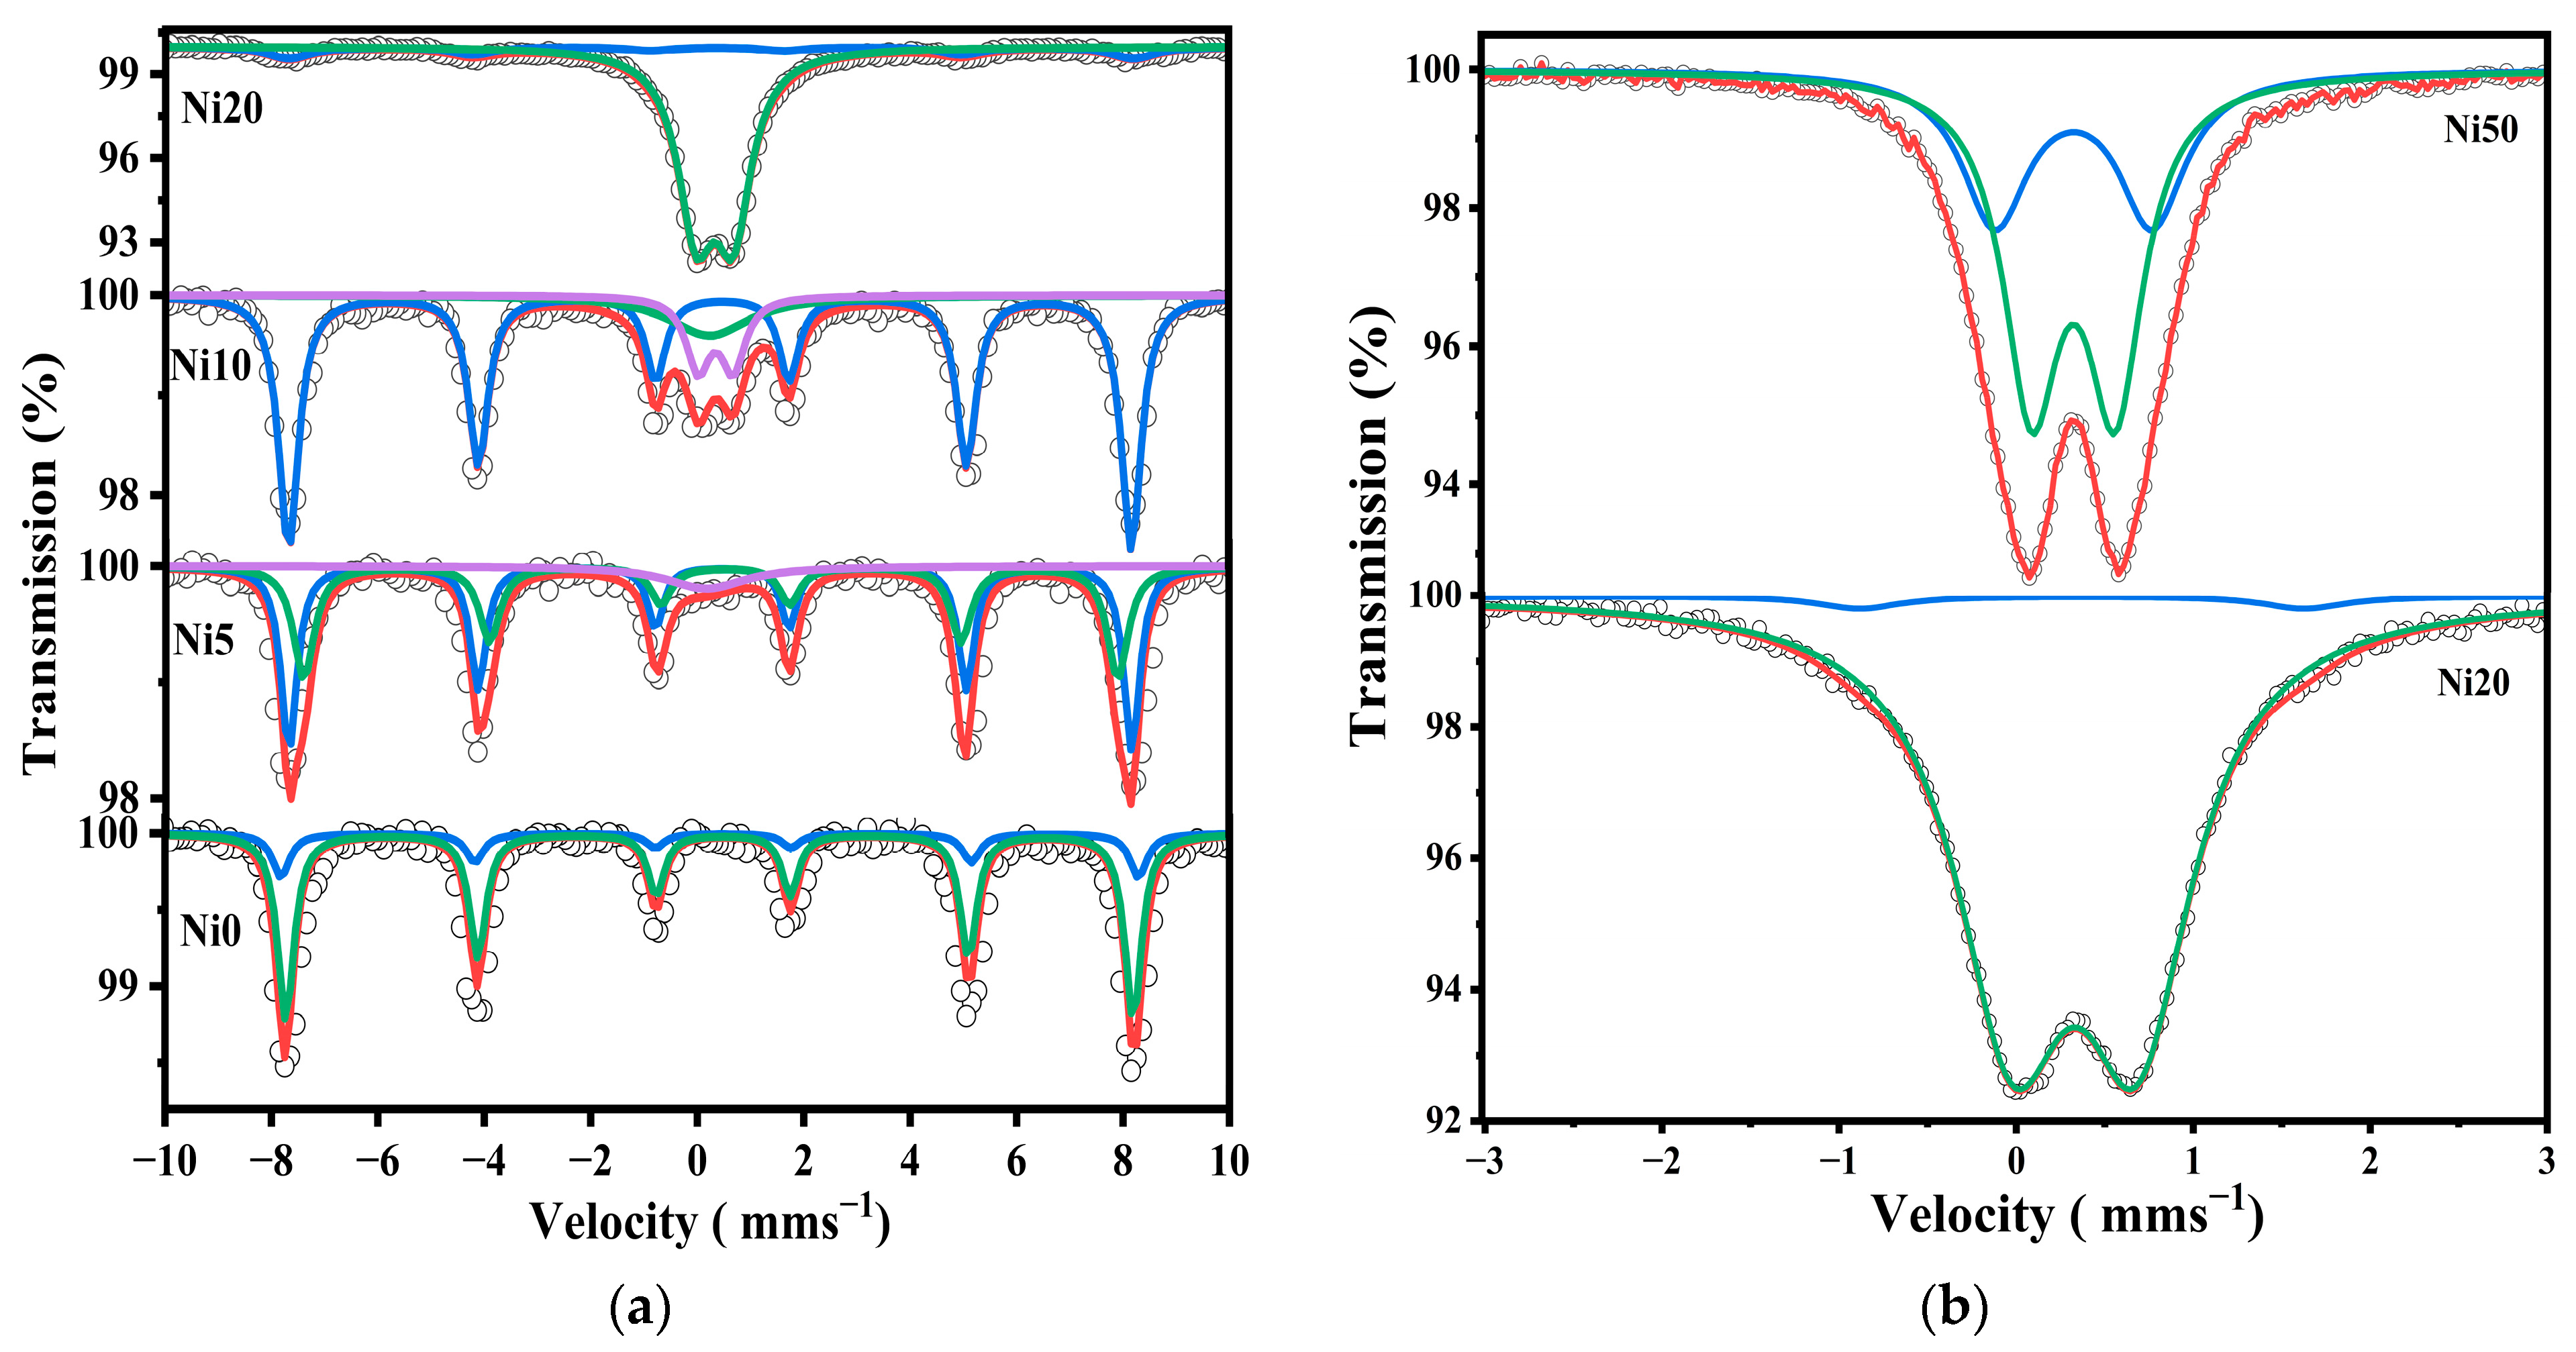
2.5. 57Fe-Mössbauer Spectra of α-NixFe1−xOOH NPs

Figure 5 shows the 57Fe-Mössbauer spectra of α-NixFe1−xOOH NPs ‘x’ from 0.00 to 0.50 measured at RT in the velocity range from 12 mm s−1 to −12 mm s−1 and from 3 mm s−1 to −3 mm s−1. The Mössbauer parameters in these two velocity ranges are listed in Table 2 and Table 3. Figure 5a shows the 57Fe-Mössbauer spectra of Ni0, Ni10, Ni20, Ni30, Ni40, and Ni50 measured at RT in the wide velocity range from 12 mm s−1 to −12 mm s−1. The Mössbauer spectra exhibit a sextet with Mössbauer parameters characteristic of α-NixFe1−xOOH NPs ‘x’ from 0.00 to 0.30 as the predominant component, while the sextet disappeared after increasing the Ni content to 0.30. The α-FeOOH NPs and α-NixFe1−xOOH NPs spectra were analyzed by incorporating the hyperfine magnetic distribution (Bhf); their average values are presented in Table 2. The slight changes in isomer shift, except for the Ni0 sample, indicate that the site is distorted goethite, as shown in Table 2. Moreover, the presence of a quadrupole doublet, which increases as the Ni content increases, can be ascribed to the presence of Fe3+ ions in a low-crystalline or amorphous phase. This phase could be attributed to compounds such as Ni-Fe hydroxide, low crystalline Ni-ferrite, or Ni-goethite. The higher proportion of the low-crystalline or amorphous phase aligns with the increased background observed in the XRD patterns, as depicted in Figure 1. Moreover, the line width value increased from 0.196 to 0.53 mm s−1, possibly confirming the result obtained from XRD, wherein the amorphous phases increased with the increasing Ni content. In addition, the particle size of the goethite drops to a nano-scale, and the superparamagnetic component increases as a function of the increasing Ni content [11,14,15]. The presence of the doublet suggests nanosized goethite particles in Ni40 and Ni50. To analyze the doublet component of the Mössbauer spectra of Ni20, Ni30, Ni40, and Ni50 measured at RT in the wide velocity range for more detail, a narrower velocity range from 3 mm s−1 to −3 mm s−1 was applied, and the spectra are presented in Figure 5b. One doublet shown in the Ni20, Ni30, Ni40, and Ni50 spectra in the wide velocity range from 12 mm s−1 to −12 mm s−1 was analyzed as a doublet component. The two doublets were considered to be derived from the superparamagnetic and amorphous (or ferrihydrite) components [15].
On the other hand, the Mössbauer spectra of Ni0, Ni5, Ni10, and Ni20 were measured in the range of velocity from 12 mm s−1 to −12 mm s−1 at 86 K, as shown in Figure 6a. Goethite was present in all spectra, and a doublet derived from amorphous (or ferrihydrite) is also present in Ni10 and Ni20. Additionally, the Mössbauer spectra of Ni20 and Ni50 were measured in a narrower range, as shown in Figure 6b and Table S1.
A sextet of FeOOH and a doublet of amorphous (ferrihydrite) were present in Ni20, and Ni50 had two doublets derived from ferrihydrite and a superparamagnetic phase. These results are in good agreement with the XRD and XAFS measurements, as shown in Figure 1 and Figure 4. From Table S2, the quadrupole splitting of the doublet derived from amorphous or ferrihydrite increased from 0.70 mm s−1 for Ni20 to 0.89 mm s−1 for Ni50. Therefore, it is considered that amorphous ageing is progressing, and ferrihydrite is being formed [17,19]. This is consistent with the fact that Ni50 has a specific surface area lower than Ni20, as was shown by BET analysis [35]. In addition, sample Ni20 contains goethite and an amorphous phase, while sample Ni50 also contains crystalline α-Ni(OH)2, which is a possible reason for the lower surface area. The Mössbauer parameter spectra of Ni10 and Ni20 were measured at low temperatures from 20 K to 300 K, as shown in Figure S1, and the Mössbauer parameters of Ni10 and Ni20 are summarized in Tables S3 and S4.
As shown in Table 2, the Mössbauer parameters measured at room temperature indicated a sextet and a doublet related to goethite and the superparamagnetic phase. Furthermore, the doublet shown at RT is divided into two doublets related to the superparamagnetic and amorphous phases. Additionally, with the decreasing temperature from 300 K to 20 K, the doublets disappeared in both samples Ni10 and Ni20.

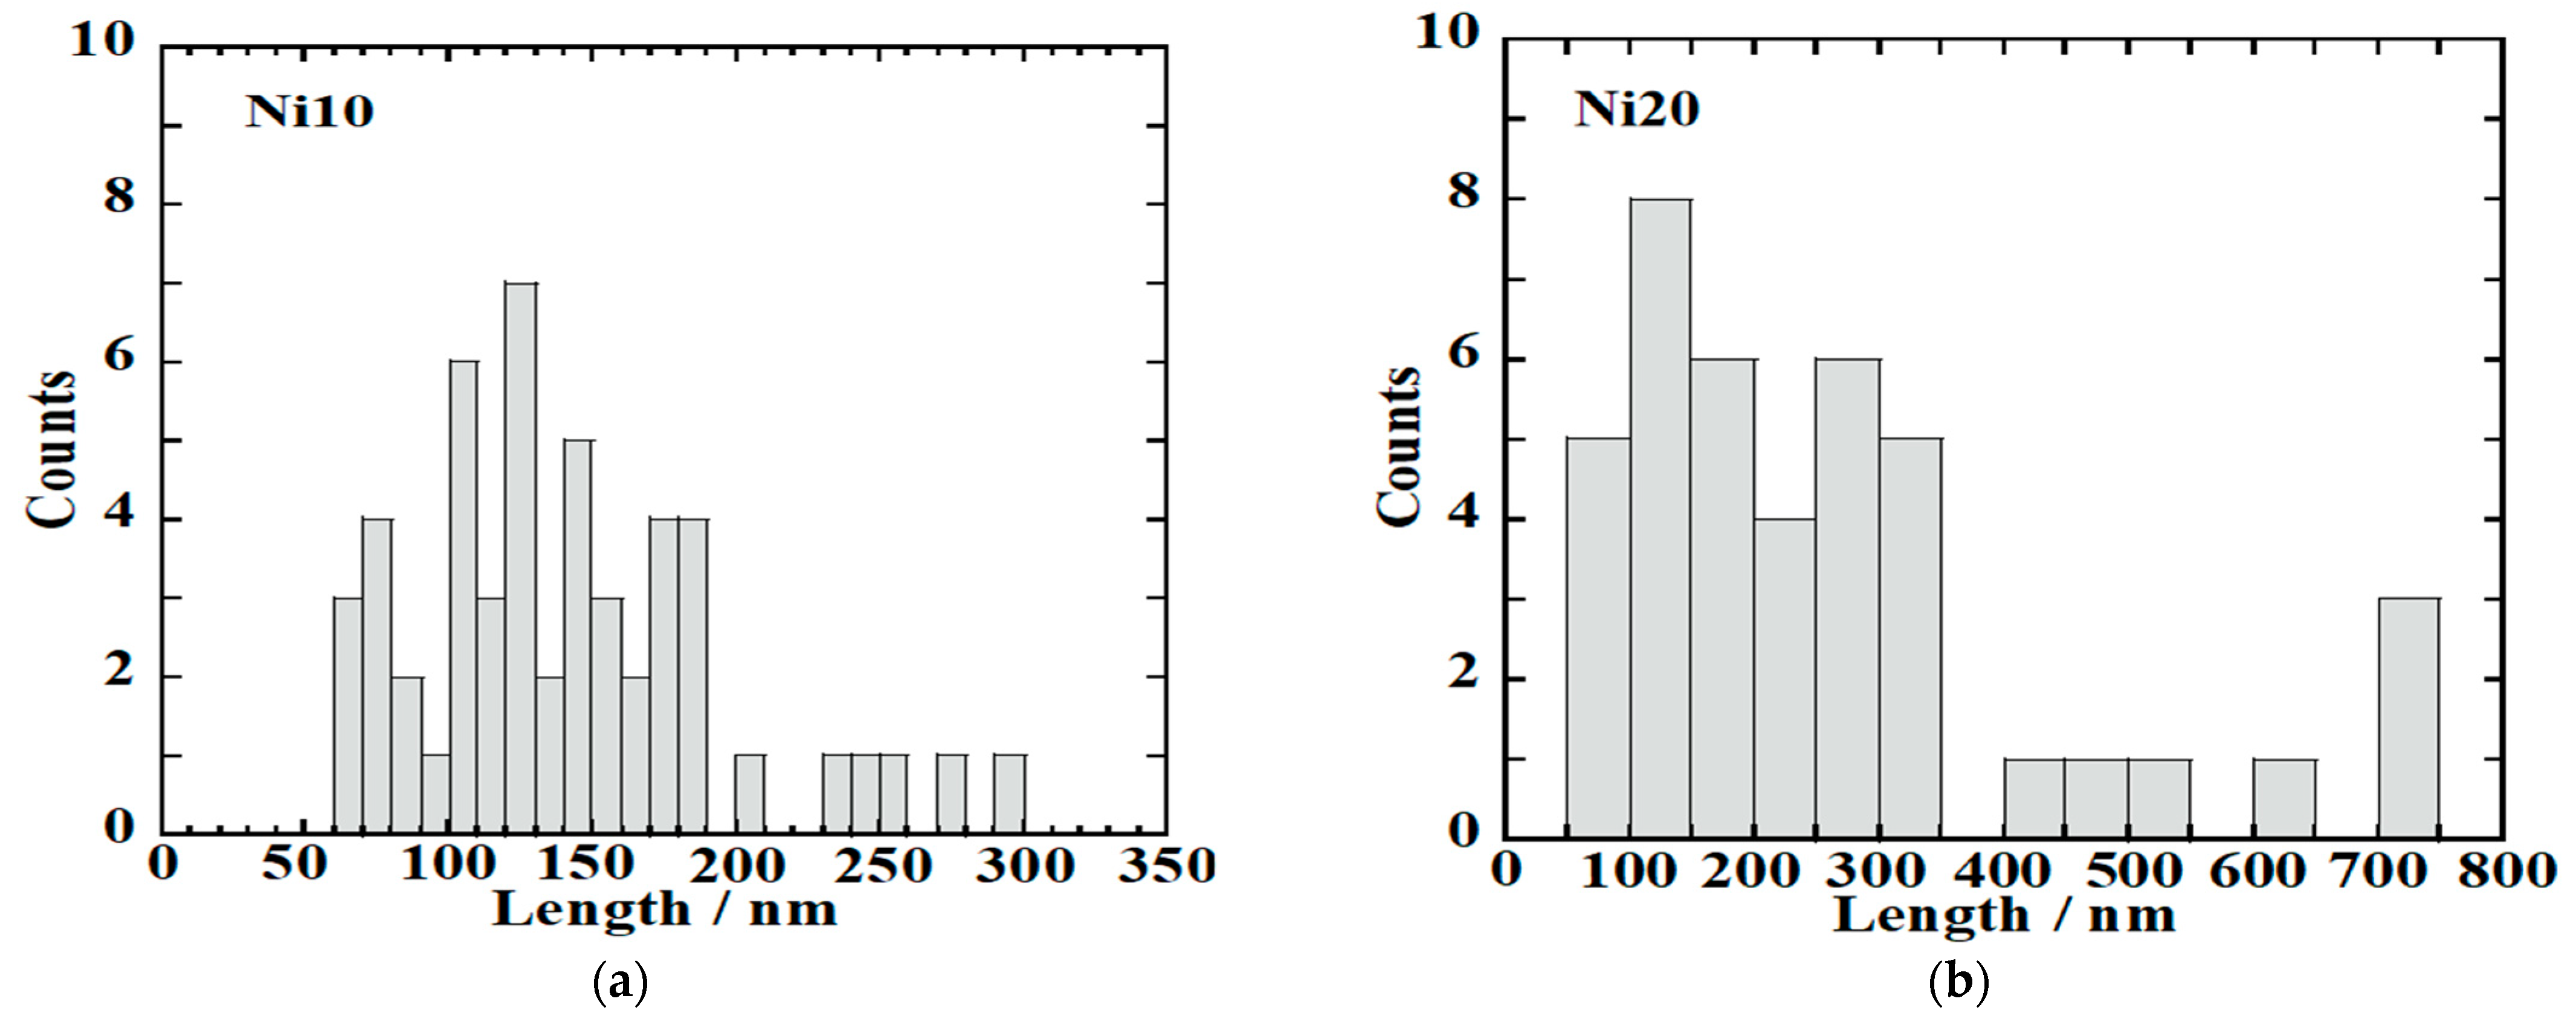
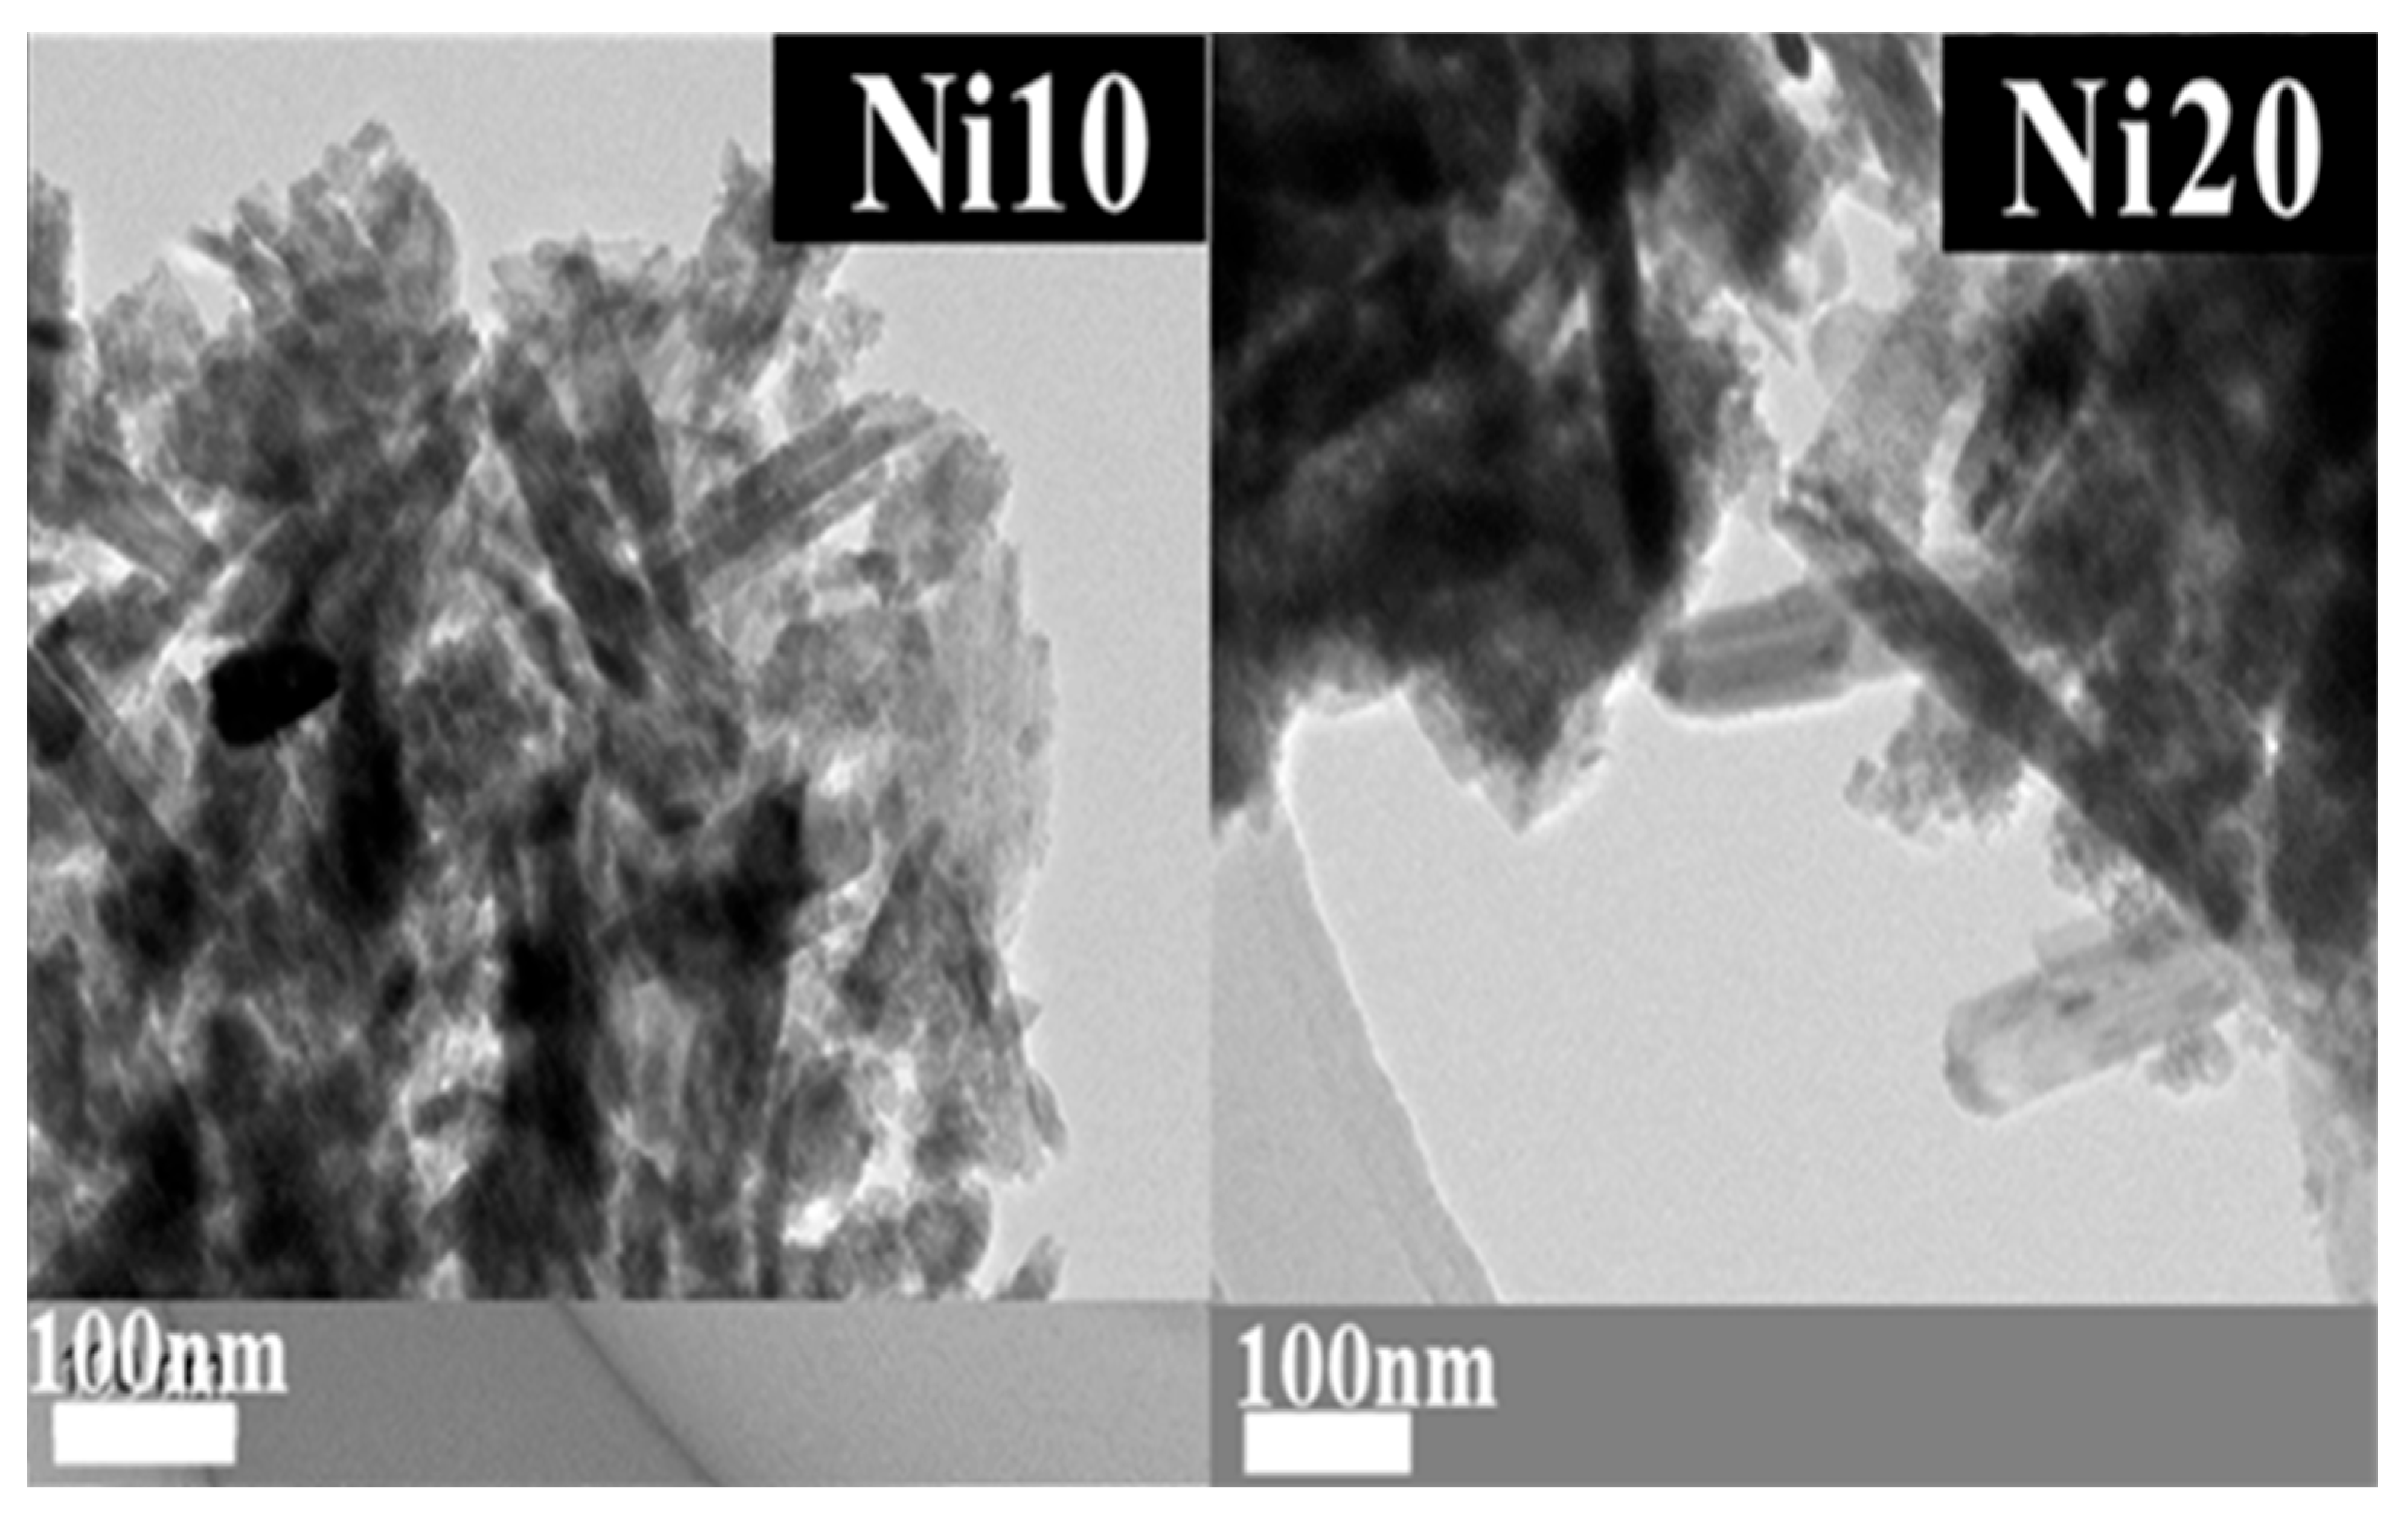
2.6. TEM Observation of α-NixFe1−xOOH NPs

The structural details revealed through X-ray diffraction (XRD) patterns, 57Fe-Mössbauer spectroscopy, as well as the X-ray absorption fine structure (XAFS) spectra of α-NixFe1−xOOH NPs, closely correspond to the morphology and porosity evaluated via transmission electron microscopy (TEM) observations and the BET and BJH measurements. The average length, width, and ratio (length/width) of α-NixFe1−xOOH NPs are evaluated from the TEM images in Figure 7, and the results are listed in Table 4. In addition, the histograms of particle length are shown in Figure 8. It was found that the average length (c-axis direction), average width (b-axis direction), and average ratio (length/width) of Ni0 are 181 ± 83 nm, 21.6 ± 6.6 nm, and 9.6 ± 6.5 nm, respectively [14].
From Figure 8a, it was found that the average length (c-axis direction), average width (b-axis direction), and average ratio (length/width) of Ni10 are 141 ± 54 nm, 33.2 ± 11.2 nm, and 4.6 ± 2.0 nm.
From Figure 8b, it was found that the average length (c-axis direction), average width (b-axis direction), and average ratio (length/width) of Ni20 are 263 ± 179 nm, 42.9 ± 13.9 nm, and 6.3 ± 3.6 nm. Ni10 forms nanorods that are shorter in length and wider in width than Ni0. Ni20 has the longest length and widest width. However, the variation in length is also large for Ni20, containing nanorods with both a length of over 700 nm and those with a length of only a few dozen nm. While in Ni0 in the image, only pure goethite nanorods can be seen, Ni10 and Ni20 show the presence of low crystalline as well as nanorods. The low crystalline material is thought to originate from ferrihydrite or amorphous by the Mössbauer spectra results. The low crystalline material also seems to change the amount of the specific surface area.

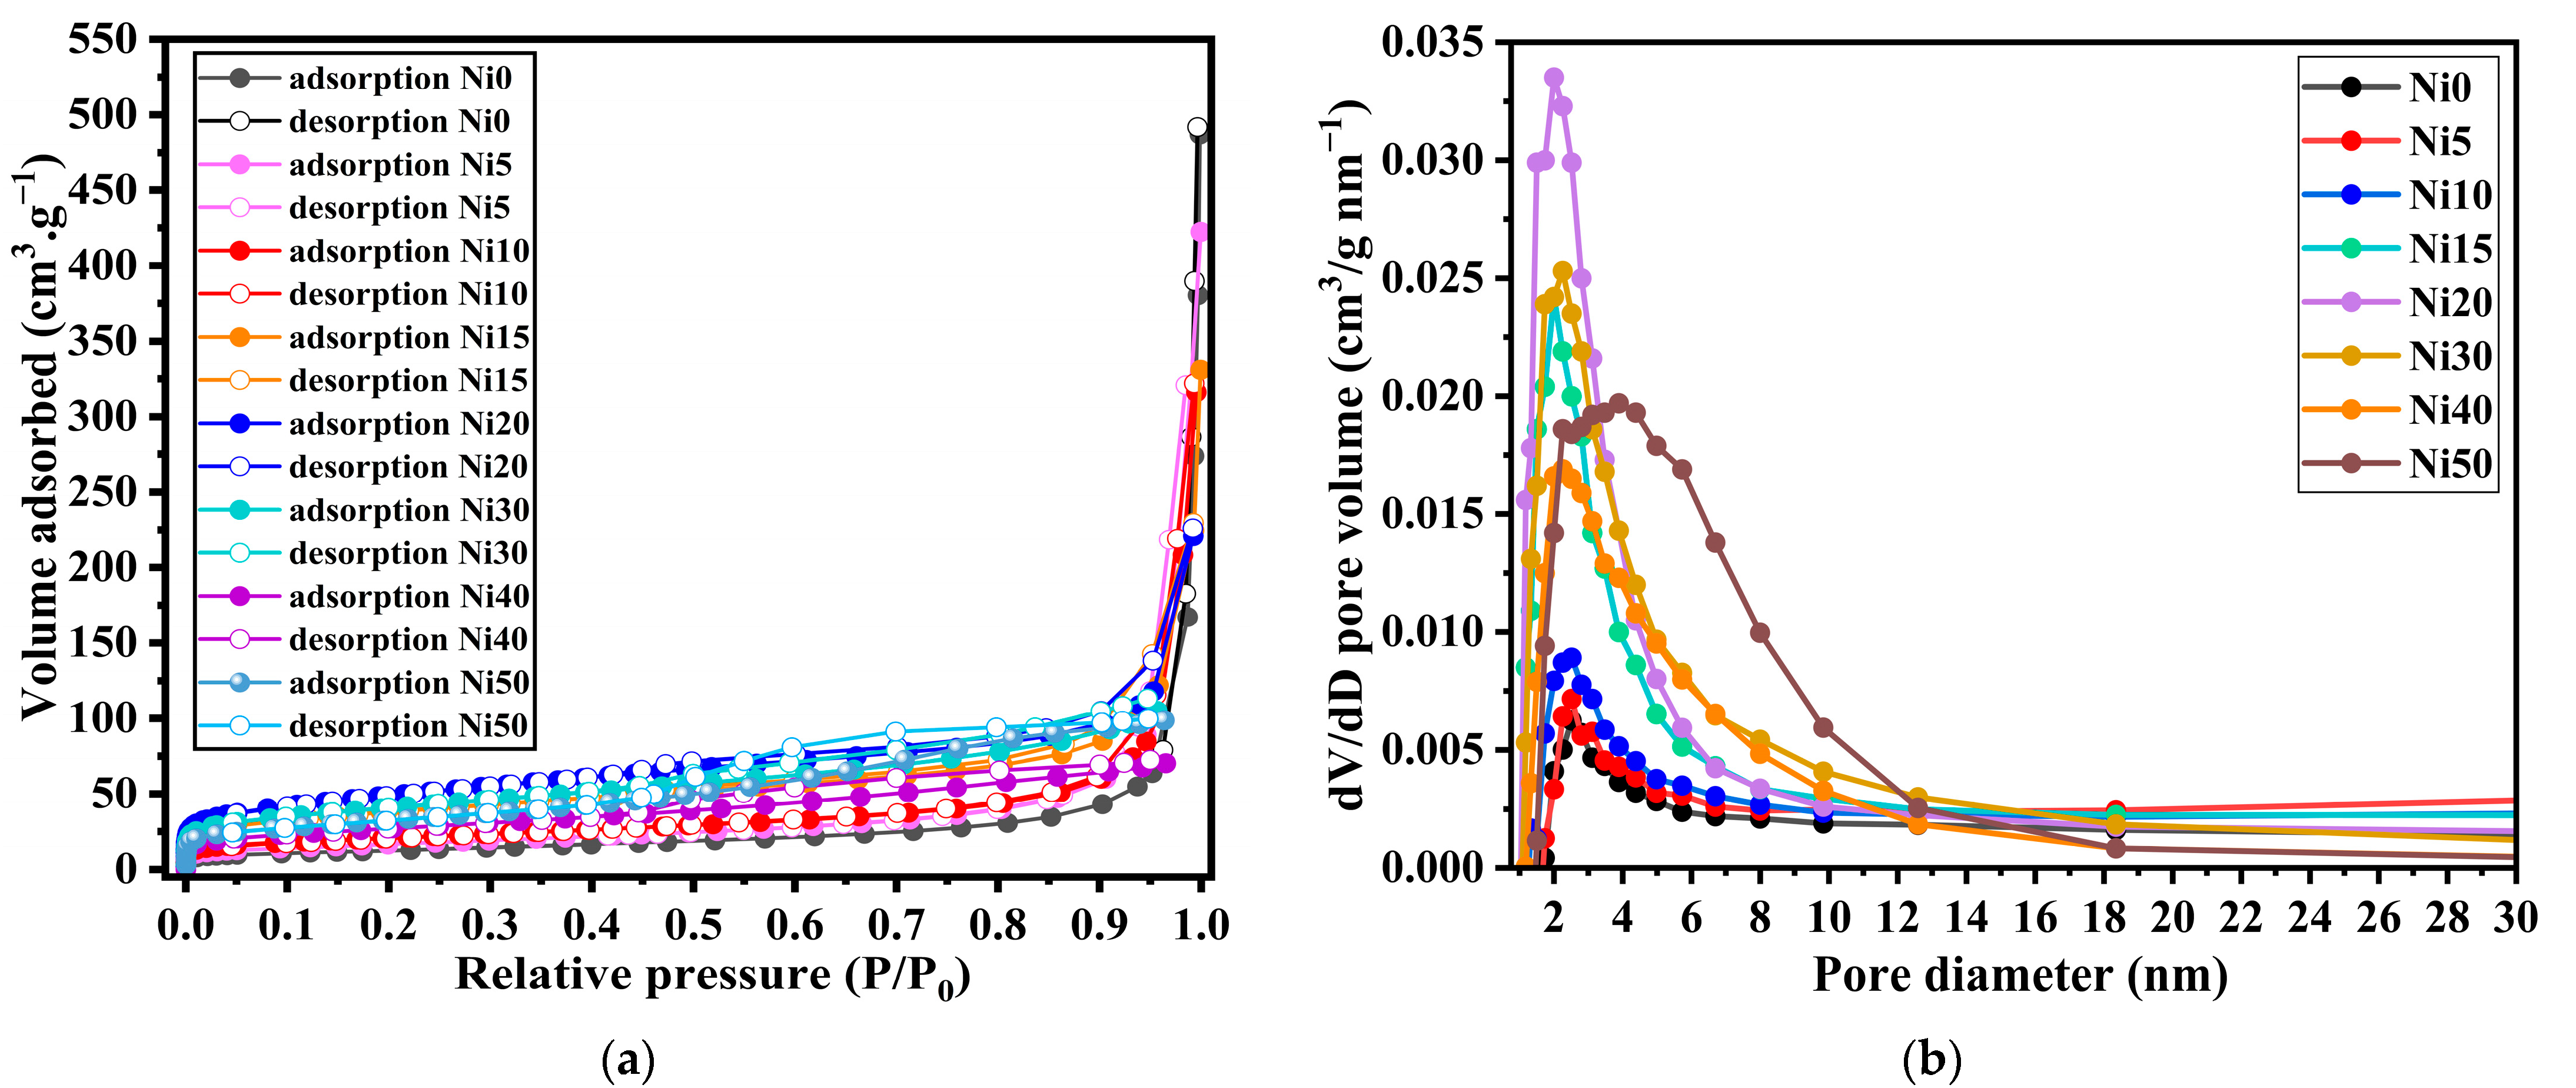
2.7. BET and BJH Analysis of α-NixFe1−xOOH NPs

The experiment involved varying the relative pressure (P/P0), where P represents the adsorption equilibrium pressure, and P0 represents the saturation vapour pressure within the range of 0 to 1. The number of gas molecules adsorbed was quantified and graphed against the relative pressure, resulting in an isotherm. Figure 9 displays the isotherms of α-NixFe1−xOOH NPs. Many factors influence the shape of the curve of an isotherm, such as the existence and dimensions of the pores and adsorption energy. In 1985, the International Union of Pure and Applied Chemistry (IUPAC) published a classification system comprising six types of adsorption/desorption isotherms. Over the past three decades, two additional types have been introduced. The isotherm shape observed for Ni0 and Ni10 is classified as type II according to this classification. Type II indicates the absence of pores or the potential presence of macropores (pores with sizes exceeding 50 nm) [36]. The IV and V types exhibit a unique phenomenon known as hysteresis, wherein the adsorption and desorption processes do not align as typically [37].
Hysteresis, closely associated with capillary condensation, primarily occurs in the mesopore range [38]. The hysteresis pattern observed can offer insights into the shape and structure of the pore. However, due to the diverse nature of hysteresis patterns, establishing a direct relationship between them and pore shape and structure is challenging.
On the other hand, the adsorption isotherms for Ni20, Ni30, Ni40, and Ni50 fall into the H4-type hysteresis classification. Type H4 is indicative of the presence of slit-type pores. This type of hysteresis pattern can sometimes be observed when micropores (pores with sizes of 2 nm or less) are present, as seen in type I isotherms [39]. Based on the isotherm shape depicted in Figure 9, it can be inferred that Ni0 to Ni10 possess macropores, while Ni20 to Ni50 exhibit micropores. The presence of micropores can also be deduced from the rapid increase in adsorption at low relative pressures and the characteristics of the hysteresis loop. The BET method can extract information regarding the adsorption process, specifically from monolayer adsorption to multilayer adsorption. The sample’s surface area can be determined by accurately calculating the degree of monolayer adsorption.
This can be achieved by multiplying the quantity of single-molecule adsorption by the cross-sectional area occupied by a single gas molecule, as follows [37].
  P V P 0 P = 1 V m C + C 1 V m C P P 0
P, P0, Vm, and C are parameters related to adsorption equilibrium pressure, saturation vapour pressure line, monolayer adsorption volume (e.g., adsorption volume when the gas molecules form a monolayer on a solid surface), and adsorption heat, respectively. The established relationship between P/P0 values in the range of 0.05 to 0.35 reveals significant insights.
The surface area, determined by applying the BET method, is presented in Table 5. Based on these calculations, the surface area of Ni0 was found to be 45.1 m2 g−1. With an increase in the Ni content from Ni0 to Ni20, the surface area progressively rises, reaching the highest value of 174.0 m2 g−1 for Ni20. However, as the Ni content is further increased, the surface area decreases, reaching 96.3 m2 g−1 for Ni40. Based on this result, it can be expected that the electrochemical properties of Ni20 will be the best due to possessing the largest surface area compared to all prepared samples.
Figure 9b shows that the average BJH pore diameter was ~1.9–3.9 nm, which demonstrates that the α-NixFe1−xOOH NPs comprise micro- and mesopores as per the IUPAC definition. The BJH pore size distribution of all the α-NixFe1−xOOH NPs shows the major existence of pores within 5 nm. The pore volume of α-NixFe1−xOOH NPs samples was 0.60, 0.59, 0.51, 0.39, 0.44, 0.19, 0.11, 0.15 cm3 g−1 with ‘x’ of 0, 0.05, 0.10, 0.15, 0.20, 0.30, 0.40, and 0.50, respectively.

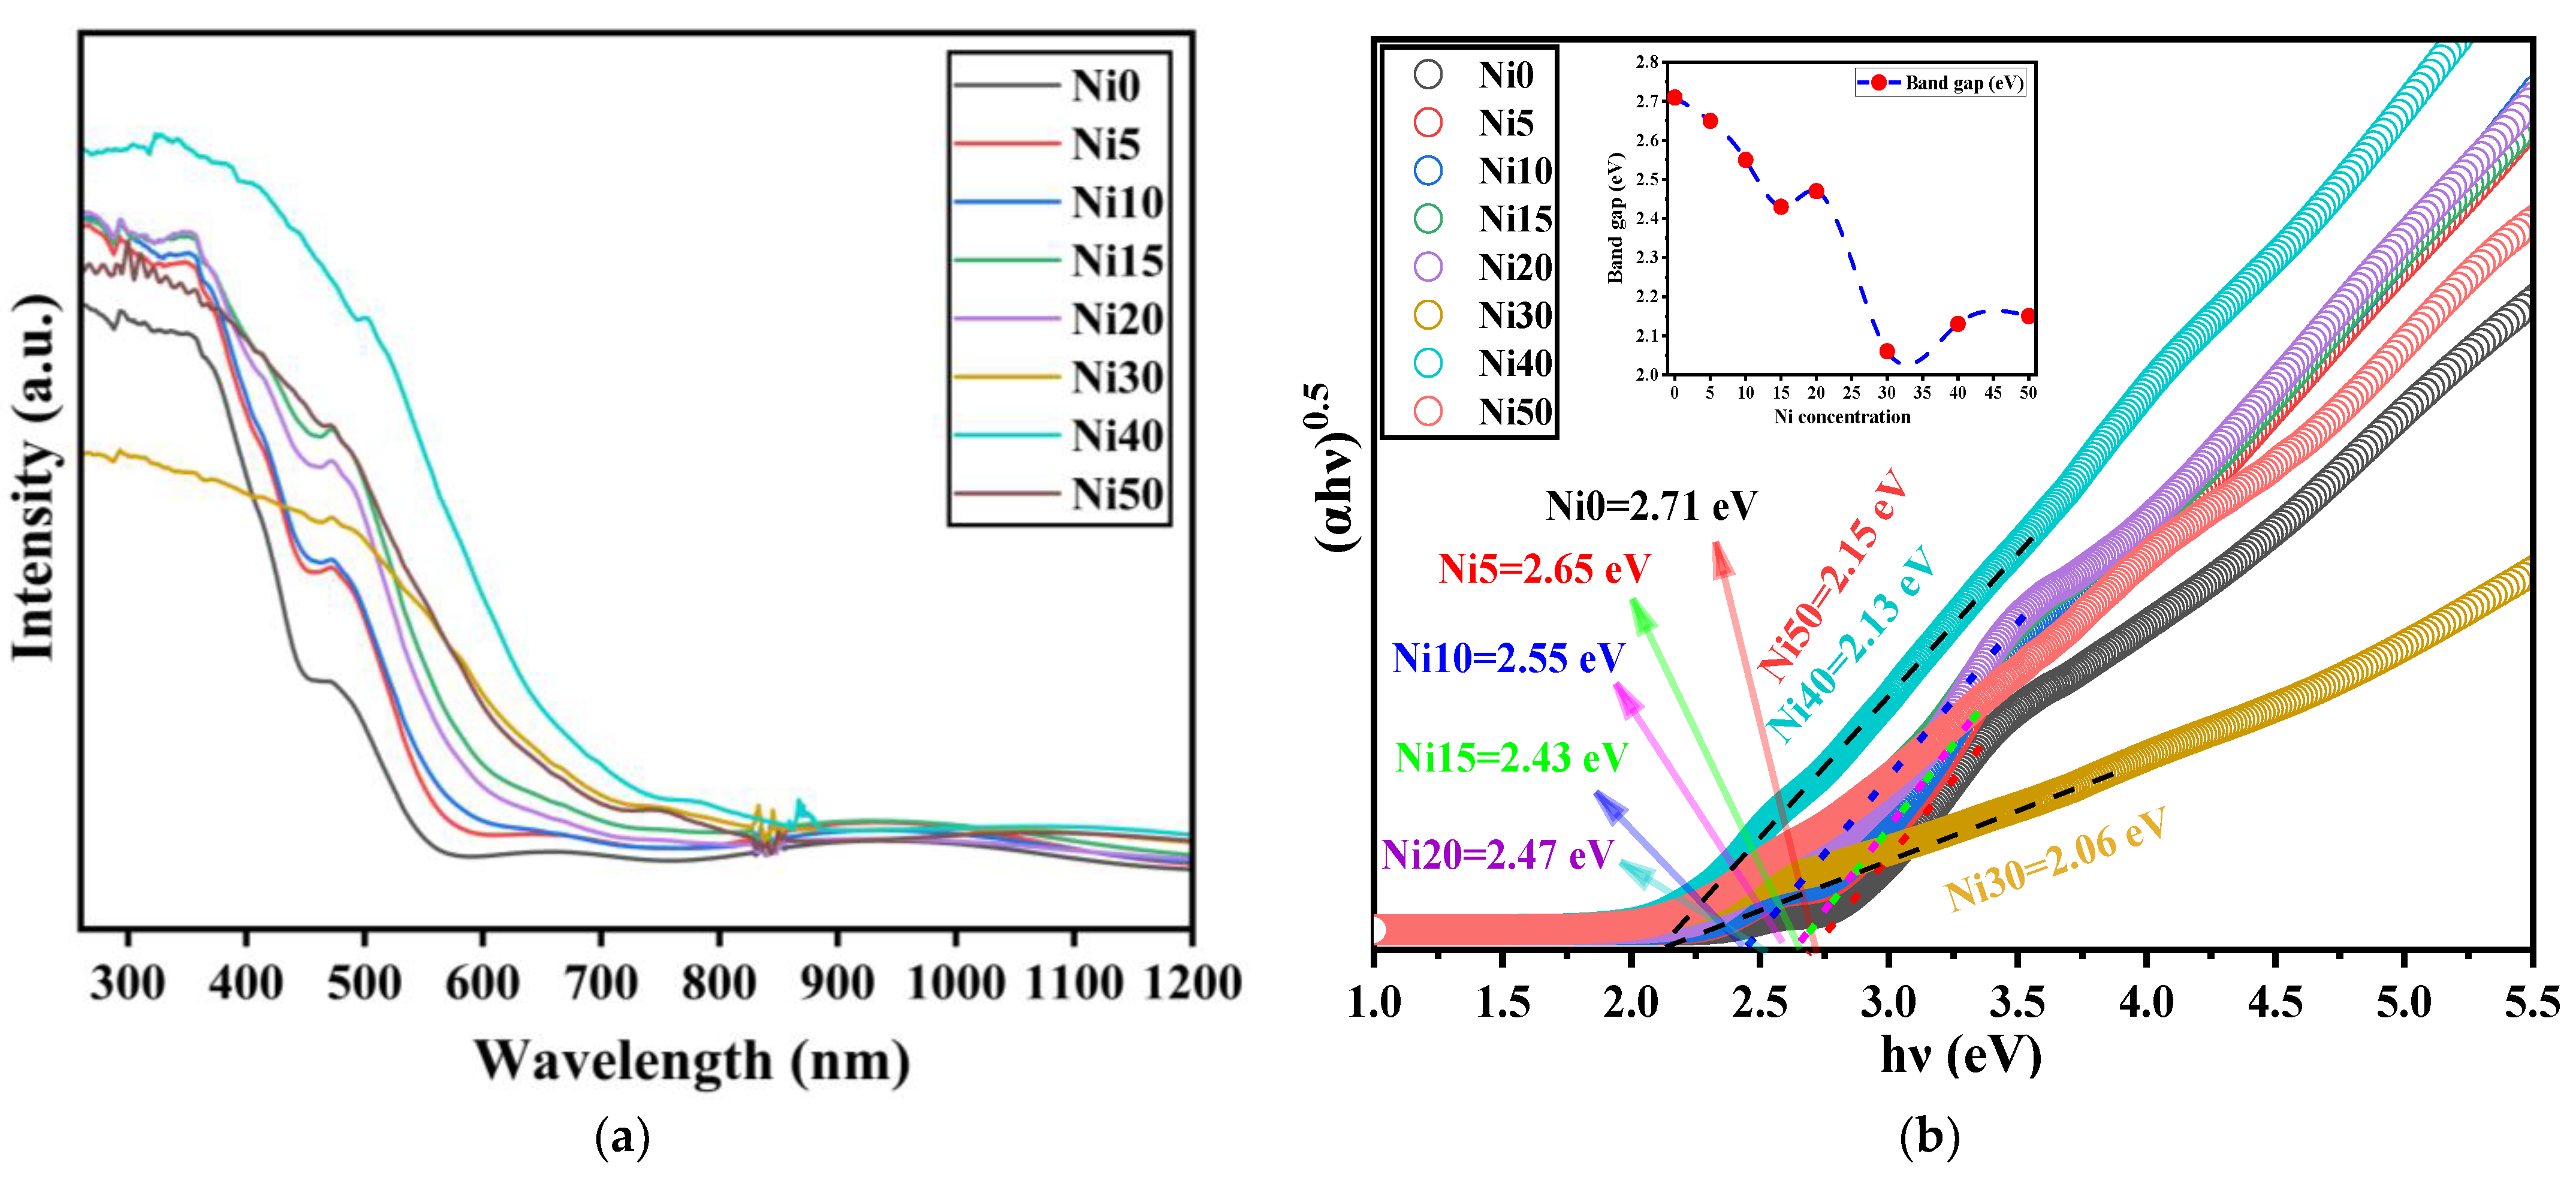
2.8. Bandgap Energy Derived from DRS of α-NixFe1−xOOH NPs

For the bandgap (Eg) estimation of powder samples, diffuse reflectance UV-Vis spectroscopy can be applied [40,41]. In this case, the detected light is reflected from the surface of the sample. The diffuse reflectance spectra (DRS) of α-NixFe1−xOOH NPs are shown in Figure 10a. As for the DRS spectrum of Ni0, we can observe strong absorption at a wavelength of less than 380 nm, which relates to ligand-to-metal charge transitions [42]. A shoulder peak observed at 490 nm is attributed to two-step excitation, while weak absorption peaks of 610 and 890 nm are found due to the ligand field transition [42]. The relative absorption intensities of Ni5, Ni10, Ni15, Ni20, Ni30, Ni40, and Ni50 are larger than that of Ni0, indicating that Ni-doped FeOOH NPs absorbed the photon energy. Eg is an attribute of the photocatalyst, establishing its wavelength active region. It can be revealed using transmission spectra in thin films or absorption for bulk or powder samples dispersed in a solution.
The spectra obtained were analyzed using the Kubelka–Munk K-M function [40]. Eg represents the energy difference between the valence band’s top and the conduction band’s bottom level [43,44] and is a crucial parameter in assessing photocatalytic activity. Eg can be determined by constructing a Tauc plot [41,45]:
h ν α 1 / n = A h ν E g
where h is Planck’s constant, ν is the frequency, α is the absorption coefficient, A is the proportionality constant, Eg is the band gap energy, and n is a parameter depending on the type of transition in the material. For direct allowed transitions, it is taken as n = 1/2; for indirect allowed transitions n = 2 [46].
Figure 10 displays the plot of (hνα)2 versus () obtained from diffuse reflectance spectroscopy (DRS) measurements of NixFe1−xOOH NPs, enabling the estimation of the Eg values. The Eg value for pure goethite (Ni0) was determined to be 2.71 ± 0.01 eV. Table 5 shows that the Eg values for all Ni-doped samples were smaller than that of Ni0. Notably, the smallest Eg value of 2.06 ± 0.01 eV was observed for the Ni30 sample, determined as the x-axis intercept of the fitted straight lines depicted in Figure 10b. The Eg values of Ni40 and N50 were increased to 2.13 ± 0.01 eV and 2.15 ± 0.01 eV, respectively. The existence of Ni(OH)2 precipitated in Ni100x with x larger than 30 was the reason for the increase in band gap energy because NiO6 in Ni(OH)2 has a similar environment to NiO [36].
This comparison highlights the greater effectiveness of Ni addition in reducing the band gap. Photogenerated carriers are produced when a photocatalyst absorbs photons with energy larger than its Eg. Consequently, in this study, the NixFe1−xOOH NPs exhibit high excitability when exposed to a metal–halide lamp emitting light with wavelengths ranging from 250 to 750 nm. This excitation greatly enhances the photocatalytic performance [47]. In conclusion, the above observations validate that the NixFe1−xOOH NPs photocatalysts investigated in this study possess an appropriate band gap and effectively utilize light.

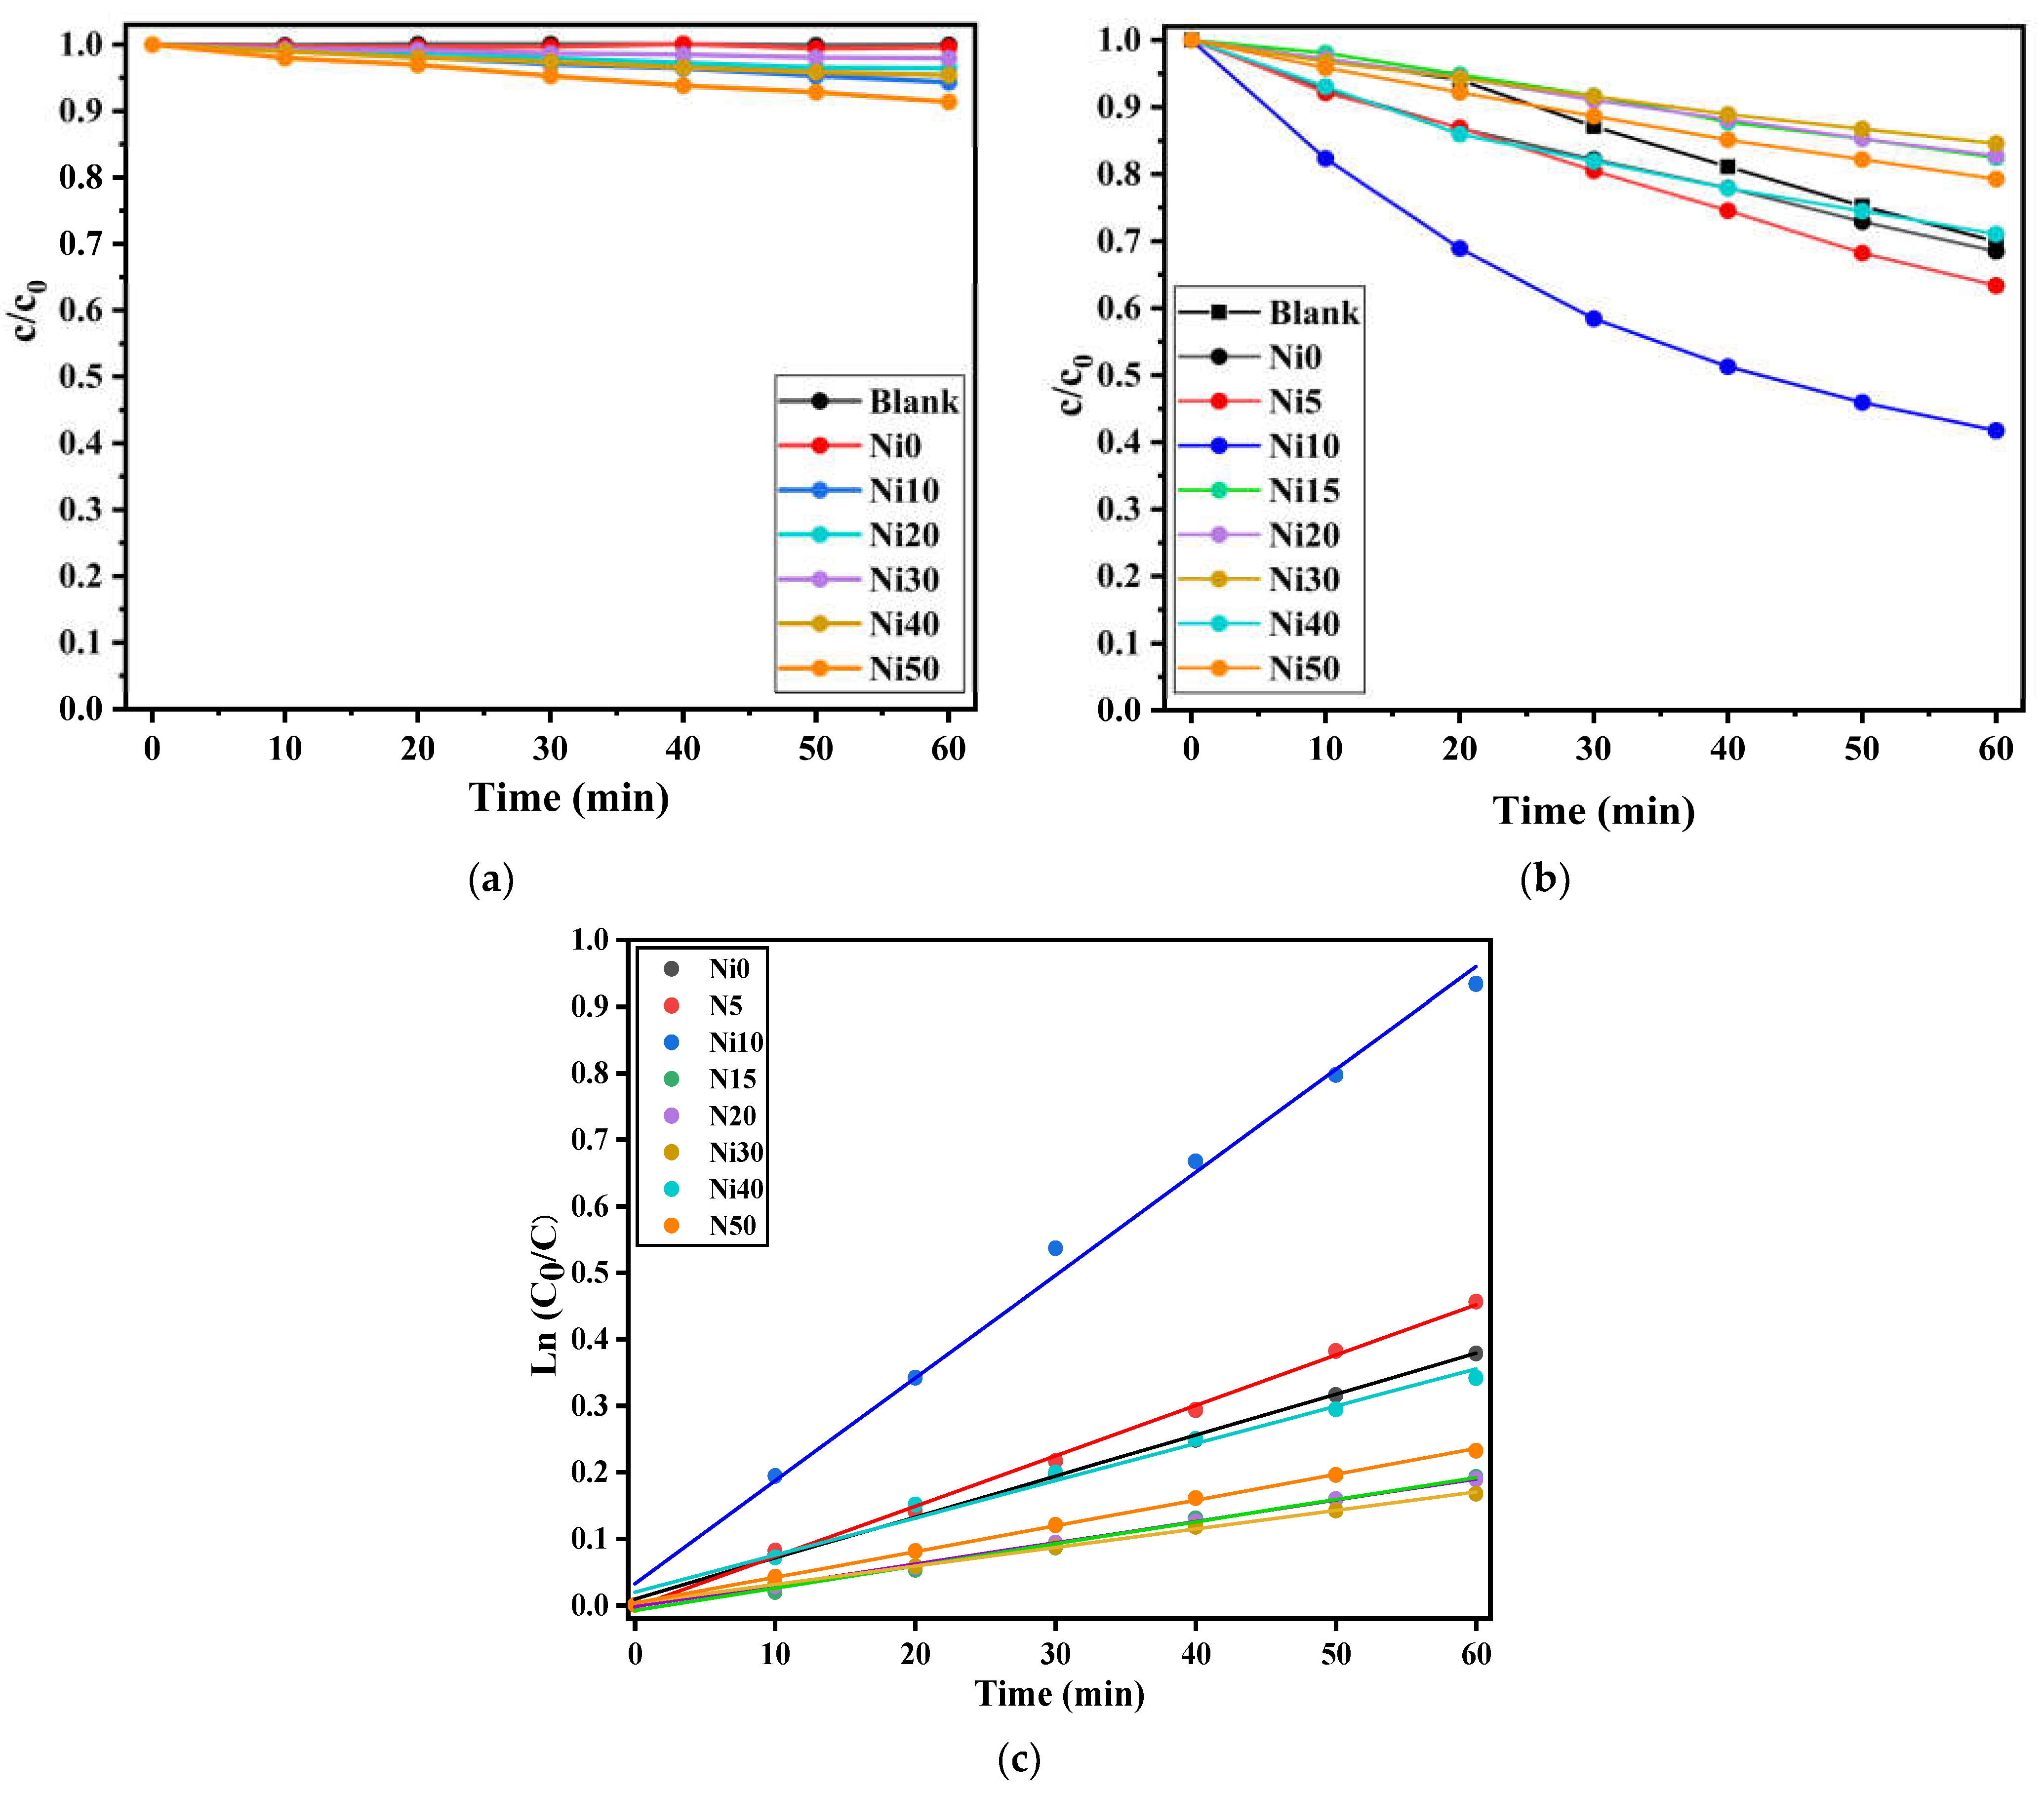
2.9. Photo-Fenton Catalytic Ability of α-NixFe1−xOOH NPs

The reaction rate constant k of methylene blue decomposition is calculated using the following Equation (3) [14]:
Ln c t / c 0 = k t
c0 is the concentration before the photocatalytic reaction of MBaq (=20 µM), and ct means the concentration of MBaq at time t.
Figure 11a shows the photo-Fenton reaction tested in the dark between NixFe1−xOOH NPs samples and MBaq. It is noted that no decrease in the MBaq appeared for the degradation test using Ni0, and a slight degradation showed for Ni30. In contrast, increasing the Ni content to 0.50 shows a reduction in MBaq.
After the degradation test was conducted without light, a continuous photo-Fenton reaction test was carried out using MBaq and α-NixFe1−xOOH NPs nanoparticles under visible light. The corresponding plots depicting the variation of (c/c0) over time (t) under visible light conditions are presented in Figure 11b. The most rapid decrease in (c/c0) during the photo-Fenton reaction is observed with Ni10. This can be attributed to the oxidation of Ni that occurred in this sample. This sample has the highest Ni-K XAFS absorption energy, which leads to it being the Ni10 containing the most Ni(III), see Figure 4c.
Figure 11c illustrates the relationship between ln(ct/c0) and t for α-NixFe1−xOOH NPs. The values of k, representing the rate constant for MBaq decomposition, were determined and are presented in Table 5. For Ni0, the value of k is 6.4 ± 0.1 × 10⁻³ min−1, while the maximum value of k, 15.8 ± 0.6 × 10⁻³ min−1, is observed for Ni10. As Ni is added to goethite, the k values show an increasing trend from Ni5 to Ni10. However, for Ni15 and the subsequent samples, the k values are smaller than that for Ni0.
In the case of Ni15 and the later samples, a decrease in goethite content is observed, accompanied by the generation of a significant amount of low-crystalline substances. This change in composition is believed to be the underlying cause of the lower k values observed. Notably, Ni10 exhibits the highest k value among the samples. This can be attributed to the findings from the DRS, XAFS, and FeMS data, which suggest a reduction in the band gap and non-oxidation processes occurring in the Ni10 sample.

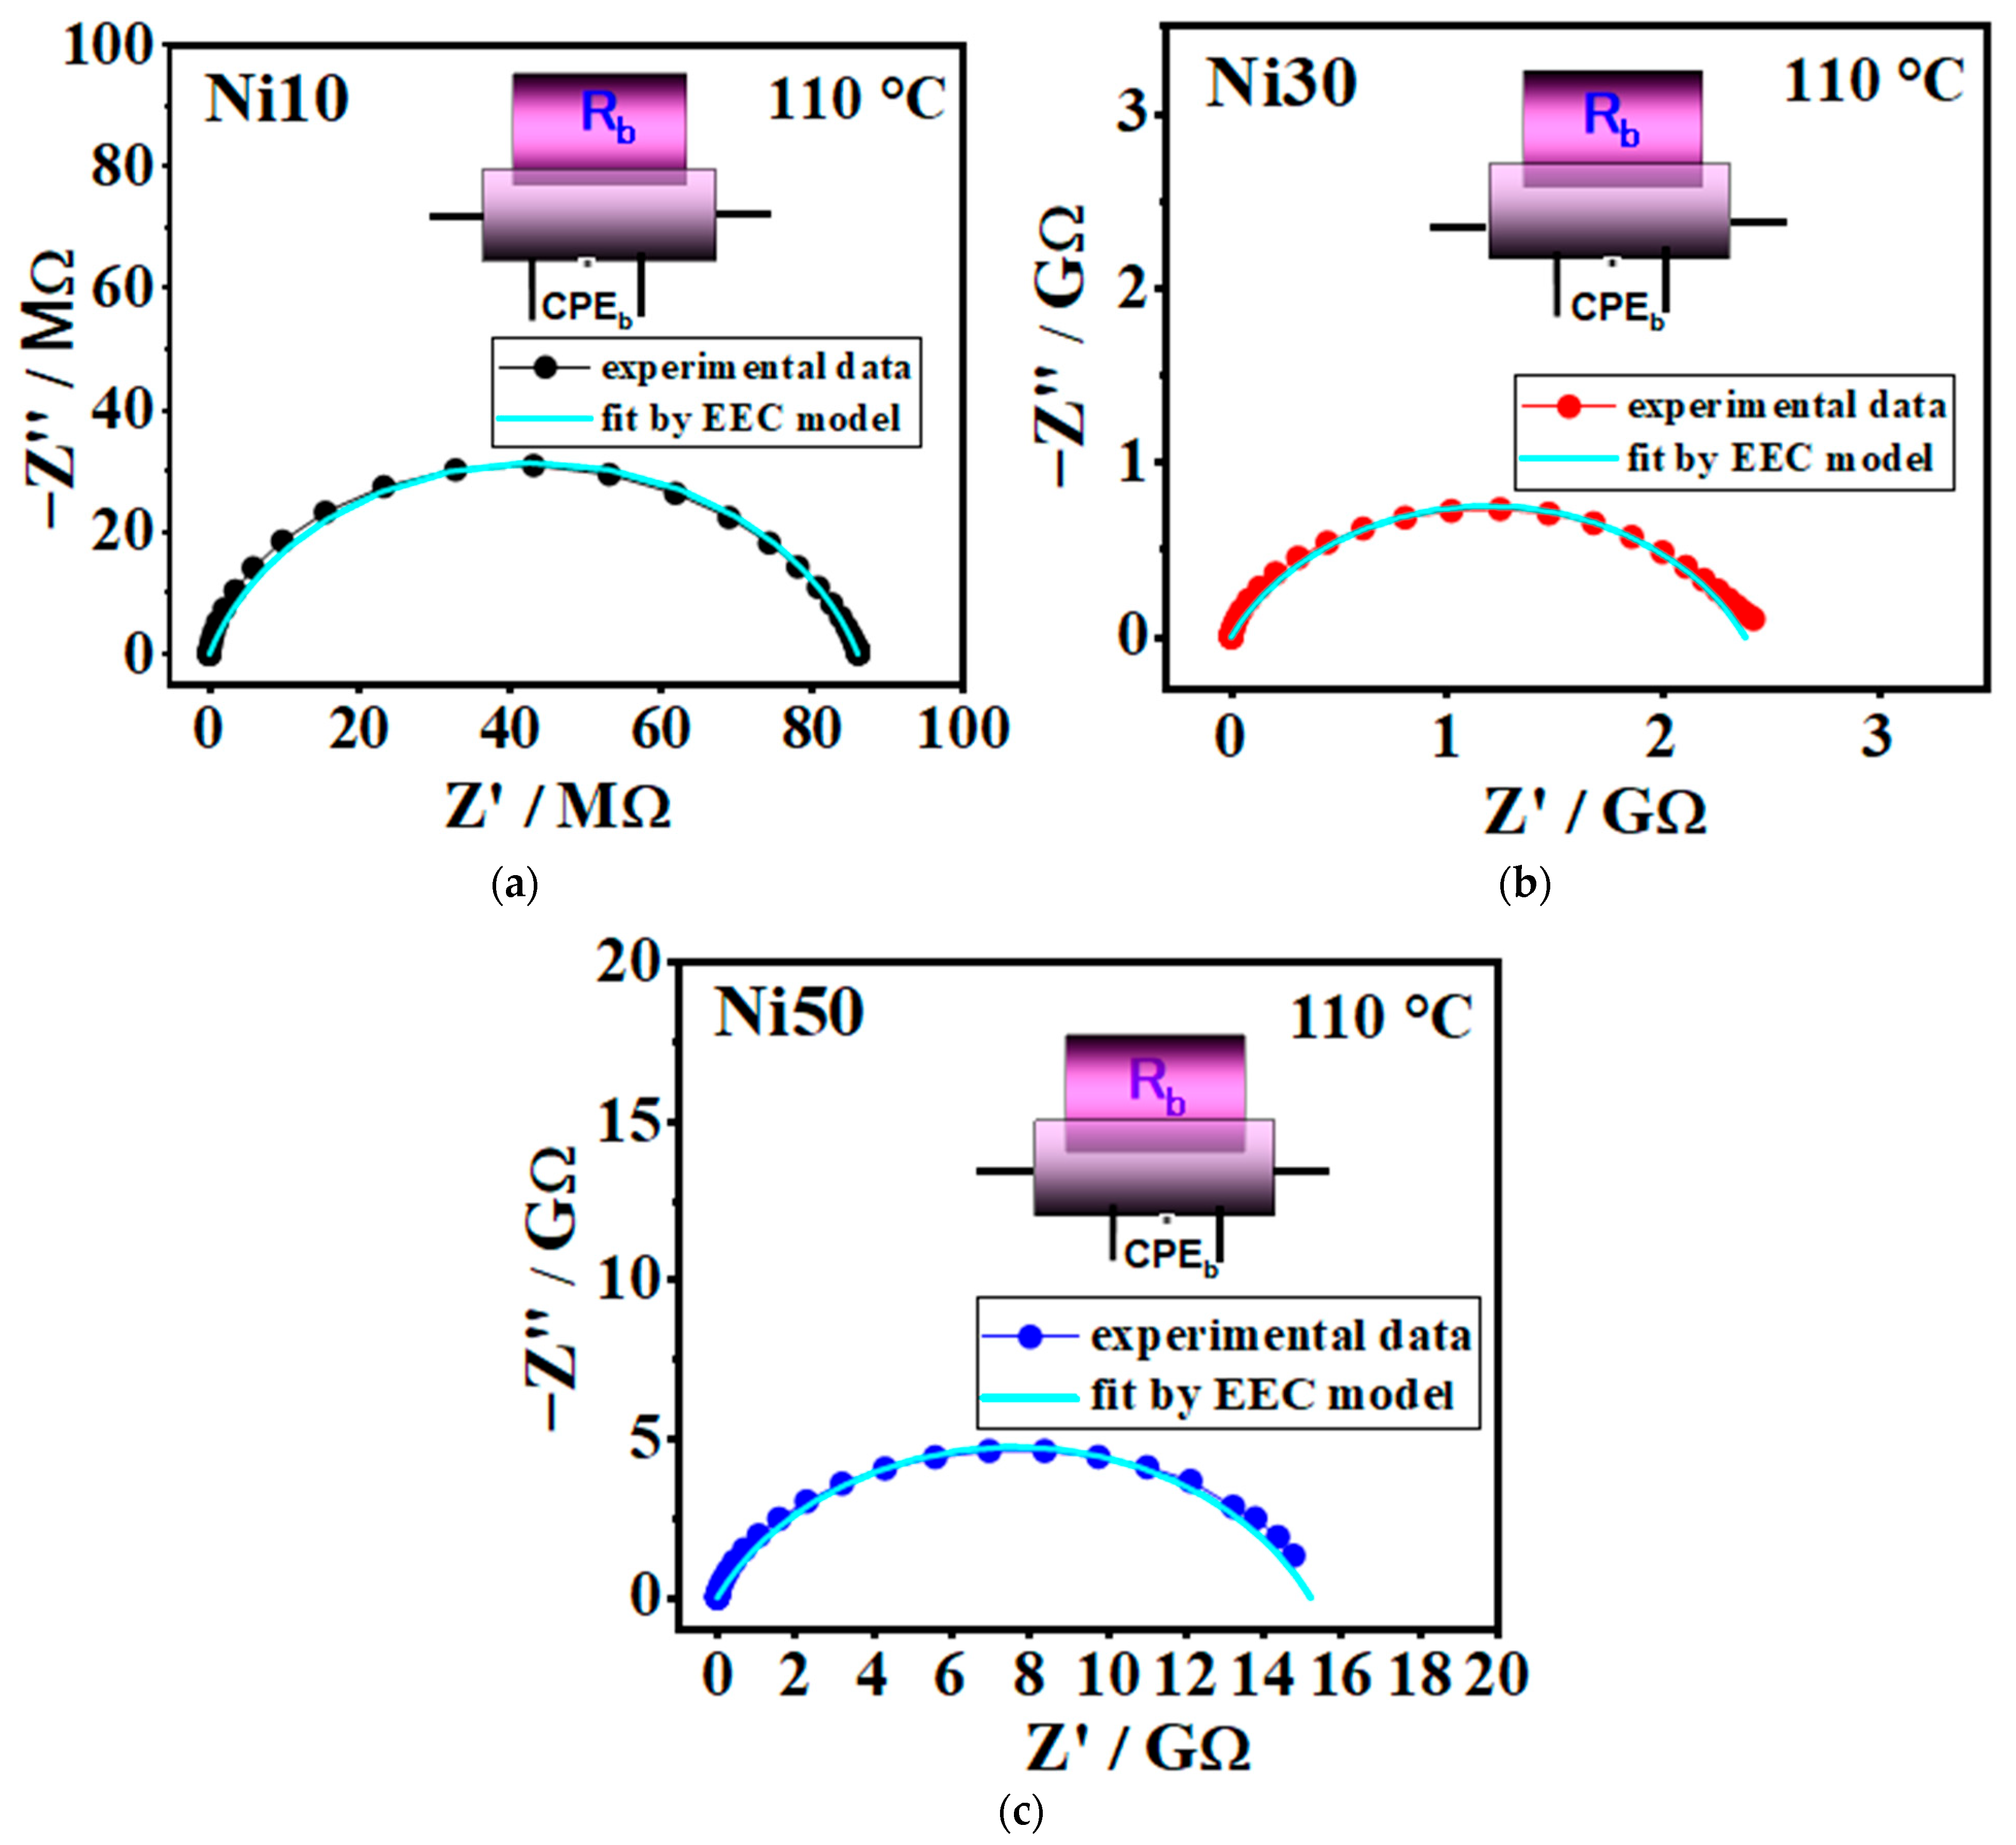
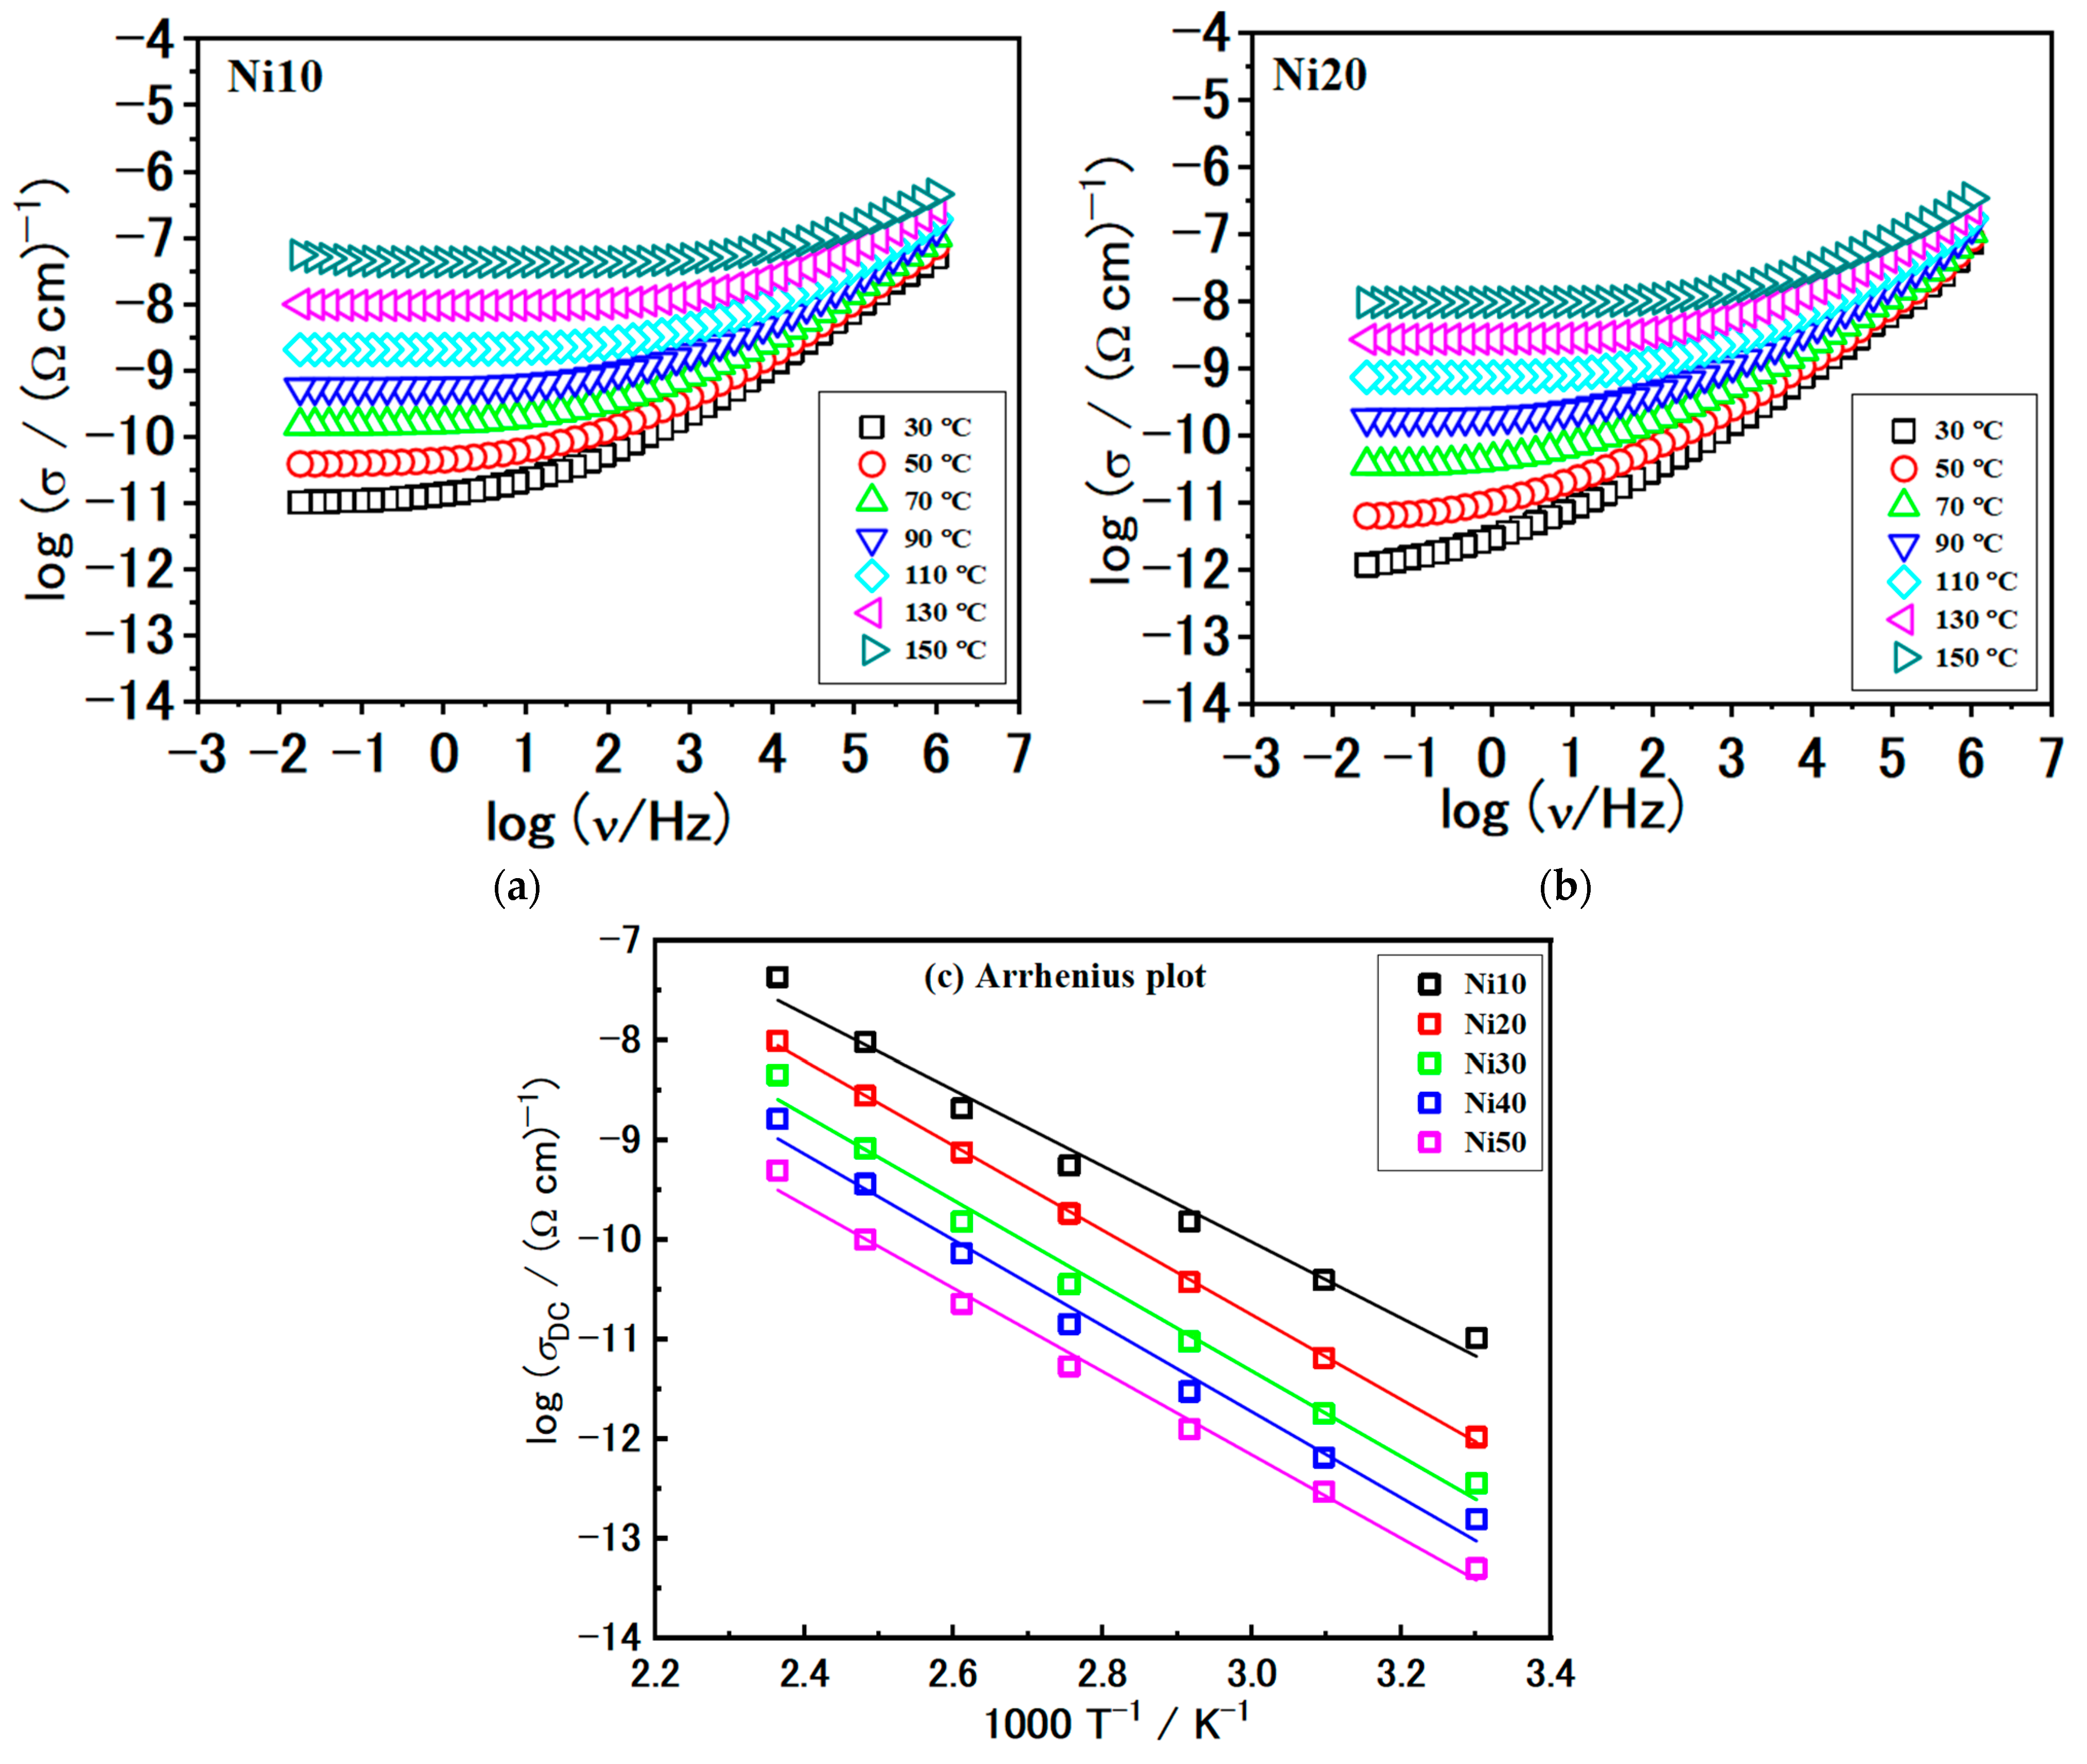
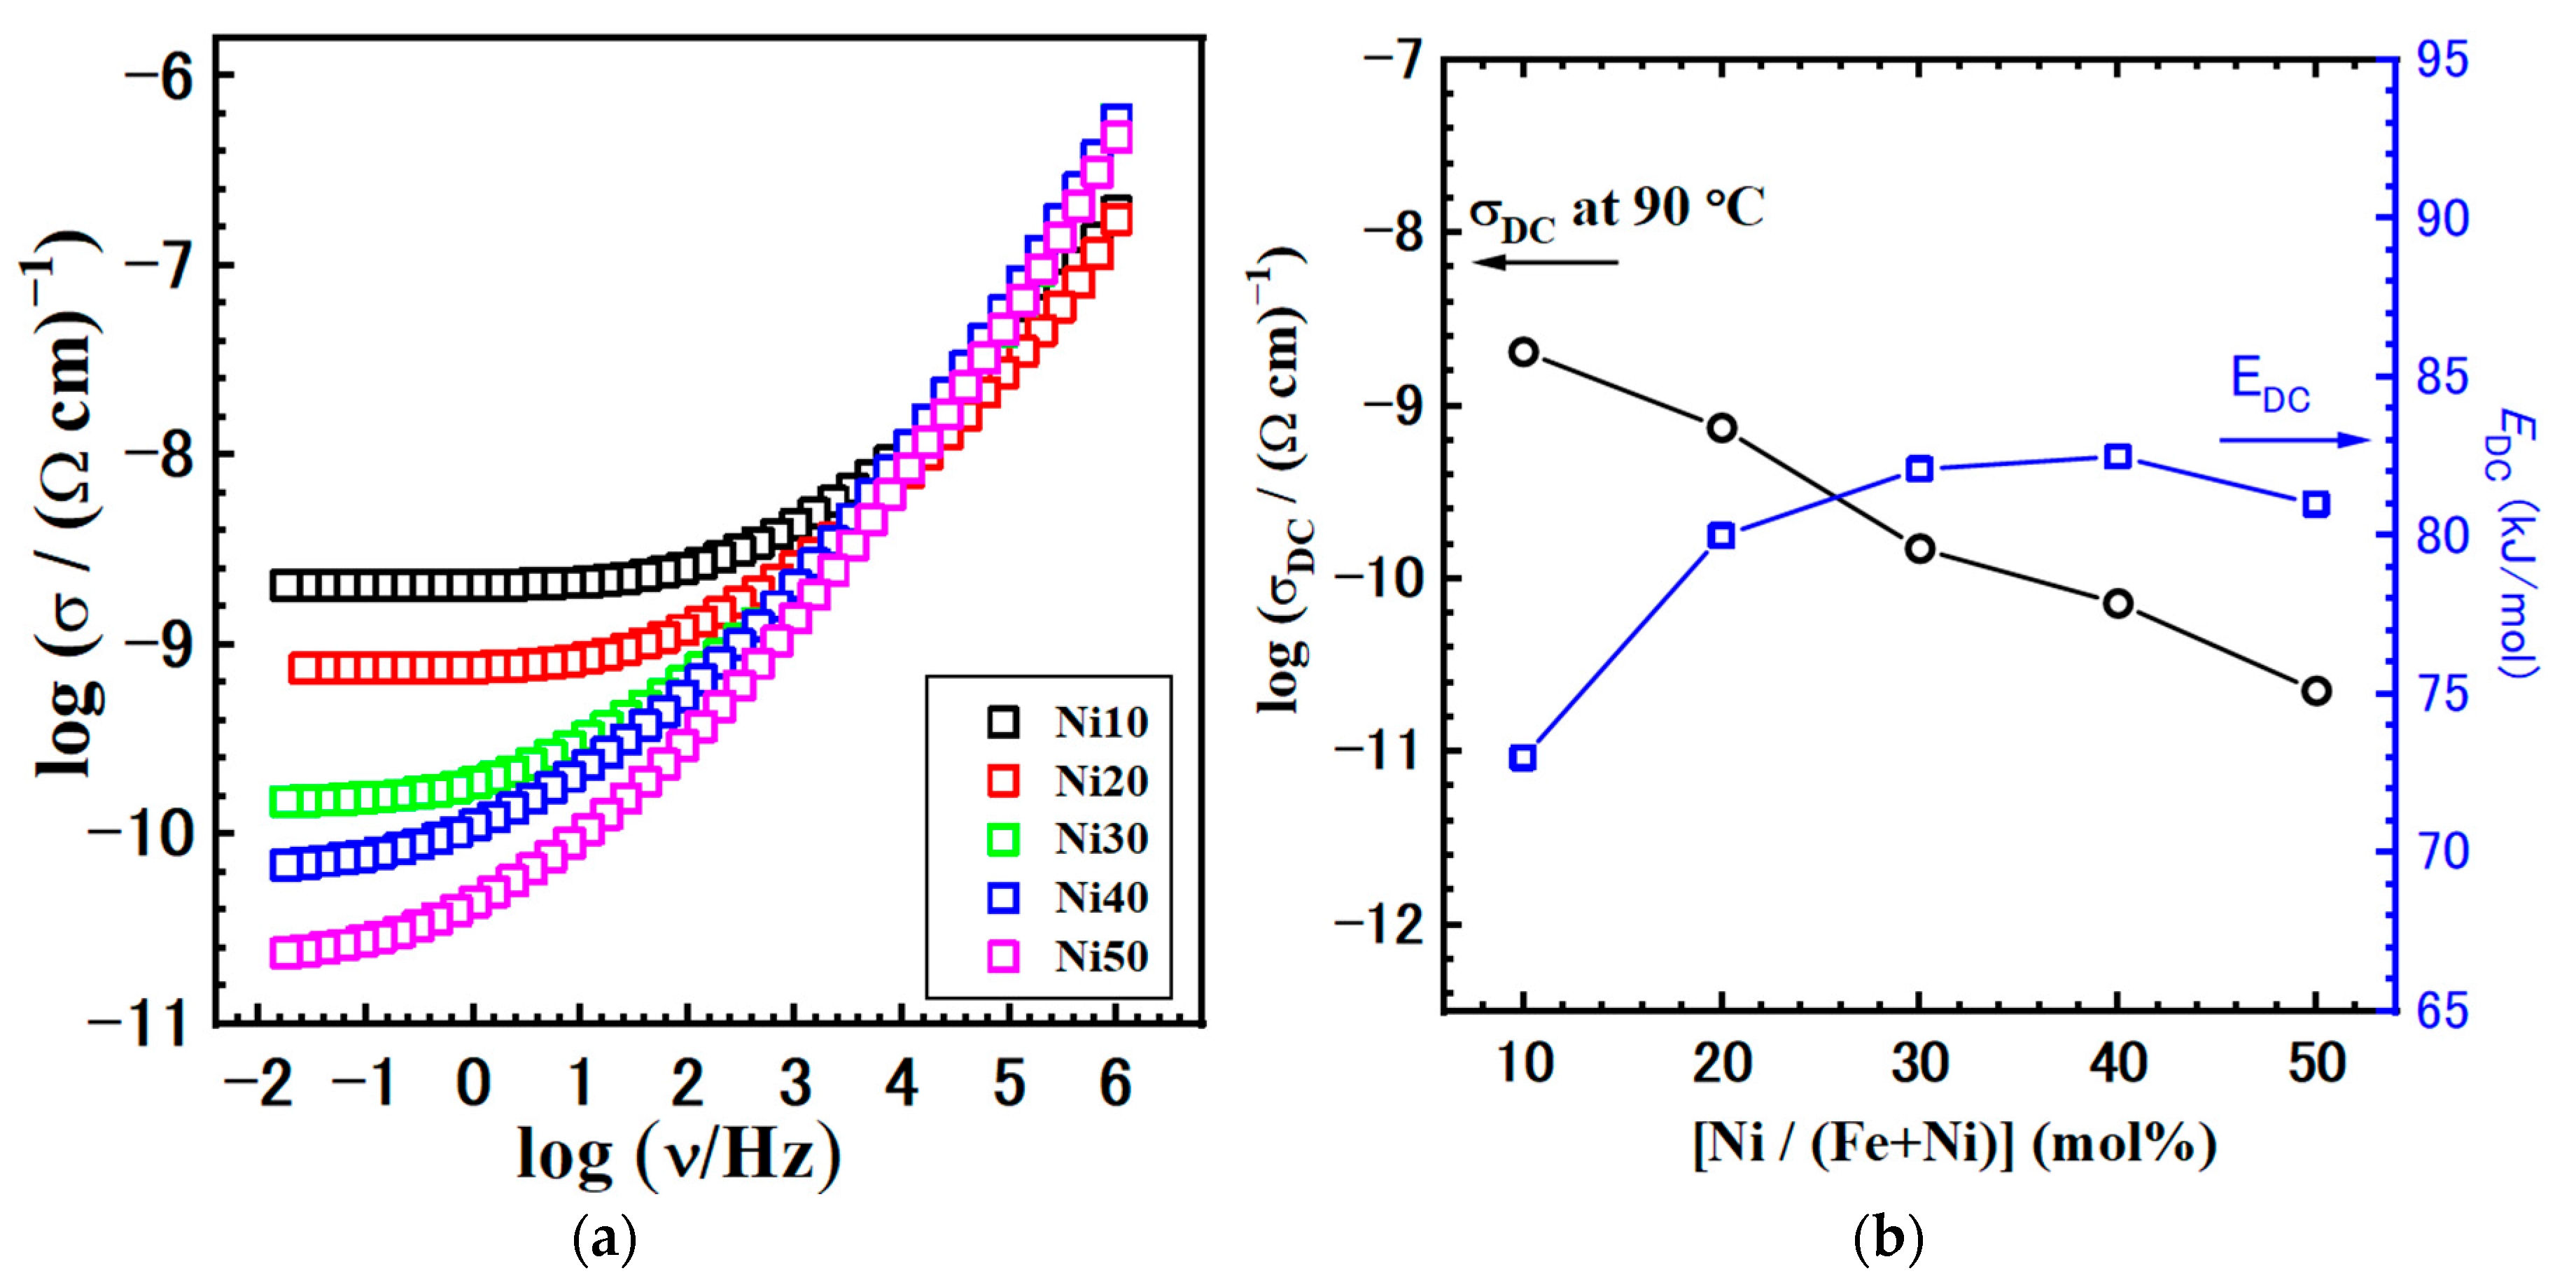
2.10. Electrical Properties—Solid-State Impedance Spectra and DC Conductivity

The experimental data obtained through solid-state impedance spectroscopy (SS-IS) are presented in a complex impedance plane, known as the Nyquist diagram, see Figure 12a–c and Figure S2. The analysis of these plots involves employing electrical equivalent circuit (EEC) modelling, which utilizes a complex nonlinear least-square (CNLLSQ) fitting procedure. It is apparent that the impedance spectra observed in all examined samples exhibit a distinct semicircle, representing the bulk electrical process within the investigated α- NixFe1−xOOH NPs.
This behaviour can be effectively described by an equivalent R-CPE circuit. The parameters for each circuit element (R, A, and α) were directly derived from the measured impedance data using the CNLLSQ method.
In the present study, we took a step further and examined the conductivity spectra of all the samples. The conductivity spectra of samples with Ni10 and Ni20 at different temperatures are shown in Figure 13a,b, respectively. Although the conductivity isotherms have a similar shape, overall spectral features can be observed as follows. First, there exists a frequency-independent conductivity plateau at low frequencies. This particular feature is associated with the long-range transportation of charge carriers and represents the overall resistance observed in the impedance spectra or DC conductivity. In addition, frequency-dependent conductivity, commonly referred to as conductivity dispersion, manifests itself with increasing frequency in the form of a power-law.
This behaviour arises from localized movements of charge carriers occurring over short distances. We used values of the fitting parameter R obtained from modelling along with sample geometry to determine the total DC conductivity, as shown in Table 6. The DC conductivity obtained is in good correlation with the observed DC plateaus in the conductivity spectra; see Figure 13a,b.
The DC conductivity in our samples demonstrates a temperature-dependent behaviour that follows an Arrhenius relationship, indicating semiconducting characteristics, see Figure 13c.
Consequently, the activation energy for the DC conductivity, EDC, was determined for individual samples from the slope of log(σDC) versus 1000/T using the equation:
  σ D C = σ 0 * exp E D C k B T
where σDC is the DC conductivity, σ 0 * is the pre-exponent, kB is the Boltzmann constant, and T is the temperature (K). The activation energy, EDC, and DC conductivity, σDC, at 90 °C for all investigated α-NixFe1−xOOH NPs samples are presented in Table 6.
Continuing our analysis, we turn the focus to the comparison of the conductivity spectra at 110 °C, shown in Figure 14a. First, as previously mentioned, the shape of the conductivity spectra does not change with the composition. This consistency indicates that the mechanism of electrical transport remains unaffected. However, the modification of α-NixFe1−xOOH NPs and the increase in Ni content has a negative effect, resulting in a decrease in DC conductivity, see Figure 14b and Table 6. As the Ni/(Fe + Ni) ratio increases, the DC conductivity exhibits a nearly linear decline, from 5.52 × 10⁻¹⁰ (Ω cm)−1 for Ni10 to 5.30 × 10⁻¹² (Ω cm)−1 for the Ni50 sample. Conversely, the activation energy for DC conductivity, EDC, follows the opposite trend, with values increasing in the 73.0–82.5 kJmol−1 range.
However, it is important to note that our understanding of the electronic structure of iron oxides and oxyhydroxides, including goethite, remains incomplete. In our study on NixFe1−xOOH NPs, the obtained values for the activation energy (0.75–0.85 eV), see Table 5, are almost three times lower in comparison to the goethites studied by Guskos et al. [48]. Our findings align more closely with the activation energy values reported for magnetite and hematite. Similar values are observed in the literature for various materials with disordered or partially disordered structures and dominant electron transport [49,50,51,52].
The goethite structure can be described as parallel double chains of edge-sharing octahedra. These chains consist of FeIII bonded to three oxide ions and three hydroxides extending along the [001] direction and are linked to the neighbouring double chains by corner sharing. Guskos et al. [48] conducted an electrical study on goethite and proposed that charge transport occurs through thermally activated three-dimensional hopping of electrons via oxygen vacancies, based on DC electrical measurements conducted over a wide temperature range.
Furthermore, Vitaly et al. [53] showed that RT charge transport in goethite is primarily governed by the thermally activated hopping of small polarons, with the associated mobility being higher compared to other iron oxyhydroxide (FeOOH) polymorphs. Small polarons are formed when electrons self-trap onto an iron centre, resulting in conduction through phonon-mediated hops between centres [54]. Different inequivalent paths for electron hopping characterized by different Fe-Fe bond distances and species bridging two neighbouring Fe atoms are identified [53].
The pathway involving migration along the double chain ([001] direction) through shared octahedral edges, with electron transport mediated by O and OH species, is characterized by Fe atoms with parallel spins and with the shortest Fe2+-Fe3+ distance of approximately 3 Å. Su et al. [55] studied the electrical conduction mechanism of goethite under pressures up to 17.1 GPa using impedance spectroscopy. The results indicate a pressure-induced conduction mechanism transition around 5 GPa from mixed protonic-electronic conduction to pure electronic conduction, which is associated with the pressure-induced magnetic state transition.
In our study, we used the IS method in an inert atmosphere (N2), so the protonic contribution is expected to be inhibited and does not contribute to the total conductivity. Thus, the obtained trend in our study could lead to the conclusion that as the Ni content is increasing, the structure and bonding are affected in the studied NixFe1−xOOH NPs samples, which leads to the increase in polaron hopping activation energies, thus, decreasing the ground state carrier mobility compared to pure goethite. Moreover, at the same time, with Ni doping and a decrease in Fe content, the charge carrier concentration decreases. Additionally, the presence of mixed metal centres (Fe, Ni) does not appear to have a favourable effect on polaron transport. Overall, the effects above collectively contribute to a decrease in the DC conductivity as the Ni content increases in the studied NixFe1−xOOH nanoparticles.

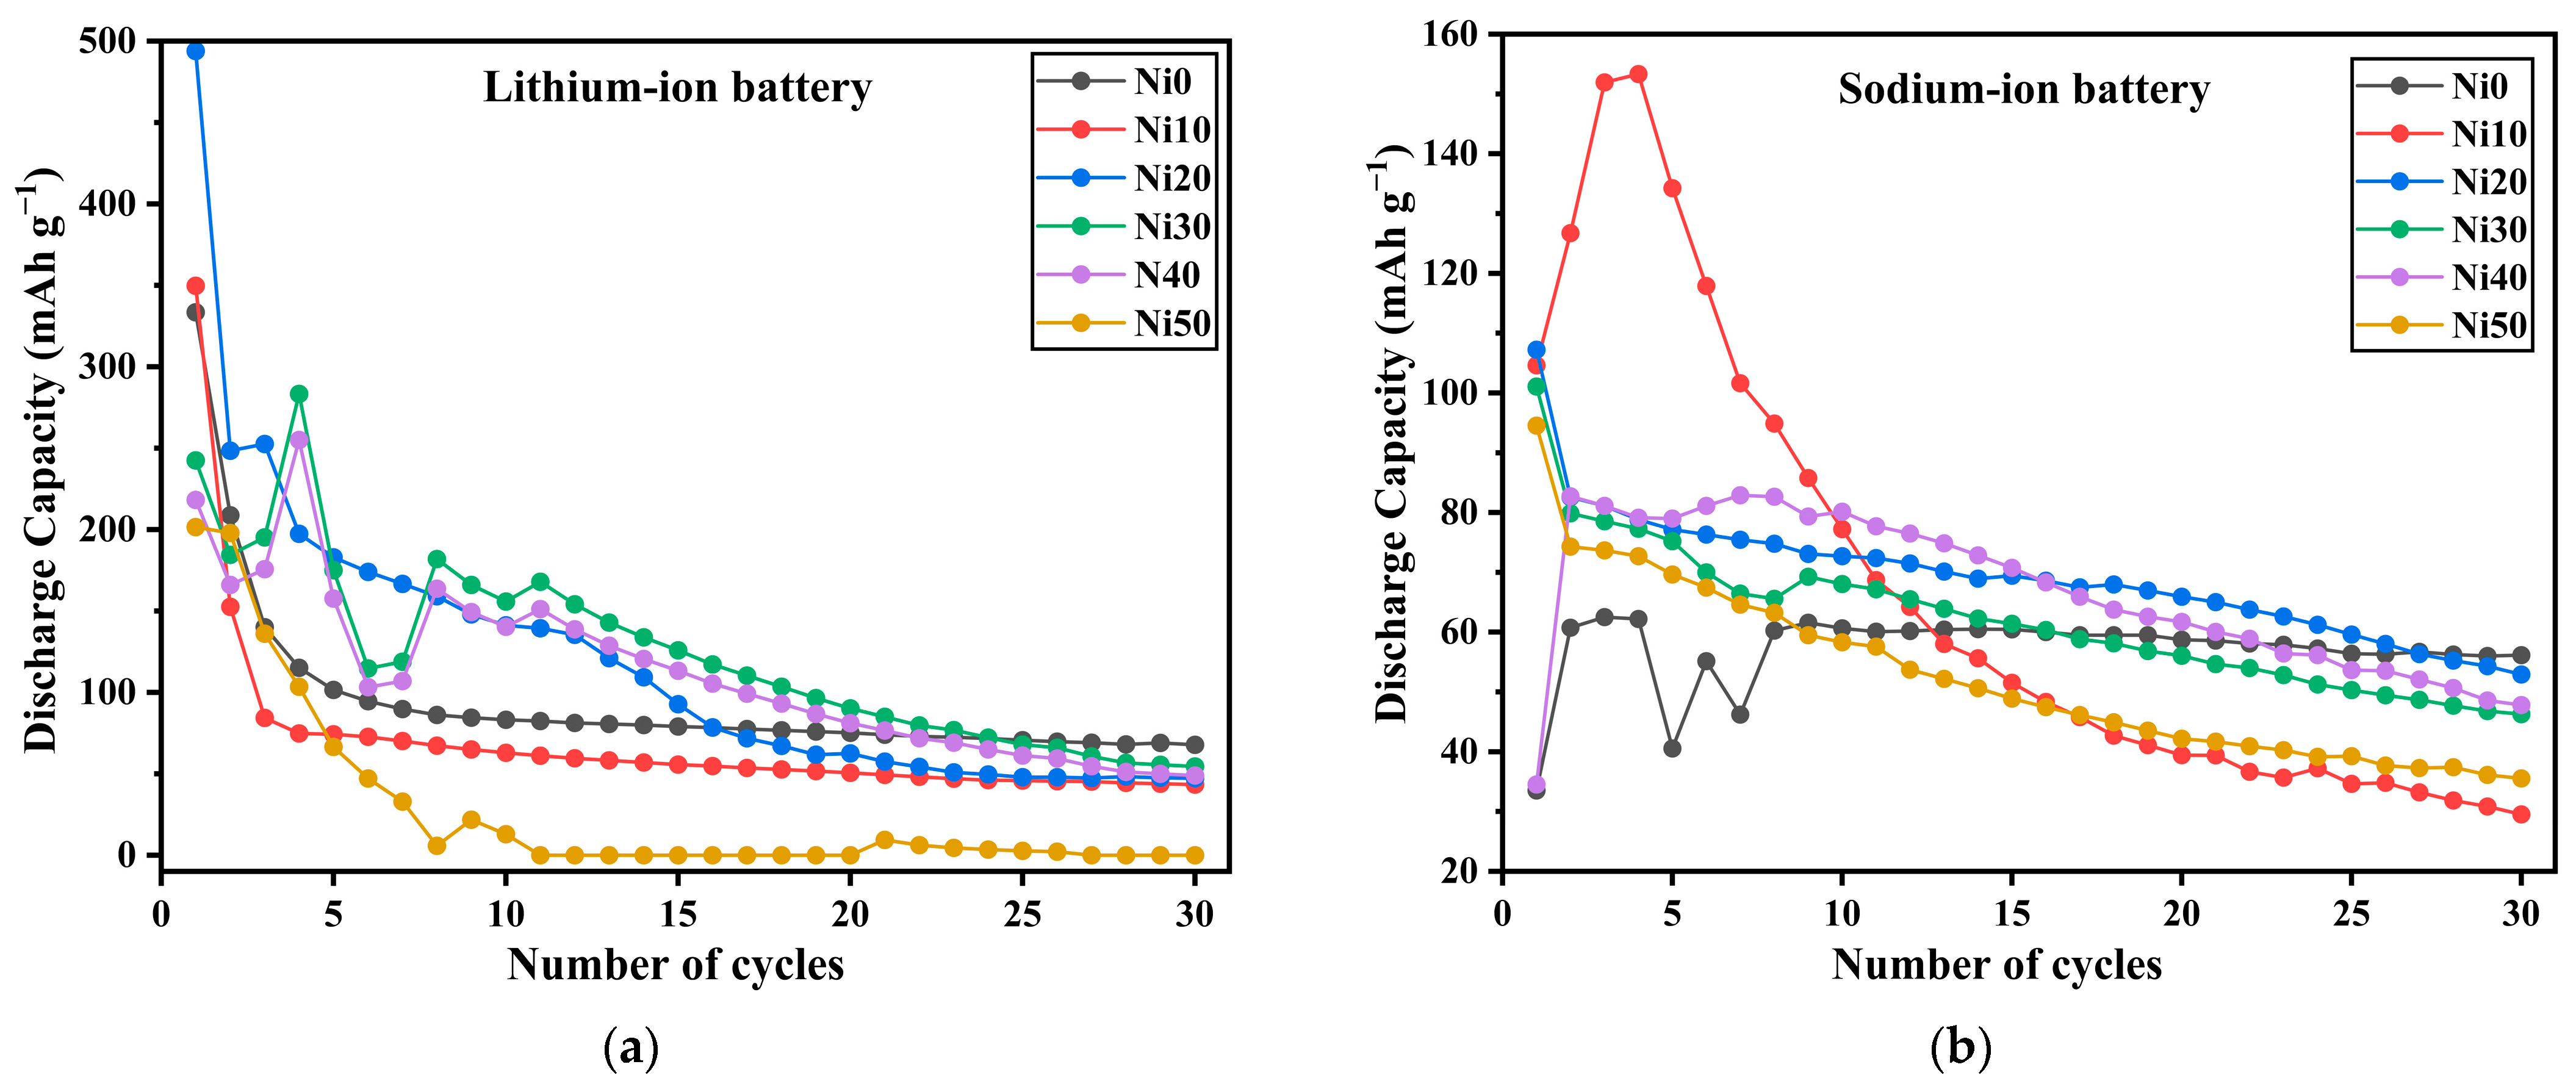
2.11. The Electrochemical Properties of α-NixFe1−xOOH NPs/Li- and Na-Ion Batteries

Table 7 shows the discharge capacity and capacity retention of Ni0, Ni10, Ni20, and Ni30 samples as a cathode in LIB under a low current rate at 5 mA g−1; the initial discharge capacity of Ni0 was the highest, reaching 1069 mAh g−1. The discharge capacity decreased with the increase in Ni content to 250 mAh g−1 for Ni30. Moreover, the capacity retention of all samples suddenly dropped after 10 cycles. The capacity retention of Ni0, Ni20, and Ni30 was less than 1%, while Ni10 was 7.4%.
On the other hand, after a tenfold increase in the current rate to 50 mA g−1, the initial discharge capacity of Ni0, Ni10, and Ni20 was 333, 350, and 494 mAh g−1, respectively, and the discharge capacity increased with the Ni content.
However, capacity retention decreased when the Ni content was increased. We can conclude that after increasing the current rate from 5 to 50 mA g−1, the initial capacity of all samples decreased, while the capacity retention was enhanced, as shown in Table 6 and Figure 15a.
In contrast, the discharge capacities of Ni0, Ni10, Ni20, Ni30, and Ni50 were 110, 116, 223, 189, and 202 mAh g−1, respectively, which was proportional to the size of the surface area as shown in Table 4 [56,57].
Additionally, the capacity retention after 30 cycles of all samples after adding Ni was lower than that for Ni0, as shown in Table 8 and Figure 15b. According to the aforementioned results concerning α-NixFe1−xOOH NPs as cathode material in both LIB and SIB, with a specific focus on capacity retention after 30 cycles, one can deduce that the performance of NixFe1−xOOH NPs as active cathode materials is more comparable in SIB compared to LIB.

3. Materials and Methods

3.1. Preparation of α-NixFe1−xOOH NPs

For preparing the α-NixFe1−xOOH NPs, iron (III) chloride hexahydrate (Wako, Japan, 095-00875) and nickel (II) chloride (Wako, Japan, 141-01062) were dissolved in 30 mL of pure water under magnetic stirring. The concentration and molar ratio of nickel are presented in Table 9. Once the mixture solution was thoroughly homogenized, 3 mol L−1 sodium hydroxide (Wako, Japan, 194-02135) aqueous solution was added until the pH reached 13.
The mixture solution underwent ultrasonication for 20 min after vigorous stirring. Furthermore, the mixture solution was stirred for an additional 20 min. The obtained mixture was then transferred into a Teflon-lined stainless-steel autoclave and maintained at 80 °C for a hydrothermal reaction period of 24 h. After naturally cooling to RT, the solid products were washed with pure water and ethanol to remove the neutral electrolyte.
The solid products were dried at 60 °C for 12 h and allowed to cool naturally. These samples were, respectively, abbreviated as Ni0, Ni5, Ni10, Ni15, Ni20, Ni30, Ni40, and Ni50.

3.2. Structural Characterization

The X-ray diffraction (XRD) patterns were measured by using a RINT-TTR III (Rigaku) X-ray diffractometer with Cu-Kα: λ = 1.54 Å. The measurements were conducted over a 2 θ range of 10° to 80°, with a data interval and scanning rate of 0.02° and 5° min−1, respectively. The X-ray generator was operated at 50 kV and 300 mA. The obtained XRD patterns were analyzed using Smartlab Studio II Powder XRD software, version 4.2.137.0 with the database of ICDD.
Thermogravimetry differential thermal analysis (TG-DTA) was performed by (Thermo plus TG8120, Rigaku, Japan), under a heating rate of 10 K min−1 and the temperature range (RT-1000 °C). The weight of the α-NixFe1−xOOH NPs and α-Al2O3 reference was fixed to be 10 mg.
The Fourier transform infrared spectroscopy (FTIR) transmission spectra of α-NixFe1−xOOH NPs were recorded by the (FTIR PerkinElmer, Shelton, CT, USA; spectral resolution: 1 cm−1) spectrometer in the range 400–4000 cm−1. The α-NixFe1−xOOH NPs samples as a powder were mixed with KBr in a pellet of 10 mm diameter under a pressure of 90 kg/mm2 (KBr pellets technique), with the ratio of α-NixFe1−xOOH NPs sample weight to KBr at ~1%.
The 57Fe Mössbauer spectra were measured at RT and at 86 K by a constant acceleration method with a 57Co(Rh) source, and α-Fe was used as a standard reference material. The obtained spectra were analyzed using the Mosswinn 4.0 software. The RT–X-ray absorption spectra of Fe-K and Ni-K (XANES/EXAFS) were measured in transmission mode by a beamline BL-12C at the High Energy Accelerator Research Organization (KEK-PF, 1-1 Oh-ho, Tsukuba, Ibaraki, Japan). The X-ray beam emitted from the synchrotron was monochromatized using a Si(111) double crystal and further attenuated to suppress the higher harmonics by employing a Ni mirror. The intensity of the X-ray beam was measured by setting an ionization box before and after transmission. In the front chamber, a mixture of N2+He gases (N2: 30%, He: 70%) was filled, while in the rear chamber, a mixture of Ar+N2 gases (Ar: 30%, N2: 70%) was utilized for the X-ray intensity measurements. The required amount of the sample needed for an excellent spectrum was calculated by SAMPLEM4M software version 0.9.71. The sample and boron nitride were mixed and homogenized in a mortar for 20 min, followed by pressing to make pellets with a diameter of 1.0 cm. The X-ray absorption spectra were analyzed by Athena software version 0.9.26. Transmission electron microscopy (TEM) images were obtained using a JEM-3200FS Field Emission Energy Filter Electron Microscope (JEOL, Tokyo, Japan). The optical bandgap was recorded with a Shimadzu UV-3600 spectrometer with an integrating sphere attachment (ISR-3100, Shimadzu, Kyoto, Japan). Diffuse reflectance UV-Vis spectroscopy, combined with the Kubelka–Munk equation and Tauc plots, were utilized to estimate the optical band gap. The specific surface area (SSA) was measured by BERSORP MINI X (MICRO TRAC BEL, Osaka, Japan) with N2 gas as the adsorbate, and the SSA was calculated by the Brunauer–Emmett–Teller (BET) method. The preprocessing was performed at 60 °C for 24 h using the BELSORP VAC II (MICRO TRAC BEL, Osaka, Japan). The obtained results were analyzed by BELMaster7(MICROTRAC BEL).

3.3. Photocatalytic Activity

To evaluate the photocatalytic performance of the α-NixFe1−xOOH NPs, the degradation of methylene blue (MB) in an aqueous solution was measured, combining the produced sample (10 mg), MB (Wako, Japan, 7220-79-3) (20 µM, 10 mL), and H2O2 (Wako Japan, 081-04215) (9.75M, 40 µL). The UV-Vis spectra of the MB aqueous solution were measured by a GENESYSTM 10S UV-Vis spectrophotometer in a wavelength region from 200 to 800 nm every 10 min with photoirradiation and stirring. The concentration of the MB aqueous solution after each interval was measured using the absorbance at the wavelength of 665 nm. The visible-light Fiber-Lite MH-100 metal–halide lamp emitted a wavelength range from 250 to 750 nm, and the output power was 200 W.

3.4. Solid-State Impedance Spectroscopy (SS-IS) of α-NixFe1−xOOH NPs

The electrical properties were studied by solid-state impedance spectroscopy. Powder samples were pressed into cylindrical pellets 10 mm in diameter and with a thickness of approximately 0.5 mm under a uniform load of 2 tons using a hydraulic press. Gold electrodes 6 mm in diameter were sputtered onto both sides of the sample pellets using Sputter coater SC7620, Quorum Technologies for the electrical contact. The complex impedance was measured using an impedance analyzer (Novocontrol Alpha-AN Dielectric Spectrometer, Novocontrol Technologies GmbH & Co. KG, Montabaur, Germany) over a wide frequency range from 0.01 Hz to 1 MHz at temperatures between 30 °C and 170 °C (step 20 °C). The temperature was controlled to an accuracy of ±0.2 K.
The experimental data were analyzed by the electrical equivalent circuit (EEC) modelling employing the complex nonlinear least-square (CNLLSQ) fitting procedure. Depending on the EEC used and the obtained fitting parameters, various process(es) can be identified and separated. Typically, a single impedance semicircle can be represented by an EEC that combines a resistor and a capacitor connected in parallel. Ideally, this semicircle should pass through the origin of a complex plot and yield a low-frequency intercept on the real axis, corresponding to the resistance, R, of the observed process. However, in cases where the experimentally observed semicircle appears depressed, an alternative component known as the constant-phase element (CPE) is used instead of the standard capacitor in the equivalent circuits. The CPE is an empirical impedance function of the type: Z*CPE = 1/A(iω)α where A and α are the constants. For the samples in this study, the complex impedance spectrum is described by an equivalent R-CPE circuit. The parameters for each circuit element (R, A, and α) were determined directly from the measured impedance data using the CNLLSQ method. The DC conductivity values are calculated based on the modelling process, considering both the parameters obtained and the sample geometry.

3.5. Preparation of SIB Containing α-NixFe1−xOOH NPs Cathode

To prepare the cathode, first, 250 mg of α-NixFe1−xOOH NPs and 95 mg of acetylene black (AB, Strem chemicals 06-0025, Newburyport, MA, USA) were mixed by a ball mill (Planet M2-3F, Nagao System, Kanagawa, Japan) at 800 rpm for 15 min. Then, 5 mg of polytetrafluoroethylene (PTFE, Wako, Japan, 165-13412) was added to the 95 mg ball-milled mixture powder and mixed in the mortar until the powder became semi-solid and then pressed in a pellet with a diameter of 1 cm and weight of 30 mg. For the sodium-ion battery, metallic Na (Kishida, Osaka, Japan, 750-70852) (90 mg) and an electrolyte of 1 M NaClO4/propylene carbonate solution (Tomiyama LIPASTE-P/S1, Tokyo, Japan) were used, while metallic Li (Wako, Japan, 127-06001) (30 mg) was used with LiPF6/Ethylene carbonate and Dimethyl carbonate 1:1 v/v% ratio (Kishida LBG-00022, Osaka, Japan) for the lithium-ion battery. The 2032-type coin battery was assembled in a glove box under an oxygen concentration less than 0.99 ppm. TOSCAT-3100SK (TOYO-SYSTEM, Fukushima, Japan) measured the charge–discharge capacity performance at 30 cycles under the voltage range of 0.8–4.0 V, a current rate of 5 and 50 mA g−1, and a lower limit current of 0.1 mA. This process started with the discharge process in discharge-CC and charge-CC/CV.5.

4. Conclusions

In this paper, we studied the relationship between local structure, photo-Fenton catalytic ability, and electrochemical properties in LIBs and SIBs of Ni-doped goethite with the composition of α-NixFe1−xOOH NPs (x = 0, 0.05, 0.10,0.15, 0.20, 0.30, 0.40, and 0.50, abbreviated as Ni100*x). The XRD patterns of α-NixFe1−xOOH showed the α-FeOOH crystalline phases in all prepared samples. Moreover, a new crystalline phase is related to Ni(OH)2, for Ni contents from 0.30 to 0.50. The weight loss at low-temperature increased in the NixFe1−xOOH NPs with the increased Ni content, which can be explained by more adsorbed water in the NiFeOOH NPs samples with a large surface area. The transmission peak observed at 3130 cm−1 corresponds to the O-H stretching vibration of the hydroxyl group. The strong two transmission peaks were observed at 797 cm−1 and 895 cm−1, related to Fe-O-H bending vibrations out of the plane and in the plane, respectively. The absorption edge energy of α-NixFe1−xOOH NPs is higher than the values of Fe2O3 (Fe3+); this implies that none of the α-NixFe1−xOOH NPs samples contained Fe2+, and they contained only Fe3+. Moreover, the Ni-K absorption edge energy of NixFe1−xOOH NPs is higher than that expected for pure Ni2+. Samples Ni15 and Ni20 contain less Ni3+, while Ni10 has the highest Ni3+ content. The 57Fe Mössbauer spectrum of Ni0, measured at RT, displayed a sextet corresponding to goethite with an isomer shift (δ) of 0.36 mm s−1 and a hyperfine magnetic distribution (Bhf) of 32.4 T. The absorption area of the superparamagnetic component increased from 4.8% to 82.9%, with an increase in Ni content up to an ‘x’ value of 0.2. The surface area of Ni100*x changed from 45.1 to 59.9, 73.9, 135, 174, 145, and 178 m2 g−1 with ‘x’ 0, 0.05, 0.10, 0.15, 0.20, 0.30, 0.40, and 0.50, respectively. In addition, the optical band of NixFe1−xOOH NPs decreased from 2.71 eV to 2.15 eV with the increasing Ni content from 0 to 0.50. The largest first-order rate constant (k) of 14.6 × 10⁻³ min−1 was measured for Ni10. The DC conductivity decreased from 5.52 × 10⁻¹⁰ to 5.30 × 10⁻¹² (Ω cm)−1 with ‘x’ increasing from 0.10 to 0.50. The highest initial capacity was recorded at 494 mAh g−1 for Ni30 at the current rate of 5 mA g−1 as a cathode material in LIB. Meanwhile, in SIB, the largest initial capacity was found as 233 mAh g−1 for Ni20 at a current rate of 5 mA g−1. In conclusion, α-NixFe1−xOOH NPs can be effectively utilized as visible-light-activated catalysts and active cathode materials in secondary batteries.

Supplementary Materials

The supporting information can be downloaded at: https://www.mdpi.com/article/10.3390/ijms241814300/s1.

Author Contributions

Conceptualization, A.I. and S.K. (Shiro Kubuki); methodology, M.S.; software, A.I.; validation, A.I., S.K. (Shiro Kubuki) and Z.H.; formal analysis, A.I.; investigation, A.I.; resources, S.K. (Shiro Kubuki); data curation, M.S. and A.B.; writing—original draft preparation, A.I.; writing—review and editing, L.P., A.B., M.M., S.K. (Shiro Kubuki), S.K. (Stjepko Krehula) and Z.H.; visualization, A.I.; supervision, S.K. (Shiro Kubuki); project administration, S.K. (Shiro Kubuki). All authors have read and agreed to the published version of the manuscript.

Funding

This research was funded by Tokyo Metropolitan Government Advanced Research, Grant No. H29-1.

Institutional Review Board Statement

Not applicable.

Informed Consent Statement

Not applicable.

Data Availability Statement

The data presented in this study are available from the corresponding author upon request.

Conflicts of Interest

The authors declare no conflict of interest.

References

  1. Alangari, A.; Alqahtani, M.S.; Mateen, A.; Kalam, M.A.; Alshememry, A.; Ali, R.; Kazi, M.; Ghamdi, K.M.A.; Syed, R. Iron oxide nanoparticles: Preparation, characterization, and assessment of antimicrobial and anticancer activity. Adsorp. Sci. Technol. 2022, 9, 1562051. [Google Scholar] [CrossRef]
  2. Devi, H.S.; Singh, T.D. Iron oxide nanoparticles synthesis through a benign approach and its catalytic application. Perspect. Sci. 2016, 8, 287–289. [Google Scholar] [CrossRef]
  3. Tharani, K.; Christy, A.J.; Sagadevan, S.; Nehru, L.C. Photocatalytic and antibacterial performance of iron oxide nanoparticles formed by the combustion method. Chem. Phys. Lett. 2021, 771, 138524. [Google Scholar] [CrossRef]
  4. Wu, W.; Xiao, X.; Zhang, S.; Ren, F.; Jiang, C. Facile method to synthesize magnetic iron oxides/TiO2 hybrid nanoparticles and their photodegradation application of methylene blue. Nanoscale Res. Lett. 2011, 533, 1–15. [Google Scholar] [CrossRef]
  5. Tao, R.; Qu, M.; Zhang, S.; Quan, F.; Zhang, M.; Shen, W.; Mei, Y. Preparation of FeOOH supported by melamine sponge and its application for efficient phosphate removal. J. Environ. Chem. Eng. 2022, 10, 108064. [Google Scholar] [CrossRef]
  6. Zhong, Z.; Li, R.; Lin, W.; Xu, X.; Tian, X.; Lia, X.; Chen, X.; Kang, L. One-dimensional nanocrystals of cobalt perylene diimide polymer with in situ generated FeOOH for efficient photocatalytic water oxidation. Appl. Catal. B Environ. 2020, 260, 118–135. [Google Scholar] [CrossRef]
  7. Wang, L.; Nhat, T.N.; Zhang, Y.; Bi, Y.; Schmuki, P. Enhanced solar water splitting by swift charge separation in Au/FeOOH sandwiched single-crystalline Fe2O3 nanoflake photoelectrodes. Chem. Sus. Chem. 2017, 10, 2720–2727. [Google Scholar] [CrossRef]
  8. Huang, Y.; Xie, M.; Wang, Z.; Jiang, Y.; Huang, Q.; Bai, X.; Li, L.; Wu, F.; Chen, R. All-iron sodium-ion full-cells assembled via stable porous goethite nanorods with low strain and fast kinetics. Nano Energy 2019, 60, 294–304. [Google Scholar] [CrossRef]
  9. Liu, H.; Zou, J.; Ding, Y.; Liu, B.; Wang, Y. Novel α-FeOOH corner-truncated tetragonal prisms: Crystal structure, growth mechanism and lithium storage properties. J. Appl. Electrochem. 2019, 49, 657–669. [Google Scholar] [CrossRef]
  10. Pascariu, P.; Gherasim, C.; Airinei, A. Metal oxide nanostructures (MONs) as photocatalysts for ciprofloxacin degradation. Int. J. Mol. Sci. 2023, 24, 9564. [Google Scholar] [CrossRef] [PubMed]
  11. Krehula, S.; Ristić, M.; Petrović, Ž.; Krehula, L.K.; Mitar, I.; Musić, S. Effects of Cu doping on the microstructural, thermal, optical and photocatalytic properties of α-FeOOH and α-Fe2O3 1D nanoparticles. J. Alloys Compd. 2019, 802, 290–300. [Google Scholar] [CrossRef]
  12. Popov, N.; Krehula, S.; Ristić, M.; Kuzmann, E.; Homonnay, Z.; Bošković, M.; Stanković, D.; Kubuki, S.; Musić, S. Influence of Cr doping on the structural, magnetic, optical and photocatalytic properties of α-Fe2O3 nanorods. J. Phys. Chem. Solids 2021, 148, 109699. [Google Scholar] [CrossRef]
  13. Kobzi, B.; Watanabe, Y.; Akiyama, K.; Kuzmann, E.; Homonnay, Z.; Krehula, S.; Ristić, M.; Nishida, T.; Kubuki, S. 57Fe-Mössbauer study and methylene blue decomposing effect of nanoparticle mixtures composed of metallic iron and maghemite. J. Alloys Compd. 2017, 722, 94–100. [Google Scholar] [CrossRef]
  14. Zhang, B.; Khan, I.; Nagase, Y.; Ali, A.S.; Krehula, S.; Risti´c, M.; Music, S.; Kubuki, S. Highly covalent FeIII-O bonding in photo-Fenton active Sn-doped goethite nanoparticles. Mater. Chem. Phys. 2022, 287, 126247. [Google Scholar] [CrossRef]
  15. Darehnaranji, K.; Taghizadeh, S.M.; Mirzaei, E.; Berenjian, A.; Ebrahimi Nezhad, A. Size tuned synthesis of FeOOH nanorods toward self-assembled nanoarchitectonics. Langmuir 2021, 37, 115–123. [Google Scholar] [CrossRef]
  16. Shannon, R.D. Revised effective ionic radii and systematic studies of interatomic distances in halides and chalcogenides. Acta Cryst. A 1976, 32, 751–767. [Google Scholar] [CrossRef]
  17. Gerth, J. Unit-cell dimensions of pure and trace metal-associated goethites. Geochim. Cosmochim. Acta 1990, 54, 363–371. [Google Scholar] [CrossRef]
  18. Ishikawa, T.; Nagashima, A.; Kandori, K. Structure of nickel-doped α-FeOOH. J. Mater. Sci. 1991, 26, 6231–6236. [Google Scholar] [CrossRef]
  19. Cornell, R.M.; Schneider, W.; Giovanoli, R. The effect of nickel on the conversion of amorphous iron (III) hydroxide into more crystalline iron oxides in alkaline media. J. Chem. Technol. Biot. 1992, 53, 73–79. [Google Scholar] [CrossRef]
  20. Valášková, M.; Leštinský, P.; Matějová, L.; Klemencová, K.; Ritz, M.; Schimpf, C.; Motylenko, M.; Rafaja, D.; Bělík, J. Hematites Precipitated in Alkaline Precursors: Comparison of Structural and Textural Properties for Methane Oxidation. Int. J. Mol. Sci. 2022, 23, 8163. [Google Scholar] [CrossRef]
  21. Cheng, W.; Lindholm, J.; Holmboe, M.; Luong, N.T.; Shchukarev, A.; Ilton, E.S.; Hanna, K.; Boily, J.F. Nanoscale Hydration in Layered Manganese Oxides. Langmuir 2021, 37, 666–674. [Google Scholar] [CrossRef] [PubMed]
  22. Krehula, S.; Ristić, M.; Mitar, I.; Wu, C.; Li, X.; Jiang, L.; Wang, J.; Sun, G.; Zhang, T.; Perović, M.; et al. Synthesis and Properties of Ni-doped Goethite and Ni-doped Hematite Nanorods. Croat. Chem. Acta 2018, 91, 389–401. [Google Scholar] [CrossRef]
  23. Sayyed, M.I.; Abdo, M.A.; Ali, H.E.; Ahmed, H.A.; Sadeq, M.S. Influence NiO on the structure, elastic properties and buildup factor of BaO-CdO-borosilicate glasses. Phys. Scr. 2023, 98, 075937. [Google Scholar] [CrossRef]
  24. Amini, M.; Mousazade, Y.; Zand, Z.; Bagherzadeh, M.; Najafpour, M.M. Ultra-small and highly dispersive iron oxide hydroxide as an efficient catalyst for oxidation reactions: A Swiss-army-knife catalyst. Sci. Rep. 2021, 11, 6642. [Google Scholar] [CrossRef] [PubMed]
  25. Aoyagi, T.; Fujieda, T.; Toyama, T.; Kono, K.; Takamatsu, D.; Hirano, T.; Naito, T.; Hayashi, Y.; Takizawa, H. Electrochemical properties and in-situ XAFS observation of Li2O-V2O5-P2O5-Fe2O3 quaternary-glass and crystallized-glass cathodes. J. Non-Cryst. Solids 2016, 453, 28–35. [Google Scholar] [CrossRef]
  26. Ibrahim, A.; Kubo, K.; Watanabe, S.; Shiba, S.; Khan, I.; Zhang, B.; Homonnay, Z.; Kuzmann, E.; Pavić, L.; Santić, A.; et al. Enhancement of electrical conductivity and thermal stability of Iron- or Tin- substituted vanadate glass and glass-ceramics nanocomposite to be applied as a high-performance cathode active material in sodium-ion batteries. J. Alloys Compd. 2023, 930, 167366. [Google Scholar] [CrossRef]
  27. Latif, C.; Negara, V.S.I.; Wongtepa, W.; Thamatkeng, P.; Zainuri, M.; Pratapa, S. Fe K-Edge X-ray absorption near-edge spectroscopy (XANES) and X-ray diffraction (XRD) analyses of LiFePO4 and its base materials. J. Phys. Conf. Ser. 2018, 985, 12021. [Google Scholar] [CrossRef]
  28. Li, W.; Li, F.; Yang, H.; Wu, X.; Zhang, P.; Shan, Y.; Sun, L. A bio-inspired coordination polymer as outstanding water oxidation catalyst via second coordination sphere engineering. Nat. Commun. 2019, 10, 5074. [Google Scholar] [CrossRef]
  29. Ibrahim, A.; Arita, Y.; Ali, A.S.; Khan, I.; Zhang, B.; Razum, M.; Pavić, L.; Santić, A.; Homonnay, Z.; Kuzmann, E.; et al. Impact of adding Fe ions on the local structure and electrochemical performance of P2O5-V2O5 glass and glass ceramics used as a cathode in LIBs. J. Phys. Chem. Solids 2023, 179, 111391. [Google Scholar] [CrossRef]
  30. Ismail, A.S.M.; Torregrosa, I.G.; Vollenbroek, J.C.; Folkertsma, L.; Bomer, J.G.; Haarman, T.; Ghiasi, M.; Schellhorn, M.; Nachtegaal, M.; Odijk, M.; et al. Detection of spontaneous FeOOH formation at the hematite/Ni (Fe)OOH interface during photoelectrochemical water splitting by operando X-ray absorption spectroscopy. ACS Catal. 2021, 19, 12324–12335. [Google Scholar] [CrossRef]
  31. Chang, G.; Zhou, Y.; Wang, J.; Zhang, H.; Yan, P.; Wu, H.B.; Yu, X.Y. Dynamic reconstructed RuO2/NiFeOOH with coherent interface for efficient seawater oxidation. Small 2023, 19, 2206768. [Google Scholar] [CrossRef] [PubMed]
  32. Wan, X.; Liu, Q.; Liu, J.; Liu, S.; Liu, X.; Zheng, L.; Shang, J.; Yu, R.; Shui, J. Iron atom-cluster interactions increase activity and improve durability in Fe-N-C fuel cells. Nat. Commun. 2022, 13, 2963. [Google Scholar] [CrossRef] [PubMed]
  33. Khan, I.; Zhang, B.; Matsuda, K.; Bingham, P.A.; Kitajou, A.; Inoishi, A.; Okada, S.; Yoshioka, S.; Nishida, T.; Homonnay, Z.; et al. Development of electrically conductive ZrO2-CaO-Fe2O3-V2O5 glass and glass-ceramics as a new cathode active material for Na-ion batteries with high performance. J. Alloys Compd. 2022, 899, 163309. [Google Scholar] [CrossRef]
  34. Zhao, S.; Wang, Y.; Dong, J.; He, C.T.; Yin, H.; An, P.; Zhao, K.; Zhang, X.; Gao, C.; Zhang, L.; et al. Ultrathin metal-organic framework nanosheets for electrocatalytic oxygen evolution. Energy 2016, 1, 16184. [Google Scholar] [CrossRef]
  35. Jia, C.; Zhen, C.; Yin, L.; Zhu, H.; Du, P.; Han, A.; Liu, G.; Cheng, H.M. Topologic transition-induced abundant undercoordinated Fe active sites in NiFeOOH for superior oxygen evolution. Nano Energy 2023, 106, 108044. [Google Scholar] [CrossRef]
  36. Pavlenko, V.; Khosravi, S.; Żółtowska, S.; Haruna, A.B.; Zahid, M.; Mansurov, Z.; Supiyeva, Z.; Galal, A.; Ozoemena, K.I.; Abbas, Q.; et al. A comprehensive review of template-assisted porous carbons: Modern preparation methods and advanced applications. Mater. Sci. Eng. R Rep. 2022, 149, 1006820. [Google Scholar] [CrossRef]
  37. Alothman, Z.A. A Review: Fundamental aspects of silicate mesoporous materials. Materials 2012, 5, 2874–2902. [Google Scholar] [CrossRef]
  38. Barsotti, E.; Tan, S.P.; Piri, M.; Chen, J.H. Capillary-condensation hysteresis in naturally-occurring nanoporous media. Fuel 2020, 263, 116441. [Google Scholar] [CrossRef]
  39. Blaker, C.; Muthmann, J.; Pasel, C.; Bathen, D. Characterization of activated carbon adsorbents -state of the art and novel approaches. A Chem. Bio. Eng. Rev. 2019, 6, 119–138. [Google Scholar] [CrossRef]
  40. Landi, S., Jr.; Segundo, I.R.; Freitas, E.; Vasilevskiy, M.; Carneiro, J.; Tavares, C.J. Use and misuse of the Kubelka-Munk function to obtain the band gap energy from diffuse reflectance measurements. Solid State Commun. 2022, 341, 114573. [Google Scholar] [CrossRef]
  41. Tauc, J.; Grigorovici, R.; Vancu, A. Optical properties and electronic structure of amorphous germanium. Phys. Status Solidi 1966, 15, 627–637. [Google Scholar] [CrossRef]
  42. Sherman, D.M.; Waite, T.D. Electronic spectra of Fe3+ oxides and oxide hydroxide in the near IR to near UV. Am. Miner. 1985, 70, 1262–1269. [Google Scholar]
  43. Arunachalam, M.; Lee, D.G.; Das, P.K.; Subhash, K.R.; Ahn, K.S.; Kang, S.H. Surface engineering of Ba-doped TiO2 nanorods by Bi2O3 passivation and (NiFe)OOH Co-catalyst layers for efficient and stable solar water oxidation. Int. J. Hydrogen Energy 2022, 47, 40920–40931. [Google Scholar] [CrossRef]
  44. Vijaya, K.P.; Jafar, A.A.; Karthikeyan, M. Synthesis and characterization of NiO nanoparticles by chemical as well as green routes and their comparisons with respect to cytotoxic effect and toxicity studies in microbial and MCF-7 cancer cell models. SN Appl. Sci. 2019, 1, 1083. [Google Scholar] [CrossRef]
  45. Schumacher, B.; Bach, H.; Spitzer, P.; Obrzut, J. Electrical properties. In Springer Handbook of Materials Measurement Methods; Springer: Berlin/Heidelberg, Germany, 2011; pp. 431–484. [Google Scholar] [CrossRef]
  46. Zhou, L.; Huang, Z.H.; Kang, F.; Lv, R. Bimetallic substrate induction synthesis of binder-free electrocatalysts for stable seawater oxidation at industrial current densities. Chem. Eng. J. 2023, 458, 141457. [Google Scholar] [CrossRef]
  47. Wang, H.; Peng, L.; Li, G.; Zhang, W.; Liang, Z.; Zhao, H.; An, T. Photocatalytic ozonation inactivation of bioaerosols by NiFeOOH nanosheets in situ grown on nickel foam. Appl. Catal. B Environ. 2023, 324, 122273. [Google Scholar] [CrossRef]
  48. Guskos, N.; Papadopoulos, G.J.; Likodimos, V.; Patapis, S.; Yarmis, D.; Przepiera, A.; Przepiera, K.; Majszczyk, J.; Typek, J.; Wabia, M.; et al. Photoacoustic, EPR and electrical conductivity investigations of three synthetic mineral pigments: Hematite, goethite and magnetite. Mater. Res. Bull. 2002, 37, 1051–1061. [Google Scholar] [CrossRef]
  49. Pavić, L.; Skoko, Ž.; Gajović, A.; Su, D.; Milanković, A.M. Electrical transport in iron phosphate glass-ceramics. J. Non-Cryst. Solids 2018, 502, 44–53. [Google Scholar] [CrossRef]
  50. Šantić, A.; Banhatti, R.D.; Pavić, L.; Ertap, H.; Yüksek, M.; Karabulut, M.; Milanković, A.M. Polaronic transport in iron phosphate glasses containing HfO2 and CeO2. Phys. Chem. Chem. Phys. 2017, 19, 3999–4009. [Google Scholar] [CrossRef]
  51. Milanković, A.M.; Pavić, L.; Ertap, H.; Karabulut, M. Polaronic mobility in boron doped iron phosphate glasses: Influence of structural disorder on summerfield scaling. J. Am. Ceram. Soc. 2012, 95, 2007–2014. [Google Scholar] [CrossRef]
  52. Pavić, L.; Sklepić, K.; Skoko, Z.; Tricot, G.; Mosner, P.; Koudelka, L.; Milanković, A.M. Ionic conductivity of lithium germanium phosphate glass-ceramics. J. Phys. Chem. C 2019, 123, 23312–23322. [Google Scholar] [CrossRef]
  53. Alexandrov, V.; Rosso, K.M. Electron transport in pure and substituted iron oxyhydroxides by small-polaron migration. J. Chem. Phys. 2014, 140, 234701. [Google Scholar] [CrossRef] [PubMed]
  54. Porter, I.J.; Cushing, S.K.; Carneiro, L.M.; Lee, A.; Ondry, J.C.; Dahl, J.C.; Chang, H.T.; Alivisatos, A.P.; Leone, S.R. Photoexcited small polaron formation in goethite (α-FeOOH) nanorods probed by transient extreme ultraviolet spectroscopy. J. Phys. Chem. Lett. 2018, 9, 4120–4124. [Google Scholar] [CrossRef] [PubMed]
  55. Su, N.; Sun, M.; Wang, Q.; Jin, J.; Sui, J.; Liu, C.; Gao, C. Pressure-induced mixed protonic-electronic to pure electronic conduction transition in goethite. J. Phys. Chem. C 2021, 125, 2713–2718. [Google Scholar] [CrossRef]
  56. Beda, A.; Vaulot, C.; Rabuel, F.; Morcrette, M.; Ghimbeu, C.M. The role of specific and active surface areas in optimizing hard carbon irreversible capacity loss in sodium ion batteries. Energy Adv. 2022, 1, 185–190. [Google Scholar] [CrossRef]
  57. Wrogemann, M.; Fromm, O.; Deckwirth, F.; Beltrop, K.; Heckmann, A.; Winter, M.; Placke, T. Impact of degree of graphitization, surface properties and particle size distribution on electrochemical performance of carbon anodes for potassium-ion batteries. Batter. Supercaps. 2022, 5, e202200045. [Google Scholar] [CrossRef]
Figure 1. XRD pattern of α-NixFe1−xOOH nanoparticles (NPs) with ‘x’ from 0 to 0.50.
Ijms 24 14300 g001
Figure 2. (a) Thermogravimetric (TG) and (b) differential thermal analysis (DTA) of α-NixFe1−xOOH NPs with ‘x’ from 0.0 to 0.50.
Ijms 24 14300 g002
Figure 3. FTIR spectra of α-NixFe1−xOOH NPs with ‘x’ from 0.0 to 0.50.
Ijms 24 14300 g003
Figure 4. Fe-K and Ni-K edge XANES and FT-EXAFS spectra of α-NixFe1−xOOH NPs with ‘x’ from 0.0 to 0.50 together with references of Fe-foil, α-Fe2O3, Ni-foil, and NiO, (a) Fe-K edge XANES, (b) Fe-K FT-EXAFS, (c) Fe-K FT-EXAFS, and (d) Ni-K FT-EXAFS.
Ijms 24 14300 g004
Figure 5. 57Fe-Mössbauer spectra of α-NixFe1−xOOH NPs with ‘x’ from 0.00 to 0.50 measured at room temperature in the velocity range of (a) ±12 mm s−1 and (b) ±3 mm s−1.
Ijms 24 14300 g005
Figure 6. 57Fe-Mössbauer spectra of α-NixFe1−xOOH NPs nanoparticles measured at 86 K in the velocity range of (a) ±12 mm s−1, with ‘x’ from 0.00 to 0.20 and (b) ±3 mm s−1 with ‘x’ of 0.20 and 0.50.
Ijms 24 14300 g006
Figure 7. TEM images of α-NixFe1−xOOH NPs with ‘x’ of 0.10 and 0.20.
Ijms 24 14300 g007
Figure 8. Histograms of the length of α-NixFe1−xOOH NPs with ‘x’ of (a) 0.10 and (b) 0.20.
Ijms 24 14300 g008
Figure 9. (a) N2 Adsorption/desorption isotherm and (b) the corresponding BJH pore size distribution curves of α-NixFe1−xOOH NPs with ‘x’ of 0, 0.05, 0.10, 0.15, 0.20, 0.30, 0.40, and 0.50 using N2 as the adsorption material.
Ijms 24 14300 g009
Figure 10. (a) UV-Vis diffuse reflectance spectra and (b) Tauc plot of α-NixFe1−xOOH NPs with ‘x’ from 0 to 0.50. The dashed lines and arrows are drawn as guides for the eyes.
Ijms 24 14300 g010
Figure 11. c/c0 versus t plots (a) in the dark and (b) under visible-light irradiation, and (c) ln (c0/c) versus t under the photo-Fenton reaction occurred by 20 µM MBaq in the aqueous solution and α-NixFe1−xOOH NPs.
Ijms 24 14300 g011
Figure 12. Complex impedance spectra @110 °C for samples (a) Ni10, (b) Ni30, and (c) Ni50. The symbols (coloured circle) denote experimental values, whereas the solid cyan line corresponds to the best fit. The corresponding equivalent circuit model, comprised of a parallel combination of the resistor (R) and the constant-phase element (CPE), is used for fitting the data of an individual spectrum, and its interpretation is shown in each figure (defined as follows: b-bulk phase).
Ijms 24 14300 g012
Figure 13. Conductivity spectra for sample (a) Ni10, (b) Ni20, and (c) Arrhenius plots of direct current (DC) conductivity (log(σDC) versus 1000/T) for all studied samples. Solid lines in (c) represent the least-square linear fits to the experimental data. The error bars are, at most, of the order of the symbol size.
Ijms 24 14300 g013
Figure 14. (a) Conductivity isotherms and (b) DC conductivity obtained at @110 °C with activation energy for DC conductivity, EDC, for all studied samples.
Ijms 24 14300 g014
Figure 15. Charge–discharge curve and capacity recycling of cathode active performance for α-NixFe1−xOOH NPs in (a) Li-and (b) Na-ion batteries evaluated under the current density of 0.15 mA and the voltage between 0.8 and 4.0 V.
Ijms 24 14300 g015
Table 1. The major crystalline phase, lattice parameters, space group, and crystal structure of α-NixFe1−xOOH nanoparticles.
SampleMajor Crystalline PhaseLattice Parameters (Å)V
3)
FWHM (110)
(Deg.)
d100
(Å)
Space Group% of Constituent Phases
(Å)(Degree)
abcαβγ
Ni0FeOOH4.62159.95853.0249909090143
(17)
0.587
(7)
4.1945
(4)
Pbnm100
Ni5FeOOH4.6223
(1)
9.9565
(1)
3.0260
(1)
909090148
(19)
0.570
(7)
4.1957
(4)
Pbnm100
Ni10FeOOH4.6255
(1)
9.9834
(2)
3.0273
(1)
909090148
(2)
0.572
(8)
4.1985
(5)
Pbnm100
Ni15FeOOH4.6255
(1)
9.9999
(3)
3.0289
(1)
909090159
(4)
0.530
(13)
4.206
(2)
Pnma100
Ni20FeOOH4.6240
(1)
9.9815
(2)
3.0287
(1)
909090194
(3)
0.436
(7)
4.1945
(5)
Pnma100
Ni30FeOOH4.6330
(1)
9.9845
(2)
3.0245
(1)
909090168
(4)
0.503
(12)
4.184
(2)
Pnma92.37
αNi(OH)23.2006
(1)
3.2006
(1)
23.456
(5)
9090120---R3m:H7.63
Ni40FeOOH4.6247
(1)
9.9792
(2)
3.0268
(1)
909090183
(4)
0.461
(11)
4.199
(19)
Pnma91.93
αNi(OH)23.1932
(1)
3.1932
(1)
23.445
(4)
9090120---R3m:H8.07
Ni50FeOOH4.6240
(1)
9.9723
(2)
3.0242
(1)
909090173
(4)
0.487
(12)
4.199
(18)
Pnma90.65
αNi(OH)23.0972
(1)
3.0972
(1)
23.972
(7)
9090120---R3m:H9.35
Table 2. Mössbauer parameters of α-NixFe1−xOOH nanoparticles obtained from the 57Fe-Mössbauer spectra measured in the velocity range from 12 mm s−1 to −12 mm s−1 at room temperature.
SampleComponentA
(%)
δ
(mms−1)
Δ
(mms−1)
Γ
(mms−1)
Bhf (T)Phase
Ni0sextet95.20.36 ± 0.01−0.26 ± 0.010.88 ± 0.0132.95Goethite
doublet4.80.53 ± 0.011.73 ± 0.010.19 ± 0.01-superparamagnetic
Ni10sextet74.40.43 ± 0.01−0.26 ± 0.010.86 ± 0.0128.23Goethite
doublet25.60.34 ± 0.010.71 ± 0.010.78 ± 0.02-superparamagnetic
Ni20sextet17.10.33 ± 0.11−0.13 ± 0.162.63 ± 0.2827.84Goethite
doublet82.90.38 ± 0.010.65 ± 0.010.55 ± 0.01-superparamagnetic
Ni30sextet19.20.31 ± 0.06−0.10 ± 0.121.48 ± 0.1727.16Goethite
doublet80.80.38 ± 0.010.64 ± 0.010.53 ± 0.01-superparamagnetic
Ni40doublet1000.38 ± 0.010.62 ± 0.010.52 ± 0.01-superparamagnetic
Ni50doublet1000.38 ± 0.010.58 ± 0.010.49 ± 0.01-superparamagnetic
δ: isomer shift, Δ: quadrupole splitting, Γ: FWHM, Bhf: hyperfine magnetic distribution.
Table 3. Mössbauer parameters of α-NixFe1−xOOH NPs obtained from the 57Fe-Mössbauer spectra measured in the velocity range from 3 mm s−1 to −3 mm s−1 at room temperature.
SampleComponentA
(%)
δ
(mms−1)
Δ
(mms−1)
Γ
(mms−1)
Bhf
(T)
Phase
Ni20sextet2.610.25 ± 0.01−0.10 ± 0.010.33 ± 0.2627.72Goethite
doublet50.250.34 ± 0.010.84 ± 0.040.53 ± 0.01-amorphous
doublet47.140.33 ± 0.010.51 ± 0.020.42 ± 0.02-Superparamagnetic
Ni30sextet15.720.29 ± 0.01−0.14 ± 0.011.11 ± 0.2127.08Goethite
doublet51.810.33 ± 0.010.79 ± 0.020.48 ± 0.01-amorphous
doublet32.460.33 ± 0.010.45 ± 0.010.37 ± 0.01-Superparamagnetic
Ni40doublet42.270.33 ± 0.010.85 ± 0.030.46 ± 0.01-amorphous
doublet57.730.33 ± 0.010.48 ± 0.010.37 ± 0.01-Superparamagnetic
Ni50doublet39.450.33 ± 0.010.84 ± 0.020.44 ± 0.01-amorphous
doublet60.550.33 ± 0.010.47 ± 0.010.35 ± 0.01-Superparamagnetic
Table 4. Average length, width, and ratio (length/width) for α-NixFe1−xOOH NPs with ‘x’ of 0, 0.10, and 0.20 evaluated from the TEM images.
SampleAve. Length
(nm)
Ave. Width
(nm)
Ave. Ratio (Length/Width)
Ni0181 ± 83 [14]21.6 ± 6.6 [14]9.6 ± 6.5 [14]
Ni10141 ± 5433.2 ± 11.24.6 ± 2.0
Ni20263 ± 17942.9 ± 13.96.3 ± 3.6
Table 5. Specific surface area by BET method, pore diameter, pore volume, bandgap value, and k value of α-NixFe1−xOOH NPs obtained from DRS and MB degradation test.
SampleBET
SSA (m2 g−1)
Pore Diameter
(nm)
Pore Volume
(cm3 g−1)
Bandgap (eV)k/10−3 min−1
Ni045.12.510.602.716.2 ± 0.1
Ni559.92.510.592.657.6 ± 0.1
Ni1073.92.510.512.5514.6 ± 0.6
Ni151351.990.392.433.3 ± 0.1
Ni20174.01.990.442.473.2 ± 0.1
Ni30145.02.240.192.062.8 ± 0.1
Ni4096.32.240.112.135.6 ± 0.1
Ni50117.33.880.152.153.95 ± 0.2
Table 6. DC conductivity, σDC; activation energy, EDC; and pre-exponential factor, σ 0 * , for all studied glasses.
GlassσDC a/
(Ω cm)−1
EDC/kJmol−1 σ 0 * /(Ω cm)−1
Ni105.52 × 10−1073.01.42
Ni201.82 × 10−1080.41.99
Ni303.56 × 10−1182.11.55
Ni401.41 × 10−1182.51.22
Ni505.30 × 10−1280.50.39
a values at 90 °C.
Table 7. Discharge capacity and capacity retention of thecharge–discharge capacity performance for α-NixFe1−xOOH nanoparticles measured at the current rates of 5 and 50 mAh g−1 in LIB.
Sample5 mAh g−150 mA mAh g−1
Discharge Capacity
(mAh g−1)
Capacity Retention
(%)
Discharge Capacity
(mAh g−1)
Capacity Retention
(%)
Ni010690.433320.3
Ni103637.435012.4
Ni202710.44949.6
Ni302500.9--
Table 8. Discharge capacity and capacity retention of the charge–discharge capacity performance for a-NixFe1−xOOH nanoparticles measured at the current rates of 5 and 50 mAh g−1 in SIB.
Sample5 mAh g−150 mA mAh g−1
Discharge Capacity
(mAh g−1)
Capacity Retention
(%)
Discharge Capacity
(mAh g−1)
Capacity Retention
(%)
Ni011031.7--
Ni1011621.6--
Ni2022312.710749.4
Ni3018921.310145.8
Ni5020227.79537.6
Table 9. Fe and Ni concentrations of α-NixFe1−xOOH nanoparticles synthesizing.
Sample Code[Fe]
(mol L−1)
[Ni]
(mol L−1)
N i F e + N i mol %
Ni00.10000
Ni50.0950.0055
Ni100.0900.01010
Ni150.0850.01515
Ni200.0800.02020
Ni300.0700.03030
Ni400.0600.04040
Ni500.0500.05050
Disclaimer/Publisher’s Note: The statements, opinions and data contained in all publications are solely those of the individual author(s) and contributor(s) and not of MDPI and/or the editor(s). MDPI and/or the editor(s) disclaim responsibility for any injury to people or property resulting from any ideas, methods, instructions or products referred to in the content.

