
Alteration of Neural Network and Hippocampal Slice Activation through Exosomes Derived from 5XFAD Nasal Lavage Fluid

 , and
, and 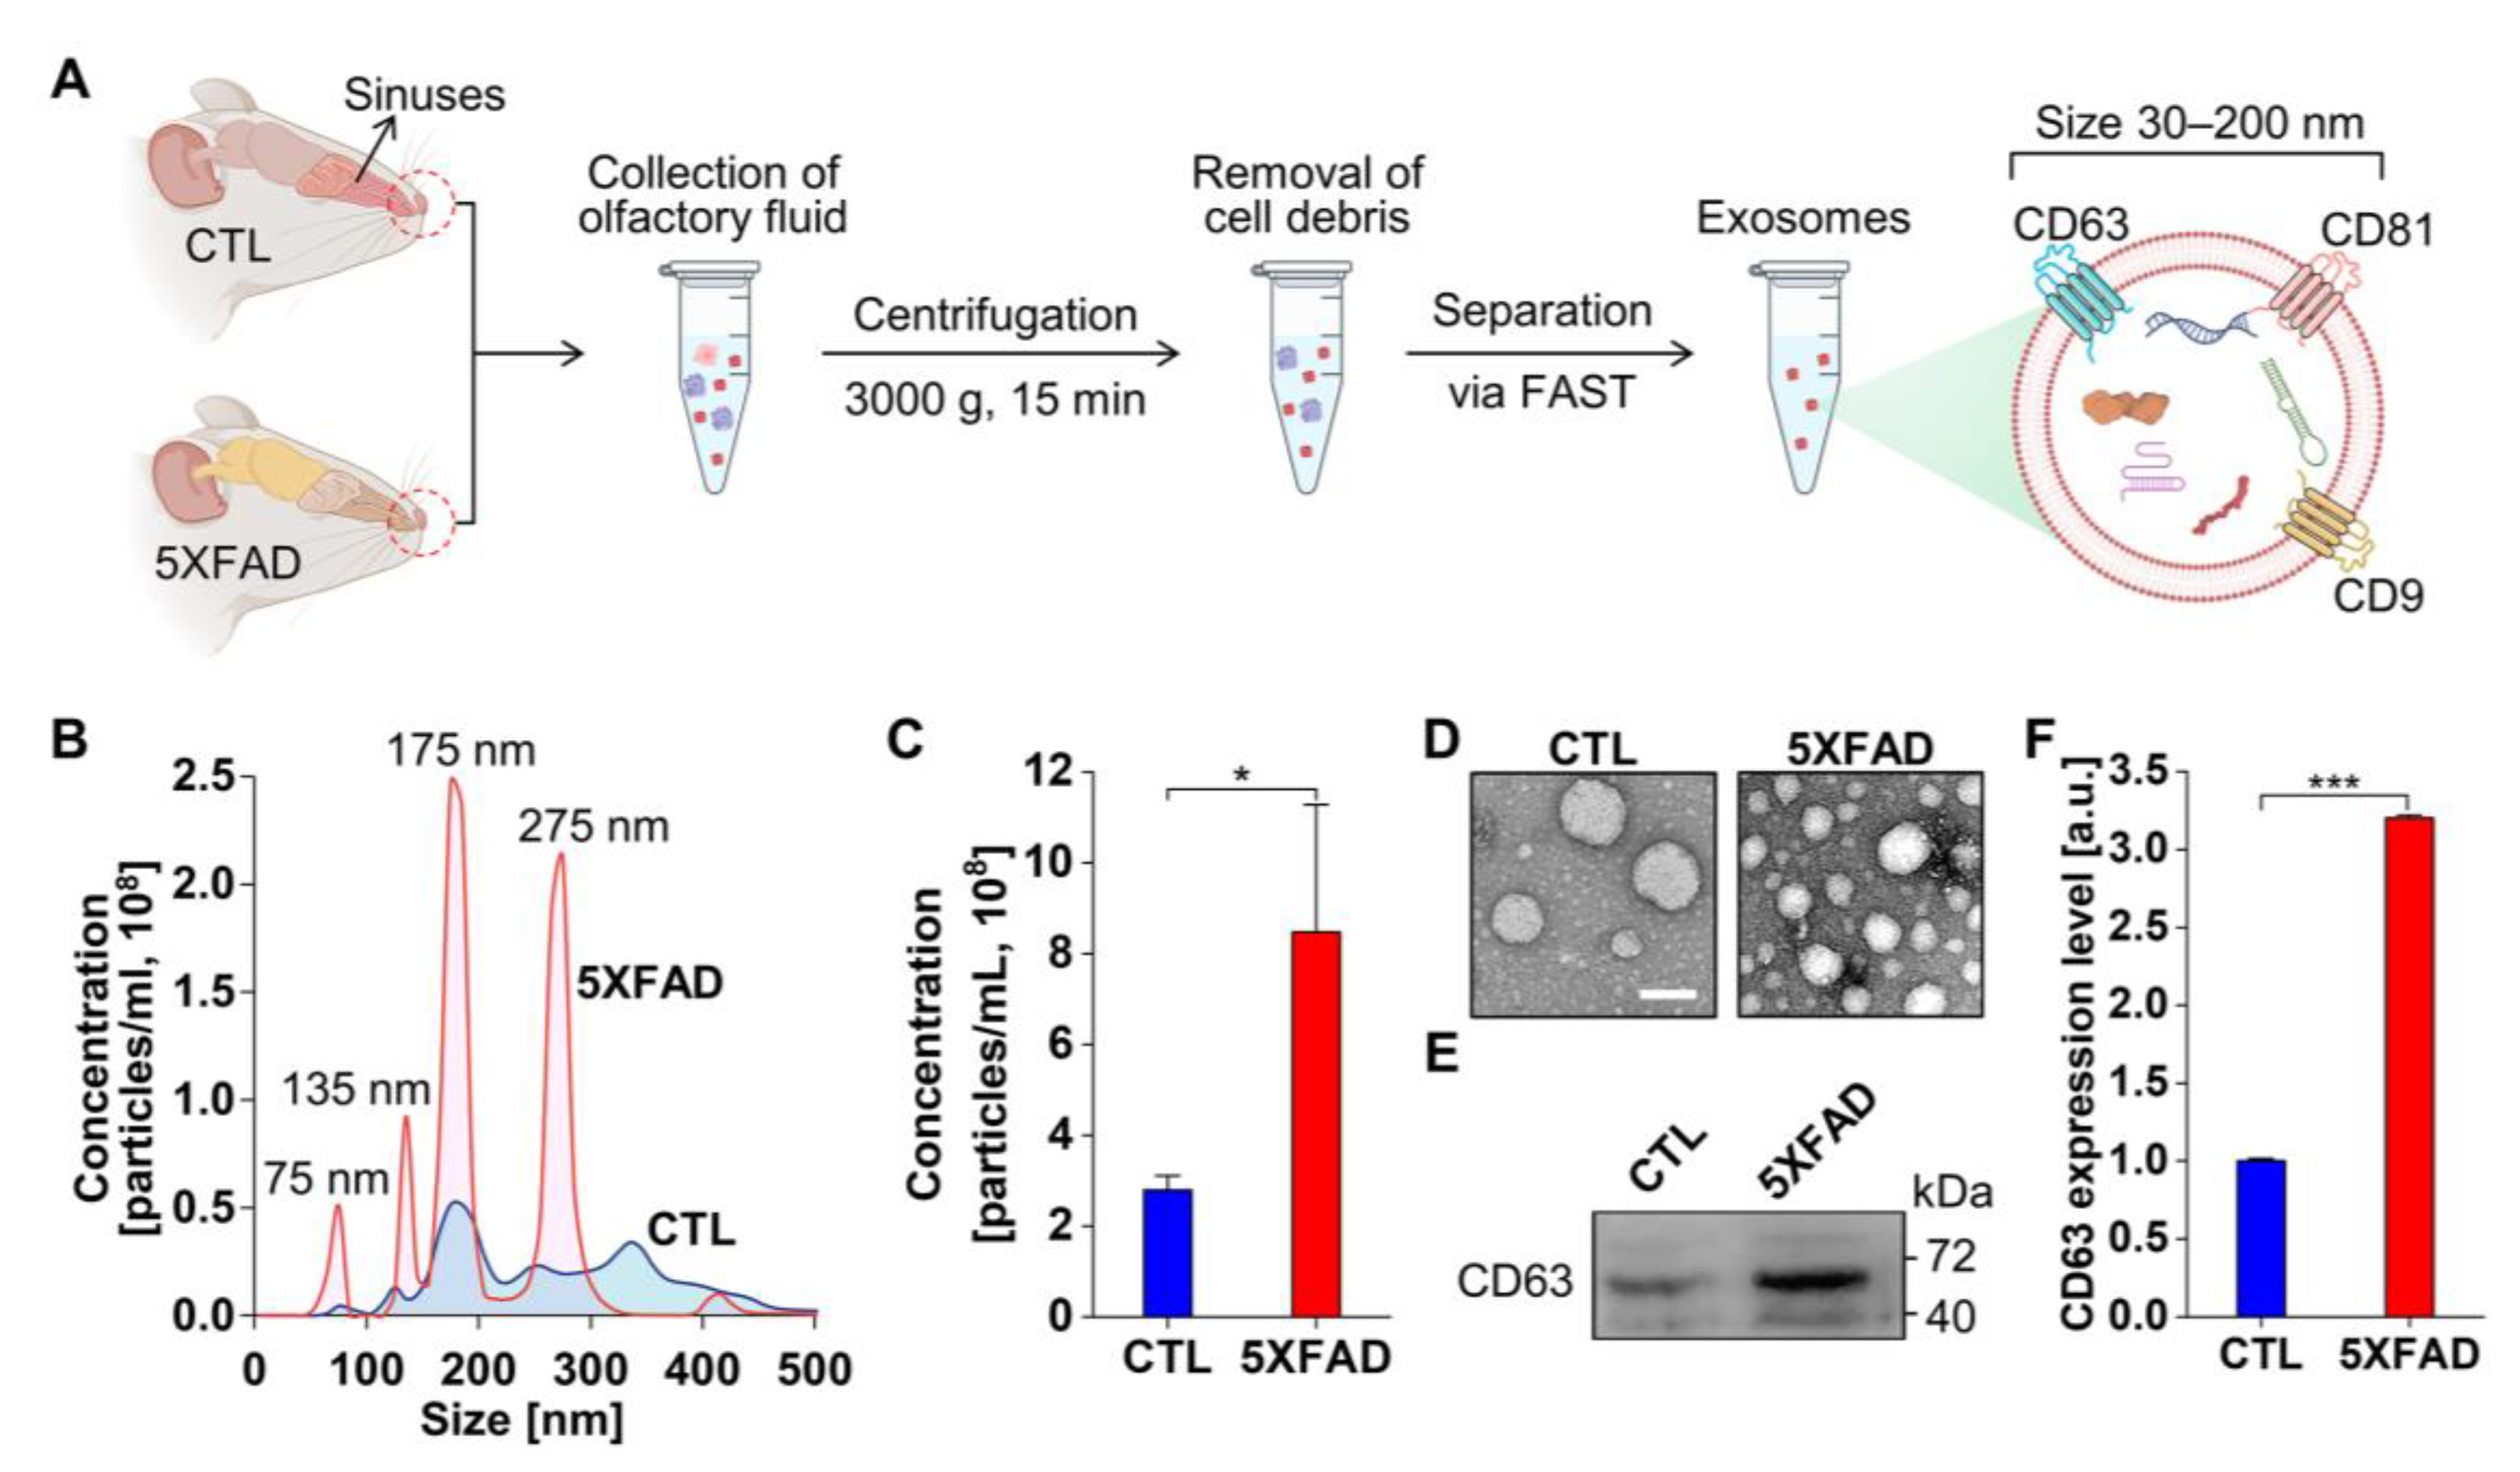
Abstract
1. Introduction
2. Results
2.1. Characterization of Exosomes Isolated from the NLF of 5XFAD Mice Using the Flow Amplification Separation Technology (FAST)
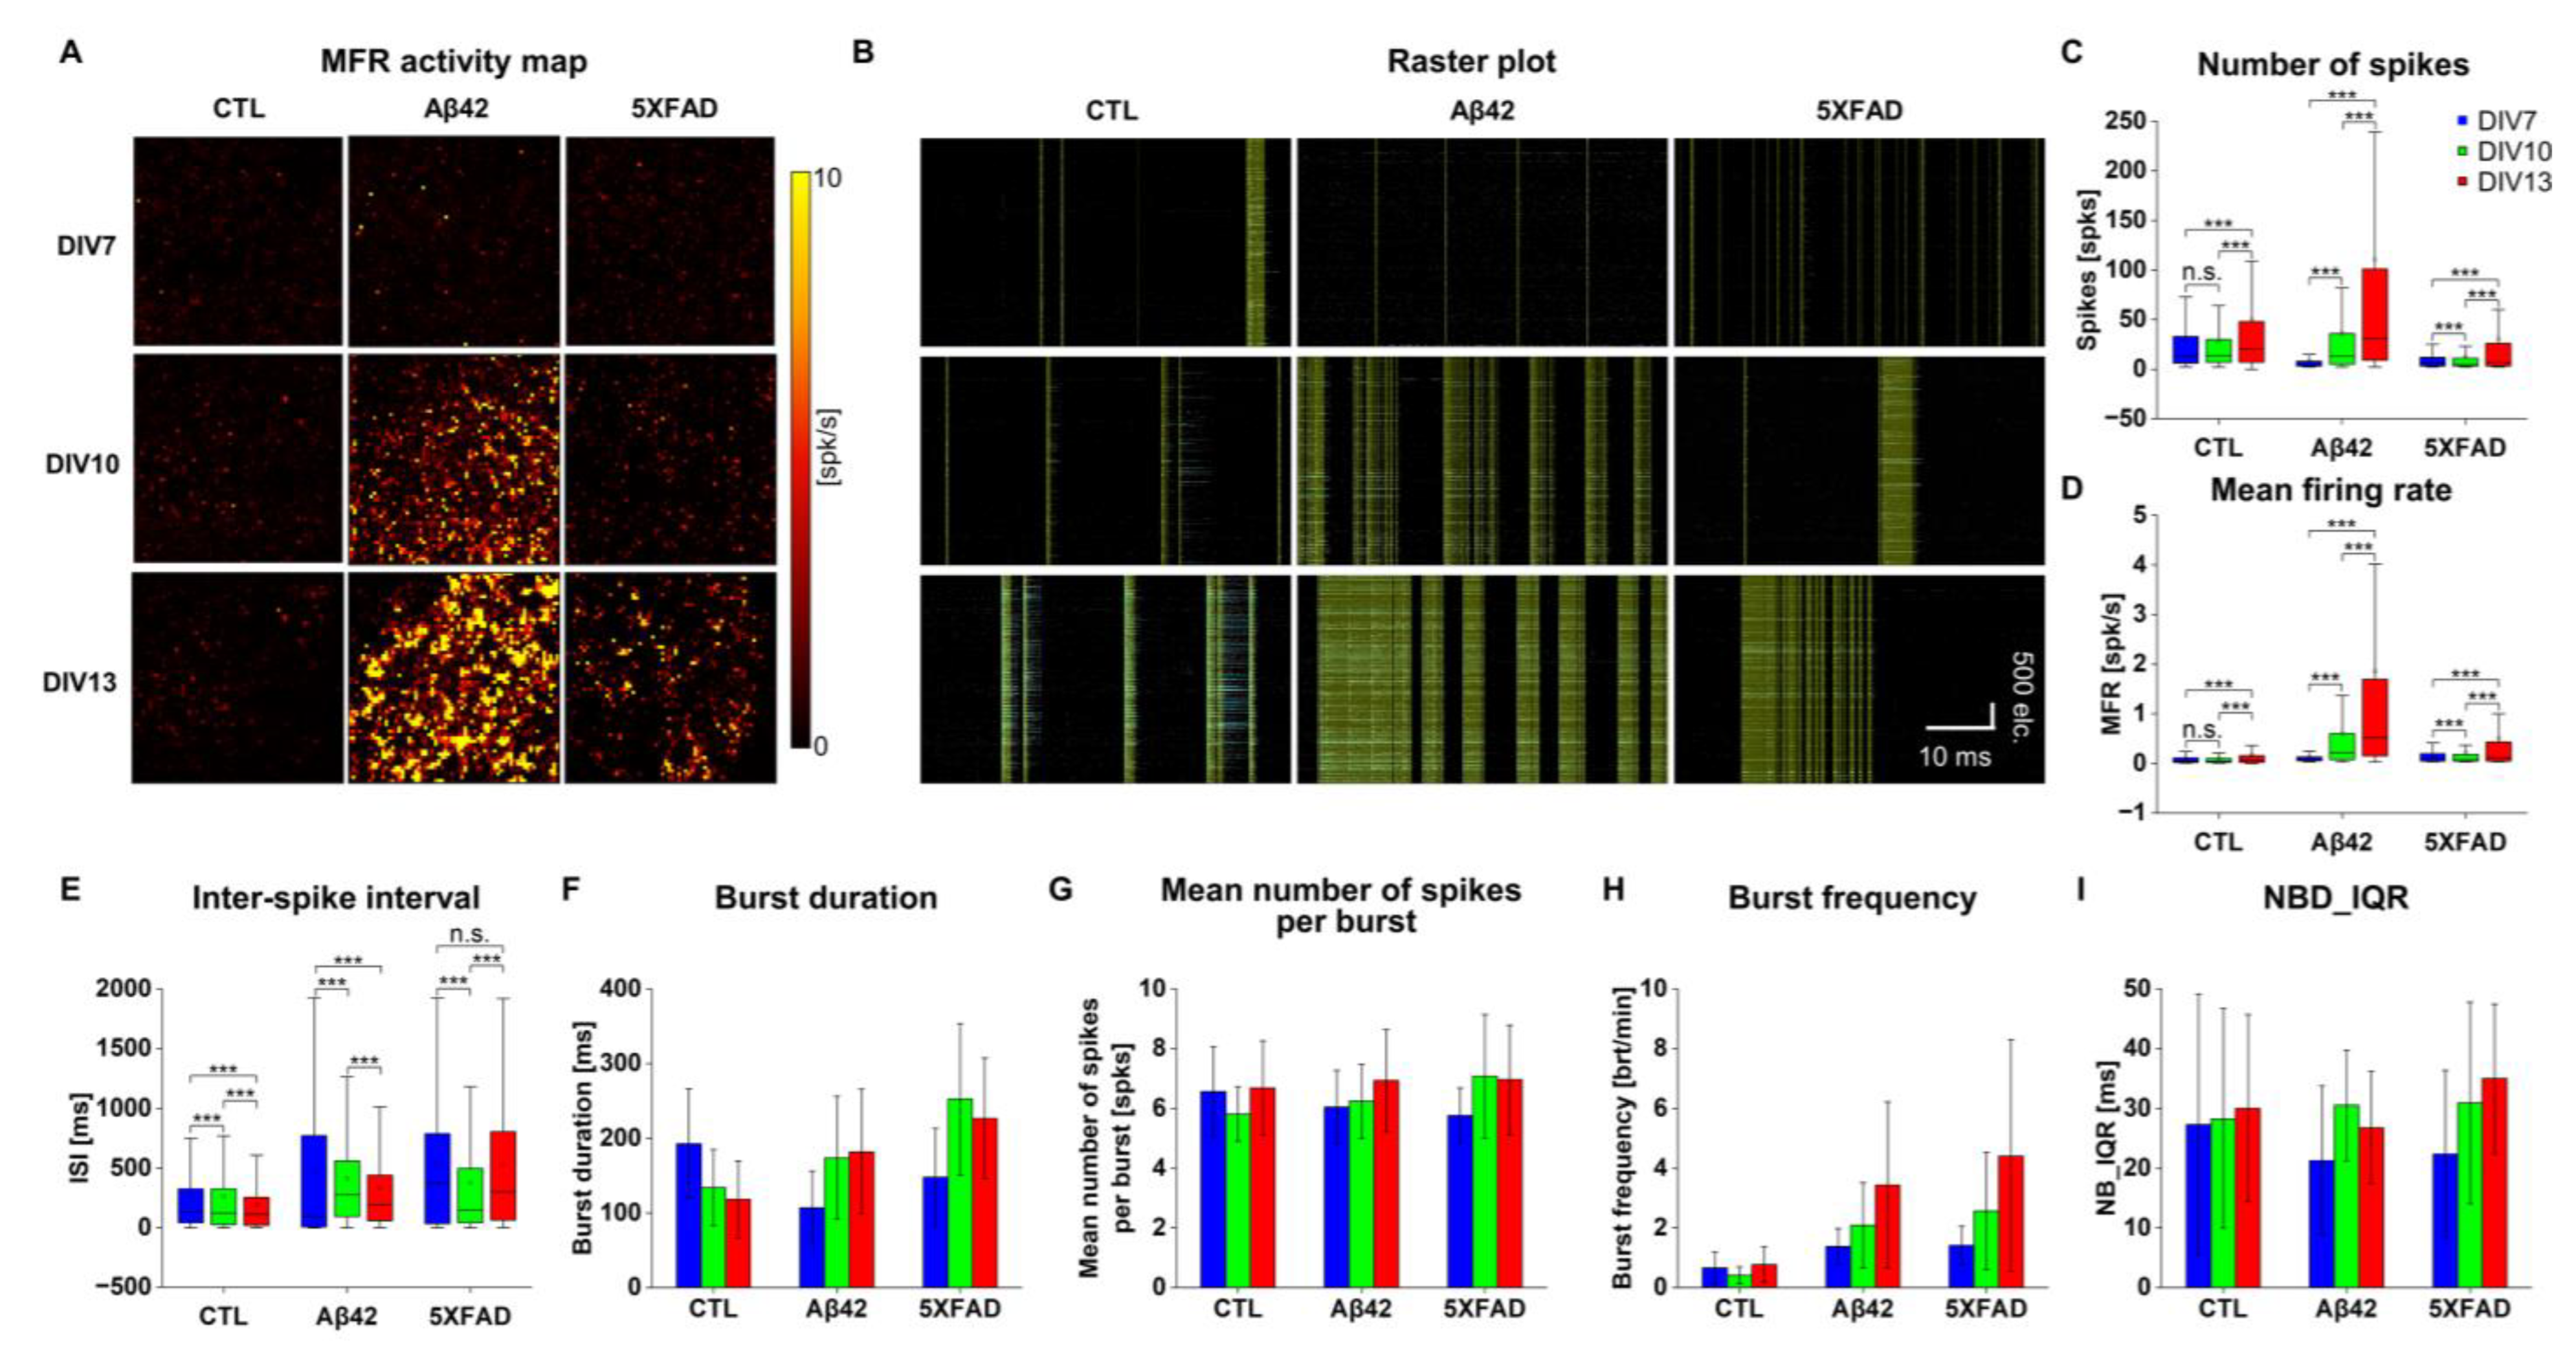
2.2. Altered Neuronal Excitability and Network Connectivity in Primary Cortical Neuron Cultures Stimulated with Aβ42 Oligomers and 5XFAD NLF-Derived Exosomes
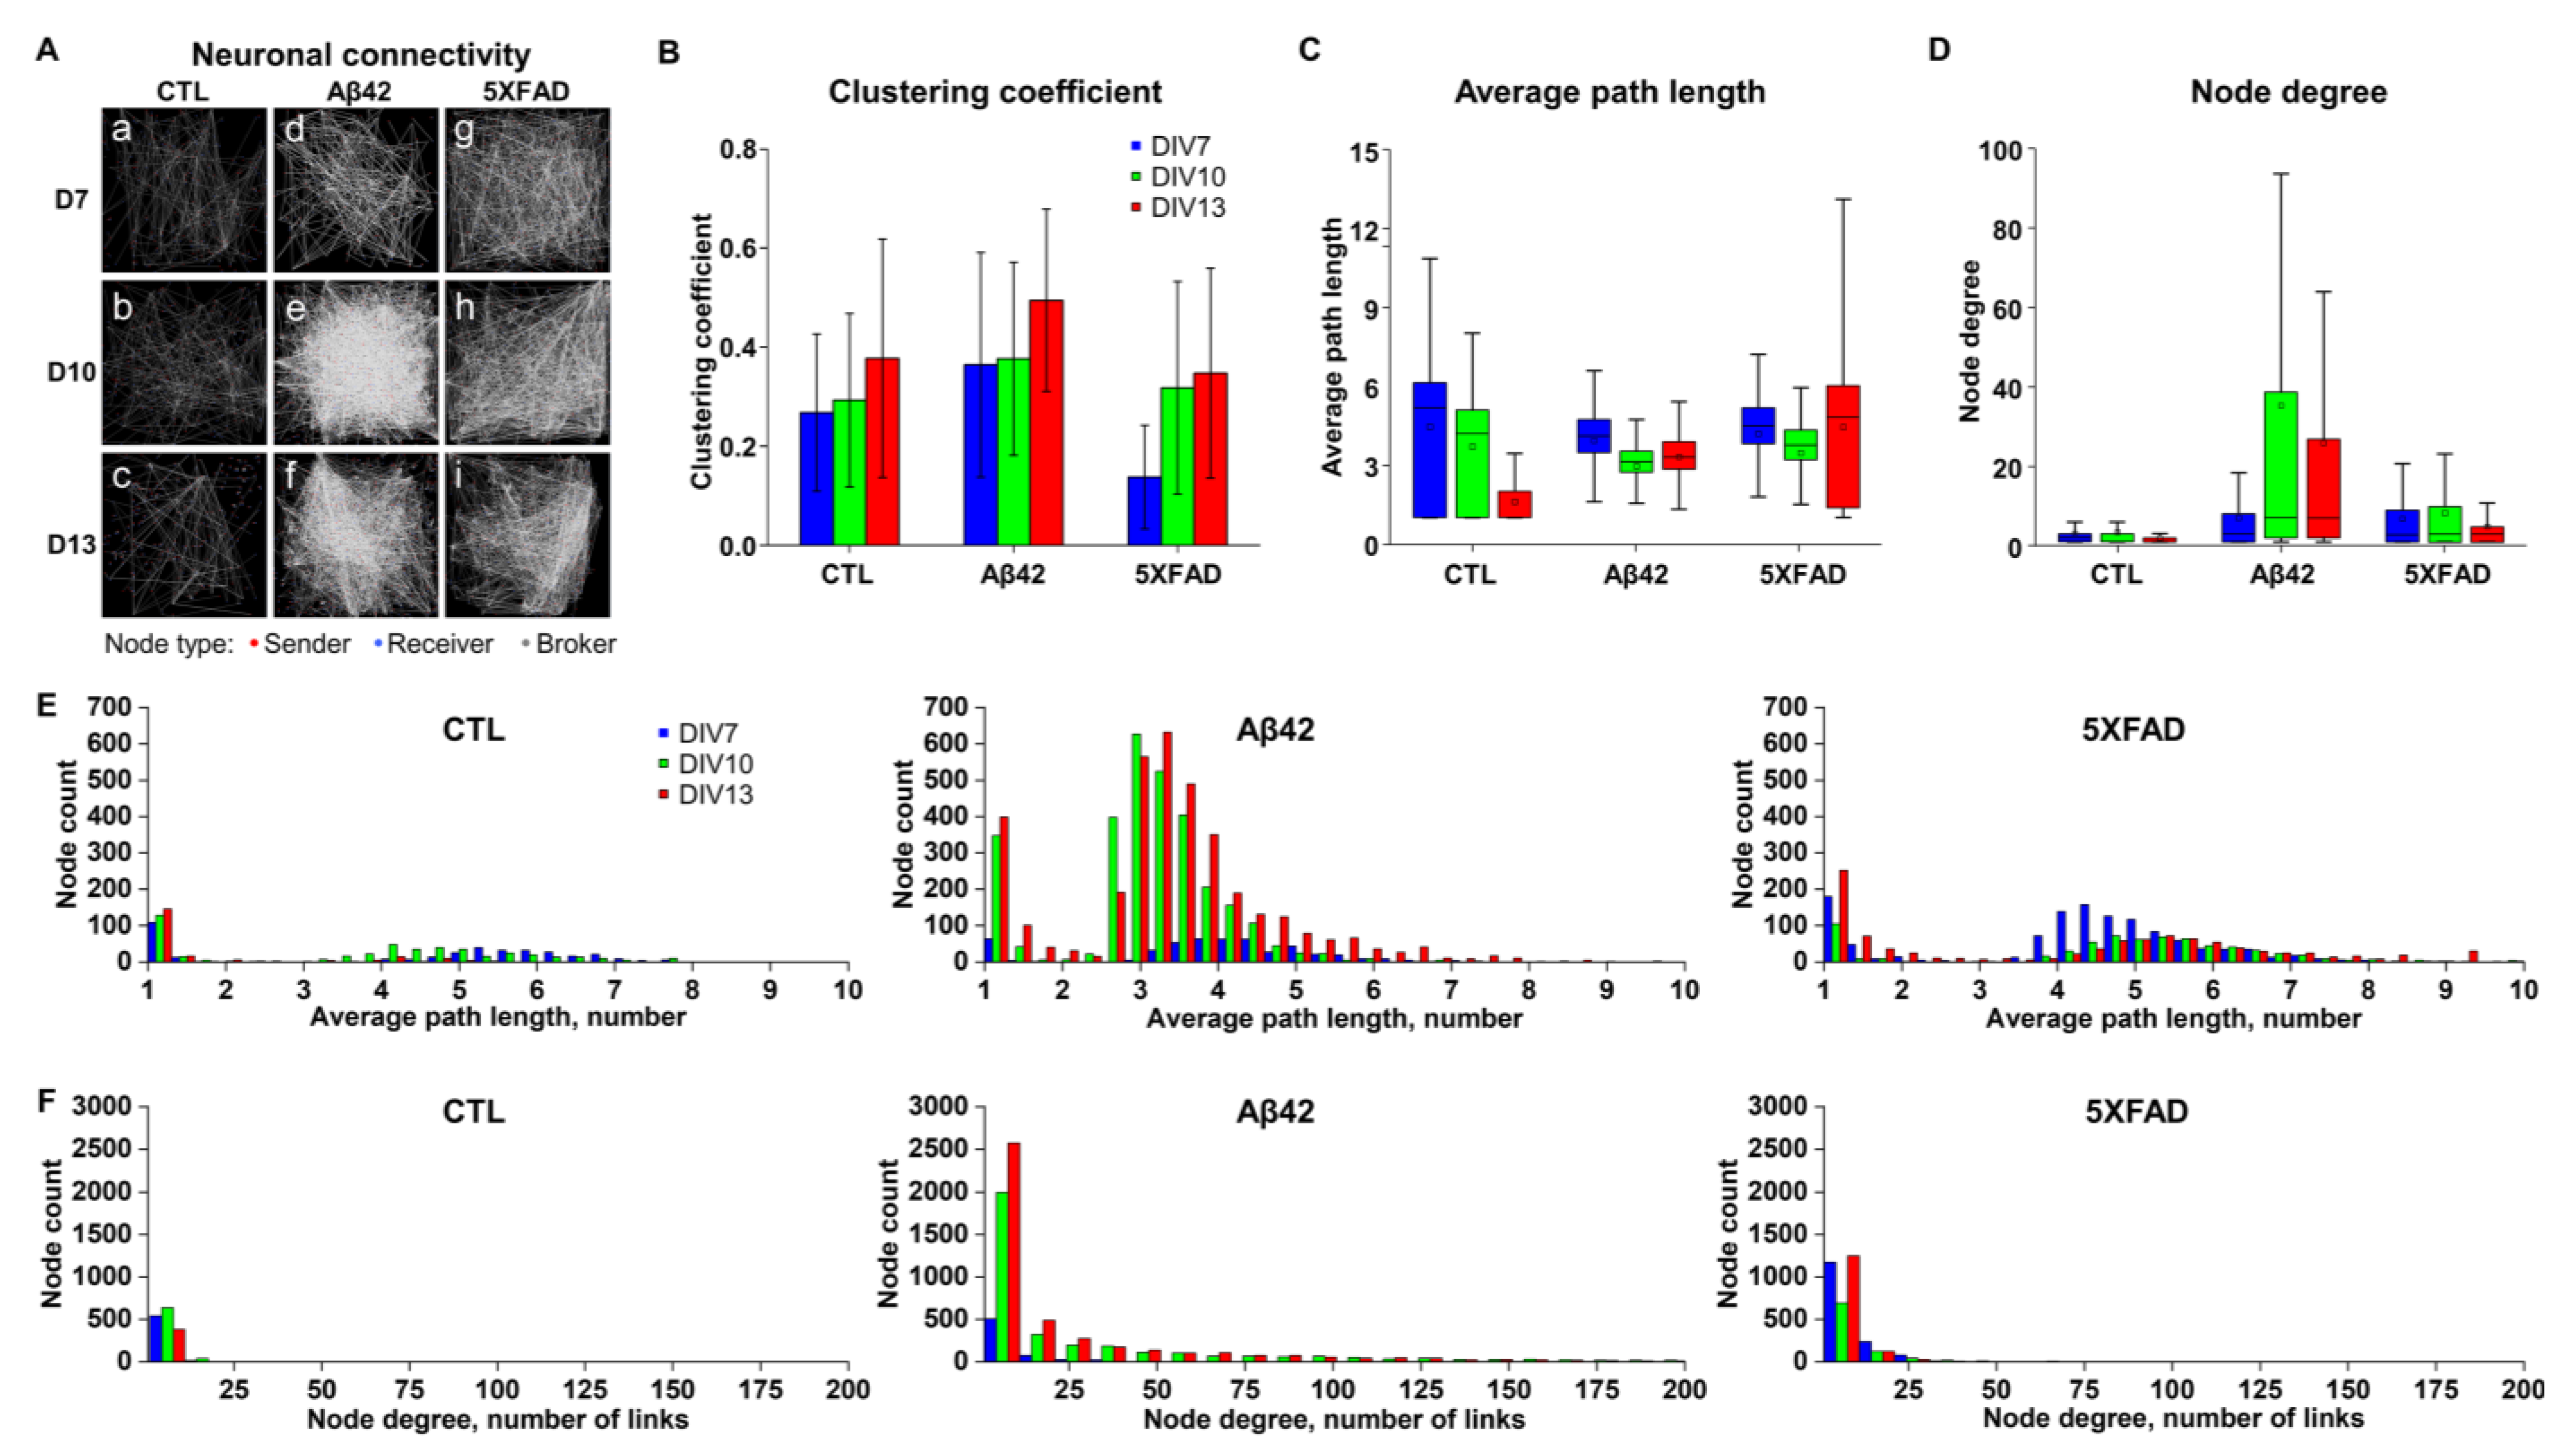
2.3. Differentiating Features of Neuronal Networks in 5XFAD NLF-Treated Neurons
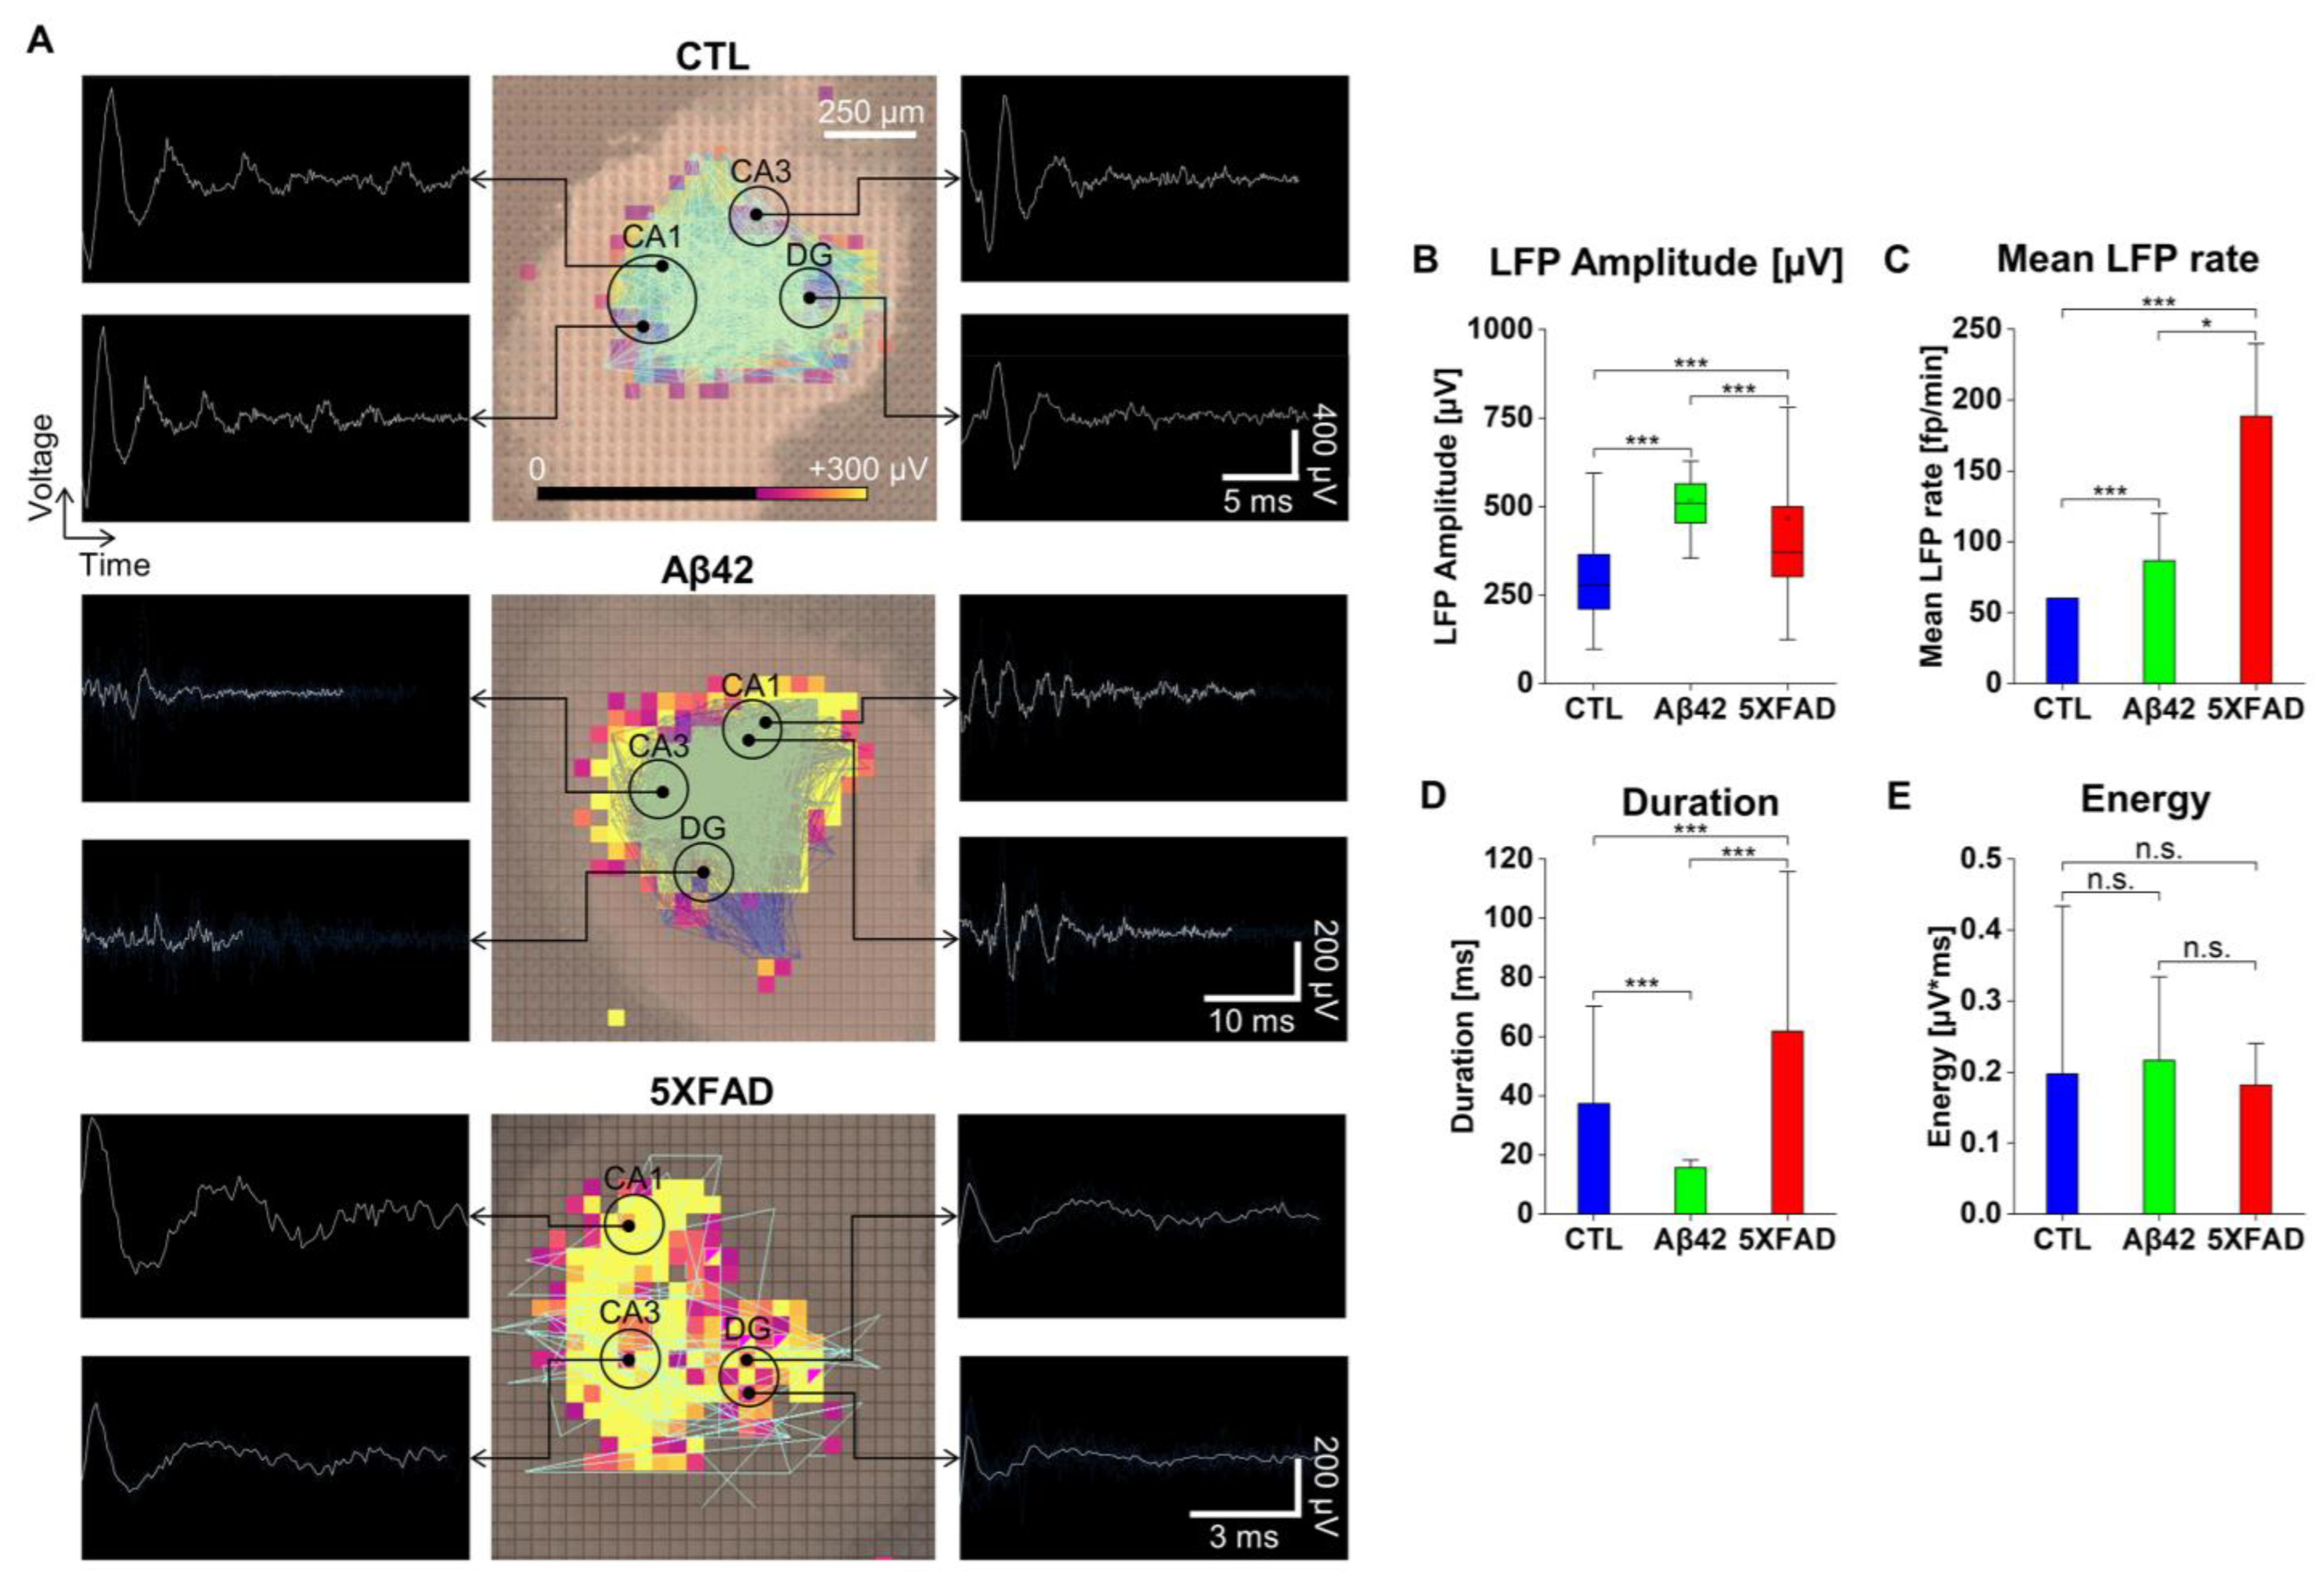
2.4. The Effects of Aβ42 Oligomers and 5XFAD NLF-Derived Exosomes on the LFP Property and Oscillation in OHSCs
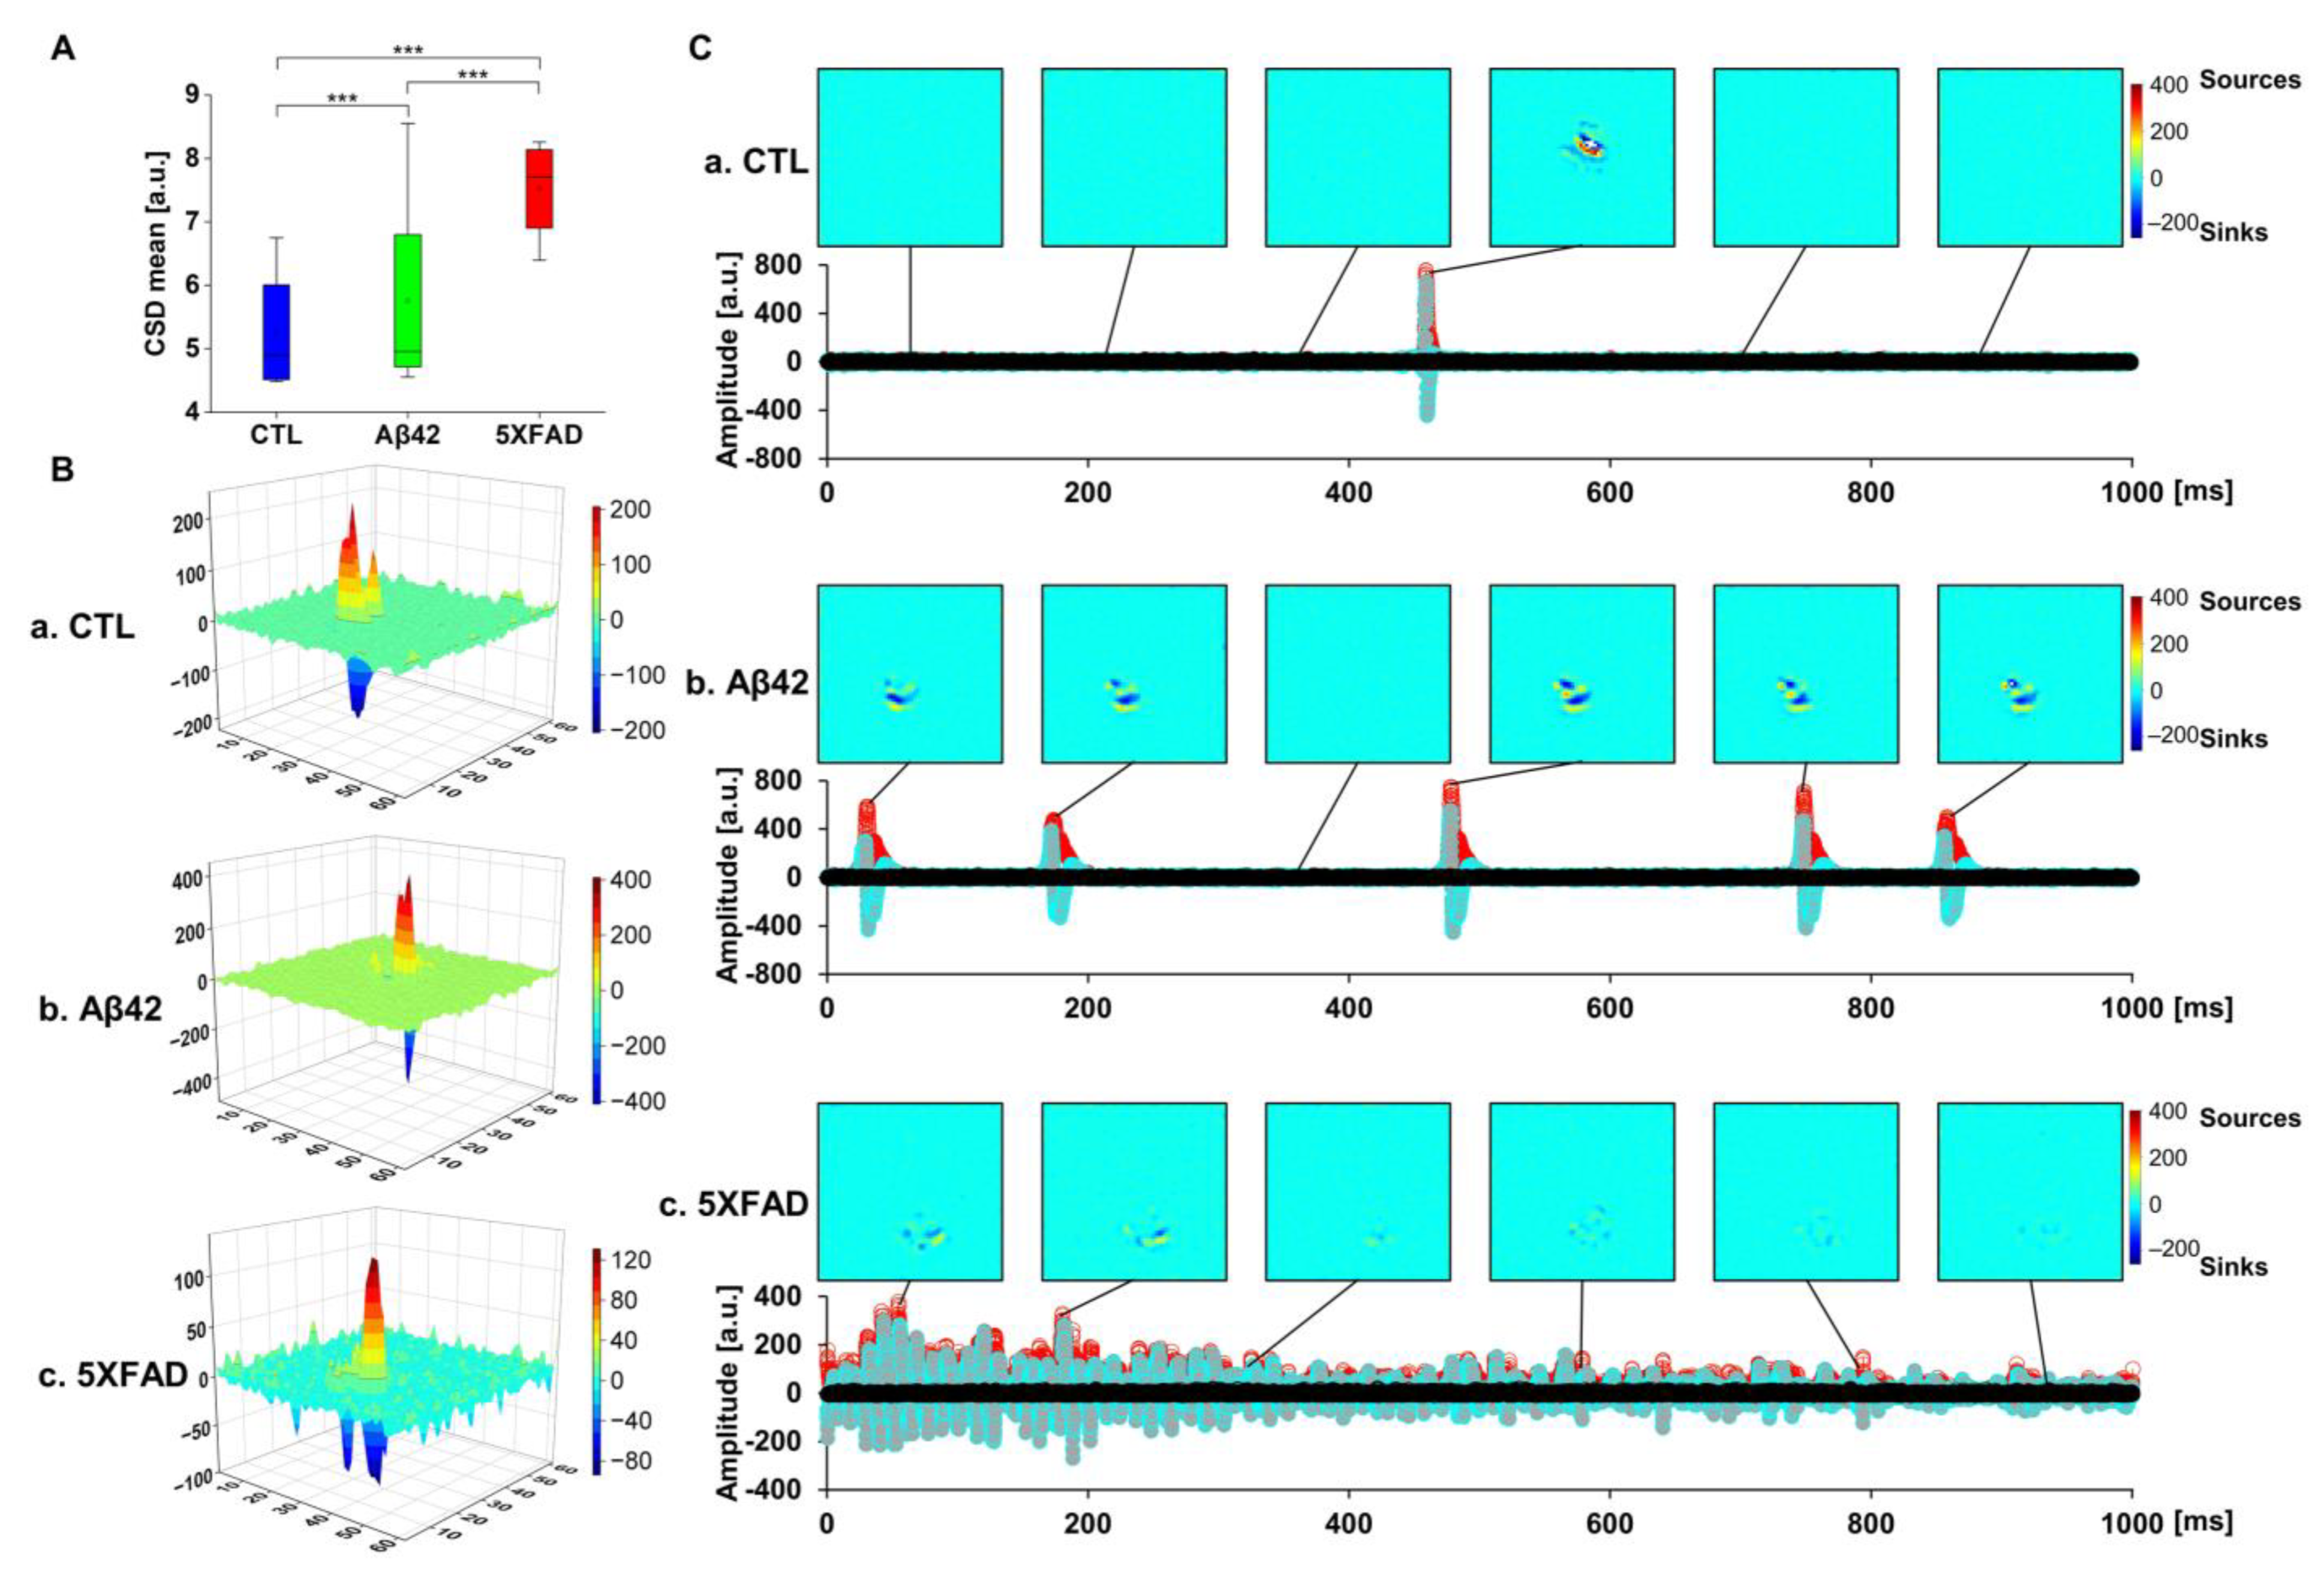
2.5. Current Source Density (CSD) Analysis to Localize LFP Distribution in OHSCs
3. Discussion
4. Materials and Methods
4.1. Animals
4.2. Nasal Lavage Fluid Extraction
4.3. Nanoparticle Tracking Analysis
4.4. Exosome Purification
4.5. Western Blotting
4.6. Transmission Electron Microscopy
4.7. Aβ42 Oligomer Preparation
4.8. Primary Neuron Culture
4.9. Organotypic Hippocampal Slice Culture
4.10. Neuronal Spike and LFP Recording with the High-Density Multielectrode Array (HD-MEA)
4.11. HD MEA Data Analysis
4.12. Current Source Density (CSD) Analysis
5. Conclusions
Supplementary Materials
Author Contributions
Funding
Institutional Review Board Statement
Data Availability Statement
Acknowledgments
Conflicts of Interest
References
- Sharma, P.; Mesci, P.; Carromeu, C.; McClatchy, D.R.; Schiapparelli, L.; Yates, J.R., 3rd; Muotri, A.R.; Cline, H.T. Exosomes regulate neurogenesis and circuit assembly. Proc. Natl. Acad. Sci. USA 2019, 116, 16086–16094. [Google Scholar] [CrossRef]
- Spelat, R.; Jihua, N.; Sanchez Trivino, C.A.; Pifferi, S.; Pozzi, D.; Manzati, M.; Mortal, S.; Schiavo, I.; Spada, F.; Zanchetta, M.E.; et al. The dual action of glioma-derived exosomes on neuronal activity: Synchronization and disruption of synchrony. Cell Death Dis. 2022, 13, 705. [Google Scholar] [CrossRef]
- Xia, X.; Wang, Y.; Qin, Y.; Zhao, S.; Zheng, J.C. Exosome: A novel neurotransmission modulator or non-canonical neurotransmitter? Ageing Res. Rev. 2022, 74, 101558. [Google Scholar] [CrossRef]
- Gharbi, T.; Zhang, Z.; Yang, G.Y. The Function of Astrocyte Mediated Extracellular Vesicles in Central Nervous System Diseases. Front. Cell Dev. Biol. 2020, 8, 568889. [Google Scholar] [CrossRef]
- Zhao, S.; Sheng, S.; Wang, Y.; Ding, L.; Xu, X.; Xia, X.; Zheng, J.C. Astrocyte-derived extracellular vesicles: A double-edged sword in central nervous system disorders. Neurosci. Biobehav. Rev. 2021, 125, 148–159. [Google Scholar] [CrossRef]
- Rajendran, L.; Honsho, M.; Zahn, T.R.; Keller, P.; Geiger, K.D.; Verkade, P.; Simons, K. Alzheimer’s disease beta-amyloid peptides are released in association with exosomes. Proc. Natl. Acad. Sci. USA 2006, 103, 11172–11177. [Google Scholar] [CrossRef]
- Saeedi, S.; Israel, S.; Nagy, C.; Turecki, G. The emerging role of exosomes in mental disorders. Transl. Psychiatry 2019, 9, 122. [Google Scholar] [CrossRef]
- Spera, I.; Cousin, N.; Ries, M.; Kedracka, A.; Castillo, A.; Aleandri, S.; Vladymyrov, M.; Mapunda, J.A.; Engelhardt, B.; Luciani, P.; et al. Open pathways for cerebrospinal fluid outflow at the cribriform plate along the olfactory nerves. Ebiomedicine 2023, 91, 104558. [Google Scholar] [CrossRef]
- Mehta, N.H.; Sherbansky, J.; Kamer, A.R.; Carare, R.O.; Butler, T.; Rusinek, H.; Chiang, G.C.; Li, Y.; Strauss, S.; Saint-Louis, L.A.; et al. The Brain-Nose Interface: A Potential Cerebrospinal Fluid Clearance Site in Humans. Front. Physiol. 2021, 12, 769948. [Google Scholar] [CrossRef]
- Ubeda-Banon, I.; Saiz-Sanchez, D.; Flores-Cuadrado, A.; Rioja-Corroto, E.; Gonzalez-Rodriguez, M.; Villar-Conde, S.; Astillero-Lopez, V.; Cabello-de la Rosa, J.P.; Gallardo-Alcaniz, M.J.; Vaamonde-Gamo, J.; et al. The human olfactory system in two proteinopathies: Alzheimer’s and Parkinson’s diseases. Transl. Neurodegener. 2020, 9, 22. [Google Scholar] [CrossRef]
- Son, G.; Jahanshahi, A.; Yoo, S.J.; Boonstra, J.T.; Hopkins, D.A.; Steinbusch, H.W.M.; Moon, C. Olfactory neuropathology in Alzheimer’s disease: A sign of ongoing neurodegeneration. BMB Rep. 2021, 54, 295–304. [Google Scholar] [CrossRef]
- Jung, D.H.; Son, G.; Kwon, O.H.; Chang, K.A.; Moon, C. Non-Invasive Nasal Discharge Fluid and Other Body Fluid Biomarkers in Alzheimer’s Disease. Pharmaceutics 2022, 14, 1532. [Google Scholar] [CrossRef]
- Lasser, C.; O’Neil, S.E.; Ekerljung, L.; Ekstrom, K.; Sjostrand, M.; Lotvall, J. RNA-containing exosomes in human nasal secretions. Am. J. Rhinol. Allergy 2011, 25, 89–93. [Google Scholar] [CrossRef]
- Bras, I.C.; Khani, M.H.; Riedel, D.; Parfentev, I.; Gerhardt, E.; van Riesen, C.; Urlaub, H.; Gollisch, T.; Outeiro, T.F. Ectosomes and exosomes modulate neuronal spontaneous activity. J. Proteom. 2022, 269, 104721. [Google Scholar] [CrossRef]
- Frohlich, D.; Kuo, W.P.; Fruhbeis, C.; Sun, J.J.; Zehendner, C.M.; Luhmann, H.J.; Pinto, S.; Toedling, J.; Trotter, J.; Kramer-Albers, E.M. Multifaceted effects of oligodendroglial exosomes on neurons: Impact on neuronal firing rate, signal transduction and gene regulation. Philos. Trans. R. Soc. B Biol. Sci. 2014, 369, 20130510. [Google Scholar] [CrossRef]
- Ganbat, D.; Jeon, J.K.; Lee, Y.; Kim, S.S. Exploring the Pathological Effect of Abeta42 Oligomers on Neural Networks in Primary Cortical Neuron Culture. Int. J. Mol. Sci. 2023, 24, 6641. [Google Scholar] [CrossRef]
- Shin, S.; Han, D.; Park, M.C.; Mun, J.Y.; Choi, J.; Chun, H.; Kim, S.; Hong, J.W. Separation of extracellular nanovesicles and apoptotic bodies from cancer cell culture broth using tunable microfluidic systems. Sci. Rep. 2017, 7, 9907. [Google Scholar] [CrossRef]
- Shin, K.; Lee, E.; Hong, J.W. Nanoparticles Are Separated in a Different Pattern from Microparticles with Focused Flow Control. Langmuir 2020, 36, 7210–7216. [Google Scholar] [CrossRef]
- Karima, G.; Shin, K.; Jeong, J.; Choi, D.; Hwang, K.-G.; Hong, J.W. Stem Cell Oriented Exosomes Regulate Cell Proliferation in Hepatoma Carcinoma. Biotechnol. Bioprocess Eng. 2023, 28, 263–273. [Google Scholar] [CrossRef]
- Yoo, S.J.; Son, G.; Bae, J.; Kim, S.Y.; Yoo, Y.K.; Park, D.; Baek, S.Y.; Chang, K.A.; Suh, Y.H.; Lee, Y.B.; et al. Longitudinal profiling of oligomeric Abeta in human nasal discharge reflecting cognitive decline in probable Alzheimer’s disease. Sci. Rep. 2020, 10, 11234. [Google Scholar] [CrossRef]
- Mossink, B.; Verboven, A.H.A.; van Hugte, E.J.H.; Klein Gunnewiek, T.M.; Parodi, G.; Linda, K.; Schoenmaker, C.; Kleefstra, T.; Kozicz, T.; van Bokhoven, H.; et al. Human neuronal networks on micro-electrode arrays are a highly robust tool to study disease-specific genotype-phenotype correlations in vitro. Stem Cell Rep. 2021, 16, 2182–2196. [Google Scholar] [CrossRef] [PubMed]
- Watts, D.J.; Strogatz, S.H. Collective dynamics of ‘small-world’ networks. Nature 1998, 393, 440–442. [Google Scholar] [CrossRef] [PubMed]
- Nicholson, C. Theoretical analysis of field potentials in anisotropic ensembles of neuronal elements. IEEE Trans. Biomed. Eng. 1973, 20, 278–288. [Google Scholar] [CrossRef] [PubMed][Green Version]
- Nicholson, C.; Freeman, J.A. Theory of current source-density analysis and determination of conductivity tensor for anuran cerebellum. J. Neurophysiol. 1975, 38, 356–368. [Google Scholar] [CrossRef] [PubMed]
- Shankar, G.M.; Li, S.; Mehta, T.H.; Garcia-Munoz, A.; Shepardson, N.E.; Smith, I.; Brett, F.M.; Farrell, M.A.; Rowan, M.J.; Lemere, C.A.; et al. Amyloid-beta protein dimers isolated directly from Alzheimer’s brains impair synaptic plasticity and memory. Nat. Med. 2008, 14, 837–842. [Google Scholar] [CrossRef]
- Sharples, R.A.; Vella, L.J.; Nisbet, R.M.; Naylor, R.; Perez, K.; Barnham, K.J.; Masters, C.L.; Hill, A.F. Inhibition of gamma-secretase causes increased secretion of amyloid precursor protein C-terminal fragments in association with exosomes. FASEB J. 2008, 22, 1469–1478. [Google Scholar] [CrossRef]
- Howitt, J.; Hill, A.F. Exosomes in the Pathology of Neurodegenerative Diseases. J. Biol. Chem. 2016, 291, 26589–26597. [Google Scholar] [CrossRef]
- Yuyama, K.; Sun, H.; Mitsutake, S.; Igarashi, Y. Sphingolipid-modulated exosome secretion promotes clearance of amyloid-beta by microglia. J. Biol. Chem. 2012, 287, 10977–10989. [Google Scholar] [CrossRef]
- Bathini, P.; Brai, E.; Auber, L.A. Olfactory dysfunction in the pathophysiological continuum of dementia. Ageing Res. Rev. 2019, 55, 100956. [Google Scholar] [CrossRef]
- Doty, R.L. Olfactory dysfunction in neurodegenerative diseases: Is there a common pathological substrate? Lancet Neurol. 2017, 16, 478–488. [Google Scholar] [CrossRef]
- Attems, J.; Jellinger, K.A. Olfactory tau pathology in Alzheimer disease and mild cognitive impairment. Clin. Neuropathol. 2006, 25, 265–271. [Google Scholar] [PubMed]
- Marin, C.; Vilas, D.; Langdon, C.; Alobid, I.; Lopez-Chacon, M.; Haehner, A.; Hummel, T.; Mullol, J. Olfactory Dysfunction in Neurodegenerative Diseases. Curr. Allergy Asthma Rep. 2018, 18, 42. [Google Scholar] [CrossRef]
- Cho, S.H.; Oh, S.Y.; Zhu, Z.; Lee, J.; Lane, A.P. Spontaneous eosinophilic nasal inflammation in a genetically-mutant mouse: Comparative study with an allergic inflammation model. PLoS ONE 2012, 7, e35114. [Google Scholar] [CrossRef] [PubMed]
- Verret, L.; Mann, E.O.; Hang, G.B.; Barth, A.M.; Cobos, I.; Ho, K.; Devidze, N.; Masliah, E.; Kreitzer, A.C.; Mody, I.; et al. Inhibitory interneuron deficit links altered network activity and cognitive dysfunction in Alzheimer model. Cell 2012, 149, 708–721. [Google Scholar] [CrossRef] [PubMed]
- Vossel, K.A.; Beagle, A.J.; Rabinovici, G.D.; Shu, H.; Lee, S.E.; Naasan, G.; Hegde, M.; Cornes, S.B.; Henry, M.L.; Nelson, A.B.; et al. Seizures and epileptiform activity in the early stages of Alzheimer disease. JAMA Neurol. 2013, 70, 1158–1166. [Google Scholar] [CrossRef]
- Palop, J.J.; Chin, J.; Roberson, E.D.; Wang, J.; Thwin, M.T.; Bien-Ly, N.; Yoo, J.; Ho, K.O.; Yu, G.Q.; Kreitzer, A.; et al. Aberrant excitatory neuronal activity and compensatory remodeling of inhibitory hippocampal circuits in mouse models of Alzheimer’s disease. Neuron 2007, 55, 697–711. [Google Scholar] [CrossRef]
- Busche, M.A.; Chen, X.; Henning, H.A.; Reichwald, J.; Staufenbiel, M.; Sakmann, B.; Konnerth, A. Critical role of soluble amyloid-beta for early hippocampal hyperactivity in a mouse model of Alzheimer’s disease. Proc. Natl. Acad. Sci. USA 2012, 109, 8740–8745. [Google Scholar] [CrossRef]
- Busche, M.A.; Eichhoff, G.; Adelsberger, H.; Abramowski, D.; Wiederhold, K.H.; Haass, C.; Staufenbiel, M.; Konnerth, A.; Garaschuk, O. Clusters of hyperactive neurons near amyloid plaques in a mouse model of Alzheimer’s disease. Science 2008, 321, 1686–1689. [Google Scholar] [CrossRef]
- Muller, L.; Kirschstein, T.; Kohling, R.; Kuhla, A.; Teipel, S. Neuronal Hyperexcitability in APPSWE/PS1dE9 Mouse Models of Alzheimer’s Disease. J. Alzheimer’s Dis. 2021, 81, 855–869. [Google Scholar] [CrossRef]
- Zott, B.; Simon, M.M.; Hong, W.; Unger, F.; Chen-Engerer, H.J.; Frosch, M.P.; Sakmann, B.; Walsh, D.M.; Konnerth, A. A vicious cycle of beta amyloid-dependent neuronal hyperactivation. Science 2019, 365, 559–565. [Google Scholar] [CrossRef]
- Li, Y.; Zhu, K.; Li, N.; Wang, X.; Xiao, X.; Li, L.; Li, L.; He, Y.; Zhang, J.; Wo, J.; et al. Reversible GABAergic dysfunction involved in hippocampal hyperactivity predicts early-stage Alzheimer disease in a mouse model. Alzheimer’s Res. Ther. 2021, 13, 114. [Google Scholar] [CrossRef] [PubMed]
- Andersen, J.V.; Skotte, N.H.; Christensen, S.K.; Polli, F.S.; Shabani, M.; Markussen, K.H.; Haukedal, H.; Westi, E.W.; Diaz-delCastillo, M.; Sun, R.C.; et al. Hippocampal disruptions of synaptic and astrocyte metabolism are primary events of early amyloid pathology in the 5xFAD mouse model of Alzheimer’s disease. Cell Death Dis. 2021, 12, 954. [Google Scholar] [CrossRef] [PubMed]
- Schneider, C.A.; Rasband, W.S.; Eliceiri, K.W. NIH Image to ImageJ: 25 years of image analysis. Nat. Methods 2012, 9, 671–675. [Google Scholar] [CrossRef]
- Hilgen, G.; Sorbaro, M.; Pirmoradian, S.; Muthmann, J.O.; Kepiro, I.E.; Ullo, S.; Ramirez, C.J.; Puente Encinas, A.; Maccione, A.; Berdondini, L.; et al. Unsupervised Spike Sorting for Large-Scale, High-Density Multielectrode Arrays. Cell Rep. 2017, 18, 2521–2532. [Google Scholar] [CrossRef] [PubMed]


Disclaimer/Publisher’s Note: The statements, opinions and data contained in all publications are solely those of the individual author(s) and contributor(s) and not of MDPI and/or the editor(s). MDPI and/or the editor(s) disclaim responsibility for any injury to people or property resulting from any ideas, methods, instructions or products referred to in the content. |
© 2023 by the authors. Licensee MDPI, Basel, Switzerland. This article is an open access article distributed under the terms and conditions of the Creative Commons Attribution (CC BY) license (https://creativecommons.org/licenses/by/4.0/).
Share and Cite
Kim, S.; Jeon, J.; Ganbat, D.; Kim, T.; Shin, K.; Hong, S.; Hong, J. Alteration of Neural Network and Hippocampal Slice Activation through Exosomes Derived from 5XFAD Nasal Lavage Fluid. Int. J. Mol. Sci. 2023, 24, 14064. https://doi.org/10.3390/ijms241814064
Kim S, Jeon J, Ganbat D, Kim T, Shin K, Hong S, Hong J. Alteration of Neural Network and Hippocampal Slice Activation through Exosomes Derived from 5XFAD Nasal Lavage Fluid. International Journal of Molecular Sciences. 2023; 24(18):14064. https://doi.org/10.3390/ijms241814064
Chicago/Turabian StyleKim, Sangseong, Jaekyong Jeon, Dulguun Ganbat, Taewoon Kim, Kyusoon Shin, Sungho Hong, and Jongwook Hong. 2023. "Alteration of Neural Network and Hippocampal Slice Activation through Exosomes Derived from 5XFAD Nasal Lavage Fluid" International Journal of Molecular Sciences 24, no. 18: 14064. https://doi.org/10.3390/ijms241814064
APA StyleKim, S., Jeon, J., Ganbat, D., Kim, T., Shin, K., Hong, S., & Hong, J. (2023). Alteration of Neural Network and Hippocampal Slice Activation through Exosomes Derived from 5XFAD Nasal Lavage Fluid. International Journal of Molecular Sciences, 24(18), 14064. https://doi.org/10.3390/ijms241814064