Article

LINC01605 Is a Novel Target of Mutant p53 in Breast and Ovarian Cancer Cell Lines

1
Division of Molecular Oncology, Department of Translational Research, Centro di Riferimento Oncologico di Aviano (CRO) IRCCS, Via Franco Gallini 2, 33081 Aviano, Italy
2
Department of Mathematics, Informatics and Physics, University of Udine, Via delle Scienze 206, 33100 Udine, Italy
3
Division of Clinical and Experimental Onco-Hematology, Department of Translational Research, Centro di Riferimento Oncologico di Aviano (CRO) IRCCS, Via Franco Gallini 2, 33081 Aviano, Italy
*
Author to whom correspondence should be addressed.
These authors contributed equally to this work.
Int. J. Mol. Sci. 2023, 24(18), 13736; https://doi.org/10.3390/ijms241813736
Submission received: 9 August 2023 / Revised: 29 August 2023 / Accepted: 30 August 2023 / Published: 6 September 2023
(This article belongs to the Special Issue The Emerging Role of RNA in Diseases and Cancers)

Abstract

:
TP53 is the most frequently mutated gene in human cancers. Most TP53 genomic alterations are missense mutations, which cause a loss of its tumour suppressor functions while providing mutant p53 (mut_p53) with oncogenic features (gain-of-function). Loss of p53 tumour suppressor functions alters the transcription of both protein-coding and non-protein-coding genes. Gain-of-function of mut_p53 triggers modification in gene expression as well; however, the impact of mut_p53 on the transcription of the non-protein-coding genes and whether these non-protein-coding genes affect oncogenic properties of cancer cell lines are not fully explored. In this study, we suggested that LINC01605 (also known as lincDUSP) is a long non-coding RNA regulated by mut_p53 and proved that mut_p53 directly regulates LINC01605 by binding to an enhancer region downstream of the LINC01605 locus. We also showed that the loss or downregulation of LINC01605 impairs cell migration in a breast cancer cell line. Eventually, by performing a combined analysis of RNA-seq data generated in mut_TP53-silenced and LINC01605 knockout cells, we showed that LINC01605 and mut_p53 share common gene pathways. Overall, our findings underline the importance of ncRNAs in the mut_p53 network in breast and ovarian cancer cell lines and in particular the importance of LINC01605 in mut_p53 pro-migratory pathways.

1. Introduction

TP53 is the most frequently mutated gene in human cancers, with breast and ovarian cancer exhibiting one of the highest mutation rates [1]. The TP53 gene encodes for the tumour suppressor p53, a transcription factor that plays a critical role in several biological processes (e.g., cell cycle, apoptosis, senescence and DNA repair) [2,3,4,5,6]. Unlike other tumour suppressor genes, such as BRCA1, which are inactivated by truncating mutations or deletions, most TP53 genomic alterations are missense mutations that lead to the production of a full-length protein with only one amino acid substitution [1]. Approximately 90% of these missense mutations occur at the DNA binding domain (DBD), impairing p53 stability and binding to its DNA responsive element within the promoters of transcriptional target genes, eventually resulting in the loss of wild-type p53 (wt_p53) tumour suppressor functions [7]. In addition to wt_p53 loss of functions, mutant p53 (mut_p53) enhances oncogenic features of cancer cells (gain-of-function activities) [8,9,10]: for instance, mut_p53 promotes the invasiveness of cancer cells by epithelial-mesenchymal transition (EMT) through the regulation of Zeb1 and Twist1 transcription factors [2,6,11,12].
The central dogma of molecular biology states that DNA is transcribed to messenger RNA, which in turn codes to proteins that have catalytic activities necessary for life. At the same time, despite the evident differences among metazoans (e.g., animals), the total number of protein-coding genes did not expand throughout evolution. Moreover, less than 2% of the human genome codes for proteins, while most of the human genome is transcribed, and non-protein-coding parts have been conserved during evolution. Former evidence suggests that the non-protein-coding part of the human genome may be a key factor in the regulation of biological processes. Transcribed non-protein-coding RNAs (ncRNAs) are grouped according to the length of their RNA molecules into small (about 25 nucleotides, such as microRNAs) or long non-coding RNAs (hundreds up to thousands of nucleotides). Long ncRNAs (lncRNAs) are non-coding transcripts longer than 500 base pairs (bp) [13], which can exert different cellular and biological functions including regulation of chromatin structure, gene expression, cell growth and differentiation. Deregulation of lncRNA expression has been associated with different tumours [14,15,16,17,18,19,20], and some lncRNAs have also been implicated in the wt_p53 regulatory pathway [21,22]. For instance, LincRNA-p21 was the first lncRNA identified to be regulated by wt_p53, and it was reported to trigger apoptosis by acting as a transcriptional repressor [23]. On the other hand, increased expression of MALAT1 in lung cancer was found to enhance cell proliferation and metastasis by downregulating wt_p53 targets [24].
To date, however, few studies have explored the relationship between mut_p53 gain-of-function and lncRNAs [25,26]. To identify novel lncRNAs regulated by mut_p53, we performed RNA sequencing in a mut_TP53-silenced breast cancer cell line. By this means, we identified LINC01605 as a lncRNA regulated by mut_p53, and we investigated whether LINC01605 participates in mut_p53 oncogenic functions using different functional assays and gene expression analysis.

2. Results

2.1. Mutant p53 Confers a Pro-Invasive Phenotype in MDA-MB-231 Cell Lines

Mut_p53 is known to promote tumour invasiveness and metastasis [2,3,4,6]. To recapitulate these effects in a cancer cell model, we selected a basal breast cancer cell line (i.e., MDA-MB-231) that carries the p53 mutation R280K, one of the most frequent mutations of TP53 found in cancer patients. First, we silenced mut_TP53 in the MDA-MB-231 cell line by lentiviral transduction of two shRNAs (sh1 and sh2). Mut_p53 protein and RNA levels decreased by approximately 80% in both sh1 and sh2 compared with control cells (shNT) (Figure 1A and Supplementary Figure S1A). About four days after viral transduction, mut_TP53-silenced cells decreased their proliferation rate until 9–10 days later when cells started to grow again (Supplmentary Figure S1B). For this reason, we evaluated the impact of mut_TP53 silencing on breast cancer cell invasiveness at 9–10 days after shRNA transduction in order to avoid possible confounding results due to impaired proliferation. We performed 3D colony formation assay in a Matrigel matrix, and we did not observe any differences in the number of colonies between control (shNT) and mut_TP53-silenced cells (Figure 1B). At the same time, MDA-MB-231 shNT cells formed star-like shape colonies that invaded the extra-cellular matrix, whereas mut_TP53-silenced cells formed round-shaped colonies, indicating a less invasive phenotype (Figure 1B and Supplementary Figure S1B). To further evaluate the metastatic ability of mut_p53 in MDA-MB-231 cells, we performed cell adhesion assay and observed that mut_TP53-silenced cells had a decreased ability to adhere and spread on fibronectin compared to control cells (Figure 1C). Together, these data confirmed that mut_p53 confers a pro-invasive phenotype to the MDA-MB-231 cell line by increasing its invasive and adhesion capabilities.

2.2. RP11-527N22.2 and LINC01605 Represent a Unique lncRNA Transcript Regulated by mut_p53 in Breast and Ovarian Cancer Cell Lines

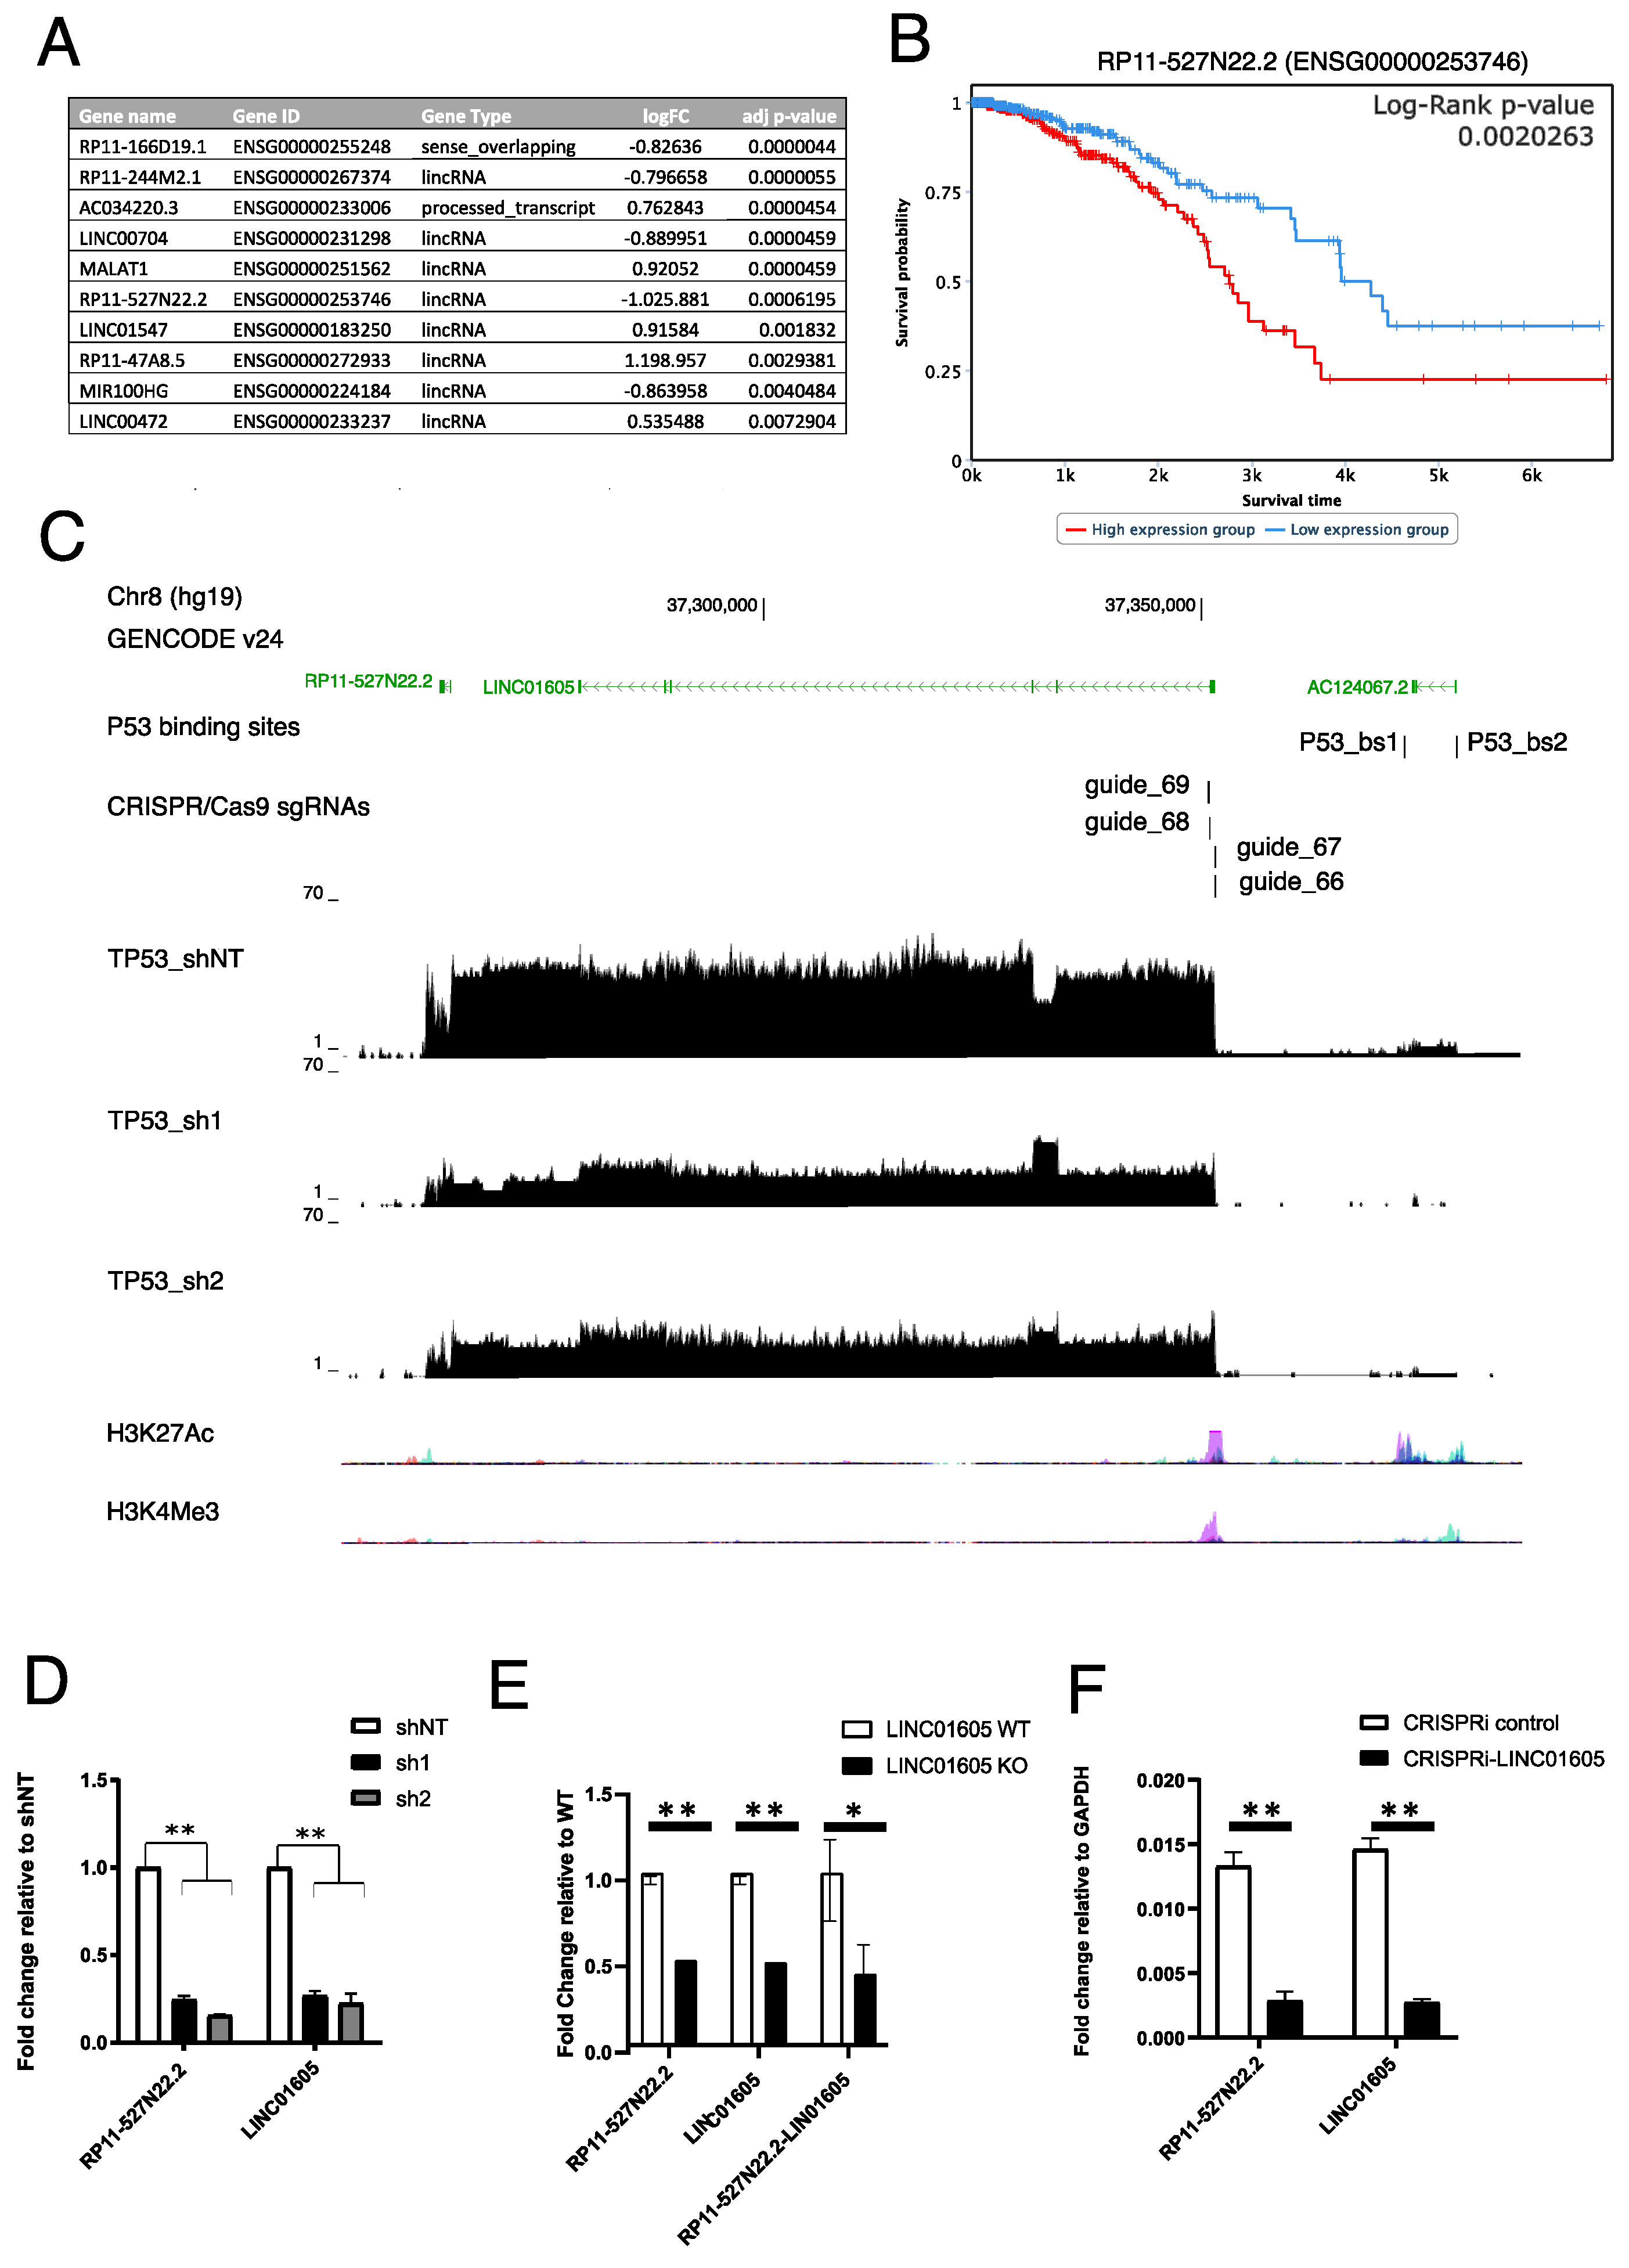
Evidence accumulated over the past years showed that lncRNAs can be regulated by wt_p53, and their deregulation might affect tumourigenesis and cancer dissemination [27]. For this reason, we investigated whether gain-of-function activities of mut_p53 could also regulate specific lncRNAs. Given that most lncRNAs are transcribed and retained in the nucleus where they can function as DNA regulatory elements, we measured lncRNA expression by RNA-seq in the nuclear fraction of control and mut_TP53-silenced MDA-MB-231 cells at 9–10 days after shRNA transduction. We found 1890 differentially expressed genes upon mut_TP53 silencing by both sh1 and sh2 (log2 fold-change > |0.5|, padj < 0.05); of these, 1616 were annotated as protein-coding genes and 204 as ncRNAs. Among the ncRNAs, 99 were annotated as lncRNAs, out of which we selected the 10 with the lowest adjusted p-value (Figure 2A). Using real-time semi-quantitative PCR (qRT-PCR) on independent samples of mut_TP53-silenced MDA-MB-231 cells, we were able to validate 8 out of 10 candidate lncRNAs (Supplementary Figure S2A).
Among these, RP11-527N22.2 was the most consistently downregulated (Supplementary Figure S2A), and it was the only candidate whose expression was associated with overall survival in breast cancer patients of The Cancer Genome Atlas (TCGA) dataset (Figure 2B), confirming previous results from Wei W. et al. [28]. For these reasons, we decided to further explore this transcript. To further validate that changes in mut_TP53 expression levels impact the expression levels of RP11-527N22.2, we silenced mut_TP53 in the OVCAR8 cell line, and we overexpressed R275H mut_TP53 in the SKOV3 TP53null cell line [29]. In both models, we confirmed that mut_TP53 regulates RP11-527N22.2 expression (Supplementary Figure S2B,C).
By visualising the RNA-seq read mapping to the RP11-527N22.2 locus in MDA-MB-231 shNT, sh1 and sh2, we noticed that transcription was a continuum between RP11-527N22.2 and LINC01605 (Figure 2C). This suggested that these two lncRNAs, which are annotated by GENCODE as separate genes, may represent a unique gene. In agreement with this hypothesis, the expression of both lncRNAs similarly decreased upon mut_TP53 silencing (Figure 2C,D and Supplementary Figure S2C). To demonstrate that LINC01605 and RP11-527N22.2 are part of the same transcript, we generated a CRISPR/Cas9 knockout (LINC01605-KO) and a CRISPR/dCas9 KRAB (LINC01605-CRISPRi) model targeting the LINC01605 first exon in MDA-MB-231 cells (Supplementary Figure S3A,B), and we investigated whether LINC01605 and RP11-527N22.2 RNA expression levels would concordantly decrease. As shown in Figure 2E,F, both LINC01605-KO and LINC01605-CRISPRi MDA-MB-231 cells displayed decreased expression of LINC01605 and RP11-527N22.2 and of a PCR amplicon linking the two lncRNAs (i.e., RP11-527N22.2-LINC01605) compared with parental cells (Figure 2E,F and Supplementary Figure S3C), demonstrating that the LINC01605 first exon contains the transcription start site of a unique transcript that extends from LINC01605 to RP11-527N22.2. Given the evidence that RP11-527N22.2 and LINC01605 represent the same transcript in MDA-MB-231 cells, from now on, we will name it LINC01605.

2.3. Identification of a Putative mut_p53-Dependent DNA Regulatory Element near LINC01605 Transcription Start Site

Following the identification of LINC01605 as a candidate lncRNA regulated by mut_p53 in cancer cells, we investigated whether mut_p53 directly regulates LINC01605 expression by looking for mut_p53 binding sites near the LINC01605 locus. For this purpose, we re-analysed publicly available ChIP-seq data of mut_p53 in MDA-MB-231 cells [30]. We identified two putative mut_p53 binding sites (p53_bs) that are located 20 Kb downstream of the LINC01605 first exon (p53_bs1 at chr8:37,372,992 and p53_bs2 at chr8:37,378,979, according to hg19 annotation). From now on, we refer to these candidate mut_p53 binding sites as putative regulatory elements (PREs)—PRE1 and PRE2—harbouring p53_bs1 and p53_bs2, respectively. According to ENCODE data, PRE1 and PRE2 overlap genomic regions enriched for the acetylation of lysine 27 of histone 3 protein (H3K27Ac), which is typically a hallmark of active DNA regulatory elements (Figure 3A). Consistent with these in silico findings, by performing ChIP-qPCR experiments in MDA-MB-231 cells, we confirmed mut_p53 binding and H3K27Ac enrichment, which both diminished upon mut_TP53 silencing (Figure 3B,C).
To examine the potential transcriptional enhancing activity of PRE1 and PRE2 on the LINC01605 promoter, we fragmented PRE 1 and 2 into different genomic tiles (tiles 1A, 1B, 1C and 1D for PRE1; tiles 2A and 2B for PRE2) (Figure 3A) that were sub-cloned into the pGL4.10 (luc2) vector containing the LINC01605 core promoter sequence. We then performed luciferase reporter assays in shNT and sh1 MDA-MB-231 cells. Results showed that the genomic tiles 1B and 2B increased the transcriptional activity of the LINC01605 promoter in vitro (Figure 3D); however, upon mut_TP53 silencing by sh1, only the enhancing activity of 1B decreased, indicating that the transcriptional effect of the genomic tile 1B is mut_p53-dependent. In contrast, the enhancing activity of 2B was not influenced by mut_TP53 downregulation even though it contained a mut_p53 binding site (mut_p53_bs2) (Figure 3D), suggesting that the binding of mut_p53 to p53_bs1 is sufficient to regulate LINC01605 expression.

2.4. LINC01605 Regulates Breast Cancer Cell Migration

Having demonstrated that mut_p53 directly regulates LINC01605 expression by binding to PRE1, we investigated the effect of LINC01605 on oncogenic properties. To do so, we took advantage of MDA-MB-231 LINC01605-KO and LINC01605-CRISPRi cells that we previously described (Figure 2E,F and Supplementary Figure S3A,B). First, we tested whether LINC01605 had an effect on cell proliferation: results showed that the KO of LINC01605 very marginally inhibited population doubling in MDA-MB-231 cells (Supplemental Figure S4A).
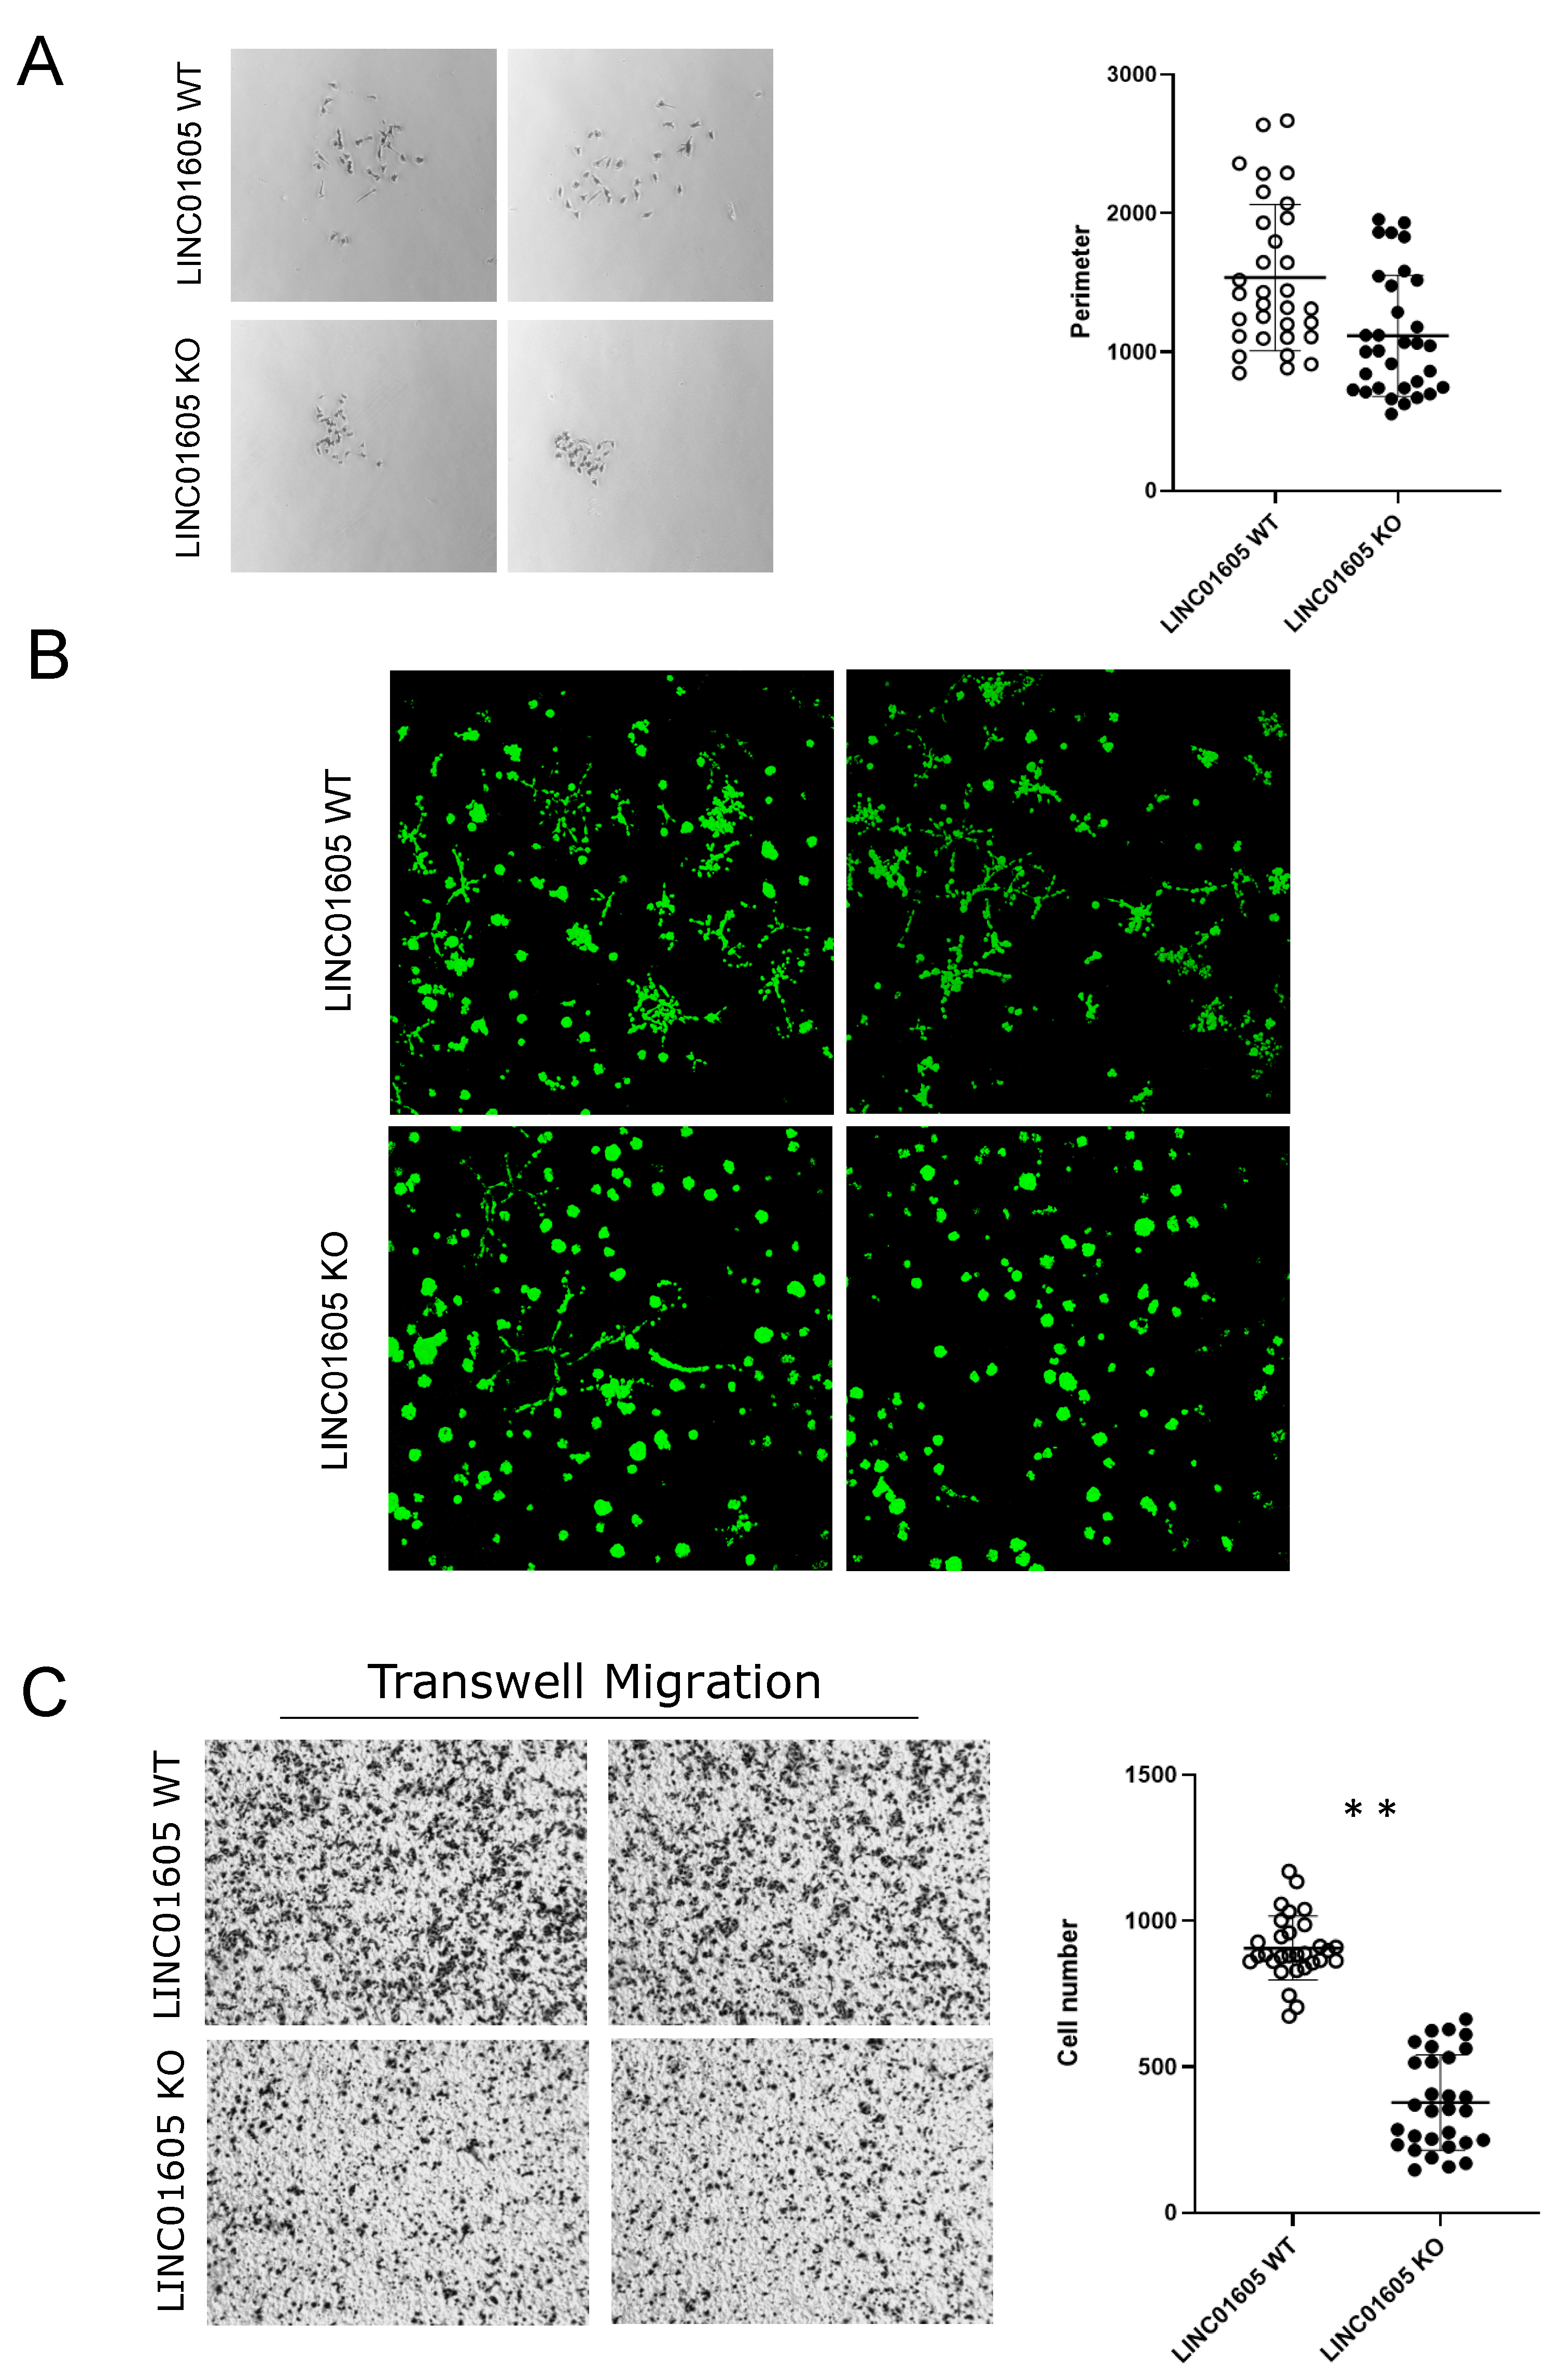
When we assesed the clonogenic ability of LINC01605-KO cells, we observed that LINC01605-KO cells formed tighter (less spread-out) colonies than their WT counterpart (Figure 4A), possibly indicating that LINC01605 may regulate the motility of MDA-MB-231 cells. Thus, to investigate this LINC01605 cell function, we explored the adhesion capability of LINC01605-KO cells on a fibronectin substrate without observing any significant difference (Supplementary Figure S4B). On the contrary, in a 3D colony formation assay in a Matrigel matrix, LINC01605-KO cells formed round-shape colonies compared with LINC01605-WT cells, which formed star-shape colonies, indicating that LINC01605 increases the invasive ability of MDA-MB-231 cells (Figure 4B). To confirm the impact of LINC01605 in cancer cell motility, we tested LINC01605-WT and KO cell ability to migrate across a transwell chamber using a fibronectin coating as an attractant. As shown in Figure 4C, LINC01605-KO cells migrated less than parental cells, which also happened in MDA-MB-231 cells upon LINC01605-CRISPRi transcriptional downregulation (Supplementary Figure S4C).

2.5. Pathway Analysis Reveals Resemblance between the Effect of mut_TP53 and LINC01605 in MDA-MB-231

To start exploring LINC01605 function in cancer, we performed RNA-seq gene expression analysis in MDA-MB-231 LINC01605-WT and KO clones. We identified 532 differentially expressed genes upon LINC01605-KO (fold-change > |1.5| and p-value > 0.05), and to identify over-represented pathways, we used Gene Set Enrichment Analysis (GSEA) Pathway analysis [31,32]. Pathway analysis revealed EMT, apical junctions and myogenesis among the pathways enriched in LINC01605-KO cells compared with LINC01605-WT cells (Table 1). These pathways may explain the impact of LINC01605 on invasion and migration that we observed in MDA-MB-231 cells (Figure 4A–C). When we compared enriched pathways in the RNA-seq profiling of LINC01605-KO cells with mut_TP53-silenced cells, we discovered that 13 out of the 16 (81%) pathways enriched in LINC01605-KO cells were in common with the pathways enriched in mut_TP53-silenced cells (Table 1).
In conclusion, herein, we described that LINC01605 is an lncRNA directly regulated by mut_p53 through the binding to an enhancer region downstream of the LINC01605 locus. We also showed LINC01605′s role in cell migration and resemblance with mut_p53 function. Eventually, by performing a combined analysis of RNA-seq data generated in mut_TP53-silenced and LINC01605-KO cells, we showed that LINC01605 and mut_p53 share common gene pathways.

3. Discussion

In this study, we identified LINC01605 as a novel lncRNA that is regulated by mut_p53 and that resembles several mut_p53 oncogenic properties (gain-of-function phenotype) in cancer cells. LINC01605 was found to be downregulated upon mut_TP53 silencing in MDA-MB-231 breast cancer and OVCAR8 ovarian cancer cells, and we confirmed that mut_p53 directly regulates LINC01605 expression by binding to an enhancer region located 20 kb upstream of the LINC01605 first exon. Furthermore, the loss of expression of LINC01605 resulted in a marked reduction in the cell adhesion and migration capability of MDA-MB-231 cells, which recapitulates the phenotype of mut_TP53 silencing in the same cell model.
So far, three studies have been published on LINC01605 (which is also referred to as lincDUSP) demonstrating its oncogenic role in colon cancer and in laryngeal squamous cell carcinoma by promoting cell proliferation, migration and invasion [33,34,35]. These findings are consistent with the LINC01605 pro-tumourigenic phenotype observed in our breast cancer model with some differences. For example, we only observed a slight inhibition of cell proliferation in MDA-MB-231 cells KO for LINC01605, and cell cycle analysis did not show any significant changes in cell cycle distribution in MDA-MB-231 cells with and without LINC01605 expression. In addition, we did not observe differences in the clonogenic capacity of cells WT and KO for LINC01605, but rather LINC01605-KO cells exhibited a decreased invasion and migration capability in our migration experiments. These results, together with LINC01605 capacity to regulate cell adhesion in MDA-MB-231 cells points to a possible LINC01605 function in the EMT process, a key mut_p53 oncogenic feature [10,12,36]. Our in vitro findings could be also used as preliminary findings to plan in vivo experiments to further strengthen the translational aspects of our discovery.
Our hypothesis is further supported by the gene expression analysis of LINC01605-WT and KO cells, which revealed an over-representation of pathways linked to mut_p53 activities, including EMT and cell movement regulation. Additional studies are necessary to characterise other key downstream genes involved in this mut_p53-LINC01605 regulatory axis.
Another feature that emerged from the integrative analysis of RNA-seq experiments from mut_TP53-silenced and LINC01605-KO MDA-MB-231 cells is that LINC01605 seems to be involved in the dysregulation of lipid metabolism, similar to mut_p53 [37,38]. It is intriguing to speculate the existence of a novel relationship between mut_p53-dependent LINC01605 oncogenic function and lipid metabolism that may be responsible for cancer progression. However, this hypothesis needs to be tested and further characterised.
In this work, we also found that LINC01605 and RP11-527N22.2 share the same promoter and are likely a unique transcript. This result is in contrast with GENCODE annotations in which the two lncRNAs are annotated as separate transcripts. For this reason, it would be interesting to extend LINC01605 locus characterisation in different cancer cell models. This would allow us to gain a better knowledge of the LINC01605 transcript and its regulation in different cancer types in which it acts as a potential oncogene.
So far, very few studies have investigated whether mut_TP53 regulates and exerts its function via an lncRNA [25,26] and whether there is any clinical correlation. Altogether, our work gives new insights about the role of lncRNAs in the mechanisms underlying mut_p53 gain-of-function activities. In particular, our data suggest that LINC01605 is a novel lncRNA directly regulated by mut_p53, involved in mut_p53-dependent increased cell invasion and motility in MDA-MB-231 cells and likely involved in cancer cell aggressiveness, since breast cancer patients with higher LINC01605 expression levels display a worse outcome.

4. Materials and Methods

4.1. Cell Lines, Cell Cultures and Lentiviral Transduction

Cell lines and cell culture media used in this work are listed in Supplementary Table S1. Cell lines were maintained at 37 °C and 5% CO2 in humidified incubators.
TP53-silenced, KO LINC01605 and LINC01605-CRISPRi MDA-MB-231 cells were all generated by lentiviral transduction [39]. Briefly, 293FT cells were co-transfected with the specific lentiviral vectors indicated in Supplementary Table S1 and two lentiviral packaging vectors (psPAX2 and VSV-G). Viral supernatants were collected 24, 36, 48 and 60 h after transfection and used to transduce MDA-MB-231 cells [39].

4.2. CRISPR-Cas9 System

LINC01605-KO and LINC01605-CRISPRi were generated using CRISPR/Cas9 system as described in [39]. To generate cell lines KO for LINC01605, four different single guide RNAs (sgRNA) (guides 66, 67, 68 and 69) (Supplementary Table S1) were used spanning approximately 800 bp of LINC01605 first exon. Briefly, sgRNAs were cloned into pLV hUbC-Cas9-T2A-GFP. MDA-MB-231 cells transduced with this lentiviral system were sorted by flow cytometry in GFP− (WT) and GFP+ (KO) cells. To test CRISPR/Cas9 cut efficiency, genomic DNA was extracted using Gentra Puregene Cell Kit (Qiagen Sciences, Germantown, MD, USA) according to manufacturer’s instructions and sequenced using MiSeq system by Illumina (Illumina, San Diego, CA, USA). Sequencing reads were visualised using the Integrative Genomics viewer (IGV, Broad Institute, Cambridge, MA, USA) to confirm genetic deletion. Cell clones were grown after cell sorting by flow cytometry. DNA was extracted and clones screened by PCR, using specific primers (Supplementary Table S1).

4.3. ChIP Assay

ChIP assays to evaluate p53 and histone mark enrichment were performed using the SimpleChIP® Enzymatic Chromatin IP Kit (Magnetic Beads) (Cell Signaling Technology, Inc., Danvers, MA, USA) following manufacturer’s protocol. The following ChIP-grade antibodies were used: anti-histone H3-acetyl K27, H3 tri-methyl K4, H3 methyl K4, H3 tri-methyl K9 (cat. No. ab4729, ab8580, ab176842, ab176916; Abcam, Cambridge, UK) and anti-p53 antibody DO-1 (sc-126 Santa Cruz Biotechnology, Inc., Santa Cruz, CA, USA). DNA levels for the regions of interest were quantified by qPCR using specific primers (Supplementary Table S1). Details regarding the number of technical and biological replicates are listed in the figure legends.

4.4. RNA Extraction, cDNA Synthesis and qRT-PCR

RNA was extracted using the Rneasy Plus Mini Kit (Qiagen Sciences, Germantown, MD, USA) according to protocol instructions. Extraction was followed by DNase digestion (Turbo-DNase, Ambion, Thermo Fisher Scientific, Waltham, MA, USA), and RNA quality was assessed by using agarose gel electrophoresis after RNA exposure to 70 °C for 5 min. cDNA synthesis was performed from 1 µg of RNA using the AMV Reverse Transcriptase with random primers (Promega, Madison, WI, USA). cDNA was then used for qRT-PCR reactions using iQ SYBR Green Supermix (Bio-Rad, Hercules, CA, USA) using the specific primers (Supplementary Table S1). qRT-PCR reactions were carried out in Micro seal® 384-well PCR plates using the CFX384 Touch Real-Time PCR Detection system (Bio-Rad, Hercules, CA, USA). The 2−∆∆Ct method was used to calculate the relative abundances of genes and regions of interest, measuring GAPDH expression as housekeeping control. Details regarding the number of technical and biological replicates are listed in the figure legends.

4.5. Luciferase Reporter Assay

LINC01605 promoter (740 bp) was amplified from MDA-MB-231 genomic DNA using Phusion™ High-Fidelity DNA polymerase (Thermo Scientific, Waltham, MA, USA) and cloned into pGL4.10 [luc2] vector (Promega, Madison, WI, USA) in the multiple-cloning site (KpnI). MDA-MB-231 cells were transfected with this construct to test its activity compared to pGL4.10 [luc2] empty vector. PRE1 and PRE2 genomic tiles (1A, 1B, 1C and 1D for PRE1 and tiles 2A and 2B for PRE2) were cloned at the SalI restriction site of the pGL4.10 LINC01605 promoter. All constructs were sequenced by Sanger sequencing to confirm their identity.
A reverse approach was used to transfect cells for luciferase reporter assays. Equimolar amounts of luciferase reporter plasmids, 50 ng of pRLTK plasmid (encoding renilla) and 1 µL of Lipofectamine 2000 (Invitrogen, Waltham, MA, USA) were mixed, and 100 µL of transfection mix was transferred into a 24-well plate. On top of the transfection mix, 2.5 × 10⁵ MDA-MB-231 cells were seeded per well in triplicate and incubated at 37 °C. The empty vector pUC19 was used to make the final amount of DNA (600 ng) constant between wells. Twenty-four hours after transfection, the luciferase/renilla activity was measured using the Dual Luciferase system (Promega, Madison, WI, USA) according to manufacturer’s instructions. The final values were obtained by dividing the luciferase values by the corresponding renilla values to control for variations in transfection efficiency. Luciferase/renilla ratios of all constructs were compared with pGL4.10 LINC01605 promoter, and a two-way ANOVA test with Bonferroni’s correction for multiple comparisons was used to analyse the data using GraphPad Prism (Version 9.1.1, GraphPad, Inc., San Diego, CA, USA). Details regarding the number of technical and biological replicates are listed in the figure legends.

4.6. Gene Expression and ChIP-Seq Analysis

RNA sequencing was performed at IGA Technology Services Srl (Udine, Italy). Sequencing reads were aligned to GRCh37 reference assembly using HiSAT2. FeatureCounts was then used to count and assign reads to the genomic features in the GENCODEv24 annotation. Differential gene expression was performed using DESeq2 (fold-change > |0.5| and p-value > 0.05).
For p53 ChIP-seq analysis, we downloaded MDA-MB-231 IgG, Input and DO-1 (p53) fastq files from NCBI SRA database (accession number: SRX899076). Reads were aligned to GRCh37 human genome reference using BWA aligner 0.7.17. BAM files were then converted into bigwig files for data visualisation in UCSC Genome Browser. MACS2 in Galaxy (galaxyproject.org accessed on 9 February 2021) was used to estimate mut_p53 binding sites by setting the default minimum enrichment ratio value between 2 and 5, as the distribution of enrichment ratio of DO-1 versus Input had particularly low values.

4.7. Adhesion Assay, Colony Assay, Matrigel and Motility Experiments

For adhesion assays, 0.5 × 10⁶ cells were plated in 12-well plate wells coated with fibronectin (5 µg/mL) or BSA (1%) and incubated for 45 min at 37 °C (controls were fixed in 4% PFA immediately after plating). Following incubation, cells were washed with PBS 1× and fixed with 4% PFA. Cells were then stained with Crystal Violet, and images of wells were acquired using a microscope. The number of adherent cells was estimated by analysing images with ImageJ. For colony assay experiment, 1000 cells were plated in 10 cm cell culture dishes in triplicate and let to grow in complete medium at 37 °C. After one week, cell colonies were fixed with 4% PFA and stained with Crystal Violet. Cell colonies and appearances were counted by acquiring images with stereo microscope and analysing them using ImageJ (version 2.0.0, National Institutes of Health, Bethesda, MD, USA).
For the Matrigel experiment, 2000 cells were plated with 150 µL of Matrigel matrix (Geltrex® LDEV-Free Reduced Growth Factor Basement Membrane Matrix, Invitrogen, Waltham, MA, USA) on a polyHEMA-coated 96-well plate. The plate was incubated at 37 °C for 30 min, and then 120 µL of complete medium was added to the cells. After 10 days, cells were stained with 2 µg/mL calcein (Life Technologies, Carlsbad, CA, USA) for 30 min at 37 °C. Cell morphology was observed using a confocal laser-scanning microscope (TSP2 Leica, Wetzlar, Germany) interfaced with a Leica DMIRE2 fluorescent.
For chemotaxis experiments, cells were starved for 3 h at 37 °C in serum-free DMEM media; 100,000 cells were placed on the upper layer of a cell culture insert with porous membrane (6.5 mm Corning® Transwell® Inserts, Corning, NY, USA). Before adding cells, the membrane was coated on its bottom layer for 1 h at 37 °C with fibronectin (5 µg/mL), which facilitates cell adhesion and migration. Following 4 h and 30 min of incubation at 37 °C, the porous membrane was fixed in 4% PFA and stained in Crystal Violet. Images of cells that migrated through the membrane were acquired using a stereo microscope. Images were analysed using ImageJ. Details regarding the number of technical and biological replicates are listed in the figure legends.

4.8. Statistical Analysis

We performed statistical analysis using GraphPad PRISM software (Version 9.1.1, GraphPad, Inc., San Diego, CA, USA) using two or three-way ANOVA when comparing two or three groups, respectively. Difference was considered significant at p < 0.05 (* p ≤ 0.05, ** p ≤ 0.01). Details regarding the number of technical and biological replicates are listed in the figure legends.

5. Conclusions

To our knowledge, our current work represents the first study in which LINC01605 potential oncogenic function is explored in cancer cells and in which we demonstrate that LINC01605 participates in the mut_p53 pro-tumorigenic phenotype by regulating cancer cell adhesion and migration. Further characterisation of this regulatory axis may lead to the identification of potential targets, including LINC01605, to overcome the mut_p53 oncogenic role in different cancer types.

Supplementary Materials

The supporting information can be downloaded at https://www.mdpi.com/article/10.3390/ijms241813736/s1.

Author Contributions

Conceptualisation, M.C., M.T. and R.S.; software, L.I. and C.P.; validation, M.C., M.T., L.C., I.R., S.B., A.D.P., A.Z., L.Z. and R.S.; formal analysis, M.C., M.T., L.C., L.I. and C.P.; investigation, M.C., M.T., L.C., I.R., S.B., A.Z., A.D.P. and L.Z.; resources, C.P., R.S. and M.S.N.; data curation, M.C., M.T., L.C. and R.S.; writing—original draft preparation, M.T. and R.S.; writing—review and editing, M.T., R.S. and M.S.N.; visualisation, M.C., M.T., I.R. and R.S.; supervision, G.B.; project administration, R.S. and M.S.N.; funding acquisition, M.S.N. All authors have read and agreed to the published version of the manuscript.

Funding

This work was supported by grants from Associazione Italiana per la Ricerca sul Cancro AIRC (MFAG 13589), Ricerca Finalizzata, Ministero della Salute Italiano (PE-2016-02361040), Ricerca Finalizzata, Ministero della Salute Italiano (RF-2018-12365425), and taxpayer donations, 5‰ 2018 (donations 2017).

Institutional Review Board Statement

Not applicable.

Informed Consent Statement

Not applicable.

Data Availability Statement

The datasets generated during and analysed during the current study are available in the Sequence Read Archive (SRA) of the National Library of Medicine https://www.ncbi.nlm.nih.gov/sra (accession code: PRJNA815968). The list of samples and web links of RNA-seq samples uploaded in the Sequence Read Archive are shown in Supplementary Table S2. All data generated or analysed during this study are included in this published article (and its Supplementary Information files).

Conflicts of Interest

The authors declare no conflict of interest.

References

  1. The ICGC/TCGA Pan-Cancer Analysis of Whole Genomes Consortium. Pan-cancer analysis of whole genomes. Nature 2020, 578, 82–93. [Google Scholar] [CrossRef] [PubMed]
  2. Stein, Y.; Rotter, V.; Aloni-Grinstein, R. Gain-of-function mutant p53: All the roads lead to tumorigenesis. Int. J. Mol. Sci. 2019, 20, 6197. [Google Scholar] [CrossRef] [PubMed]
  3. Muller, P.A.J.; Vousden, K.H. P53 mutations in cancer. Nat. Cell Biol. 2013, 15, 2–8. [Google Scholar] [CrossRef] [PubMed]
  4. Mantovani, F.; Collavin, L.; Del Sal, G. Mutant p53 as a guardian of the cancer cell. Cell Death Differ. 2019, 26, 199–212. [Google Scholar] [CrossRef]
  5. Vousden, K.H.; Prives, C. Blinded by the Light: The Growing Complexity of p53. Cell 2009, 137, 413–431. [Google Scholar] [CrossRef]
  6. McCann, J.J.; Vasilevskaya, I.A.; McNair, C.; Gallagher, P.; Neupane, N.P.; de Leeuw, R.; Shafi, A.A.; Dylgjeri, E.; Mandigo, A.C.; Schiewer, M.J.; et al. Mutant p53 elicits context-dependent pro-tumorigenic phenotypes. Oncogene 2021, 41, 444–458. [Google Scholar] [CrossRef]
  7. Khadiullina, R.; Mirgayazova, R.; Davletshin, D.; Khusainova, E.; Chasov, V.; Bulatov, E. Assessment of Thermal Stability of Mutant p53 Proteins via Differential Scanning Fluorimetry. Life 2022, 13, 31. [Google Scholar] [CrossRef]
  8. Walerych, D.; Lisek, K.; del Sal, G. Multi-omics reveals global effects of mutant p53 gain-of-function. Cell Cycle 2016, 15, 3009–3010. [Google Scholar] [CrossRef]
  9. Walerych, D.; Lisek, K.; del Sal, G. Mutant p53: One, No One, and One Hundred Thousand. Front. Oncol. 2015, 5, 289. [Google Scholar] [CrossRef]
  10. Walerych, D.; Napoli, M.; Collavin, L.; Del Sal, G. The rebel angel: Mutant p53 as the driving oncogene in breast cancer. Carcinogenesis 2012, 33, 2007–2017. [Google Scholar] [CrossRef]
  11. Kim, T.; Veronese, A.; Pichiorri, F.; Lee, T.J.; Jeon, Y.-J.; Volinia, S.; Pineau, P.; Marchio, A.; Palatini, J.; Suh, S.-S.; et al. p53 regulates epithelial-mesenchymal transition through microRNAs targeting ZEB1 and ZEB2. J. Exp. Med. 2011, 208, 875–883. [Google Scholar] [CrossRef] [PubMed]
  12. Dong, P.; Karaayvaz, M.; Jia, N.; Kaneuchi, M.; Hamada, J.; Watari, H.; Sudo, S.; Ju, J.; Sakuragi, N. Mutant p53 gain-of-function induces epithelial–mesenchymal transition through modulation of the miR-130b–ZEB1 axis. Oncogene 2013, 32, 3286–3295. [Google Scholar] [CrossRef]
  13. Mattick, J.S.; Amaral, P.P.; Carninci, P.; Carpenter, S.; Chang, H.Y.; Chen, L.-L.; Chen, R.; Dean, C.; Dinger, M.E.; Fitzgerald, K.A.; et al. Long non-coding RNAs: Definitions, functions, challenges and recommendations. Nat. Rev. Mol. Cell Biol. 2023, 24, 430–447. [Google Scholar] [CrossRef] [PubMed]
  14. Wu, H.; Yang, L.; Chen, L.L. The diversity of long noncoding RNAs and their generation. Trends Genet. 2017, 33, 540–552. [Google Scholar] [CrossRef] [PubMed]
  15. Lagarde, J. High-throughput annotation of full-length long noncoding RNAs with capture long-read sequencing. Nat. Genet. 2017, 49, 1731–1740. [Google Scholar] [CrossRef]
  16. Derrien, T. The GENCODE v7 catalog of human long noncoding RNAs: Analysis of their gene structure, evolution, and expression. Genome Res. 2012, 22, 1775–1789. [Google Scholar] [CrossRef]
  17. Uszczynska-Ratajczak, B.; Lagarde, J.; Frankish, A.; Guigó, R.; Johnson, R. Towards a complete map of the human long non-coding RNA transcriptome. Nat. Rev. Genet. 2018, 19, 535–548. [Google Scholar] [CrossRef]
  18. Fang, S. NONCODEV5: A comprehensive annotation database for long non-coding RNAs. Nucleic Acids Res. 2018, 46, D308–D314. [Google Scholar] [CrossRef]
  19. Statello, L.; Guo, C.-J.; Chen, L.-L.; Huarte, M. Gene regulation by long non-coding RNAs and its biological functions. Nat. Rev. Mol. Cell Biol. 2020, 22, 96–118. [Google Scholar] [CrossRef]
  20. Ali, T.; Grote, P. Beyond the RNA-dependent function of LncRNA genes. ELife 2020, 9, e60583. [Google Scholar] [CrossRef]
  21. Lin, T.; Hou, P.-F.; Meng, S.; Chen, F.; Jiang, T.; Li, M.-L.; Shi, M.-L.; Liu, J.-J.; Zheng, J.-N.; Bai, J. Emerging Roles of p53 Related lncRNAs in Cancer Progression: A Systematic Review. Int. J. Biol. Sci. 2019, 15, 1287–1298. [Google Scholar] [CrossRef]
  22. Vousden, K.H.; Lane, D.P. p53 in health and disease. Nat. Rev. Mol. Cell Biol. 2007, 8, 275–283. [Google Scholar] [CrossRef]
  23. Hall, J.R.; Messenger, Z.J.; Tam, H.W.; Phillips, S.L.; Recio, L.; Smart, R.C. Long noncoding RNA lincRNA-p21 is the major mediator of UVB-induced and p53-dependent apoptosis in keratinocytes. Cell Death Dis. 2015, 6, e1700. [Google Scholar] [CrossRef] [PubMed]
  24. Tano, K.; Onoguchi-Mizutani, R.; Yeasmin, F.; Uchiumi, F.; Suzuki, Y.; Yada, T.; Akimitsu, N. Identification of minimal p53 promoter region regulated by MALAT1 in human lung adenocarcinoma cells. Front. Genet. 2018, 9, 208. [Google Scholar] [CrossRef] [PubMed]
  25. Yuan, K.; Lan, J.; Xu, L.; Feng, X.; Liao, H.; Xie, K.; Wu, H.; Zeng, Y. Long noncoding RNA TLNC1 promotes the growth and metastasis of liver cancer via inhibition of p53 signalling. Mol. Cancer. 2022, 21, 105. [Google Scholar] [CrossRef] [PubMed]
  26. Verduci, L.; Ferraiuolo, M.; Sacconi, A.; Ganci, F.; Vitale, J.; Colombo, T.; Paci, P.; Strano, S.; Macino, G.; Rajewsky, N.; et al. The oncogenic role of circPVT1 in head and neck squamous cell carcinoma is mediated through the mutant p53/YAP/TEAD tran-scription-competent complex. Genome Biol. 2017, 18, 237. [Google Scholar] [CrossRef]
  27. Nandwani, A.; Rathore, S.; Datta, M. LncRNAs in cancer: Regulatory and therapeutic implications. Cancer Lett. 2021, 501, 162–171. [Google Scholar] [CrossRef]
  28. Wang, W.; He, X.; Wang, Y.; Liu, H.; Zhang, F.; Wu, Z.; Mo, S.; Chen, D. LINC01605 promotes aerobic glycolysis through lactate dehydrogenase A in triple-negative breast cancer. Cancer Sci. 2022, 113, 2484–2495. [Google Scholar] [CrossRef]
  29. Sonego, M.; Schiappacassi, M.; Lovisa, S.; Dall’Acqua, A.; Bagnoli, M.; Lovat, F.; Libra, M.; D’Andrea, S.; Canzonieri, V.; Militello, L.; et al. Stathmin regulates mutant p53 stability and transcriptional activity in ovarian cancer. EMBO Mol. Med. 2013, 5, 707–722. [Google Scholar] [CrossRef]
  30. Walerych, D.; Lisek, K.; Sommaggio, R.; Piazza, S.; Ciani, Y.; Dalla, E.; Rajkowska, K.; Gaweda-Walerych, K.; Ingallina, E.; Tonelli, C.; et al. Proteasome machinery is instrumental in a common gain-of-function program of the p53 missense mutants in cancer. Nat. Cell Biol. 2016, 18, 897–909. [Google Scholar] [CrossRef]
  31. Mootha, V.K.; Lindgren, C.M.; Eriksson, K.-F.; Subramanian, A.; Sihag, S.; Lehar, J.; Puigserver, P.; Carlsson, E.; Ridderstråle, M.; Laurila, E.; et al. PGC-1α-responsive genes involved in oxidative phosphorylation are coordinately downregulated in human diabetes. Nat. Genet. 2003, 34, 267–273. [Google Scholar] [CrossRef] [PubMed]
  32. Subramanian, A.; Tamayo, P.; Mootha, V.K.; Mukherjee, S.; Ebert, B.L.; Gillette, M.A.; Paulovich, A.; Pomeroy, S.L.; Golub, T.R.; Lander, E.S.; et al. Gene set enrichment analysis: A knowledge-based approach for interpreting genome-wide expression profiles. Proc. Natl. Acad. Sci. USA 2005, 102, 15545–15550. [Google Scholar] [CrossRef] [PubMed]
  33. Wang, X.-Y.; Wang, L.; Xu, P.-C.; Huang, F.-J.; Jian, X.; Wei, Z.-C.; Chen, Y.-Q. LINC01605 promotes the proliferation of laryngeal squamous cell carcinoma through targeting miR-493-3p. Eur. Rev. Med. Pharmacol. Sci. 2019, 23, 10379–10386. [Google Scholar] [CrossRef]
  34. Yue, M.; Liu, T.; Yan, G.; Luo, X.; Wang, L. LINC01605, regulated by the EP300-SMYD2 complex, potentiates the binding between METTL3 and SPTBN2 in colorectal cancer. Cancer Cell Int. 2021, 21, 504. [Google Scholar] [CrossRef]
  35. Forrest, M.E.; Saiakhova, A.; Beard, L.; Buchner, D.A.; Scacheri, P.C.; LaFramboise, T.; Markowitz, S.; Khalil, A.M. Colon Cancer-Upregulated Long Non-Coding RNA lincDUSP Regulates Cell Cycle Genes and Potentiates Resistance to Apoptosis. Sci. Rep. 2018, 8, 7324. [Google Scholar] [CrossRef] [PubMed]
  36. Wang, Z.; Jiang, Y.; Guan, D.; Li, J.; Yin, H.; Pan, Y.; Xie, D.; Chen, Y. Critical Roles of p53 in Epithelial-Mesenchymal Transition and Metastasis of Hepatocellular Carcinoma Cells. PLoS ONE 2013, 8, e72846. [Google Scholar] [CrossRef]
  37. Sorrentino, G.; Ruggeri, N.; Specchia, V.; Cordenonsi, M.; Mano, M.; Dupont, S.; Manfrin, A.; Ingallina, E.; Sommaggio, R.; Piazza, S.; et al. Metabolic control of YAP and TAZ by the mevalonate pathway. Nat. Cell Biol. 2014, 16, 357–366. [Google Scholar] [CrossRef]
  38. Parrales, A.; Iwakuma, T. p53 as a Regulator of Lipid Metabolism in Cancer. Int. J. Mol. Sci. 2016, 17, 2074. [Google Scholar] [CrossRef]
  39. Kabadi, A.M.; Ousterout, D.G.; Hilton, I.B.; Gersbach, C.A. Multiplex CRISPR/Cas9-based genome engineering from a single lentiviral vector. Nucleic Acids Res. 2014, 42, e147. [Google Scholar] [CrossRef]
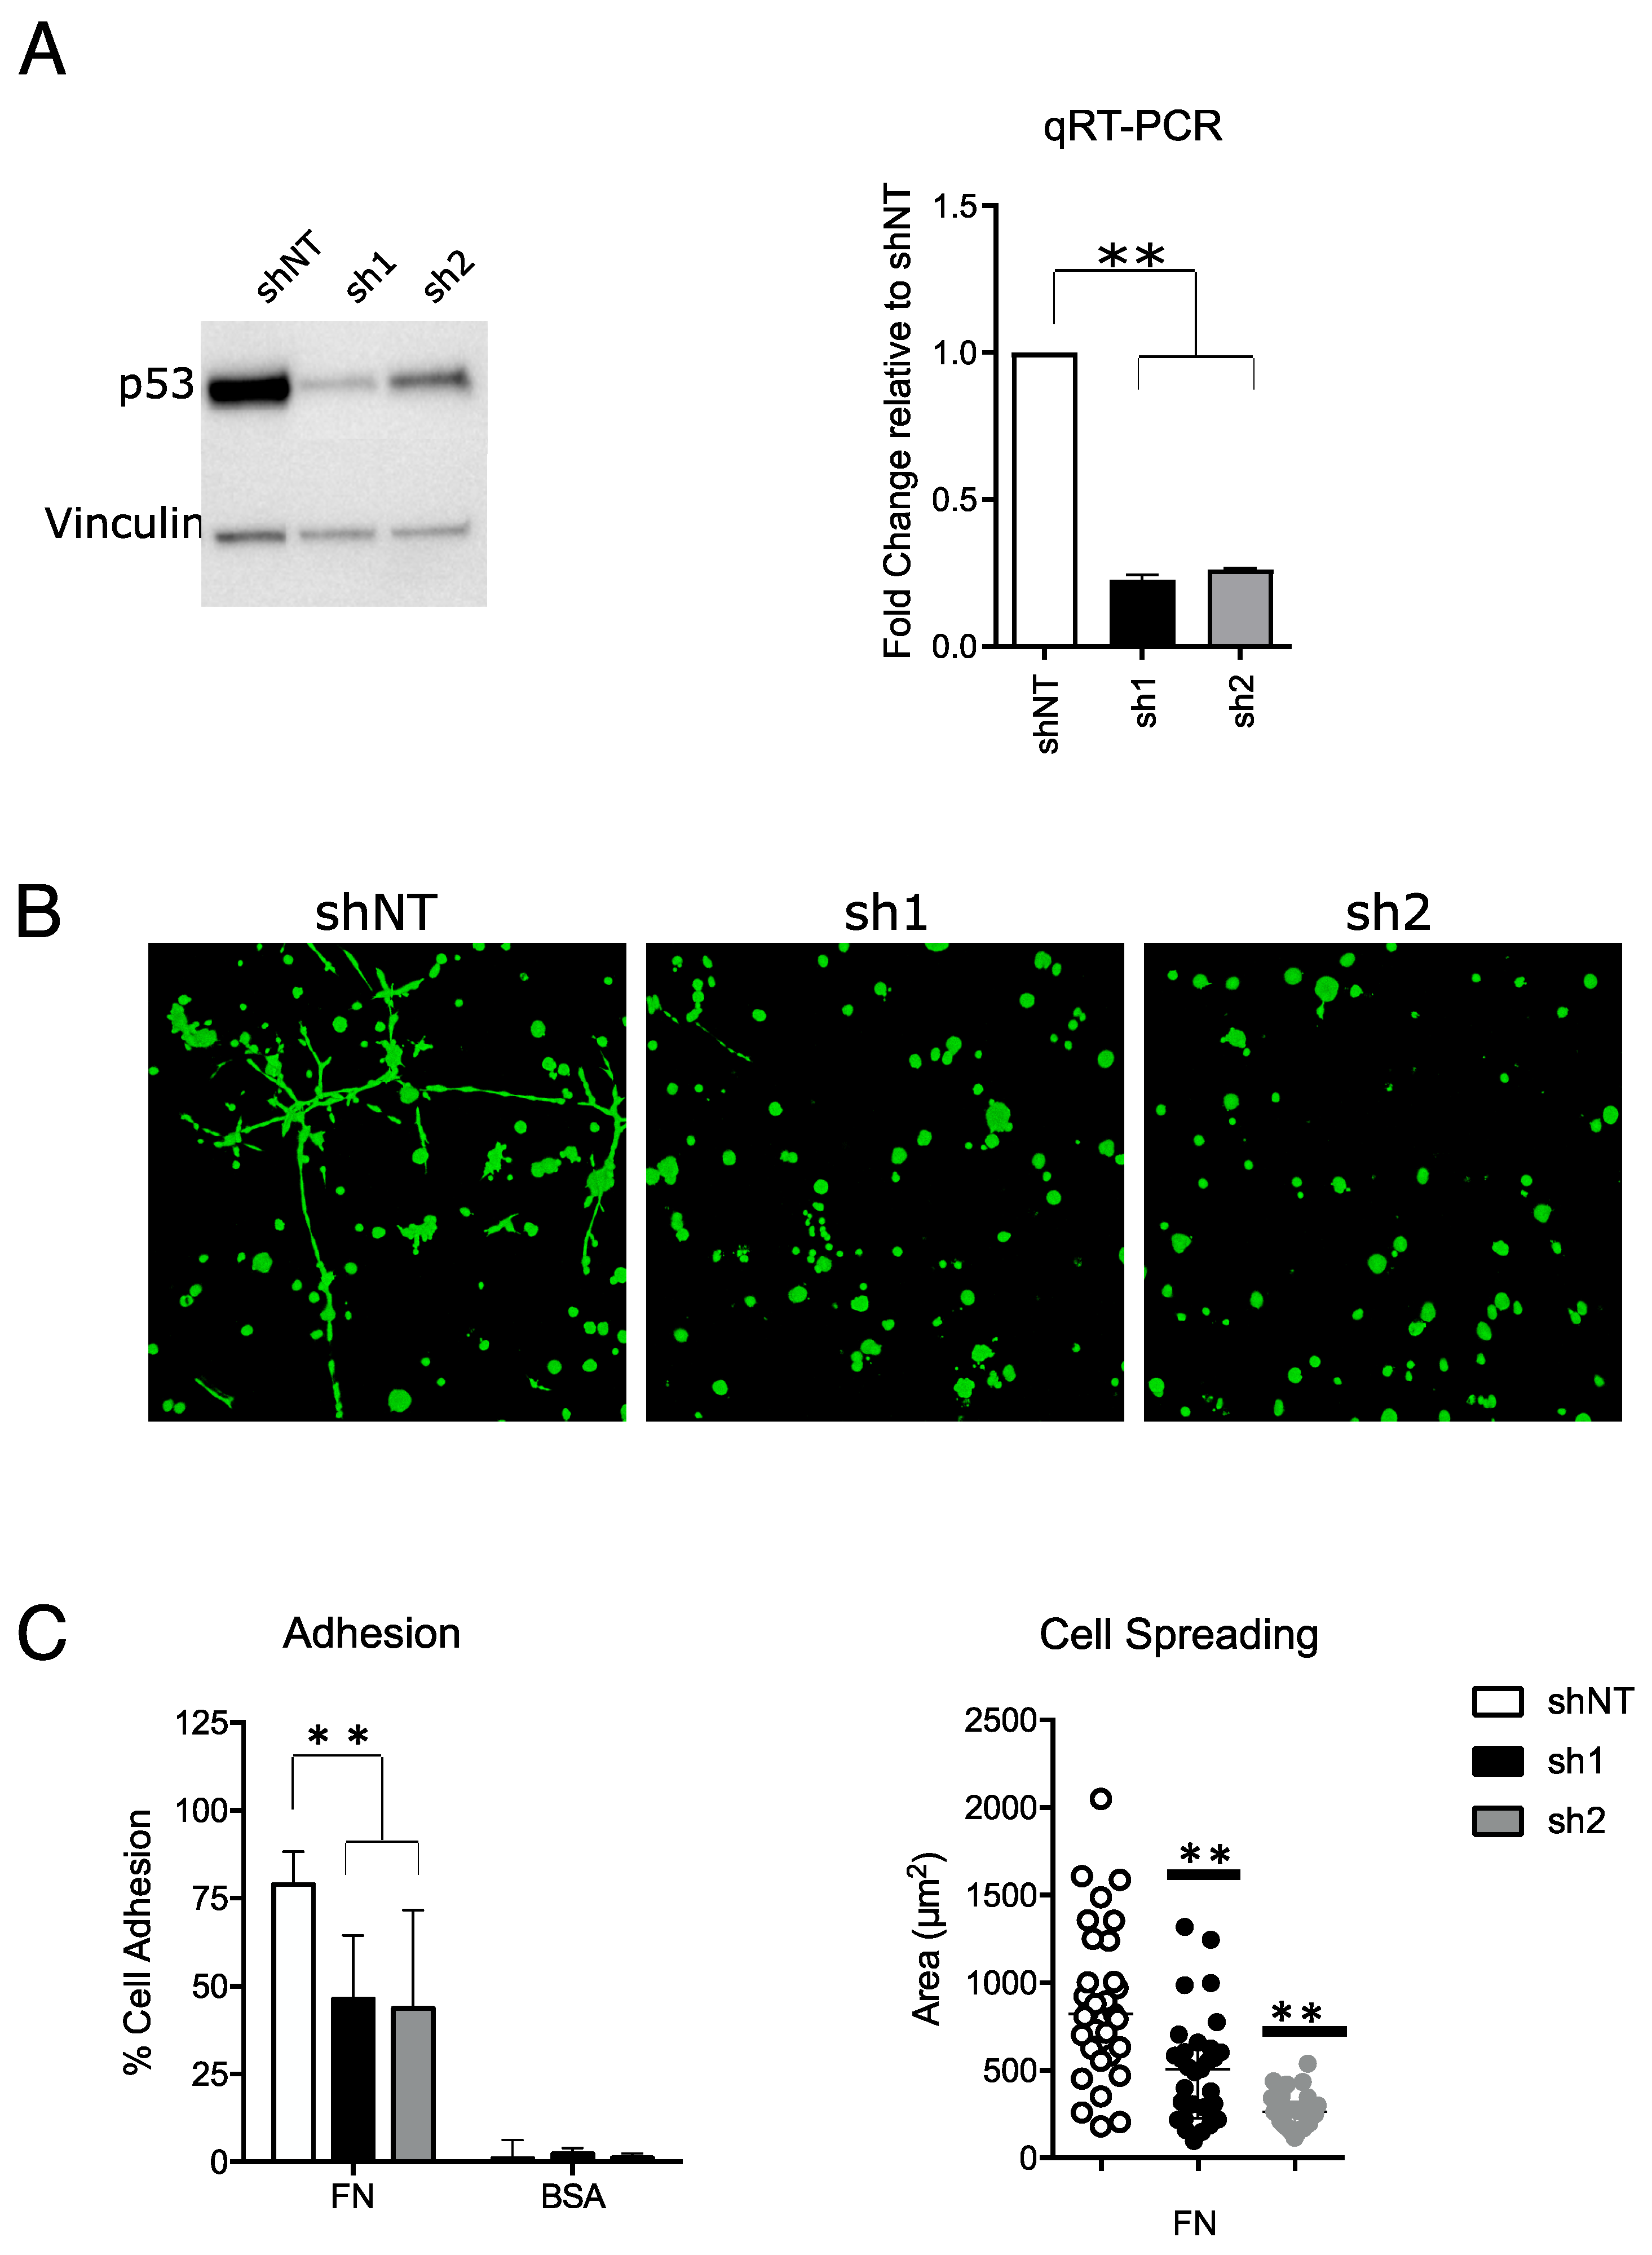
Figure 1. Mutant p53 confers pro-invasive phenotype in MDA-MB-231 breast cancer cell line. (A) Western blot (left) and qRT-PCR (right) of p53 in MDA-MB-231 shNT (shRNA not targeting), sh1 and sh2 at 9–10 days after shRNA transduction. Full-length blot is shown in Supplementary Figure S1A. (B) Representative 10× images of 3D Matrigel colony assay obtained with fluorescence confocal microscopy after calcein staining. Images were acquired 10 days following cell plating. (C) Left—histogram showing the percentage of cells that adhered to fibronectin (FN)-coated or control bovine serum albumin (BSA)-coated surface. Right—scatter plot showing the area of each single cell that adhered to FN-coated surface. Results are the mean of three independent biological replicates (** p-value ≤ 0.01).
Ijms 24 13736 g001
Figure 2. RP11-527N22.2 and LINC01605 lncRNAs represent a unique transcript. (A) Table showing top 10 lncRNAs differentially expressed in MDA-MB-231 sh1 and sh2 compared to shNT with their relative log2 fold-change (logFC) and adjusted p-value. (B) Kaplan–Meier plot showing overall survival of 942 patients carrying high or low RP11-527N22.2 expressing tumours in the Breast Cancer—The Cancer Genome Atlas (BRCA-TCGA) dataset. (C) UCSC Genome Browser image showing the following from top to bottom: candidate mut_p53 binding sites near LINC01605 locus (p53_bs1 and p53_bs2), CRISPR/Cas9 single guide RNAs (sgRNAs) targeting LINC01605 first exon. BigWig files of RNA-seq reads from MDA-MB-231 shNT, sh1 and sh2 and ENCODE H3K27Ac and H3K4me3 histone mark tracks. (D) qRT-PCR showing LINC01605 and RP11-527N22.2 expression in shNT, sh1 and sh2 MDA-MB-231 cells. (E) qRT-PCR measuring expression levels of LINC01605 and RP11-527N22.2 and of a region spanning LINC01605 and RP11-527N22.2 in MDA-MB-231 cell WT and KO for the first exon of LINC01605. (F) RT-qPCR measuring expression levels of LINC01605 and RP11-527N22.2 in MDA-MB-231 cells transduced with LINC01605-CRISPRi (* p-value ≤ 0.05, ** p-value ≤ 0.01).
Ijms 24 13736 g002
Figure 3. Identification of PRE1B as mut_p53-dependent enhancer, which regulates LINC01605 expression. (A) UCSC Genome browser session displaying the following from top to bottom: PRE1 and PRE2 overlapping ENCODE H3K27Ac histone mark with putative binding sites for p53 (p53_bs1 and p53_bs2); genomic tiles for PRE1 (PRE1A, PRE1B, PRE1C, PRE1D) and PRE2 (PRE2A and PRE2B) with PRE primers for ChIP and RT-qPCR. (B) ChIP experiment by immunoprecipitating mut_p53 in MDA-MD-231 shNT and sh1 cells and qPCR enrichment at the newly identified mut_p53 binding sites (p53_bs1 and p53_bs2). (C) ChIP H3K27Ac enrichment in MDA-MB-231 shNT and sh1 cells at the LINC016015 locus and at PRE1 and PRE2. Results are the mean of four technical replicates. (D) Luciferase reporter assay results in MDA-MB-231 shNT and sh1 cells for the PREs. Luciferase/renilla values were normalised to the pGl4.10-LINC01605 promoter only construct. Results are the mean of three biological replicates. An empty pGL4.10 (luc2) vector was also transfected into cells to normalize luminescence values (not shown in the figure) (* p-value ≤ 0.05, ** p-value ≤ 0.01).
Ijms 24 13736 g003
Figure 4. LINC01605 oncogenic functions. (A) Left—representative 1× images of colonies formed by LINC01605-KO and LINC01605-WT cells Images were acquired with the stereomicroscope. Right—scatter plots showing the perimeter length of colonies formed by LINC01605-WT and KO clones using ImageJ. (B) Representative 10× images of 3D Matrigel colony assay obtained with fluorescence confocal microscopy after calcein staining. Images were acquired 10 days following cell plating. (C) Left—representative 1× images of cells migrated through fibronectin-coated Boyden chamber using the stereomicroscope. Right—count of migrated cells through Boyden chamber in MDA-MB-231 LINC01605-WT and KO cells. Images were acquired with the stereomicroscope. Fifteen different fields were acquired for each cell line and for each biological replicate (three independent biological replicates) (** p-value ≤ 0.01).
Ijms 24 13736 g004
Table 1. Results of Gene Set Enrichment Analysis (GSEA). The table shows the pathways differentially enriched in mut_TP53-silenced or LINC01605-KO cells. In bold, the pathways that are in common between mut_TP53-silenced and in LINC01605-KO experiments.
mutTP53-silencedLINC01605-KO
HALLMARK_OXIDATIVE_PHOSPHOYLATIONenrichedenriched
HALLMARK_ADIPOGENESISenrichedenriched
HALLMARK_CHOLESTEROL_HOMEOSTASISenrichedenriched
HALLMARK_DNA_REPAIRenrichedenriched
HALLMARK_XENOBIOTIC_METABOLISMenrichedenriched
HALLMARK_EPITHELIAL_MESENCHYMAL_TRANSITIONenrichedenriched
HALLMARK_PROTEIN_SECRETIONenrichedenriched
HALLMARK_UV_RESPONSE_UPenrichedenriched
HALLMARK_FATTY_ACID_METABOLISMenrichedenriched
HALLMARK_PEROXISOMEenrichedenriched
HALLMARK_UNFOLDED_PROTEIN_RESPONSEenrichedenriched
HALLMARK_MYOGENESISenrichedenriched
HALLMARK_MTORC1_SIGNALINGenrichedenriched
HALLMARK_HYPOXIAenriched
HALLMARK_GLYCOLYSISenriched
HALLMARK_P53_PATHWAYenriched
HALLMARK_APOPTOSISenriched
HALLMARK_ESTROGEN_RESPONSE_LATEenriched
HALLMARK_ESTROGEN_RESPONSE_EARLYenriched
HALLMARK_TNFA_SIGNALING_VIA_NFKBenriched
HALLMARK_E2F_TARGETSenriched
HALLMARK_HEME_METABOLISMenriched
HALLMARK_IL2_STAT5_SIGNALINGenriched
HALLMARK_COAGULATIONenriched
HALLMARK_COMPLEMENTenriched
HALLMARK_ANDROGEN_RESPONSEenriched
HALLMARK_REACTIVE_OXYGEN_SPECIES_PATHWAYenriched
HALLMARK_UV_RESPONSE_DNenriched
HALLMARK_PI3K_AKT_MTOR_SIGNALINGenriched
HALLMARK_TGF_BETA_SIGNALINGenriched
HALLMARK_BILE_ACID_METABOLISMenriched
HALLMARK_ANGIOGENESISenriched
HALLMARK_PANCREAS_BETA_CELLSenriched
HALLMARK_MYC_TARGETS_V1enriched
HALLMARK_MYC_TARGETS_V2enriched
HALLMARK_APICAL_JUNCTION enriched
HALLMARK_IL6_JAK_STAT3_SIGNALING enriched
Disclaimer/Publisher’s Note: The statements, opinions and data contained in all publications are solely those of the individual author(s) and contributor(s) and not of MDPI and/or the editor(s). MDPI and/or the editor(s) disclaim responsibility for any injury to people or property resulting from any ideas, methods, instructions or products referred to in the content.