
Identification of an NF1 Microdeletion with Optical Genome Mapping

 , , ,
, , ,  ,
,  and
and 
Abstract
:1. Introduction
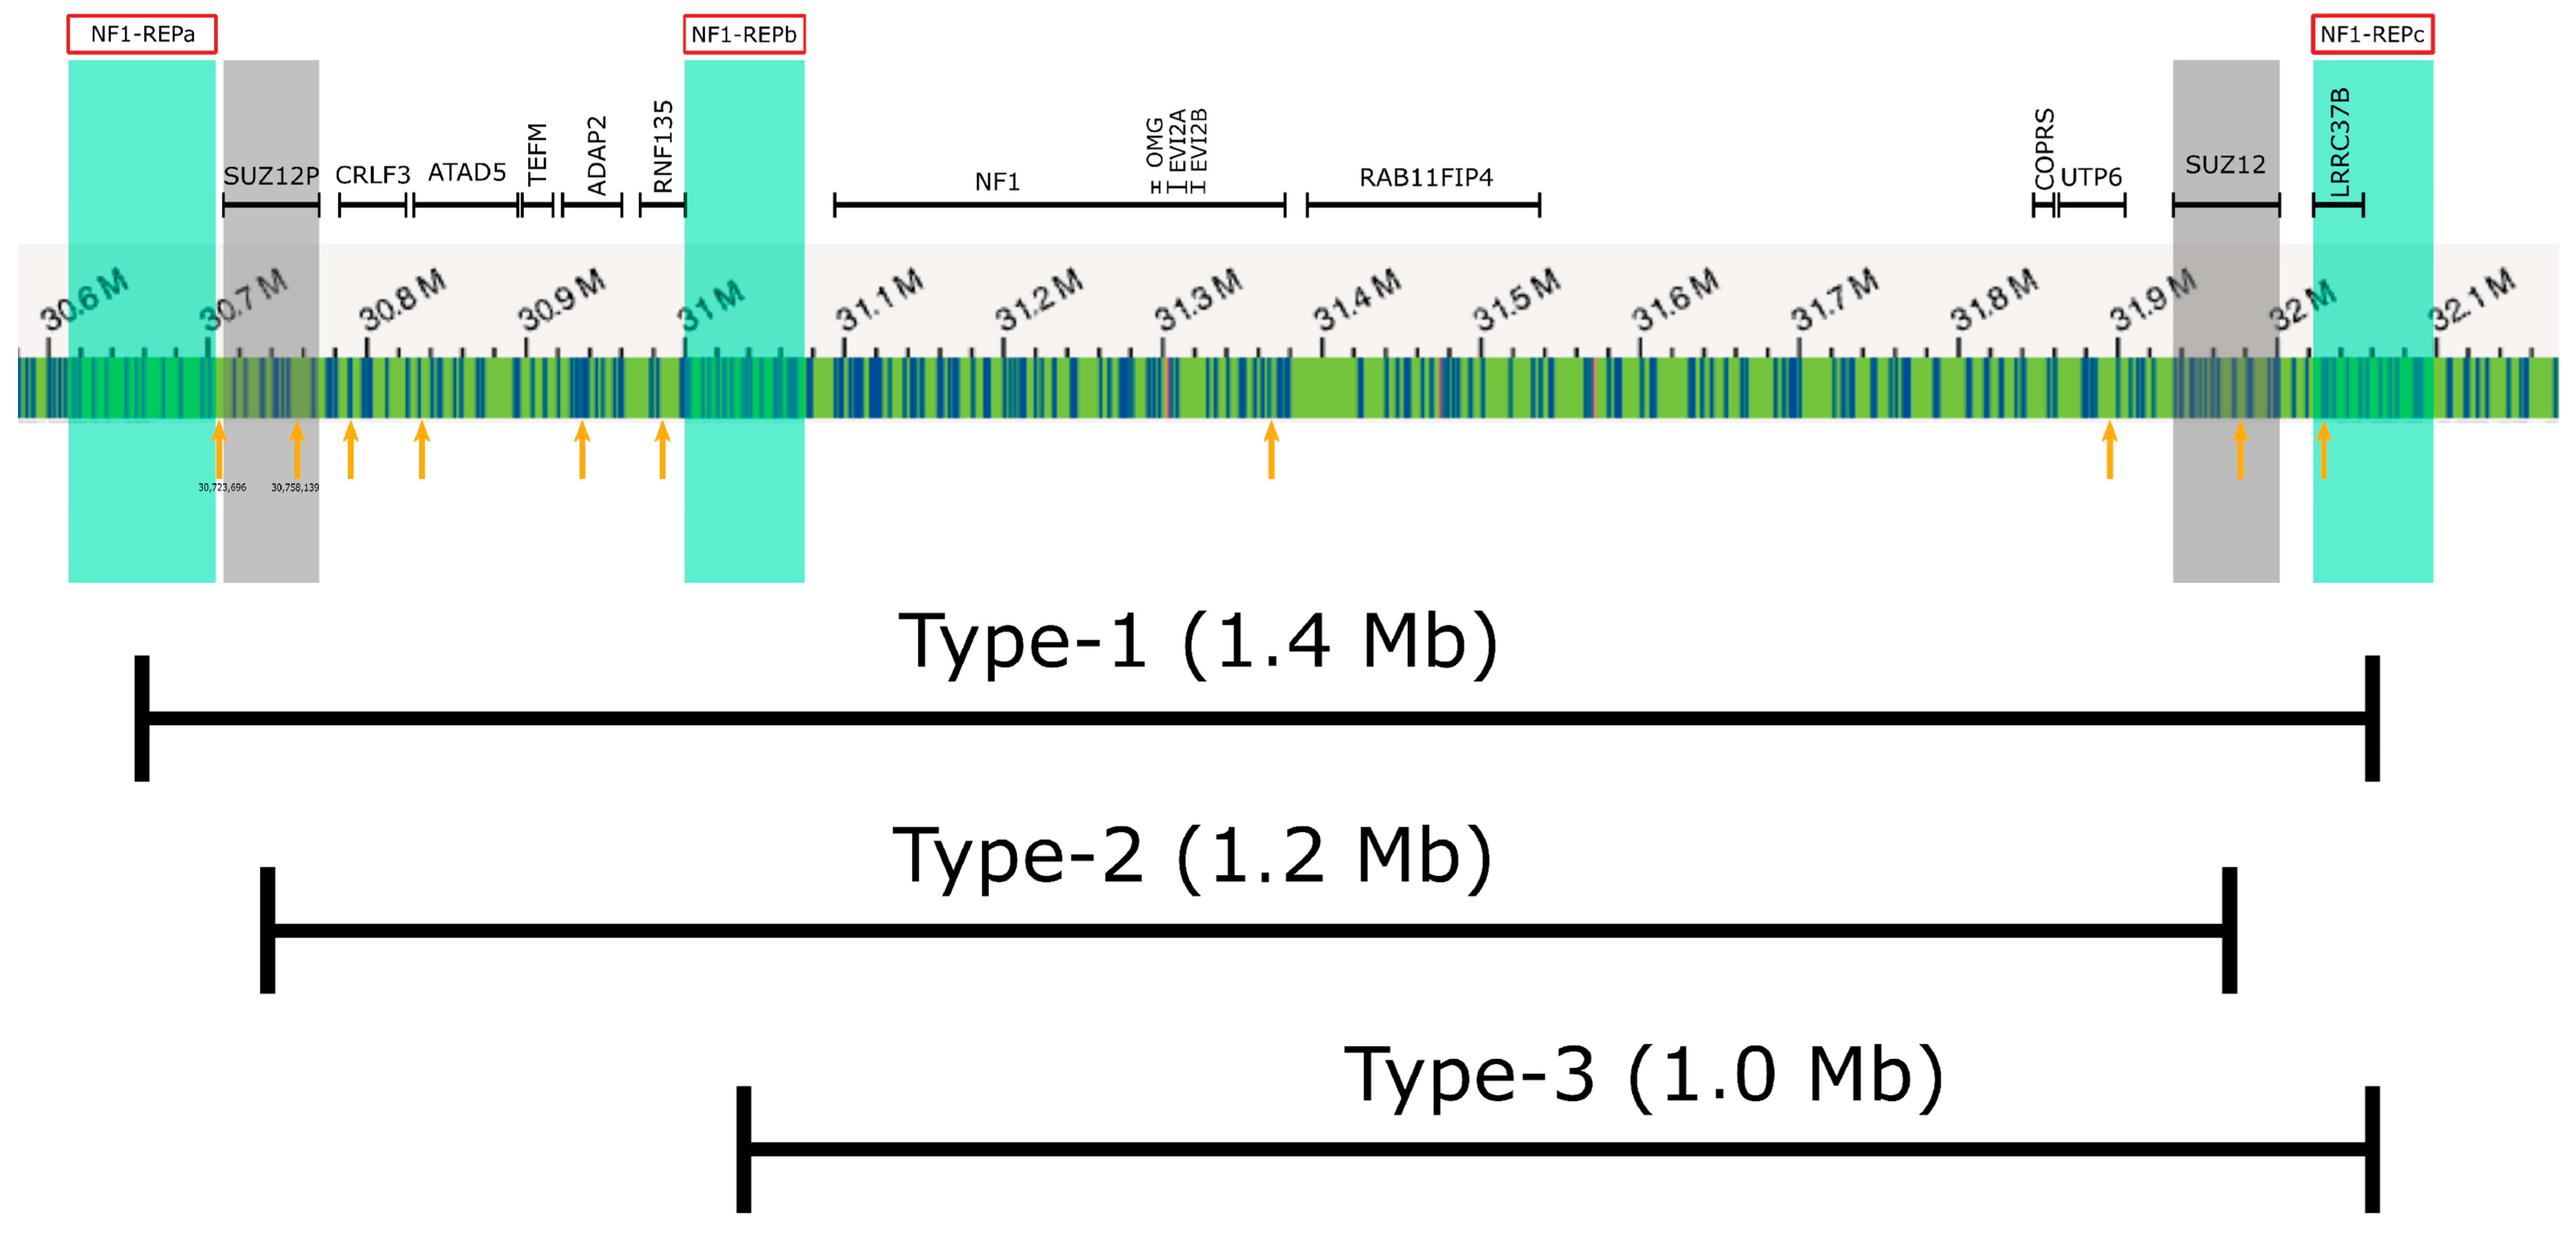
2. Results
3. Discussion
4. Materials and Methods
4.1. Patient’s Clinical Presentation
4.2. Sample Preparation and MLPA Analysis
4.3. Optical Genome Mapping
4.4. Analyses of Regulatory Elements within the NF1 Microdeletion Region
5. Conclusions
Supplementary Materials
Author Contributions
Funding
Institutional Review Board Statement
Informed Consent Statement
Data Availability Statement
Acknowledgments
Conflicts of Interest
References
- Lammert, M.; Friedman, J.M.; Kluwe, L.; Mautner, V.F. Prevalence of neurofibromatosis 1 in German children at elementary school enrollment. Arch. Dermatol. 2005, 141, 71–74. [Google Scholar] [CrossRef] [PubMed]
- Uusitalo, E.; Leppavirta, J.; Koffert, A.; Suominen, S.; Vahtera, J.; Vahlberg, T.; Poyhonen, M.; Peltonen, J.; Peltonen, S. Incidence and mortality of neurofibromatosis: A total population study in Finland. J. Investig. Dermatol. 2015, 135, 904–906. [Google Scholar] [CrossRef] [PubMed]
- Castle, B.; Baser, M.E.; Huson, S.M.; Cooper, D.N.; Upadhyaya, M. Evaluation of genotype-phenotype correlations in neurofibromatosis type 1. J. Med. Genet. 2003, 40, e109. [Google Scholar] [CrossRef] [PubMed]
- Huson, S.M.; Compston, D.A.; Harper, P.S. A genetic study of von Recklinghausen neurofibromatosis in south east Wales. II. Guidelines for genetic counselling. J. Med. Genet. 1989, 26, 712–721. [Google Scholar] [CrossRef] [PubMed]
- DeBella, K.; Szudek, J.; Friedman, J.M. Use of the national institutes of health criteria for diagnosis of neurofibromatosis 1 in children. Pediatrics 2000, 105, 608–614. [Google Scholar] [CrossRef]
- Jett, K.; Friedman, J.M. Clinical and genetic aspects of neurofibromatosis 1. Genet. Med. 2010, 12, 1–11. [Google Scholar] [CrossRef]
- Gutmann, D.H.; Ferner, R.E.; Listernick, R.H.; Korf, B.R.; Wolters, P.L.; Johnson, K.J. Neurofibromatosis type 1. Nat. Rev. Dis. Primers 2017, 3, 17004. [Google Scholar] [CrossRef]
- Easton, D.F.; Ponder, M.A.; Huson, S.M.; Ponder, B.A. An analysis of variation in expression of neurofibromatosis (NF) type 1 (NF1): Evidence for modifying genes. Am. J. Hum. Genet. 1993, 53, 305–313. [Google Scholar]
- Bergoug, M.; Doudeau, M.; Godin, F.; Mosrin, C.; Vallee, B.; Benedetti, H. Neurofibromin Structure, Functions and Regulation. Cells 2020, 9, 2365. [Google Scholar] [CrossRef]
- Gutmann, D.H.; Donahoe, J.; Brown, T.; James, C.D.; Perry, A. Loss of neurofibromatosis 1 (NF1) gene expression in NF1-associated pilocytic astrocytomas. Neuropathol. Appl. Neurobiol. 2000, 26, 361–367. [Google Scholar] [CrossRef]
- Stephens, K.; Kayes, L.; Riccardi, V.M.; Rising, M.; Sybert, V.P.; Pagon, R.A. Preferential mutation of the neurofibromatosis type 1 gene in paternally derived chromosomes. Hum. Genet. 1992, 88, 279–282. [Google Scholar] [CrossRef] [PubMed]
- Zhang, J.; Tong, H.; Fu, X.; Zhang, Y.; Liu, J.; Cheng, R.; Liang, J.; Peng, J.; Sun, Z.; Liu, H.; et al. Molecular Characterization of NF1 and Neurofibromatosis Type 1 Genotype-Phenotype Correlations in a Chinese Population. Sci. Rep. 2015, 5, 11291. [Google Scholar] [CrossRef] [PubMed]
- Cnossen, M.H.; van der Est, M.N.; Breuning, M.H.; van Asperen, C.J.; Breslau-Siderius, E.J.; van der Ploeg, A.T.; de Goede-Bolder, A.; van den Ouweland, A.M.; Halley, D.J.; Niermeijer, M.F. Deletions spanning the neurofibromatosis type 1 gene: Implications for genotype-phenotype correlations in neurofibromatosis type 1? Hum. Mutat. 1997, 9, 458–464. [Google Scholar] [CrossRef]
- Kehrer-Sawatzki, H.; Mautner, V.F.; Cooper, D.N. Emerging genotype-phenotype relationships in patients with large NF1 deletions. Hum. Genet. 2017, 136, 349–376. [Google Scholar] [CrossRef]
- Serra, G.; Antona, V.; Corsello, G.; Zara, F.; Piro, E.; Falsaperla, R. NF1 microdeletion syndrome: Case report of two new patients. Ital. J. Pediatr. 2019, 45, 138. [Google Scholar] [CrossRef]
- Taylor Tavares, A.L.; Willatt, L.; Armstrong, R.; Simonic, I.; Park, S.M. Mosaic deletion of the NF1 gene in a patient with cognitive disability and dysmorphic features but without diagnostic features of NF1. Am. J. Med. Genet. A 2013, 161A, 1185–1188. [Google Scholar] [CrossRef]
- Buki, G.; Zsigmond, A.; Czako, M.; Szalai, R.; Antal, G.; Farkas, V.; Fekete, G.; Nagy, D.; Szell, M.; Tihanyi, M.; et al. Genotype-Phenotype Associations in Patients With Type-1, Type-2, and Atypical NF1 Microdeletions. Front. Genet. 2021, 12, 673025. [Google Scholar] [CrossRef]
- Pös, O.; Radvanszky, J.; Styk, J.; Pös, Z.; Buglyó, G.; Kajsik, M.; Budis, J.; Nagy, B.; Szemes, T. Copy Number Variation: Methods and Clinical Applications. Appl. Sci. 2021, 11, 819. [Google Scholar] [CrossRef]
- Zheng, H.; Chang, L.; Patel, N.; Yang, J.; Lowe, L.; Burns, D.K.; Zhu, Y. Induction of abnormal proliferation by nonmyelinating schwann cells triggers neurofibroma formation. Cancer Cell 2008, 13, 117–128. [Google Scholar] [CrossRef]
- Smith, A.C.; Neveling, K.; Kanagal-Shamanna, R. Optical genome mapping for structural variation analysis in hematologic malignancies. Am. J. Hematol. 2022, 97, 975–982. [Google Scholar] [CrossRef]
- Lestringant, V.; Duployez, N.; Penther, D.; Luquet, I.; Derrieux, C.; Lutun, A.; Preudhomme, C.; West, M.; Ouled-Haddou, H.; Devoldere, C.; et al. Optical genome mapping, a promising alternative to gold standard cytogenetic approaches in a series of acute lymphoblastic leukemias. Genes Chromosomes Cancer 2021, 60, 657–667. [Google Scholar] [CrossRef] [PubMed]
- Dremsek, P.; Schwarz, T.; Weil, B.; Malashka, A.; Laccone, F.; Neesen, J. Optical Genome Mapping in Routine Human Genetic Diagnostics-Its Advantages and Limitations. Genes 2021, 12, 1958. [Google Scholar] [CrossRef] [PubMed]
- Bionano Genomics, Inc. Bionano Solve Theory of Operation: Structural Variant Calling. Revision: L. Document Number: 30110. Available online: https://bionanogenomics.com/wp-content/uploads/2018/04/30110-Bionano-Solve-Theory-of-Operation-Structural-Variant-Calling.pdf (accessed on 26 June 2023).
- Wang, H.; Jia, Z.; Mao, A.; Xu, B.; Wang, S.; Wang, L.; Liu, S.; Zhang, H.; Zhang, X.; Yu, T.; et al. Analysis of balanced reciprocal translocations in patients with subfertility using single-molecule optical mapping. J. Assist. Reprod. Genet. 2020, 37, 509–516. [Google Scholar] [CrossRef] [PubMed]
- Sahajpal, N.S.; Barseghyan, H.; Kolhe, R.; Hastie, A.; Chaubey, A. Optical Genome Mapping as a Next-Generation Cytogenomic Tool for Detection of Structural and Copy Number Variations for Prenatal Genomic Analyses. Genes 2021, 12, 398. [Google Scholar] [CrossRef] [PubMed]
- Dai, Y.; Li, P.; Wang, Z.; Liang, F.; Yang, F.; Fang, L.; Huang, Y.; Huang, S.; Zhou, J.; Wang, D.; et al. Single-molecule optical mapping enables quantitative measurement of D4Z4 repeats in facioscapulohumeral muscular dystrophy (FSHD). J. Med. Genet. 2020, 57, 109–120. [Google Scholar] [CrossRef]
- Summerer, A.; Mautner, V.F.; Upadhyaya, M.; Claes, K.B.M.; Hogel, J.; Cooper, D.N.; Messiaen, L.; Kehrer-Sawatzki, H. Extreme clustering of type-1 NF1 deletion breakpoints co-locating with G-quadruplex forming sequences. Hum. Genet. 2018, 137, 511–520. [Google Scholar] [CrossRef]
- Buki, G.; Till, A.; Zsigmond, A.; Bene, J.; Hadzsiev, K. Neurofibromatosis-1 microdeletion syndrome. Orvosi Hetil. 2022, 163, 2041–2051. [Google Scholar] [CrossRef]
- Koczkowska, M.; Chen, Y.; Callens, T.; Gomes, A.; Sharp, A.; Johnson, S.; Hsiao, M.C.; Chen, Z.; Balasubramanian, M.; Barnett, C.P.; et al. Genotype-Phenotype Correlation in NF1: Evidence for a More Severe Phenotype Associated with Missense Mutations Affecting NF1 Codons 844–848. Am. J. Hum. Genet. 2018, 102, 69–87. [Google Scholar] [CrossRef]
- Ning, X.; Farschtschi, S.; Jones, A.; Kehrer-Sawatzki, H.; Mautner, V.F.; Friedman, J.M. Growth in neurofibromatosis 1 microdeletion patients. Clin. Genet. 2016, 89, 351–354. [Google Scholar] [CrossRef]
- Douglas, J.; Cilliers, D.; Coleman, K.; Tatton-Brown, K.; Barker, K.; Bernhard, B.; Burn, J.; Huson, S.; Josifova, D.; Lacombe, D.; et al. Mutations in RNF135, a gene within the NF1 microdeletion region, cause phenotypic abnormalities including overgrowth. Nat. Genet. 2007, 39, 963–965. [Google Scholar] [CrossRef]
- Imagawa, E.; Seyama, R.; Aoi, H.; Uchiyama, Y.; Marcarini, B.G.; Furquim, I.; Honjo, R.S.; Bertola, D.R.; Kim, C.A.; Matsumoto, N. Imagawa-Matsumoto syndrome: SUZ12-related overgrowth disorder. Clin. Genet. 2023, 103, 383–391. [Google Scholar] [CrossRef] [PubMed]
- Cyrus, S.S.; Cohen, A.S.A.; Agbahovbe, R.; Avela, K.; Yeung, K.S.; Chung, B.H.Y.; Luk, H.M.; Tkachenko, N.; Choufani, S.; Weksberg, R.; et al. Rare SUZ12 variants commonly cause an overgrowth phenotype. Am. J. Med. Genet. C Semin. Med. Genet. 2019, 181, 532–547. [Google Scholar] [CrossRef] [PubMed]
- Vockley, C.M.; Barrera, A.; Reddy, T.E. Decoding the role of regulatory element polymorphisms in complex disease. Curr. Opin. Genet. Dev. 2017, 43, 38–45. [Google Scholar] [CrossRef] [PubMed]
- Hollox, E.J.; Zuccherato, L.W.; Tucci, S. Genome structural variation in human evolution. Trends Genet. 2022, 38, 45–58. [Google Scholar] [CrossRef]
- Lavrichenko, K.; Johansson, S.; Jonassen, I. Comprehensive characterization of copy number variation (CNV) called from array, long- and short-read data. BMC Genom. 2021, 22, 826. [Google Scholar] [CrossRef]
- Redin, C.; Brand, H.; Collins, R.L.; Kammin, T.; Mitchell, E.; Hodge, J.C.; Hanscom, C.; Pillalamarri, V.; Seabra, C.M.; Abbott, M.A.; et al. The genomic landscape of balanced cytogenetic abnormalities associated with human congenital anomalies. Nat. Genet. 2017, 49, 36–45. [Google Scholar] [CrossRef]
- Talkowski, M.E.; Rosenfeld, J.A.; Blumenthal, I.; Pillalamarri, V.; Chiang, C.; Heilbut, A.; Ernst, C.; Hanscom, C.; Rossin, E.; Lindgren, A.M.; et al. Sequencing chromosomal abnormalities reveals neurodevelopmental loci that confer risk across diagnostic boundaries. Cell 2012, 149, 525–537. [Google Scholar] [CrossRef]
- Iqbal, M.A.; Broeckel, U.; Levy, B.; Skinner, S.; Sahajpal, N.S.; Rodriguez, V.; Stence, A.; Awayda, K.; Scharer, G.; Skinner, C.; et al. Multisite Assessment of Optical Genome Mapping for Analysis of Structural Variants in Constitutional Postnatal Cases. J. Mol. Diagn. 2023, 25, 175–188. [Google Scholar] [CrossRef]
- Bionano Genomics, Inc. Data Collection Guidelines. Revision: E. Document Number: 30173. Available online: https://bionanogenomics.com/wp-content/uploads/2018/04/30173-Data-Collection-Guidelines.pdf (accessed on 26 June 2023).
- Bionano Genomics, Inc. Bionano Solve Theory of Operation: Variant Annotation Pipeline. Revision: J. Document Number: 30190. Available online: https://bionanogenomics.com/wp-content/uploads/2018/04/30190-Bionano-Solve-Theory-of-Operation-Variant-Annotation-Pipeline.pdf (accessed on 26 June 2023).


| Microdeletion Type | Type-1 | Type 2 | Type 3 | Atypical |
|---|---|---|---|---|
| Frequency | 70–80% | ~10% | 1–4% | 10–20% |
| Suitable method for appropriate deletion classification | MLPA Probemix P122-D2 NF1-area or microarray analysis | Microarray analysis | Microarray analysis | Microarray analysis |
| Affected genes | 14 protein coding and 5 miRNA | 13 protein coding and 5 miRNA | 9 protein coding and 5 miRNA | Heterogeneous |
| MLPA probe positions (NF1 Area) | |||
| Preceding probe not included in the deletion | Centromeric probe deleted | Telomeric probe deleted | Following probe not deleted |
| CPD (28,789,435) | SUZ12P (29,058,406) | LRRC37B (30,348,590) | ZNF207 (30,693,769) |
| OGM probe positions | |||
| Preceding probe not included in the deletion | Centromeric probe deleted | Telomeric probe deleted | Following probe not deleted |
| 28,946,383 | 28,955,119 | 30,402,449 | 30,413,609 |
| Distinctive Characteristic Symptoms | Patients with Intrageneic Pathogenic NF1 Variants [28,29] | NF1 Microdeletion Patients | Type 1 Microdeletion [14,17,28] | Type 2 (non-Mosaic) Microdeletion [17,28] | Atypical Microdeletion [17] | Our Patient (#140) | |
|---|---|---|---|---|---|---|---|
| Dysmorphic features | Facial dysmorphism | Rare | Frequent | 67% | 60% | 16% | X |
| Coarse face | Absent | Frequent | 67% | N/A | 26% | - | |
| Large hands, feet | Absent | Frequent | 67% | 60% | 16% | - | |
| Neurofibromas | Cutaneous | 91% | More, earlier | 86% | 60% * | 42% | - |
| Subcutaneous | 58% | More, earlier | 76% | 60% * | 16% | X | |
| Plexiform | 43–50% | More, earlier | 76% | 60% * | 21% | - | |
| Macrocephaly | 33.9% | More frequent | 58% | 60% | 16% | - | |
| Tall stature | Not typical | Frequent | 58% | 0% | N/A | - | |
| Skeletal anomalies including scoliosis | 43% | Frequent | 92% | 80% | 58% | X | |
| DD/ID | 45% | Frequent | 75% | N/A | 47% | - | |
| Learning difficulties | 30–60% | Frequent | 75% | 80% | 11% | X | |
Disclaimer/Publisher’s Note: The statements, opinions and data contained in all publications are solely those of the individual author(s) and contributor(s) and not of MDPI and/or the editor(s). MDPI and/or the editor(s) disclaim responsibility for any injury to people or property resulting from any ideas, methods, instructions or products referred to in the content. |
© 2023 by the authors. Licensee MDPI, Basel, Switzerland. This article is an open access article distributed under the terms and conditions of the Creative Commons Attribution (CC BY) license (https://creativecommons.org/licenses/by/4.0/).
Share and Cite
Büki, G.; Bekő, A.; Bödör, C.; Urbán, P.; Németh, K.; Hadzsiev, K.; Fekete, G.; Kehrer-Sawatzki, H.; Bene, J. Identification of an NF1 Microdeletion with Optical Genome Mapping. Int. J. Mol. Sci. 2023, 24, 13580. https://doi.org/10.3390/ijms241713580
Büki G, Bekő A, Bödör C, Urbán P, Németh K, Hadzsiev K, Fekete G, Kehrer-Sawatzki H, Bene J. Identification of an NF1 Microdeletion with Optical Genome Mapping. International Journal of Molecular Sciences. 2023; 24(17):13580. https://doi.org/10.3390/ijms241713580
Chicago/Turabian StyleBüki, Gergely, Anna Bekő, Csaba Bödör, Péter Urbán, Krisztina Németh, Kinga Hadzsiev, György Fekete, Hildegard Kehrer-Sawatzki, and Judit Bene. 2023. "Identification of an NF1 Microdeletion with Optical Genome Mapping" International Journal of Molecular Sciences 24, no. 17: 13580. https://doi.org/10.3390/ijms241713580
APA StyleBüki, G., Bekő, A., Bödör, C., Urbán, P., Németh, K., Hadzsiev, K., Fekete, G., Kehrer-Sawatzki, H., & Bene, J. (2023). Identification of an NF1 Microdeletion with Optical Genome Mapping. International Journal of Molecular Sciences, 24(17), 13580. https://doi.org/10.3390/ijms241713580