
Amyloid Precursor Protein (APP) Regulates Gliogenesis and Neurogenesis of Human Neural Stem Cells by Several Signaling Pathways
 , , and
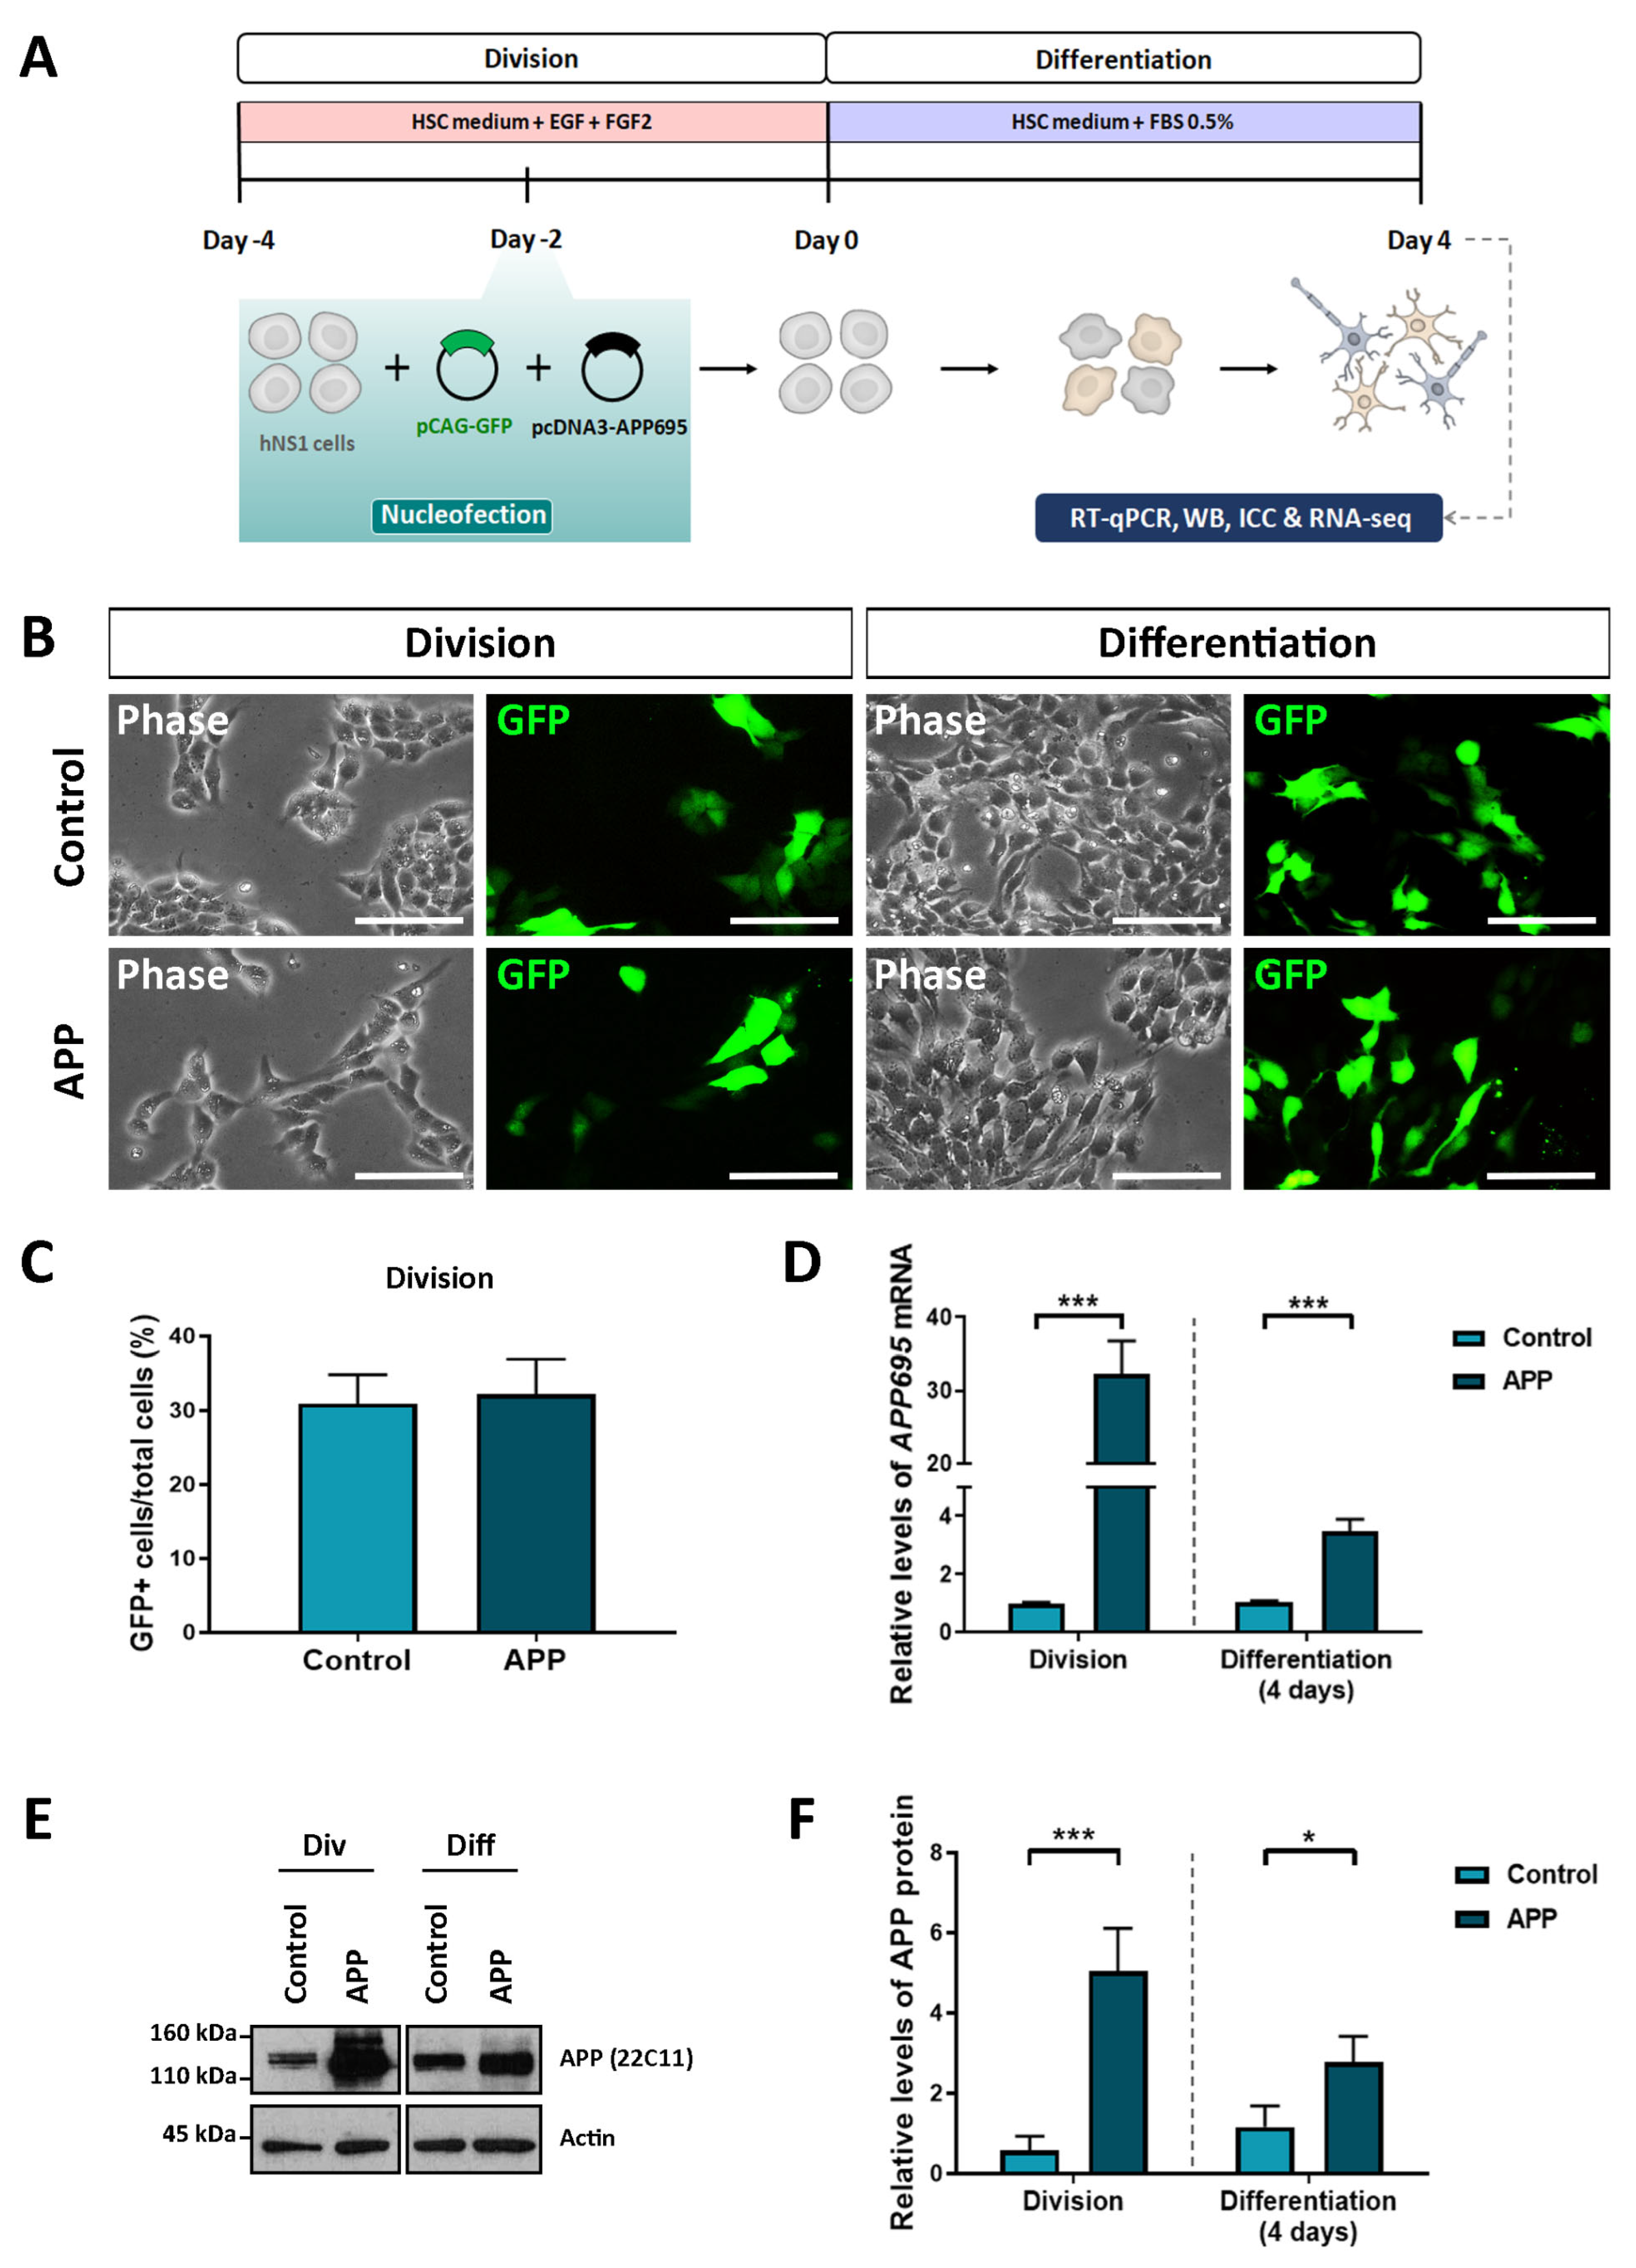
Abstract
1. Introduction
2. Results
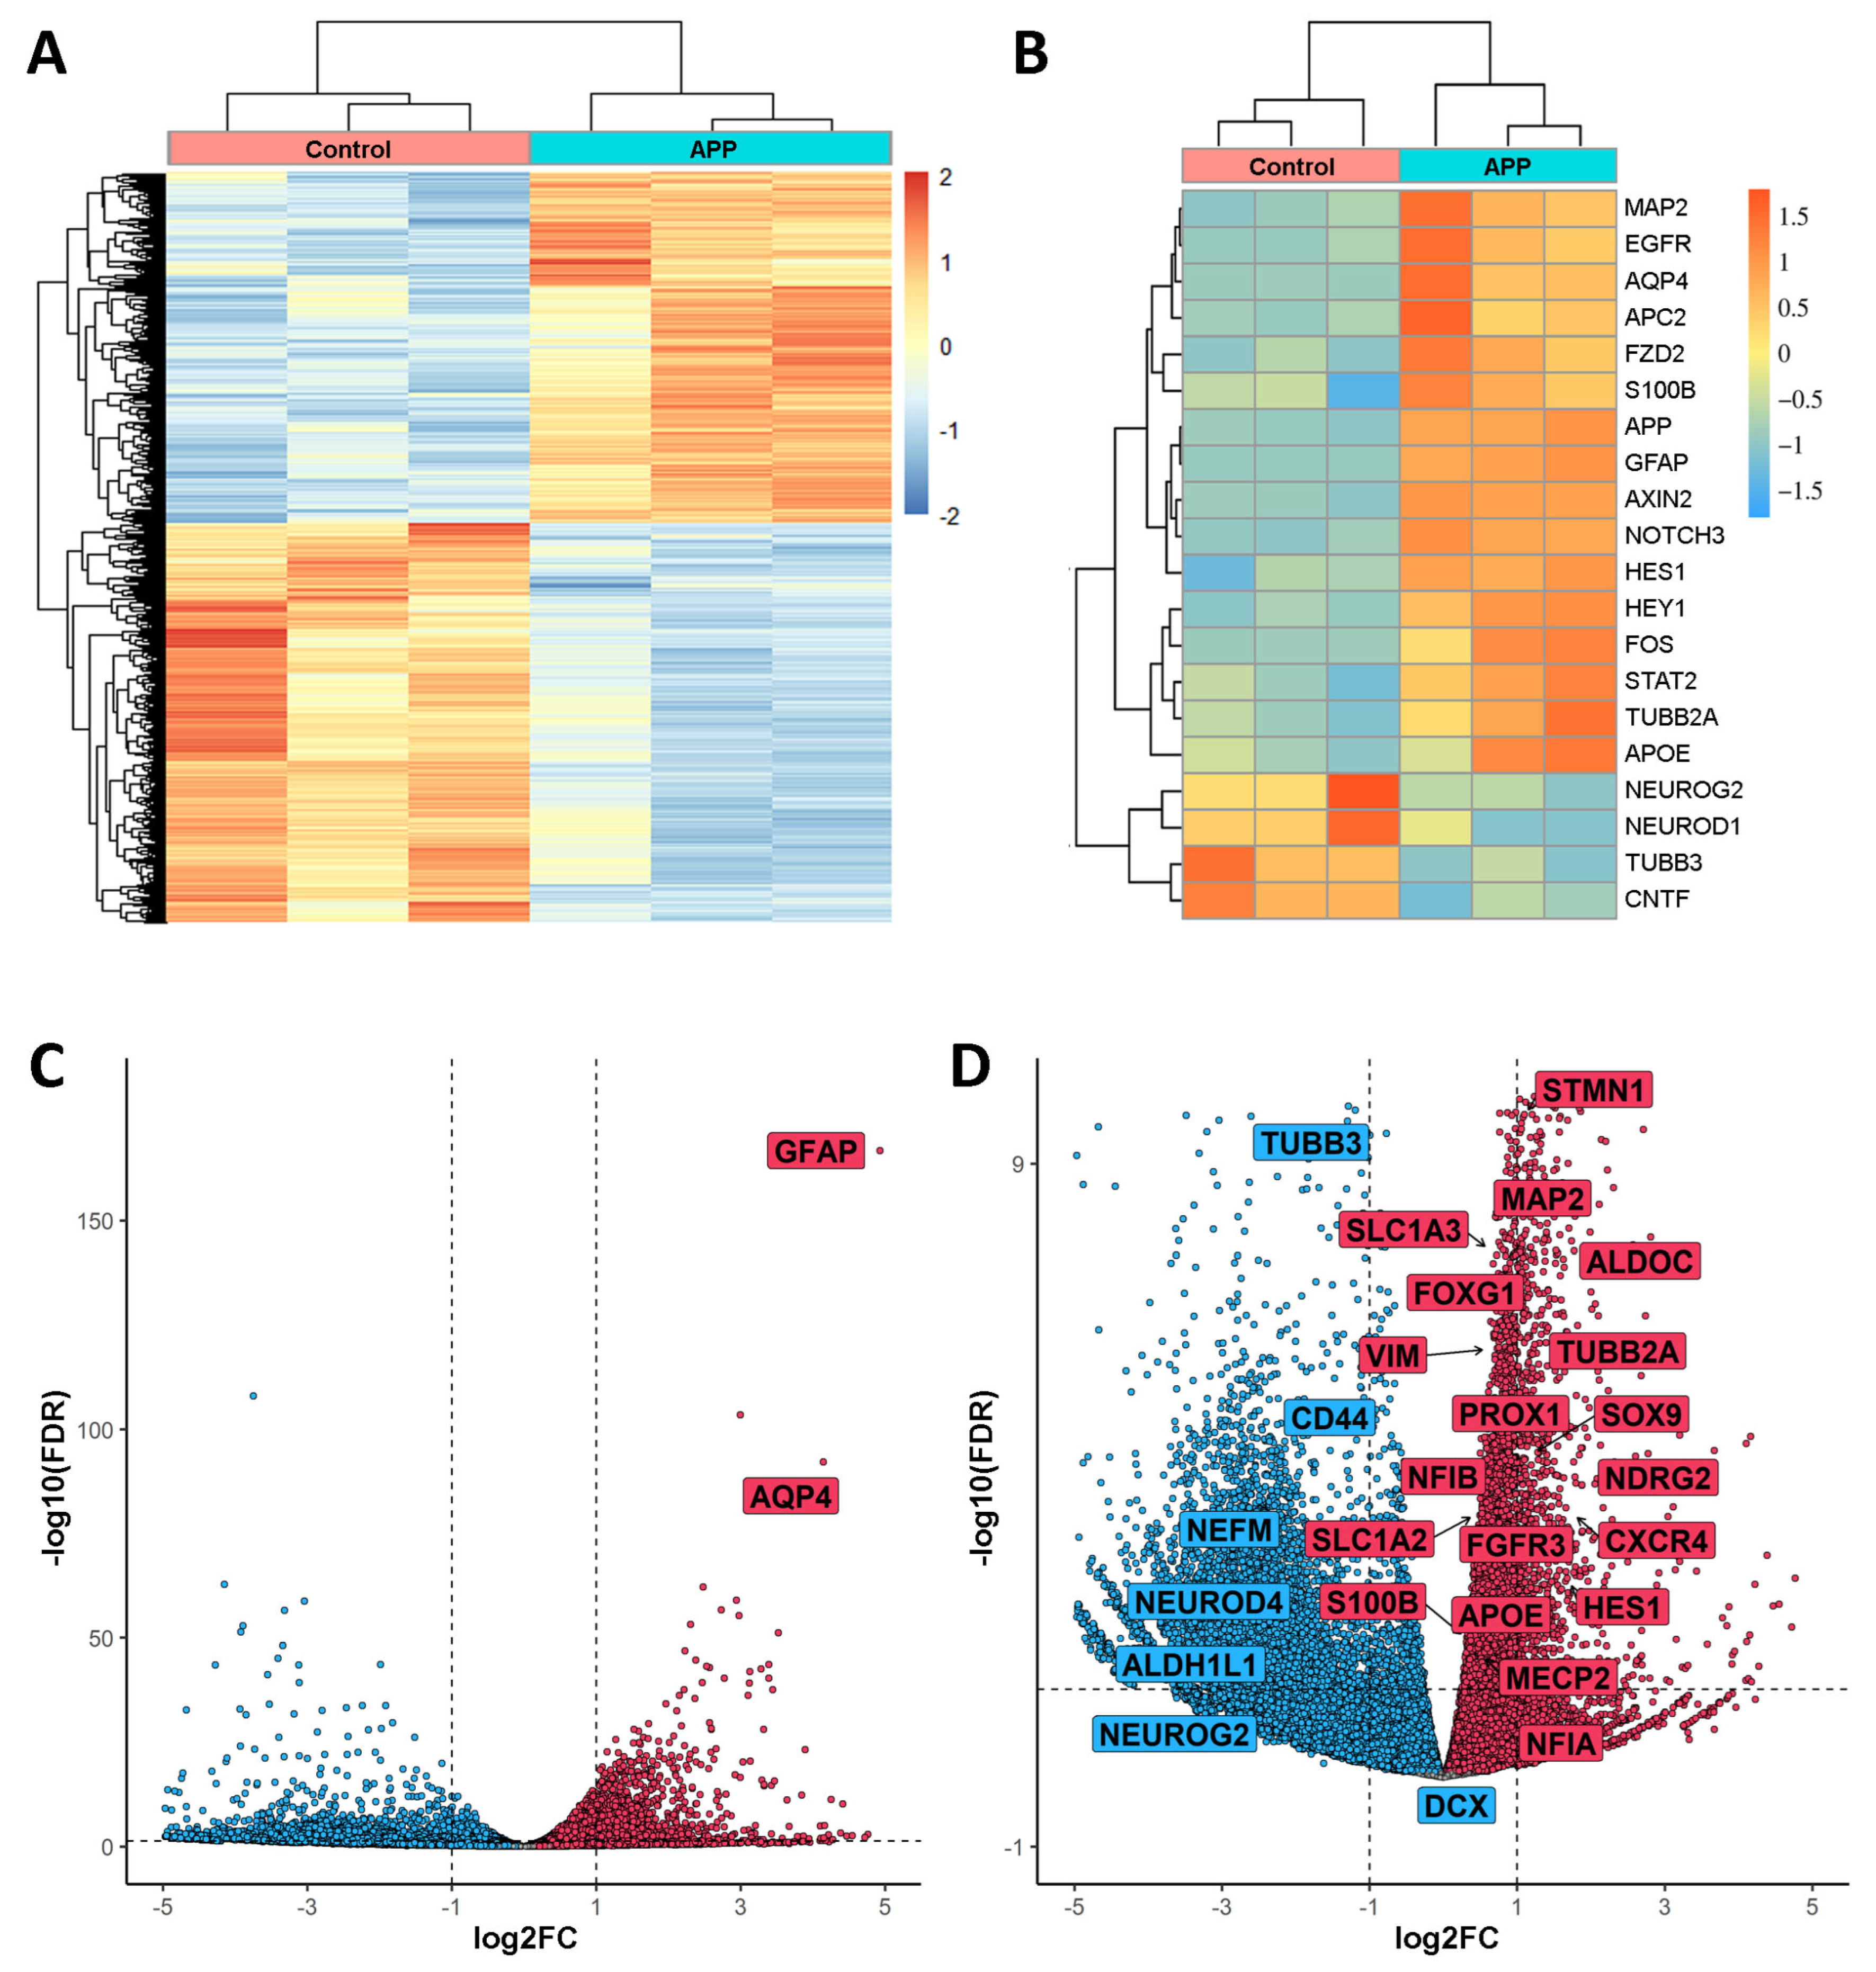
2.1. Transcriptome Analysis Reveals Gene Expression Differences in hNS1 Cells Due to APP Overexpression
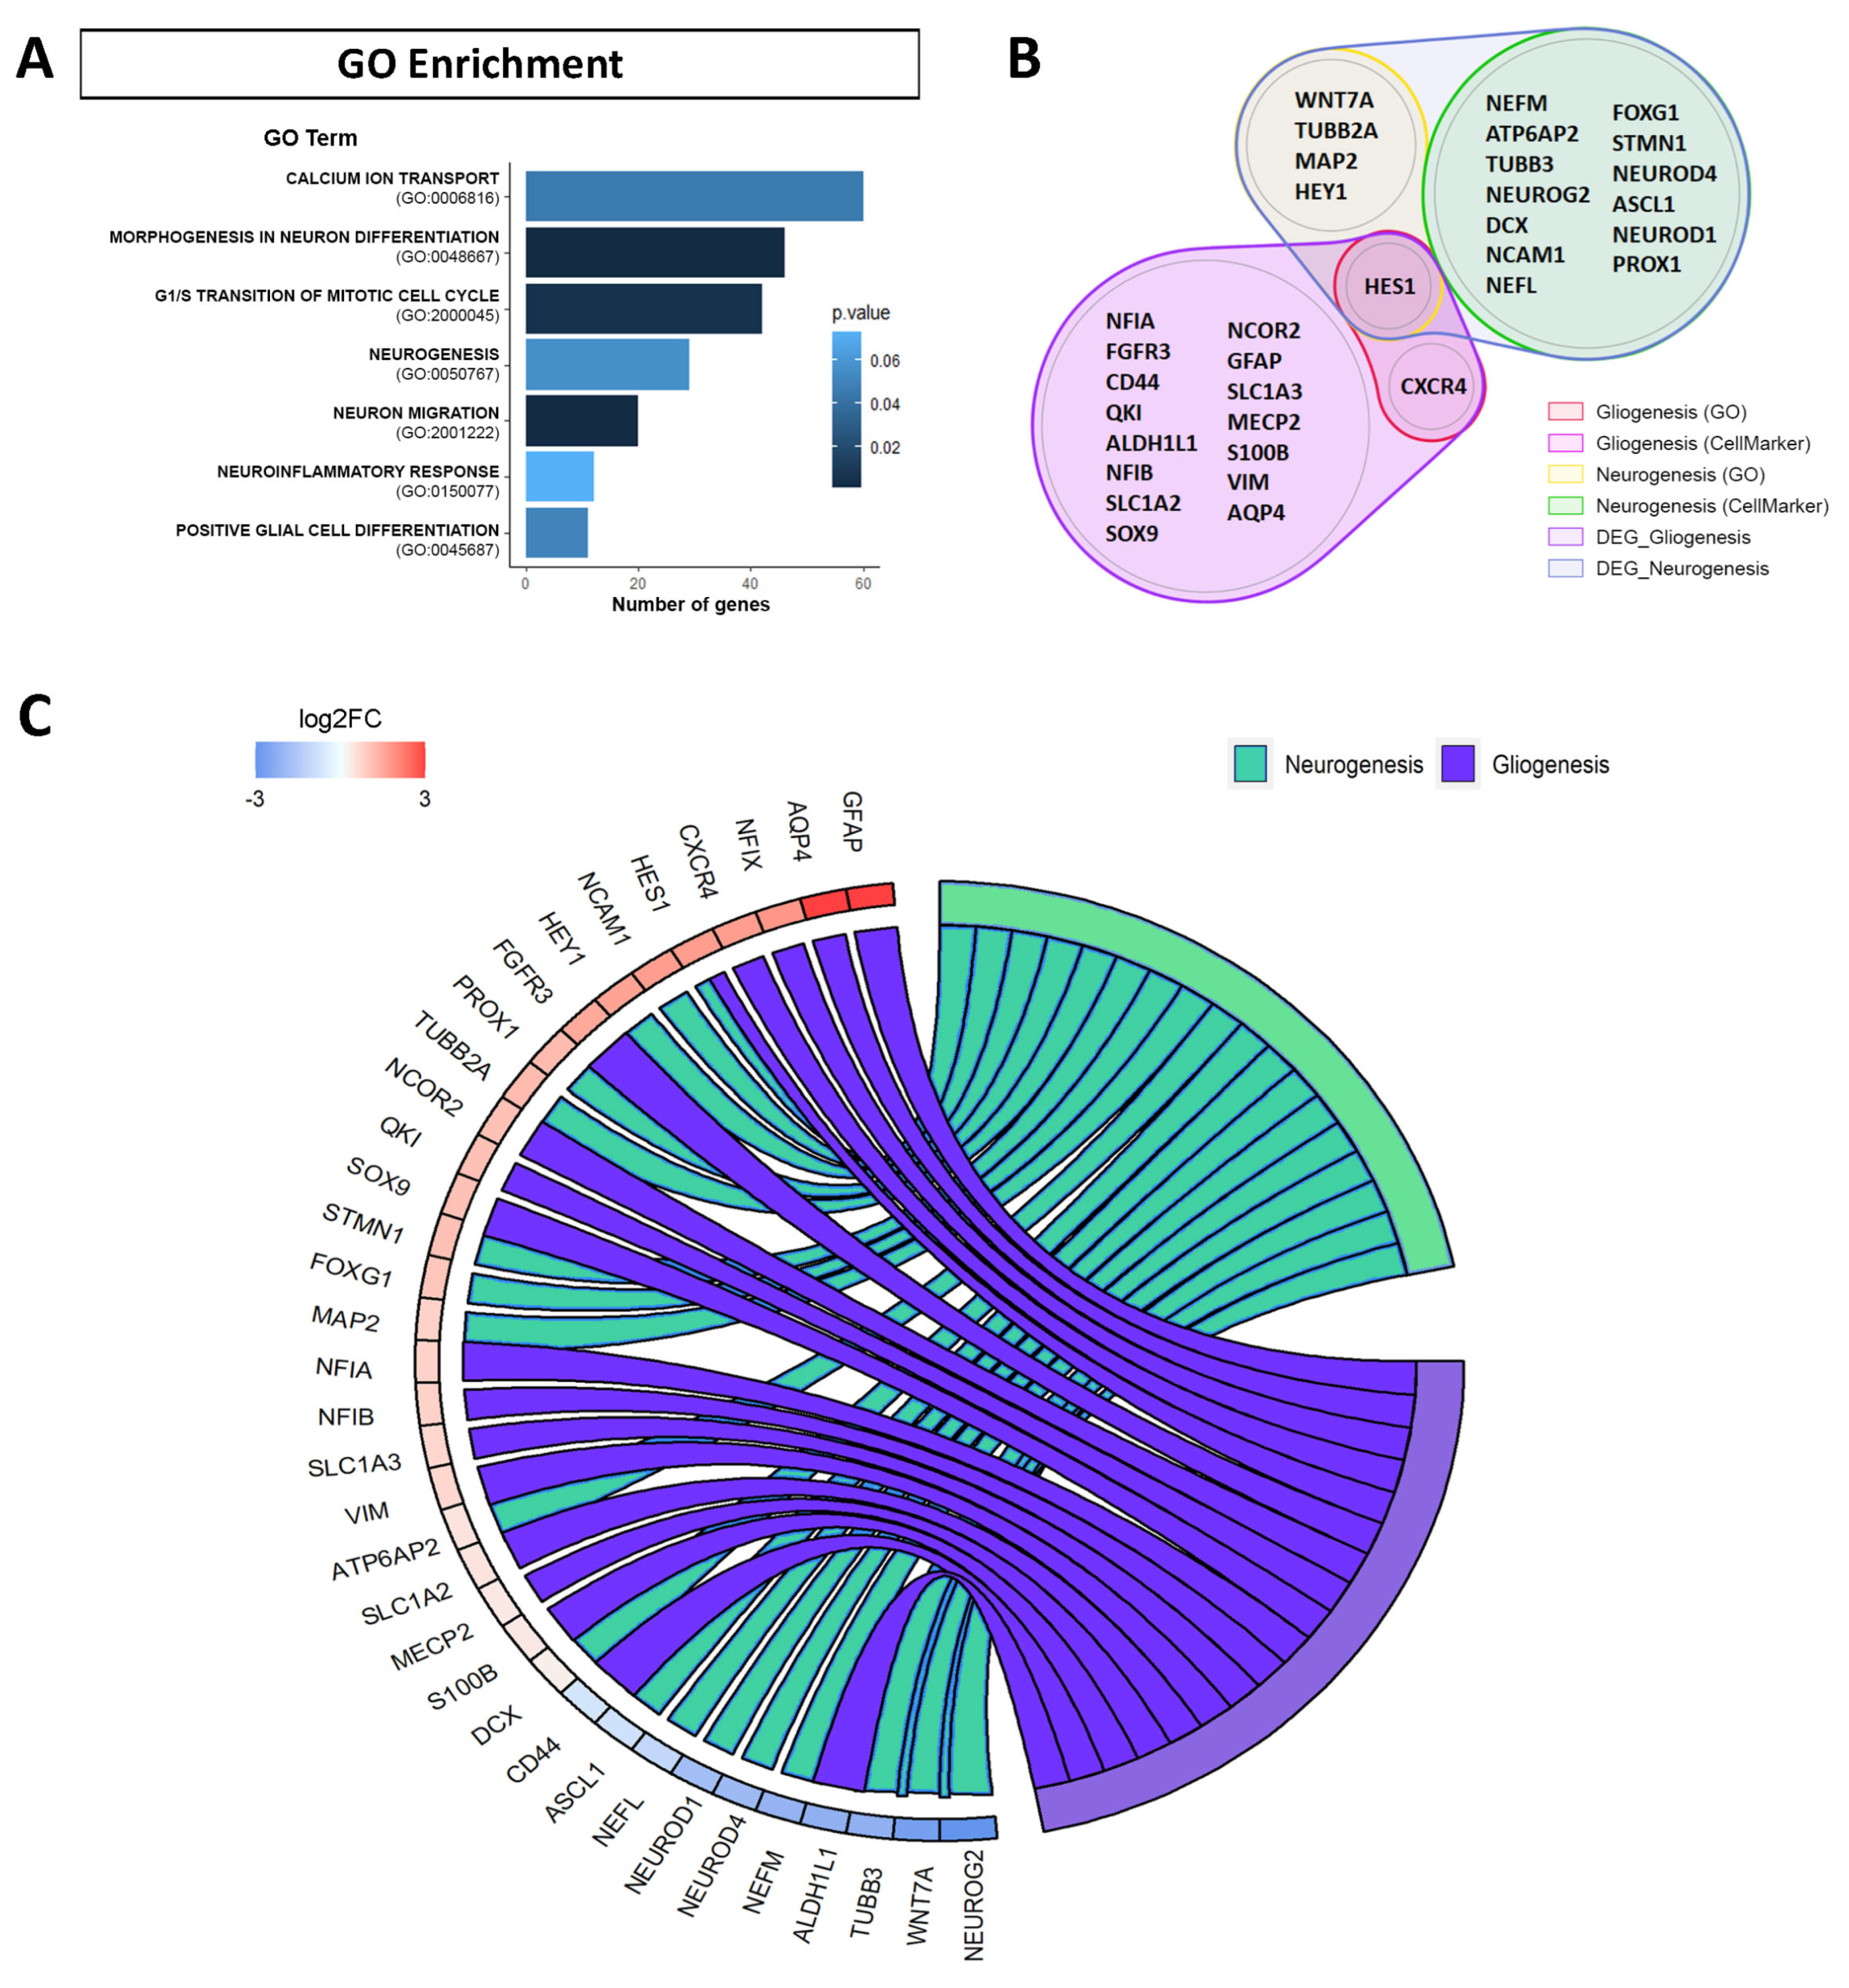
2.2. Functional Analysis of Differentially Expressed Genes (DEGs) in hNS1 Cells with APP Overexpression Shows Genes Involved in Neurogenesis and Gliogenesis
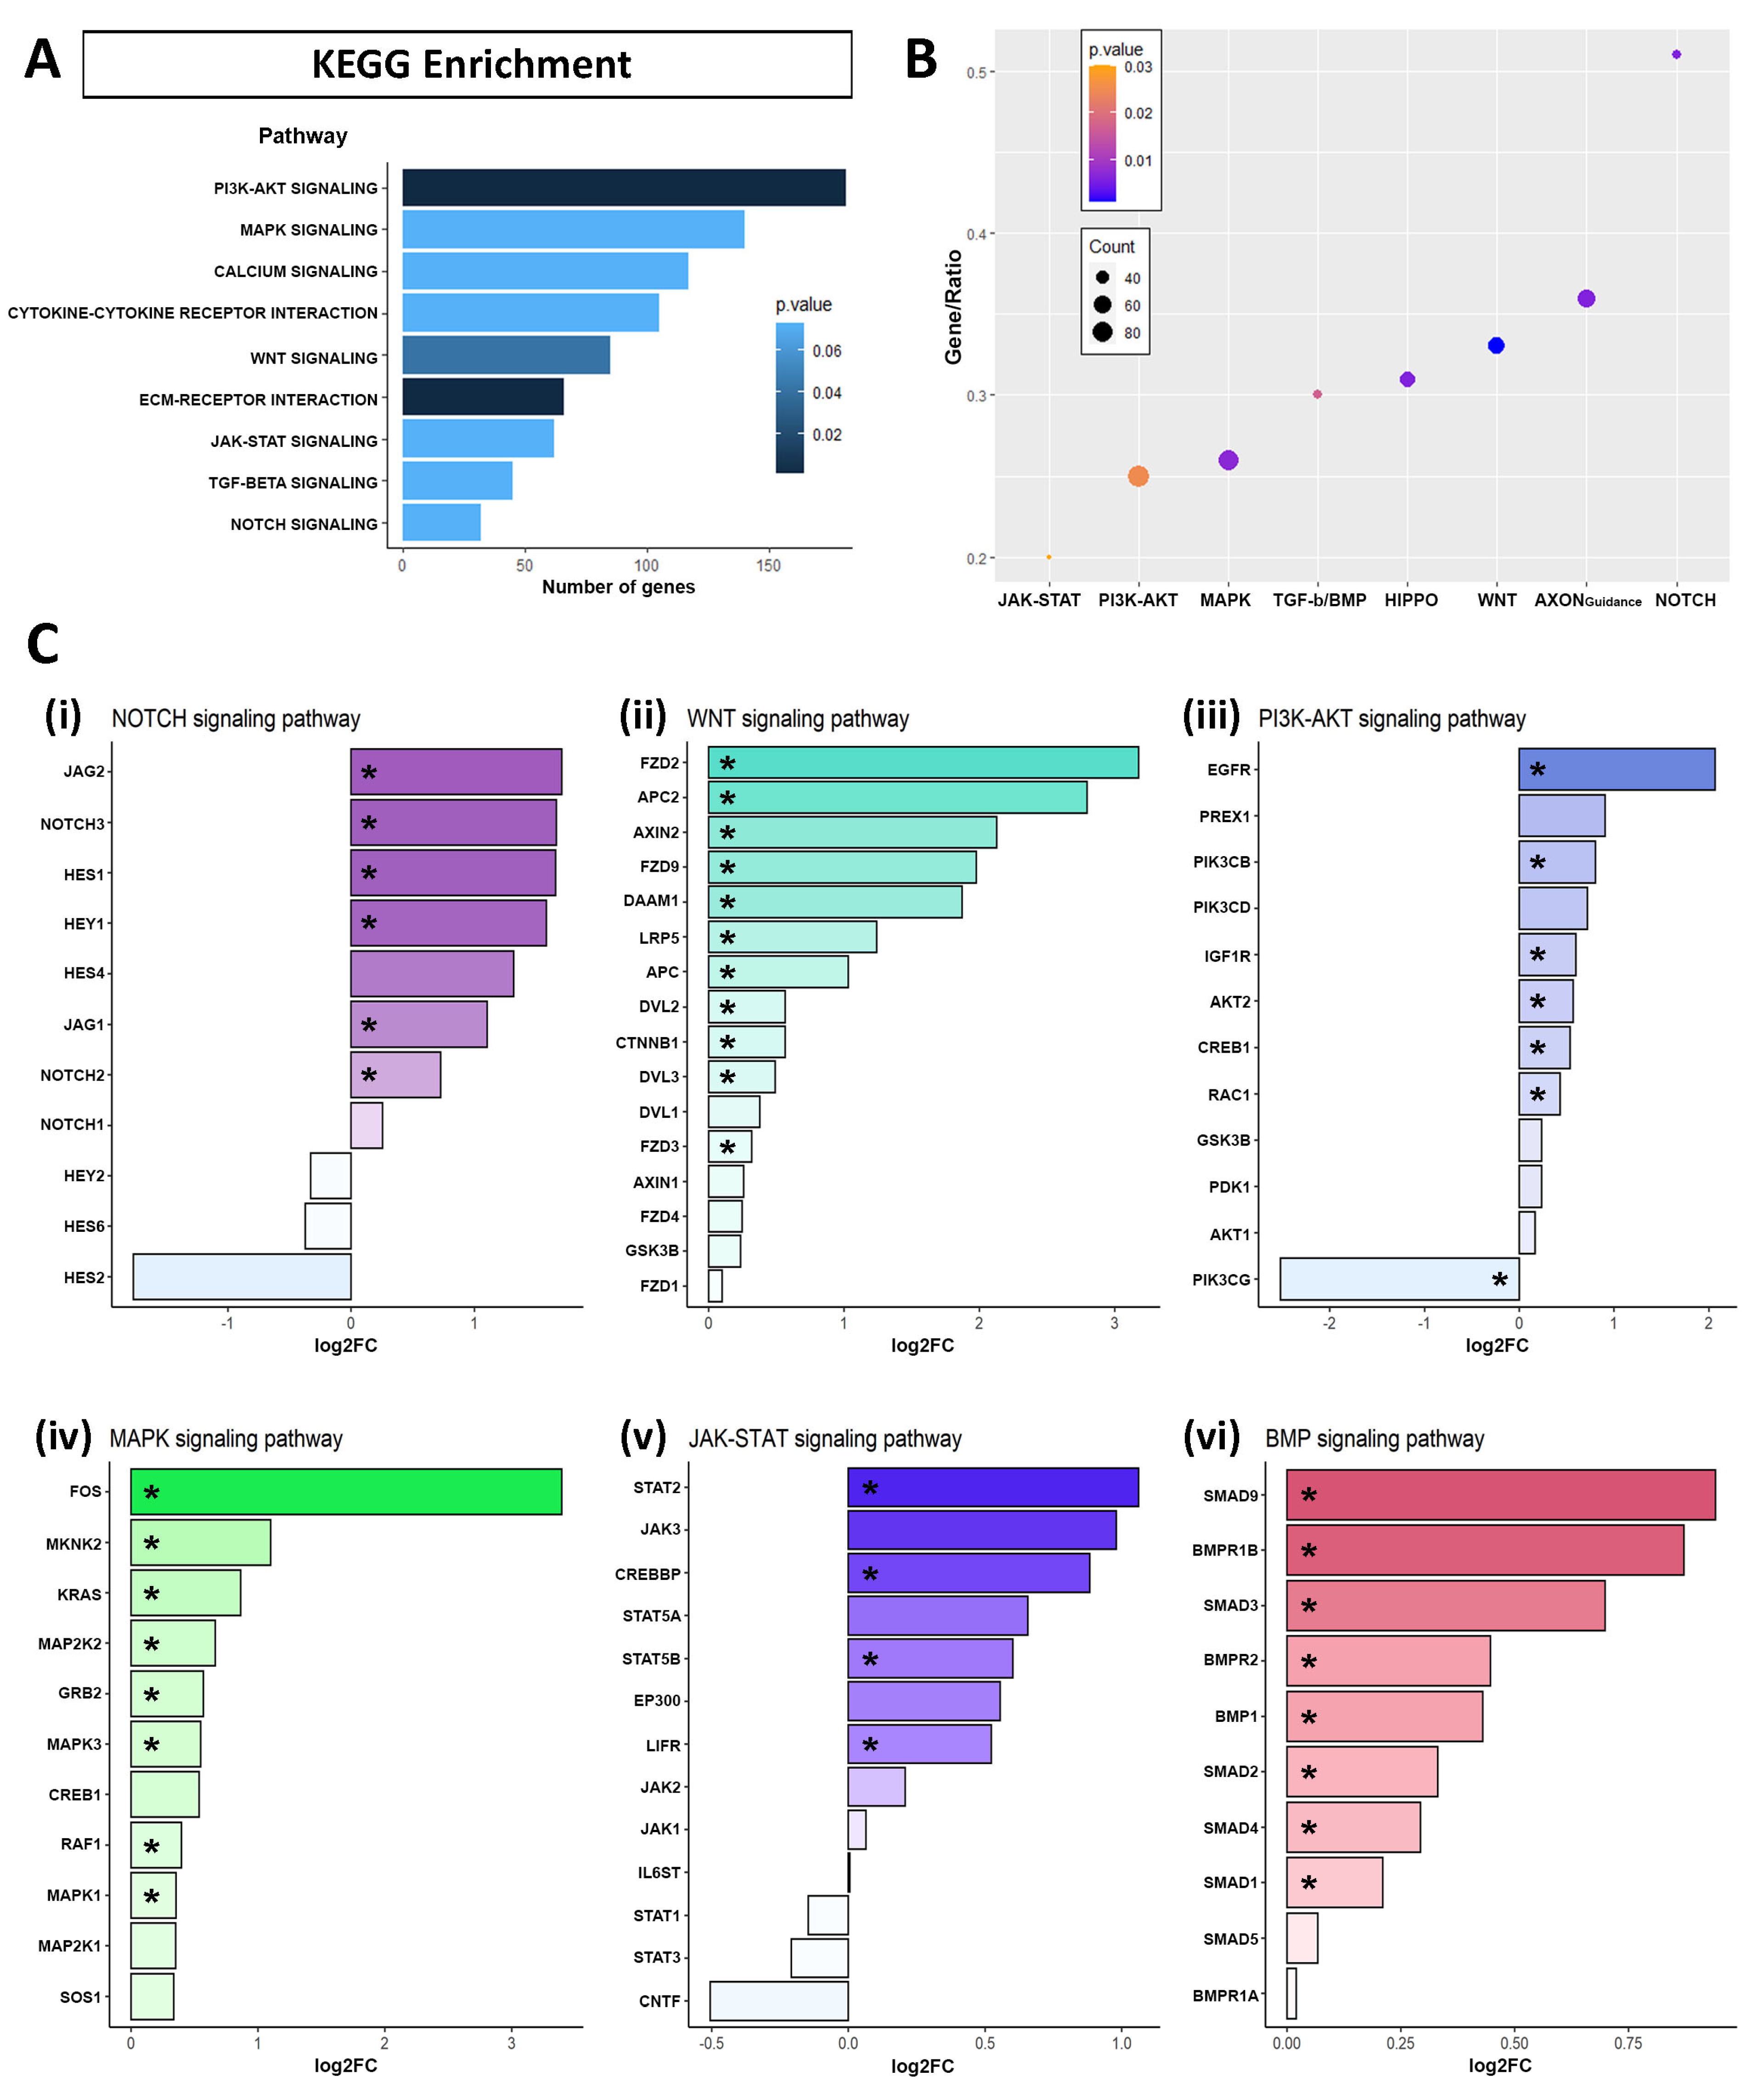
2.3. Identification of Signaling Pathway Altered by APP Overexpression in hNS1 Cells
2.4. Validation of Transcriptomic Results by Computational and Experimental Analysis
3. Discussion
4. Materials and Methods
4.1. Ethics Statement
4.2. Cell Culture and APP Overexpression
4.3. RNA Isolation
4.4. Library Preparation and Transcriptomic Sequencing
4.5. Quality Control, Sequence Reads Alignment, and Analysis of Differentially Expressed Genes
4.6. Functional Annotation and Enrichment of the DEGs
4.7. Quantitative Real-Time PCR
4.8. Immunocytochemistry
4.9. Western Blot
4.10. Statistical Analysis
Supplementary Materials
Author Contributions
Funding
Institutional Review Board Statement
Informed Consent Statement
Data Availability Statement
Acknowledgments
Conflicts of Interest
References
- Lee, N.; Chien, Y.; Hwu, W. A review of biomarkers for Alzheimer’s disease in Down syndrome. Neurol. Ther. 2017, 6, 69–81. [Google Scholar] [CrossRef]
- Nicolas, M.; Hassan, B.A. Amyloid precursor protein and neural development. Development 2014, 141, 2543–2548. [Google Scholar] [CrossRef]
- Gouras, G.K.; Olsson, T.T.; Hansson, O. β-amyloid peptides and amyloid plaques in Alzheimer’s disease. Neurotherapeutics 2015, 12, 3–11. [Google Scholar] [CrossRef]
- Sosa, L.J.; Postma, N.L.; Estrada-Bernal, A.; Hanna, M.; Guo, R.; Busciglio, J.; Pfenninger, K.H. Dosage of amyloid precursor protein affects axonal contact guidance in Down syndrome. FASEB J. 2014, 28, 195–205. [Google Scholar] [CrossRef] [PubMed]
- Dawkins, E.; Small, D.H. Insights into the physiological function of the β-amyloid precursor protein: Beyond Alzheimer’s disease. J. Neurochem. 2014, 129, 756–769. [Google Scholar] [CrossRef] [PubMed]
- Cho, Y.; Bae, H.; Okun, E.; Arumugam, T.V.; Jo, D. Physiology and pharmacology of amyloid precursor protein. Pharmacol. Ther. 2022, 235, 108122. [Google Scholar] [CrossRef] [PubMed]
- van der Kant, R.; Goldstein, L.B. Cellular functions of the amyloid precursor protein from development to dementia. Dev. Cell 2015, 32, 502–515. [Google Scholar] [CrossRef] [PubMed]
- Sarasa, M.; Sorribas, V.; Terrado, J.; Climent, S.; Palacios, J.M.; Mengod, G. Alzheimer β-amyloid precursor proteins display specific patterns of expression during embryogenesis. Mech. Dev. 2000, 94, 233–236. [Google Scholar] [CrossRef]
- Zou, C.; Crux, S.; Marinesco, S.; Montagna, E.; Sgobio, C.; Shi, Y.; Shi, S.; Zhu, K.; Dorostkar, M.M.; Müller, U.C.; et al. Amyloid precursor protein maintains constitutive and adaptive plasticity of dendritic spines in adult brain by regulating D-serine homeostasis. EMBO J. 2016, 35, 2213–2222. [Google Scholar] [CrossRef]
- Banote, R.K.; Chebli, J.; Şatır, T.M.; Varshney, G.K.; Camacho, R.; Ledin, J.; Burgess, S.M.; Abramsson, A.; Zetterberg, H. Amyloid precursor protein-b facilitates cell adhesion during early development in zebrafish. Sci. Rep. 2020, 10, 10127. [Google Scholar] [CrossRef]
- Freude, K.K.; Penjwini, M.; Davis, J.L.; LaFerla, F.M.; Blurton-Jones, M. Soluble amyloid precursor protein induces rapid neural differentiation of human embryonic stem cells. J. Biol. Chem. 2011, 286, 24264–24274. [Google Scholar] [CrossRef] [PubMed]
- Hu, Y.; Hung, A.C.; Cui, H.; Dawkins, E.; Bolós, M.; Foa, L.; Young, K.M.; Small, D.H. Role of cystatin C in amyloid precursor protein-induced proliferation of neural stem/progenitor cells. J. Biol. Chem. 2013, 288, 18853–18862. [Google Scholar] [CrossRef]
- Tyan, S.; Shih, A.Y.; Walsh, J.J.; Maruyama, H.; Sarsoza, F.; Ku, L.; Eggert, S.; Hof, P.R.; Koo, E.H.; Dickstein, D.L. Amyloid precursor protein (APP) regulates synaptic structure and function. Mol. Cell Neurosci. 2012, 51, 43–52. [Google Scholar] [CrossRef] [PubMed]
- Luu, L.; Ciccotosto, G.D.; Cappai, R. The Alzheimer’s disease amyloid precursor protein and its neuritogenic actions. Curr. Alzheimer Res. 2021, 18, 772–786. [Google Scholar] [CrossRef] [PubMed]
- López-Toledano, M.A.; Shelanski, M.L. Increased neurogenesis in young transgenic mice overexpressing human APP (Sw, Ind). J. Alzheimers Dis. 2007, 12, 229–240. [Google Scholar] [CrossRef]
- Zhou, Z.; Chan, C.H.; Ma, Q.; Xu, X.; Xiao, Z.; Tan, E. The roles of amyloid precursor protein (APP) in neurogenesis. Cell Adh Migr. 2011, 5, 280–292. [Google Scholar] [CrossRef]
- Kwak, Y.; Hendrix, B.J.; Sugaya, K. Secreted type of amyloid precursor protein induces glial differentiation by stimulating the BMP/Smad signaling pathway. Biochem. Biophys. Res. Commun. 2014, 447, 394–399. [Google Scholar] [CrossRef]
- Young-Pearse, T.L.; Bai, J.; Chang, R.; Zheng, J.B.; LoTurco, J.J.; Selkoe, D.J. A critical function for beta-amyloid precursor protein in neuronal migration revealed by in utero RNA interference. J. Neurosci. 2007, 27, 14459–14469. [Google Scholar] [CrossRef]
- Shu, R.; Wong, W.; Ma, Q.H.; Yang, Z.Z.; Zhu, H.; Liu, F.J.; Wang, P.; Ma, J.; Yan, S.; Polo, J.M.; et al. APP intracellular domain acts as a transcriptional regulator of miR-663 suppressing neuronal differentiation. Cell Death Dis. 2015, 6, e1651. [Google Scholar] [CrossRef]
- Deyts, C.; Thinakaran, G.; Parent, A.T. APP receptor? To be or not to be. Trends Pharmacol. Sci. 2016, 37, 390–411. [Google Scholar] [CrossRef]
- Sosa, L.J.; Cáceres, A.; Dupraz, S.; Oksdath, M.; Quiroga, S.; Lorenzo, A. The physiological role of the amyloid precursor protein as an adhesion molecule in the developing nervous system. J. Neurochem. 2017, 143, 11–29. [Google Scholar] [CrossRef] [PubMed]
- Liu, T.; Zhang, T.; Nicolas, M.; Boussicault, L.; Rice, H.; Soldano, A.; Claeys, A.; Petrova, I.; Fradkin, L.; De Strooper, B.; et al. The amyloid precursor protein is a conserved Wnt receptor. Elife 2021, 10, e69199. [Google Scholar] [CrossRef]
- Nhan, H.S.; Chiang, K.; Koo, E.H. The multifaceted nature of amyloid precursor protein and its proteolytic fragments: Friends and foes. Acta Neuropathol. 2015, 129, 1–19. [Google Scholar] [CrossRef] [PubMed]
- Müller, U.C.; Deller, T.; Korte, M. Not just amyloid: Physiological functions of the amyloid precursor protein family. Nat. Rev. Neurosci. 2017, 18, 281–298. [Google Scholar] [CrossRef] [PubMed]
- Caillé, I.; Allinquant, B.; Dupont, E.; Bouillot, C.; Langer, A.; Müller, U.; Prochiantz, A. Soluble form of amyloid precursor protein regulates proliferation of progenitors in the adult subventricular zone. Development 2004, 131, 2173–2181. [Google Scholar] [CrossRef] [PubMed]
- Ma, Q.; Futagawa, T.; Yang, W.; Jiang, X.; Zeng, L.; Takeda, Y.; Xu, R.; Bagnard, D.; Schachner, M.; Furley, A.J.; et al. A TAG1-APP signalling pathway through Fe65 negatively modulates neurogenesis. Nat. Cell Biol. 2008, 10, 283–294. [Google Scholar] [CrossRef]
- Porayette, P.; Gallego, M.J.; Kaltcheva, M.M.; Bowen, R.L.; Vadakkadath Meethal, S.; Atwood, C.S. Differential processing of amyloid-β precursor protein directs human embryonic stem cell proliferation and differentiation into neuronal precursor cells. J. Biol. Chem. 2009, 284, 23806–23817. [Google Scholar] [CrossRef]
- Bernabeu-Zornoza, A.; Coronel, R.; Palmer, C.; Calero, M.; Martínez-Serrano, A.; Cano, E.; Zambrano, A.; Liste, I. Aβ42 peptide promotes proliferation and gliogenesis in human neural stem cells. Mol. Neurobiol. 2019, 56, 4023–4036. [Google Scholar] [CrossRef]
- Bernabeu-Zornoza, A.; Coronel, R.; Palmer, C.; Martín, A.; López-Alonso, V.; Liste, I. Neurogenesis is increased in human neural stem cells by Aβ40 peptide. Int. J. Mol. Sci. 2022, 23, 5820. [Google Scholar] [CrossRef]
- Kent, S.A.; Spires-Jones, T.L.; Durrant, C.S. The physiological roles of tau and Aβ: Implications for Alzheimer’s disease pathology and therapeutics. Acta Neuropathol. 2020, 140, 417–447. [Google Scholar] [CrossRef]
- Cai, W.; Li, L.; Sang, S.; Pan, X.; Zhong, C. Physiological roles of β-amyloid in regulating synaptic function: Implications for AD pathophysiology. Neurosci. Bull. 2022, 39, 1289–1308. [Google Scholar] [CrossRef]
- Coronel, R.; Lachgar, M.; Bernabeu-Zornoza, A.; Palmer, C.; Domínguez-Alvaro, M.; Revilla, A.; Ocaña, I.; Fernández, A.; Martínez-Serrano, A.; Cano, E.; et al. Neuronal and glial differentiation of human neural stem cells is regulated by amyloid precursor protein (APP) levels. Mol. Neurobiol. 2019, 56, 1248–1261. [Google Scholar] [CrossRef] [PubMed]
- Villa, A.; Snyder, E.Y.; Vescovi, A.; Martínez-Serrano, A. Establishment and properties of a growth factor-dependent, perpetual neural stem cell line from the human CNS. Exp. Neurol. 2000, 161, 67–84. [Google Scholar] [CrossRef] [PubMed]
- Villa, A.; Navarro-Galve, B.; Bueno, C.; Franco, S.; Blasco, M.A.; Martinez-Serrano, A. Long-term molecular and cellular stability of human neural stem cell lines. Exp. Cell Res. 2004, 294, 559–570. [Google Scholar] [CrossRef] [PubMed]
- Irvin, D.K.; Dhaka, A.; Hicks, C.; Weinmaster, G.; Kornblum, H.I. Extrinsic and intrinsic factors governing cell fate in cortical progenitor cultures. Dev. Neurosci. 2003, 25, 162–172. [Google Scholar] [CrossRef]
- Finkel, Z.; Esteban, F.; Rodriguez, B.; Fu, T.; Ai, X.; Cai, L. Diversity of adult neural stem and progenitor cells in physiology and disease. Cells 2021, 10, 2045. [Google Scholar] [CrossRef]
- Matsubara, S.; Matsuda, T.; Nakashima, K. Regulation of adult mammalian neural stem cells and neurogenesis by cell extrinsic and intrinsic factors. Cells 2021, 10, 1145. [Google Scholar] [CrossRef]
- Ohline, S.M.; Chan, C.; Schoderboeck, L.; Wicky, H.E.; Tate, W.P.; Hughes, S.M.; Abraham, W.C. Effect of soluble amyloid precursor protein-alpha on adult hippocampal neurogenesis in a mouse model of Alzheimer’s disease. Mol. Brain 2022, 15, 5. [Google Scholar] [CrossRef]
- Oh, S.Y.; Ellenstein, A.; Chen, C.; Hinman, J.D.; Berg, E.A.; Costello, C.E.; Yamin, R.; Neve, R.L.; Abraham, C.R. Amyloid precursor protein interacts with notch receptors. J. Neurosci. Res. 2005, 82, 32–42. [Google Scholar] [CrossRef]
- Jimenez, S.; Torres, M.; Vizuete, M.; Sanchez-Varo, R.; Sanchez-Mejias, E.; Trujillo-Estrada, L.; Carmona-Cuenca, I.; Caballero, C.; Ruano, D.; Gutierrez, A.; et al. Age-dependent accumulation of soluble amyloid beta (Aβ) oligomers reverses the neuroprotective effect of soluble amyloid precursor protein-alpha (sAPPα) by modulating phosphatidylinositol 3-kinase (PI3K)/Akt-GSK-3beta pathway in Alzheimer mouse model. J. Biol. Chem. 2011, 286, 18414–18425. [Google Scholar] [CrossRef]
- Pfundstein, G.; Nikonenko, A.G.; Sytnyk, V. Amyloid precursor protein (APP) and amyloid β (Aβ) interact with cell adhesion molecules: Implications in Alzheimer’s disease and normal physiology. Front. Cell Dev. Biol. 2022, 10, 969547. [Google Scholar] [CrossRef] [PubMed]
- Hervas, R.; Rau, M.J.; Park, Y.; Zhang, W.; Murzin, A.G.; Fitzpatrick, J.A.J.; Scheres, S.H.W.; Si, K. Cryo-EM structure of a neuronal functional amyloid implicated in memory persistence in Drosophila. Science 2020, 367, 1230–1234. [Google Scholar] [CrossRef] [PubMed]
- Garcia-Pardo, J.; Bartolomé-Nafría, A.; Chaves-Sanjuan, A.; Gil-Garcia, M.; Visentin, C.; Bolognesi, M.; Ricagno, S.; Ventura, S. Cryo-EM structure of hnRNPDL-2 fibrils, a functional amyloid associated with limb-girdle muscular dystrophy D3. Nat. Commun. 2023, 14, 239. [Google Scholar] [CrossRef]
- Bernabeu-Zornoza, A.; Coronel, R.; Palmer, C.; López-Alonso, V.; Liste, I. Oligomeric and fibrillar species of Aβ42 diversely affect human neural stem cells. Int. J. Mol. Sci. 2021, 22, 9537. [Google Scholar] [CrossRef]
- Grandbarbe, L.; Bouissac, J.; Rand, M.; Hrabé de Angelis, M.; Artavanis-Tsakonas, S.; Mohier, E. Delta-Notch signaling controls the generation of neurons/glia from neural stem cells in a stepwise process. Development 2003, 130, 1391–1402. [Google Scholar] [CrossRef] [PubMed]
- Austin, S.H.L.; Gabarró-Solanas, R.; Rigo, P.; Paun, O.; Harris, L.; Guillemot, F.; Urbán, N. Wnt/beta-catenin signalling is dispensable for adult neural stem cell homeostasis and activation. Development 2021, 148, dev199629. [Google Scholar] [CrossRef] [PubMed]
- Yu, J.S.L.; Cui, W. Proliferation, survival and metabolism: The role of PI3K/AKT/mTOR signalling in pluripotency and cell fate determination. Development 2016, 143, 3050–3060. [Google Scholar] [CrossRef]
- Kong, X.; Gong, Z.; Zhang, L.; Sun, X.; Ou, Z.; Xu, B.; Huang, J.; Long, D.; He, X.; Lin, X.; et al. JAK2/STAT3 signaling mediates IL-6-inhibited neurogenesis of neural stem cells through DNA demethylation/methylation. Brain Behav. Immun. 2019, 79, 159–173. [Google Scholar] [CrossRef]
- Bond, A.M.; Bhalala, O.G.; Kessler, J.A. The dynamic role of bone morphogenetic proteins in neural stem cell fate and maturation. Dev. Neurobiol. 2012, 72, 1068–1084. [Google Scholar] [CrossRef]
- Kwak, Y.; Marutle, A.; Dantuma, E.; Merchant, S.; Bushnev, S.; Sugaya, K. Involvement of notch signaling pathway in amyloid precursor protein induced glial differentiation. Eur. J. Pharmacol. 2011, 650, 18–27. [Google Scholar] [CrossRef]
- Kwak, Y.; Dantuma, E.; Merchant, S.; Bushnev, S.; Sugaya, K. Amyloid-β precursor protein induces glial differentiation of neural progenitor cells by activation of the IL-6/gp130 signaling pathway. Neurotox. Res. 2010, 18, 328–338. [Google Scholar] [CrossRef] [PubMed]
- Zhou, Z.; Kumari, U.; Xiao, Z.; Tan, E. Notch as a molecular switch in neural stem cells. IUBMB Life 2010, 62, 618–623. [Google Scholar] [CrossRef] [PubMed]
- Lütolf, S.; Radtke, F.; Aguet, M.; Suter, U.; Taylor, V. Notch1 is required for neuronal and glial differentiation in the cerebellum. Development 2002, 129, 373–385. [Google Scholar] [CrossRef]
- Konietzko, U.; Goodger, Z.V.; Meyer, M.; Kohli, B.M.; Bosset, J.; Lahiri, D.K.; Nitsch, R.M. Co-localization of the amyloid precursor protein and Notch intracellular domains in nuclear transcription factories. Neurobiol. Aging 2010, 31, 58–73. [Google Scholar] [CrossRef] [PubMed]
- Kriska, J.; Janeckova, L.; Kirdajova, D.; Honsa, P.; Knotek, T.; Dzamba, D.; Kolenicova, D.; Butenko, O.; Vojtechova, M.; Capek, M.; et al. Wnt/β-Catenin signaling promotes differentiation of ischemia-activated adult neural stem/progenitor cells to neuronal precursors. Front. Neurosci. 2021, 15, 628983. [Google Scholar] [CrossRef] [PubMed]
- Elliott, C.; Rojo, A.I.; Ribe, E.; Broadstock, M.; Xia, W.; Morin, P.; Semenov, M.; Baillie, G.; Cuadrado, A.; Al-Shawi, R.; et al. A role for APP in Wnt signalling links synapse loss with β-amyloid production. Transl. Psychiatry 2018, 8, 179. [Google Scholar] [CrossRef]
- Zhou, F.; Gong, K.; Song, B.; Ma, T.; van Laar, T.; Gong, Y.; Zhang, L. The APP intracellular domain (AICD) inhibits Wnt signalling and promotes neurite outgrowth. Biochim. Biophys. Acta 2012, 1823, 1233–1241. [Google Scholar] [CrossRef]
- Zhang, N.; Parr, C.J.C.; Birch, A.M.; Goldfinger, M.H.; Sastre, M. The amyloid precursor protein binds to β-catenin and modulates its cellular distribution. Neurosci. Lett. 2018, 685, 190–195. [Google Scholar] [CrossRef]
- Brown, J.; Pirrung, M.; McCue, L.A. FQC Dashboard: Integrates FastQC results into a web-based, interactive, and extensible FASTQ quality control tool. Bioinformatics 2017, 33, 3137–3139. [Google Scholar] [CrossRef]
- Bolger, A.M.; Lohse, M.; Usadel, B. Trimmomatic: A flexible trimmer for Illumina sequence data. Bioinformatics 2014, 30, 2114–2120. [Google Scholar] [CrossRef]
- Dobin, A.; Gingeras, T.R. Mapping RNA-seq reads with STAR. Curr. Protoc. Bioinform. 2015, 51, 11.14.1–11.14.19. [Google Scholar] [CrossRef]
- Anders, S.; Pyl, P.T.; Huber, W. HTSeq–a Python framework to work with high-throughput sequencing data. Bioinformatics 2015, 31, 166–169. [Google Scholar] [CrossRef] [PubMed]
- Love, M.I.; Huber, W.; Anders, S. Moderated estimation of fold change and dispersion for RNA-seq data with DESeq2. Genome Biol. 2014, 15, 550. [Google Scholar] [CrossRef] [PubMed]
- Xie, Z.; Bailey, A.; Kuleshov, M.V.; Clarke, D.J.B.; Evangelista, J.E.; Jenkins, S.L.; Lachmann, A.; Wojciechowicz, M.L.; Kropiwnicki, E.; Jagodnik, K.M.; et al. Gene set knowledge discovery with Enrichr. Curr. Protoc. 2021, 1, e90. [Google Scholar] [CrossRef] [PubMed]
- The Gene Ontology, C.; That, I.; Acencio, M.L.; Lægreid, A.; Kuiper, M.; Among, O. The Gene Ontology Resource: 20 years and still GOing strong. Nucleic Acids Res. 2019, 47, D330–D338. [Google Scholar] [CrossRef]
- Kanehisa, M.; Goto, S.; Sato, Y.; Furumichi, M.; Tanabe, M. KEGG for integration and interpretation of large-scale molecular data sets. Nucleic Acids Res. 2012, 40, D109–D114. [Google Scholar] [CrossRef]
- Zhang, X.; Lan, Y.; Xu, J.; Quan, F.; Zhao, E.; Deng, C.; Luo, T.; Xu, L.; Liao, G.; Yan, M.; et al. CellMarker: A manually curated resource of cell markers in human and mouse. Nucleic Acids Res. 2019, 47, D721–D728. [Google Scholar] [CrossRef]
- Franzén, O.; Gan, L.; Björkegren, J.L.M. PanglaoDB: A web server for exploration of mouse and human single-cell RNA sequencing data. Database 2019, 2019, baz046. [Google Scholar] [CrossRef]
- Szklarczyk, D.; Gable, A.L.; Nastou, K.C.; Lyon, D.; Kirsch, R.; Pyysalo, S.; Doncheva, N.T.; Legeay, M.; Fang, T.; Bork, P.; et al. The STRING database in 2021: Customizable protein–protein networks, and functional characterization of user-uploaded gene/measurement sets. Nucleic Acids Res 2021, 49, D605–D612. [Google Scholar] [CrossRef]


Disclaimer/Publisher’s Note: The statements, opinions and data contained in all publications are solely those of the individual author(s) and contributor(s) and not of MDPI and/or the editor(s). MDPI and/or the editor(s) disclaim responsibility for any injury to people or property resulting from any ideas, methods, instructions or products referred to in the content. |
© 2023 by the authors. Licensee MDPI, Basel, Switzerland. This article is an open access article distributed under the terms and conditions of the Creative Commons Attribution (CC BY) license (https://creativecommons.org/licenses/by/4.0/).
Share and Cite
Coronel, R.; Bernabeu-Zornoza, A.; Palmer, C.; González-Sastre, R.; Rosca, A.; Mateos-Martínez, P.; López-Alonso, V.; Liste, I. Amyloid Precursor Protein (APP) Regulates Gliogenesis and Neurogenesis of Human Neural Stem Cells by Several Signaling Pathways. Int. J. Mol. Sci. 2023, 24, 12964. https://doi.org/10.3390/ijms241612964
Coronel R, Bernabeu-Zornoza A, Palmer C, González-Sastre R, Rosca A, Mateos-Martínez P, López-Alonso V, Liste I. Amyloid Precursor Protein (APP) Regulates Gliogenesis and Neurogenesis of Human Neural Stem Cells by Several Signaling Pathways. International Journal of Molecular Sciences. 2023; 24(16):12964. https://doi.org/10.3390/ijms241612964
Chicago/Turabian StyleCoronel, Raquel, Adela Bernabeu-Zornoza, Charlotte Palmer, Rosa González-Sastre, Andreea Rosca, Patricia Mateos-Martínez, Victoria López-Alonso, and Isabel Liste. 2023. "Amyloid Precursor Protein (APP) Regulates Gliogenesis and Neurogenesis of Human Neural Stem Cells by Several Signaling Pathways" International Journal of Molecular Sciences 24, no. 16: 12964. https://doi.org/10.3390/ijms241612964
APA StyleCoronel, R., Bernabeu-Zornoza, A., Palmer, C., González-Sastre, R., Rosca, A., Mateos-Martínez, P., López-Alonso, V., & Liste, I. (2023). Amyloid Precursor Protein (APP) Regulates Gliogenesis and Neurogenesis of Human Neural Stem Cells by Several Signaling Pathways. International Journal of Molecular Sciences, 24(16), 12964. https://doi.org/10.3390/ijms241612964