Article

Low Molecular Weight and High Deacetylation Degree Chitosan Batch Alleviates Pathogenesis, Toxin Accumulation, and Fusarium Gene Regulation in Barley Leaf Pathosystem

1
Plant Breeding and Acclimatization Institute—National Research Institute, Radzikow, 05-870 Blonie, Poland
2
Professor Waclaw Dabrowski Institute of Agricultural and Food Biotechnology—State Research Institute, Rakowiecka 36, 02-532 Warsaw, Poland
*
Author to whom correspondence should be addressed.
Int. J. Mol. Sci. 2023, 24(16), 12894; https://doi.org/10.3390/ijms241612894
Submission received: 11 July 2023 / Revised: 7 August 2023 / Accepted: 13 August 2023 / Published: 17 August 2023
(This article belongs to the Special Issue Bioactive Materials with Antimicrobial Properties)

Abstract

:
Fusarium graminearum is a cosmopolitan fungal pathogen that destroys cereal production, in terms of loss of yield and grain contamination with mycotoxins, worldwide. Chitosan is a natural biopolymer abundant in the environment with proven antifungal properties that also acts as a plant immunity elicitor. Despite a number of articles, there is a lack of systematic comparison of antifungal activity of diverse batches of chitosan. The current study aimed to test the inhibitory effects of a collection of diverse chitosan samples on the growth and production of F. graminearum toxins, validated by changes in the Fusarium transcriptome. Experiments included testing antifungal activity of different chitosan samples, the application of the best performing one in vitro to investigate the impact on F. graminearum growth, followed by analyzing its effect on Fusarium toxins accumulation, and Fusarium transcriptomics in the barley leaf pathosystem. Confirmatory antifungal assays revealed that CS_10, a specific batch of chitosan, retarded Fusarium growth with an application concentration of 200 ppm, significantly reducing toxin synthesis and disease symptoms in Fusarium-inoculated barley leaves. RNA-Seq analysis of F. graminearum in barley leaf pathosystem exposed to CS_10 showed a list of differentially expressed genes involved in redox balance, cell respiration, nutrient transport, cell wall degradation enzymes, ergosterol biosynthesis, and trichothecenes production. The genes functioning in these essential pathways are discussed and assigned as critical checkpoints to control Fusarium infections. The results suggest some important molecular targets in F. graminearum that may be suitable in gene-specific targeting or transgene-free methods, such as spray-induced gene silencing during host-pathogen interactions.

1. Introduction

Fusarium graminearum (Fg) is a fungal pathogen that infects cereals, such as wheat, barley, maize, and other food crops around the world. It causes a disease called Fusarium head blight (FHB), also known as scab, which leads to significant yield losses and reduces grain quality [1]. FHB occurs when fungal spores are dispersed by wind or rain and land on cereal heads. The fungus then grows on the host and symptoms include bleached or discolored heads, lightweight and shrunken grains, and pink or orange fungal growth in infected plant tissue [2,3]. One of the main concerns with FHB is the production of mycotoxins contaminating the grain and posing a health risk to humans and animals. F. graminearum produces several mycotoxins during barley infection, including deoxynivalenol (DON) [4]. DON is a type of trichothecene mycotoxin that can cause vomiting, diarrhea, and other gastrointestinal problems in animals and humans [5]. The presence of mycotoxins in barley can have significant economic consequences as contaminated grains can be rejected or sold at a lower price due to safety concerns [6]. Therefore, it is essential to implement strategies that limit the risk of FHB and mycotoxins in barley. These may include the use of resistant cultivars, crop rotation, proper planting and harvesting timing, proper storage practices, and the application of chemical fungicides [7]. However, the latter, despite being an indispensable component of antifungal strategies today, poses a threat to the environment and might also induce DON synthesis [4]. Alternative strategies based on environmentally safe strategies should be explored.
Chitosan (CS) is a natural polysaccharide that is derived from chitin, a structural component of the exoskeleton of crustaceans such as shrimp and crabs [8]. It is also a main component of fungal cell walls. CS has been shown to have antifungal activity against a variety of fungal pathogens, including Fg [9,10]. CS has been investigated as a potential natural alternative to synthetic fungicides to control Fusarium species in agricultural settings. For example, Francesconi, et al. [11] reported antifungal activity of CS against F. graminearum and decreased symptoms of FHB of inoculated durum wheat. Buzón-Durán, et al. [12] reported CS activity against F. culmorum. Al-Hetar, et al. [13] showed that CS inhibited the growth of F. oxysporum, another soil-borne pathogen causing wilt disease in many cultivated plants, including cereal crops, tomatoes, bananas, and cotton. Overall, the antifungal effect of CS against various fungal pathogens, including different species of Fusarium, reviewed by Poznanski, Hameed and Orczyk [10], is promising in developing crop protection strategies. However, more research is needed to fully understand the mechanisms of action and optimize the use of CS as a natural fungicide in agricultural settings.
Transcriptomics is a powerful tool that can be used to study plant–pathogen interactions at the molecular level [14]. Using transcriptomics, researchers can identify genes that are differentially expressed in both the plant and the pathogen during infection. This information can help identify key molecular pathways involved in the interaction and can lead to the development of strategies to control the pathogenesis and disease. One approach to transcriptomics is to use high-throughput sequencing technologies, such as RNA-seq, to analyze the transcriptomes of both the plant and the pathogen. RNA sequencing involves isolating RNA from infected tissue and sequencing it to generate millions of short reads that can be aligned to a reference genome or assembled de novo [15]. By comparing the transcriptomes of infected and uninfected tissues, researchers can identify differentially expressed genes and pathways involved in the interaction. Transcriptomics has been used to study plant–pathogen interactions in barley and Fusarium pathogens [16]. By identifying the genes and pathways involved in the interaction, researchers can develop new strategies to control plant diseases, such as breeding resistant cultivars or developing new fungicides that target specific molecular pathways. The use of CS is a promising strategy because the compound is environmentally safe, biocompatible, and easily available. It also shows relatively strong antifungal activity, and as reported in this article, inhibits Fg growth, and attenuates the expression of toxin-related genes.
The current study aims to investigate the antifungal activity of CS against Fg at the molecular level. Testing different batches of CS, we found that only certain types of CS showed strong antifungal activity in vitro, reduced toxin accumulation, and disease symptoms in Fusarium inoculated barley leaves. Using in planta pathosystem (barley leaves infected with the Fg isolate BW5), we analyzed the fungal transcriptome after CS treatment. This revealed a set of differentially expressed genes (DEGs) and pathways involved in response to the application of CS. For example, genes involved in carbohydrate metabolism and fatty acid synthesis were significantly negatively regulated, while genes involved in stress response and defense mechanisms were found to be up-regulated. Toxin levels in infected leaves were significantly reduced, and the results are discussed in relation to Fg transcriptome analysis. By understanding these mechanisms, researchers can develop new strategies for controlling plant diseases and improving crop yield and quality.

2. Results and Discussion

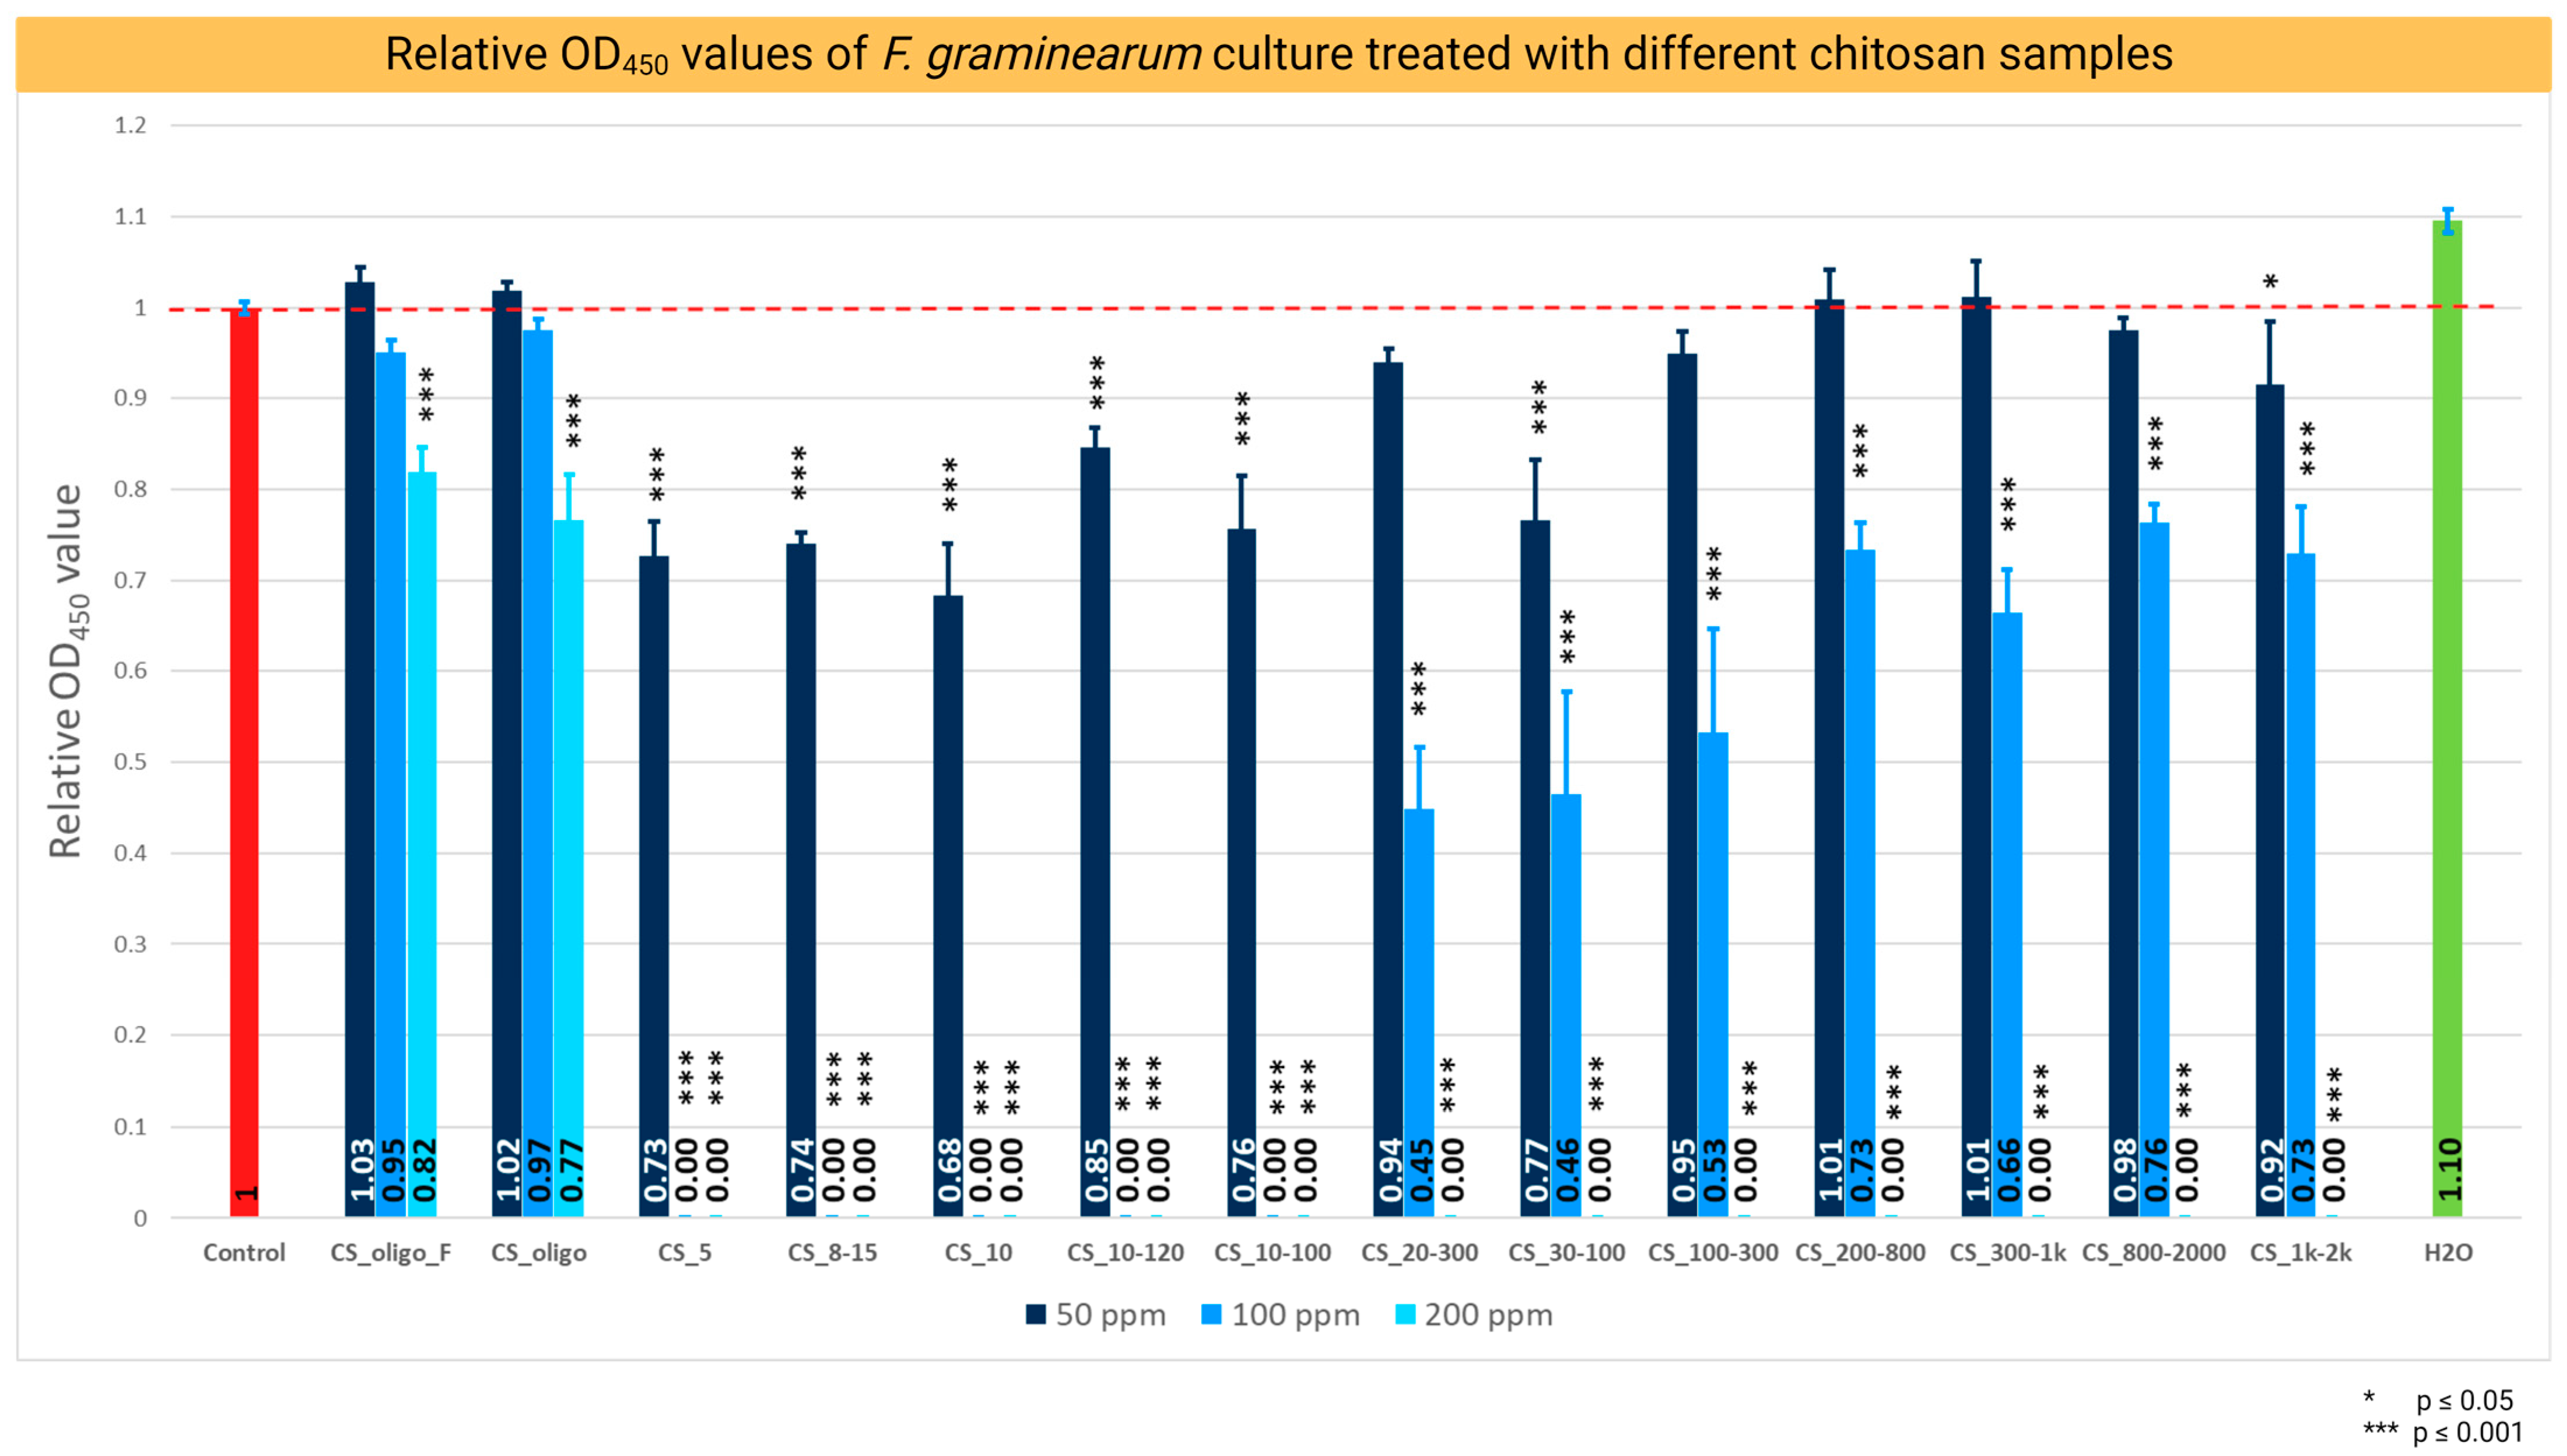
2.1. Chitosan Antifungal Activity and Minimum Inhibitory Concentration (MIC)

The antifungal effect of different batches of CS was evaluated by measuring the optical density (OD450) of Fg after 120 h of PDA culture supplemented with 50, 100, and 200 ppm concentrations of tested CS batches in microtiter plate assay (Table 1, Figure 1).
Of the whole collection of CS samples, the batches CS_5, CS_8-15, CS_10, CS_10-120, and CS_10-100 stopped the growth of Fg at a concentration of 100 ppm, indicating the MIC value of 100 ppm and the strongest antifungal activity compared with the other samples (Figure 1). The relative value of OD450 in the presence of CS_10 was 0.68 showing the strongest inhibition of Fg growth in this assay (Figure 1). Batches of medium to high MW 10–120, 10–100, 20–300, 30–100, 100–300, 200–800, 300–1k, 800–2000, and 1k–2k showed descending antifungal activities, clearly lower compared to CS-10. The MIC value for this set of CS samples was 200 ppm. The batches of low MW CS_oligo_F and CS_oligo showed very weak antifungal properties. Low growth inhibition was detectable only at a concentration of 200 ppm (Figure 1).
CS of different providers varied greatly in terms of molecular weight (MW), degree of polymerization (DP), and viscosity of the standardized water solutions. The results showed clear differences in the antifungal properties of the CS batches tested, indicating a significant impact of the physiochemical characteristics of CS on its biological properties (critically reviewed in our recent article describing the characteristics of antifungal activity of CS [10]). The antifungal activity of CS_10 was further confirmed by the Petri plate assay with Fg on PDA. The relative area of the mycelium grown on PDA with 50, 100, and 200 ppm of CS_10 was evaluated at 96 h of culture (Figure 2). Growth inhibition was significantly different for the three concentrations tested during 96 h of Fusarium culture. The 200 ppm concentrations of CS_10 showed an antifungal impact up to 96 h (Figure 2). Based on the results of the microtiter and Petri plates assays, CS_10 was selected for all other studies and used at a concentration of 200 ppm. This batch of chitosan was characterized by the optimal combination of physicochemical parameters for antifungal activity.
These results are in line with several previous studies reporting the antifungal properties of CS. Park et al. [17] used batches of CS of varying MW (1, 3, 5, and 10 kDa) against nine species of fungi, and they found that the MIC of CS 5 and 10 kDa did not exceed 0.04 mg/mL for all tested species; thus, the two batches showed stronger antifungal activity than the two remaining batches (1 and 3 kDa). El-Mohamedya et al. [18] showed the antifungal impact of high and low molecular weight CS against different species of pathogenic fungi. They reported that low molecular weight CS applied at 0.125% to 1.0% (1250 to 10,000 ppm) inhibited the growth of Fusarium species from 25.2 to 100%. However, 10,000 ppm represents a very high concentration that is of no practical use in the field.

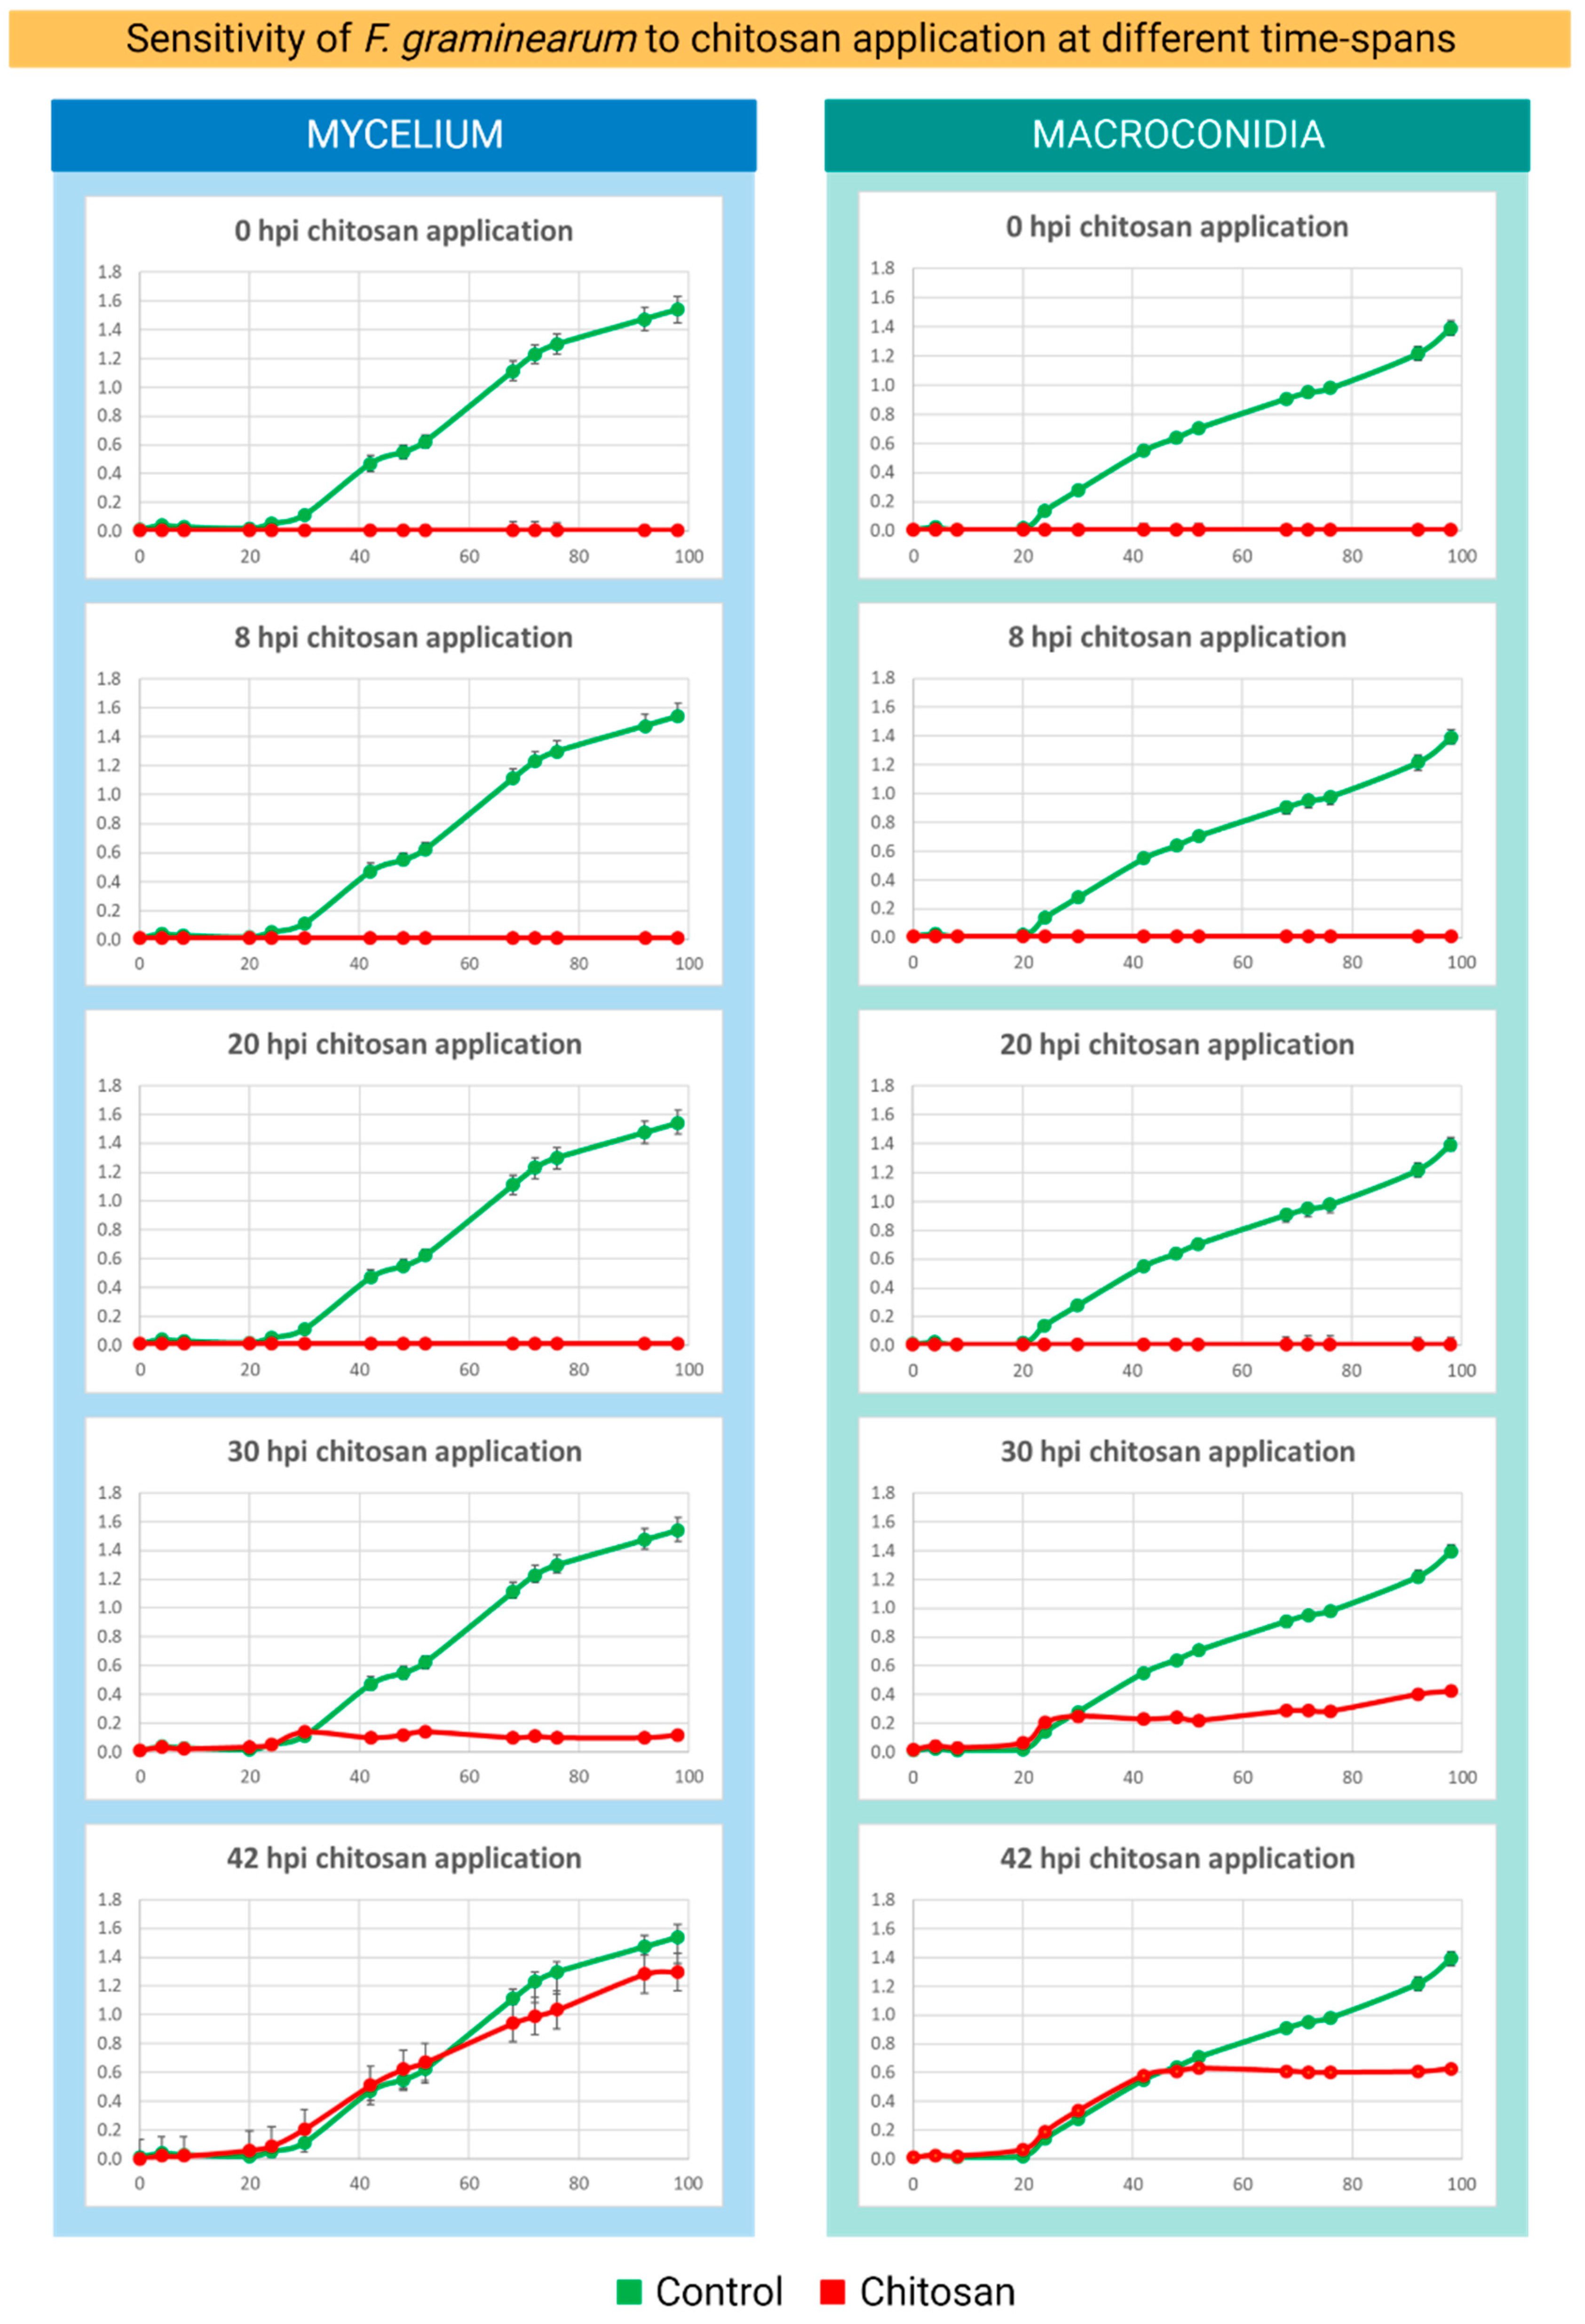
2.2. Identifying the Chitosan Application Time-Point for Transcriptomics

Transcriptomic is the molecular snapshot of a living cell. The identification of a critical time point is important to detect the transcriptomic of the host–pathogen interaction as well as the pathogen response triggered by CS treatment. Here, we observed from the microtiter plate assays that CS_10 (final concentration 200 ppm) applied 0, 8, and 20 h after PDB inoculation with macroconidia or mycelium inhibited the growth of Fg in the culture. The growth of Fg was strongly inhibited when the PDB culture was supplemented with CS_10 30 hpi. However, at this point certain Fg growth remained as compared to the earlier ones (0, 8, and 20 hpi). Chitosan application at 42 hpi allowed for Fg growth, although at a detectably lower rate than the control (Figure 3). This experiment was aimed at finding the critical time points for transcriptomics studies. We reasoned that there would be enough Fg cells for transcriptomics when chitosan was applied at 0, 8, or 20 hpi. Fusarium growth was also strongly restricted when CS_10 was applied at 30 hpi. The time point of 42 hpi would allow us to analyze the still living Fusarium response to CS treatment. In the subsequent transcriptomic experiments conducted on the Fg-barley leaf system, CS_10 was applied at 48 hpi on leaves with Fg macroconidia.
Lopez-Moya, et al. [19] conducted a similar time course experiment, where Neurospora crassa was subjected to CS applications. The authors observed an inhibitory effect of CS on the growth of N. crassa 8 h after germination, which is considered a critical time point for the formation of germ tubes during the growth of conidia. In their study, the application of CS at 0.5 ug/mL reduced conidial germination of N. crassa by up to 50% compared to the control. Microscopic tracking of Fg during maize infections revealed interesting data on its infection patterns and entry into host cells [20]. The authors observed that Fg starts intercellular growth during the initial phase (12–18 hpi) and then began penetration into host cells with intracellular growth patterns (20 hpi onwards). During this initial phase of growth, the fungal hyphae penetrated the plant cell wall and invaded host cells causing brown lesions that were detectable at 72 hpi [20]. Here, in our work, we did not observe Fg growth during the initial time points (0–18 hpi), and this could be due to the direct impact of CS_10 on cell membranes and cell processes. After 30 hpi, some growth was observed in treatments, possibly because fungi hyphae escaped CS contact. However, after 42 hpi, the growth of Fg treated with CS was significantly lower than the control.
Furthermore, to confirm the inhibitory effects of CS on Fg macroconidia, we performed Trypan blue staining of the cells in liquid culture. This confirmed that CS completely killed the macroconidia as they were all stained blue (Supplementary Figure S1B). Living cells were not stained as shown in the negative control (Supplementary Figure S1A). A mixture of CS_10 treated and CS_10 nontreated macroconidia confirmed that Trypan blue staining discriminated dead from living macroconidia (Supplementary Figure S1C). The sensitivity of germinating conidia to this treatment is important for understanding the impact of CS on Fg growth.

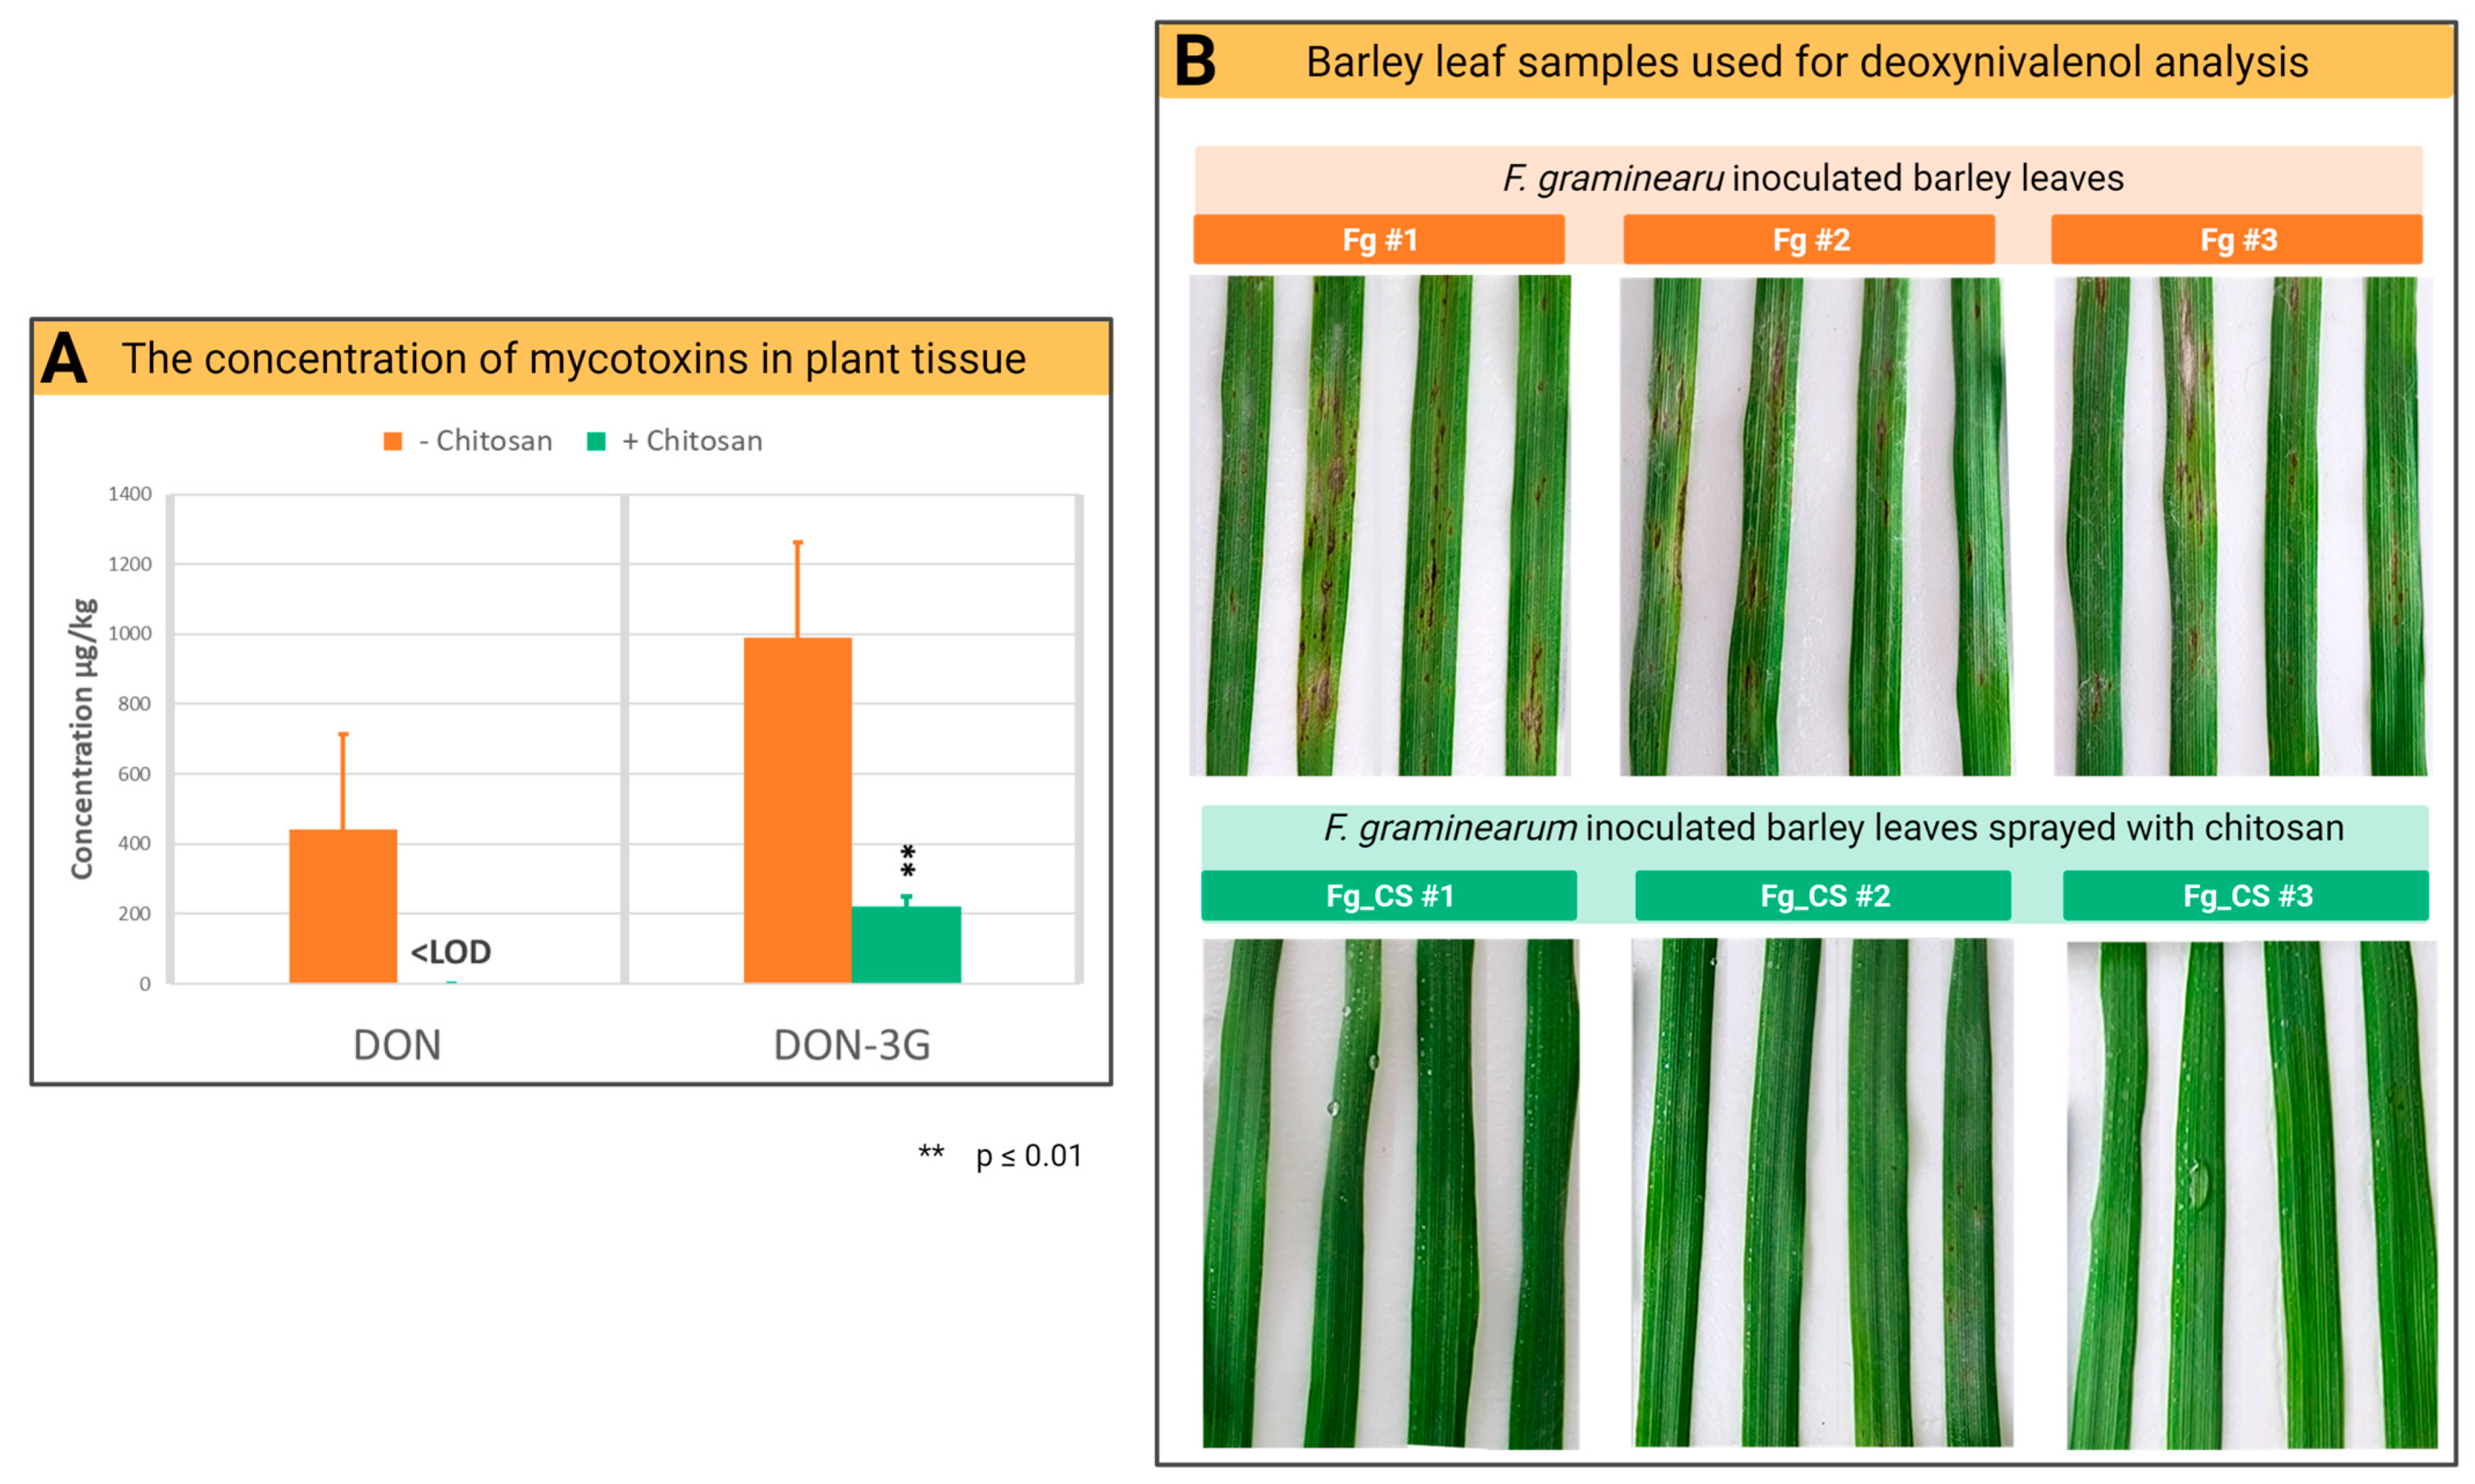
2.3. Chitosan Treatment Reduces the Accumulation of Mycotoxins of F. graminearum in Barley Leaves

Deoxynivalenol (DON), a Fusarium mycotoxin accumulated in infected crops, poses serious health risks to humans and animals and should be reduced to a minimum in the food chain. To evaluate the antifungal impact of CS on Fg mycotoxin production, the solution of CS_10 was sprayed on barley leaves inoculated with Fg, and the concentration of DON was analyzed. At 72 hpi in barley leaves with the Fg isolate BW-5, a significant level of DON and DON-3G was detected in control plants (Figure 4). The application of CS_10 at a concentration of 200 ppm reduced the level of DON and DON-3G in the samples (Figure 4A) and was associated with a reduction in disease (Figure 4B). In the control leaves, the mean concentration of DON was 440.3 µg/kg in the leaf samples, which corresponded to the high level of accumulation of mycotoxins. In the sample treated with CS_10, the concentration was below the limit of detection (LOD = 150 µg/kg of dry leaf weight) and it was considered 0. The average concentration of DON-3G in the control samples without treatment was 988.9 µg/kg, while in the samples treated with CS_10, the concentration was 222.2 µg/kg. The results indicate a significant reduction, more than 83%, in the toxin level in leaves (Figure 4B).
The estimated necrotic area of barley leaves shows a great reduction in infection symptoms in Fg-inoculated and CS-treated leaves compared to control Fg-inoculated leaves (Figure 4B). Consistent with the above is the significant, more than eight times lower relative transcript reads of Fg housekeeping genes found in the transcriptomic data (Supplementary Table S2 and Figure S3). Both sets of results, i.e., reduced necrotic area and reduced transcript reads of Fg housekeeping genes, indicate strong inhibition of Fg growth and a lower number of fungal cells in infected barley leaves.
CS has been shown to have antifungal properties and has been used in various combinations to retard fungal growth and toxin synthesis. Wu, Wan, Lu, Wang, Zhong, Schwarz, Chen and Rao [9] used electrostatically stabilized CS with lecithin emulsion and reported antifungal activity in terms of DON synthesis and growth inhibition. They showed that rice cultures inoculated with Fg accumulated up to 98.6% less toxin when treated with high molecular weight CS. The authors described that various physiochemical parameters of CS affected its antifungal properties. The strongest inhibition of DON accumulation showed high molecular weight CS, which was formulated with lecithin and was stronger than medium and low molecular weight CS [9]. Deshaies, et al. [21] reported that spray with CS (195 kDa, 10–50 cps viscosity and 90% DD) alleviated Fusarium head blight (FHB) symptoms in wheat grown in greenhouses by inhibiting spore germination and hyphal growth. The metabolomic study indicated changes in various pathways, including the JA-dependent resistance pathway [21].

2.4. Fg Transcriptomics in Planta and Chitosan Applications

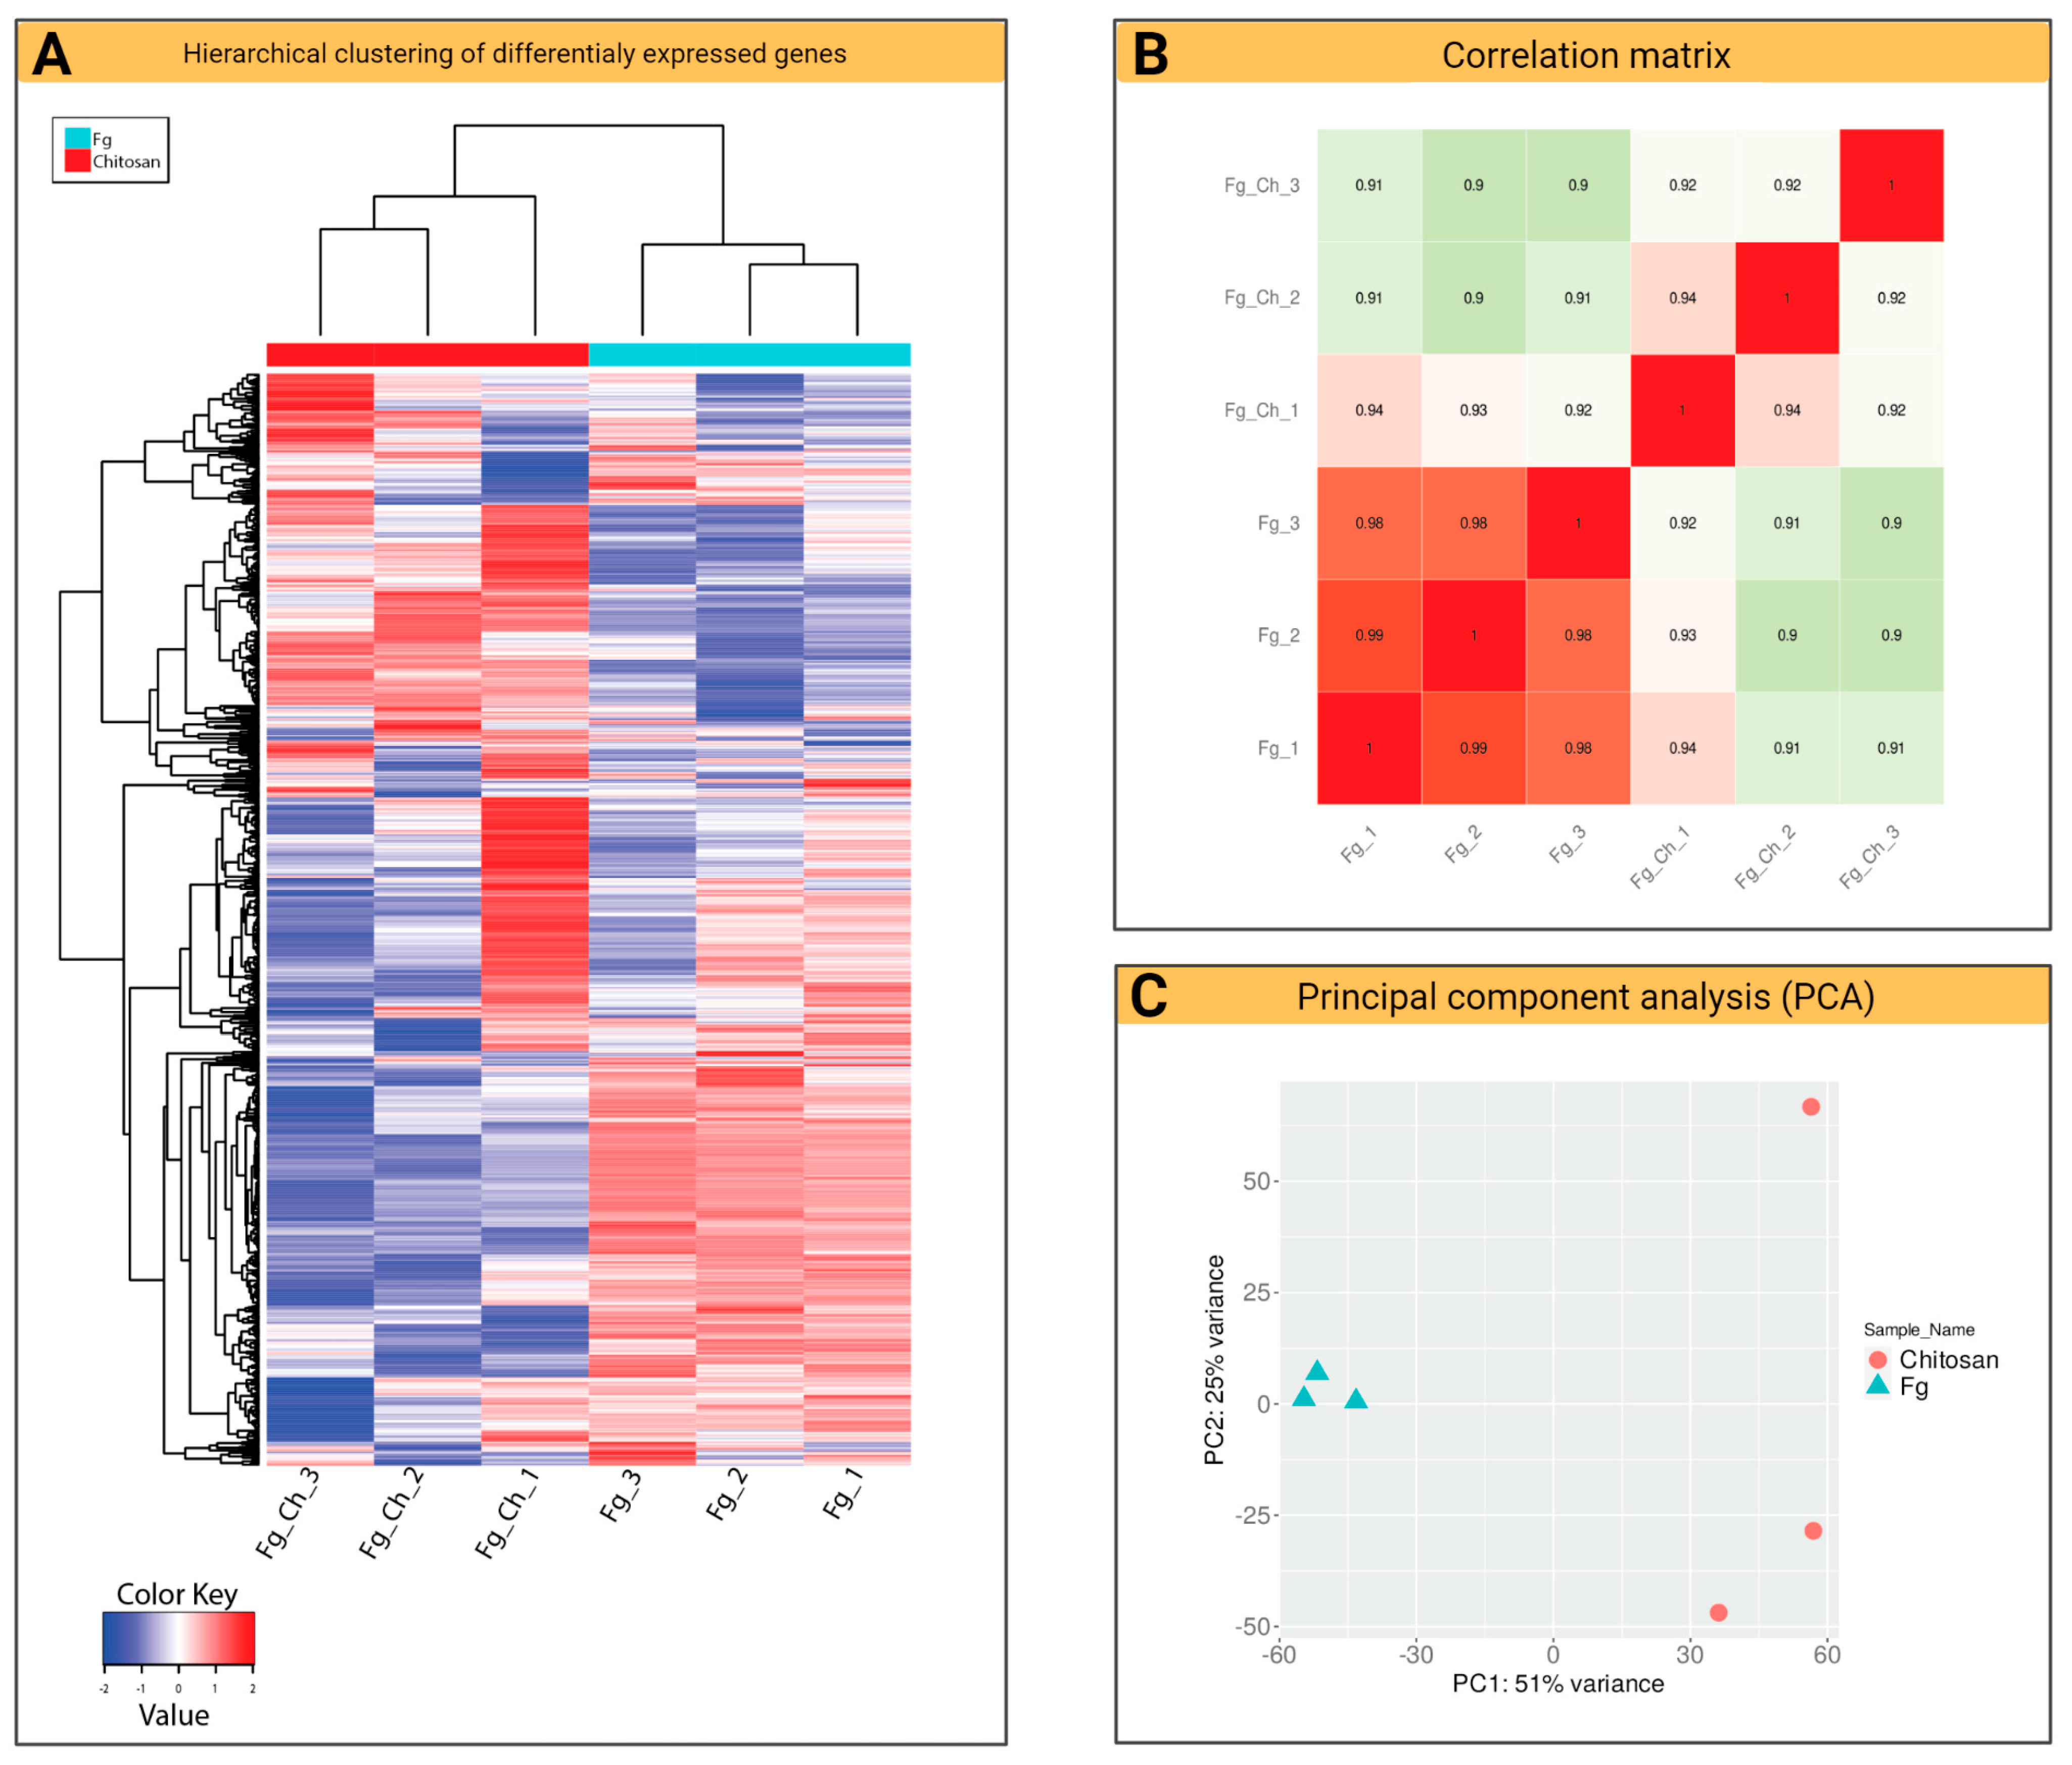
2.4.1. General Characteristics of F. graminearum Transcriptomes (RNA-Seq)

The Fg samples (control) clustered in the different areas of the plot and the treatments showed some variability in one sample of the individual behavior of Fg in response to CS_10 treatment. The hierarchical clustering of Fg DEGs against the CS_10 treatment showed a repressed gene pattern compared to the control genes (Figure 5A). The blue color shows the repression, while the red color represents the induced genes.
The heat map illustrates a general comparison of the transcriptomes of both organisms in response to specific stress. The Pearson correlation matrix revealed a linear relationship between the samples during the experimental conditions and grouped them. The range of the values of the control samples (1.0–0.98) and the samples treated with CS_10 (0.91–0.94) showed a positive correlation between the experimental groups (Figure 5B). ‘The Pearson correlation measures the strength of the linear relationship between two variables. It has a value between −1 and 1, with a value of −1 meaning a total negative linear correlation, 0 meaning no correlation, and + 1 meaning a total positive correlation [22]’.
A significant response of DEGs was observed when Fg was treated with the CS_10. An overall decrease in Fg gene expression was observed with a log2 fold change of >2.0 (p-value < 0.05) compared to the control (Figure 5). The principal component analysis (PCA) of the aligned transcripts showed similarity in the biological replicates of the experimental unit. The analysis is widely used to compare variables simultaneously and to explore the variability among biological replicates. The PCA plot revealed the variance scores of the first (PC1) and second (PC2) of 51% and 25% among the six samples (Figure 5C).

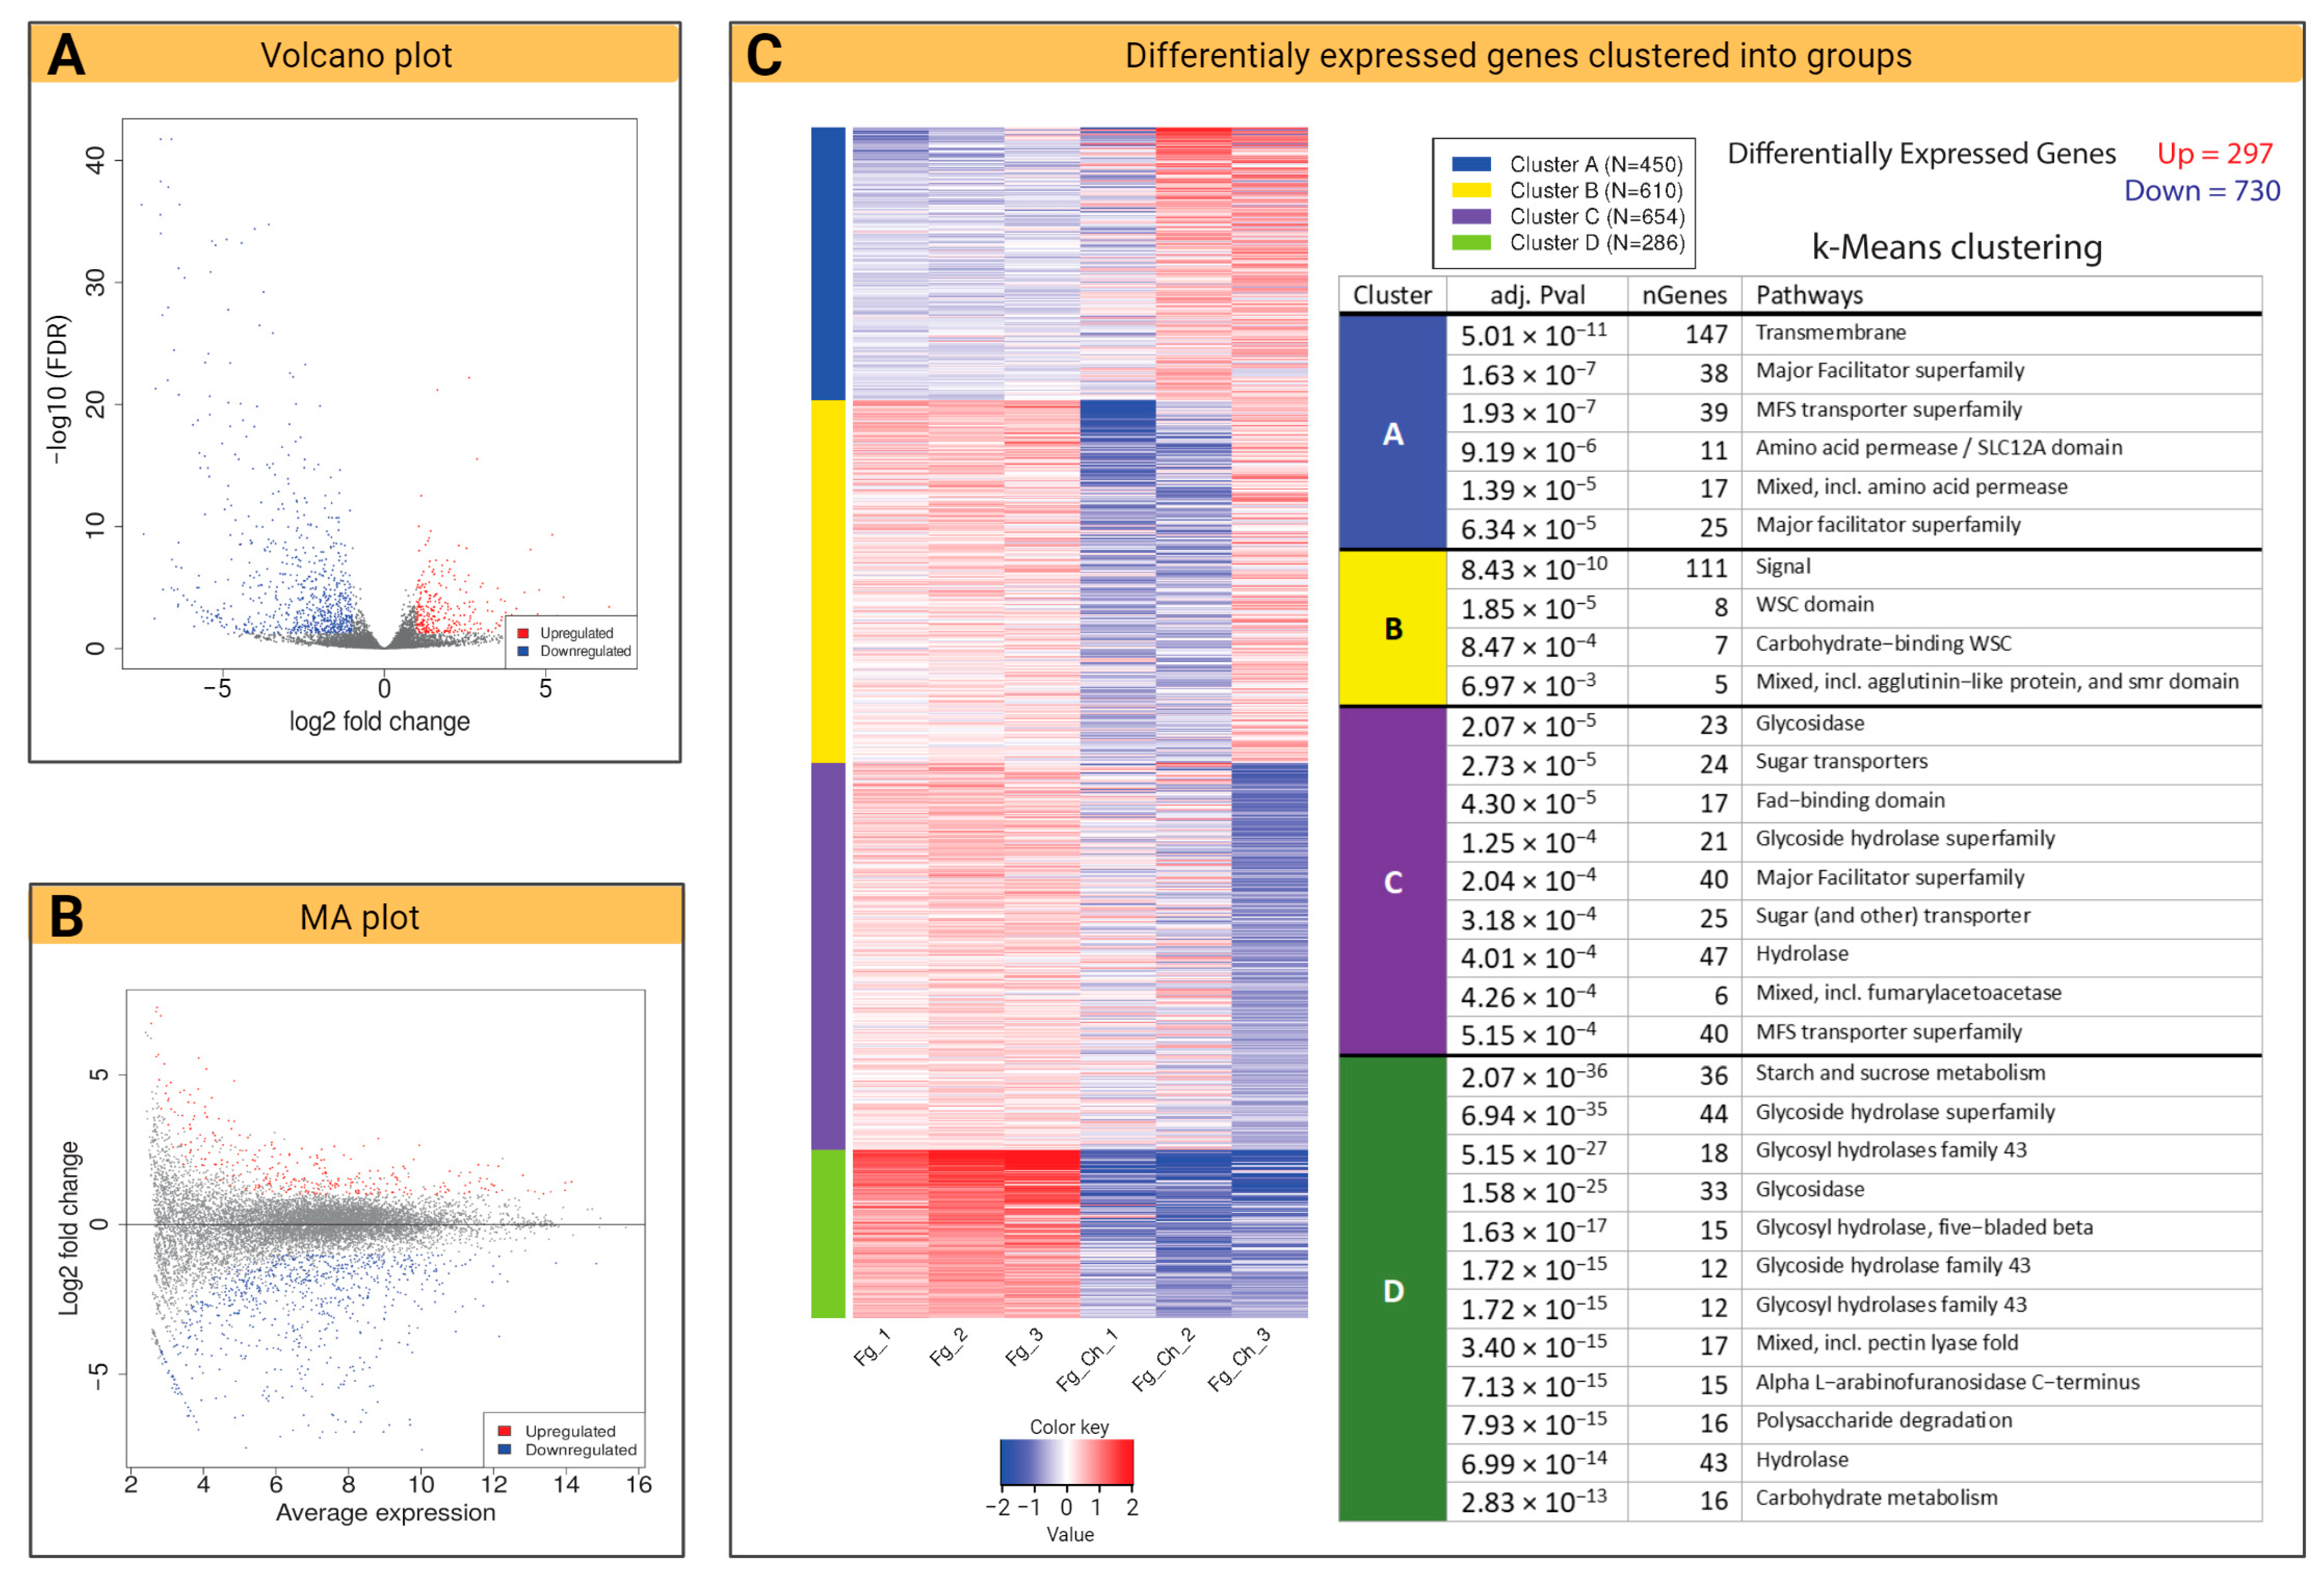
2.4.2. Volcano Plot and k-Means Clustering

The dispersion patterns of the DEGs visualized through the volcano plot and the MA plot revealed a statistical difference between the two treatments. Volcano plots typically use the negative fold change of base-10 and base-2 log fold change, respectively, to show the statistical significance of the difference of the size for each gene in the comparison [23]. The wide dispersion of down-regulated genes on the y-axis demonstrates the lower p-values and thus, more log2 fold change (Figure 6A). The dispersion of the values on the x-axis represents the variability of the level of expressions, and the dots near the eruption point (0) represent identical mean expression levels (Figure 6B). In the MA plot representation, the log2 fold changes (y-axis) are expressed as dispersions versus normalized mean counts plotted on the x-axis (Figure 6B). The data points in the MA plot coincide with the expression pattern observed in the volcano plot with a significant number of down-regulated genes along the y-axis (-ve values below 0) (Figure 6B). Furthermore, we analyzed the expression pattern in the samples based on the clustering of k-means. The model was selected to group a maximum of the top 2000 DEGs of each biological sample and group them into four clusters based on the promoter enrichment analysis [24]. From the results generated, we observed a significantly higher proportion of down-regulated genes (730) as compared to up-regulated genes (297) (Figure 6C). A dense cluster of down-regulated genes was found to be involved in the glycolysis and starch metabolic pathways. However, the transmembrane movement of molecules such as amino acid permeases and genes from the MFS transporter family was up-regulated after CS_10 treatment.

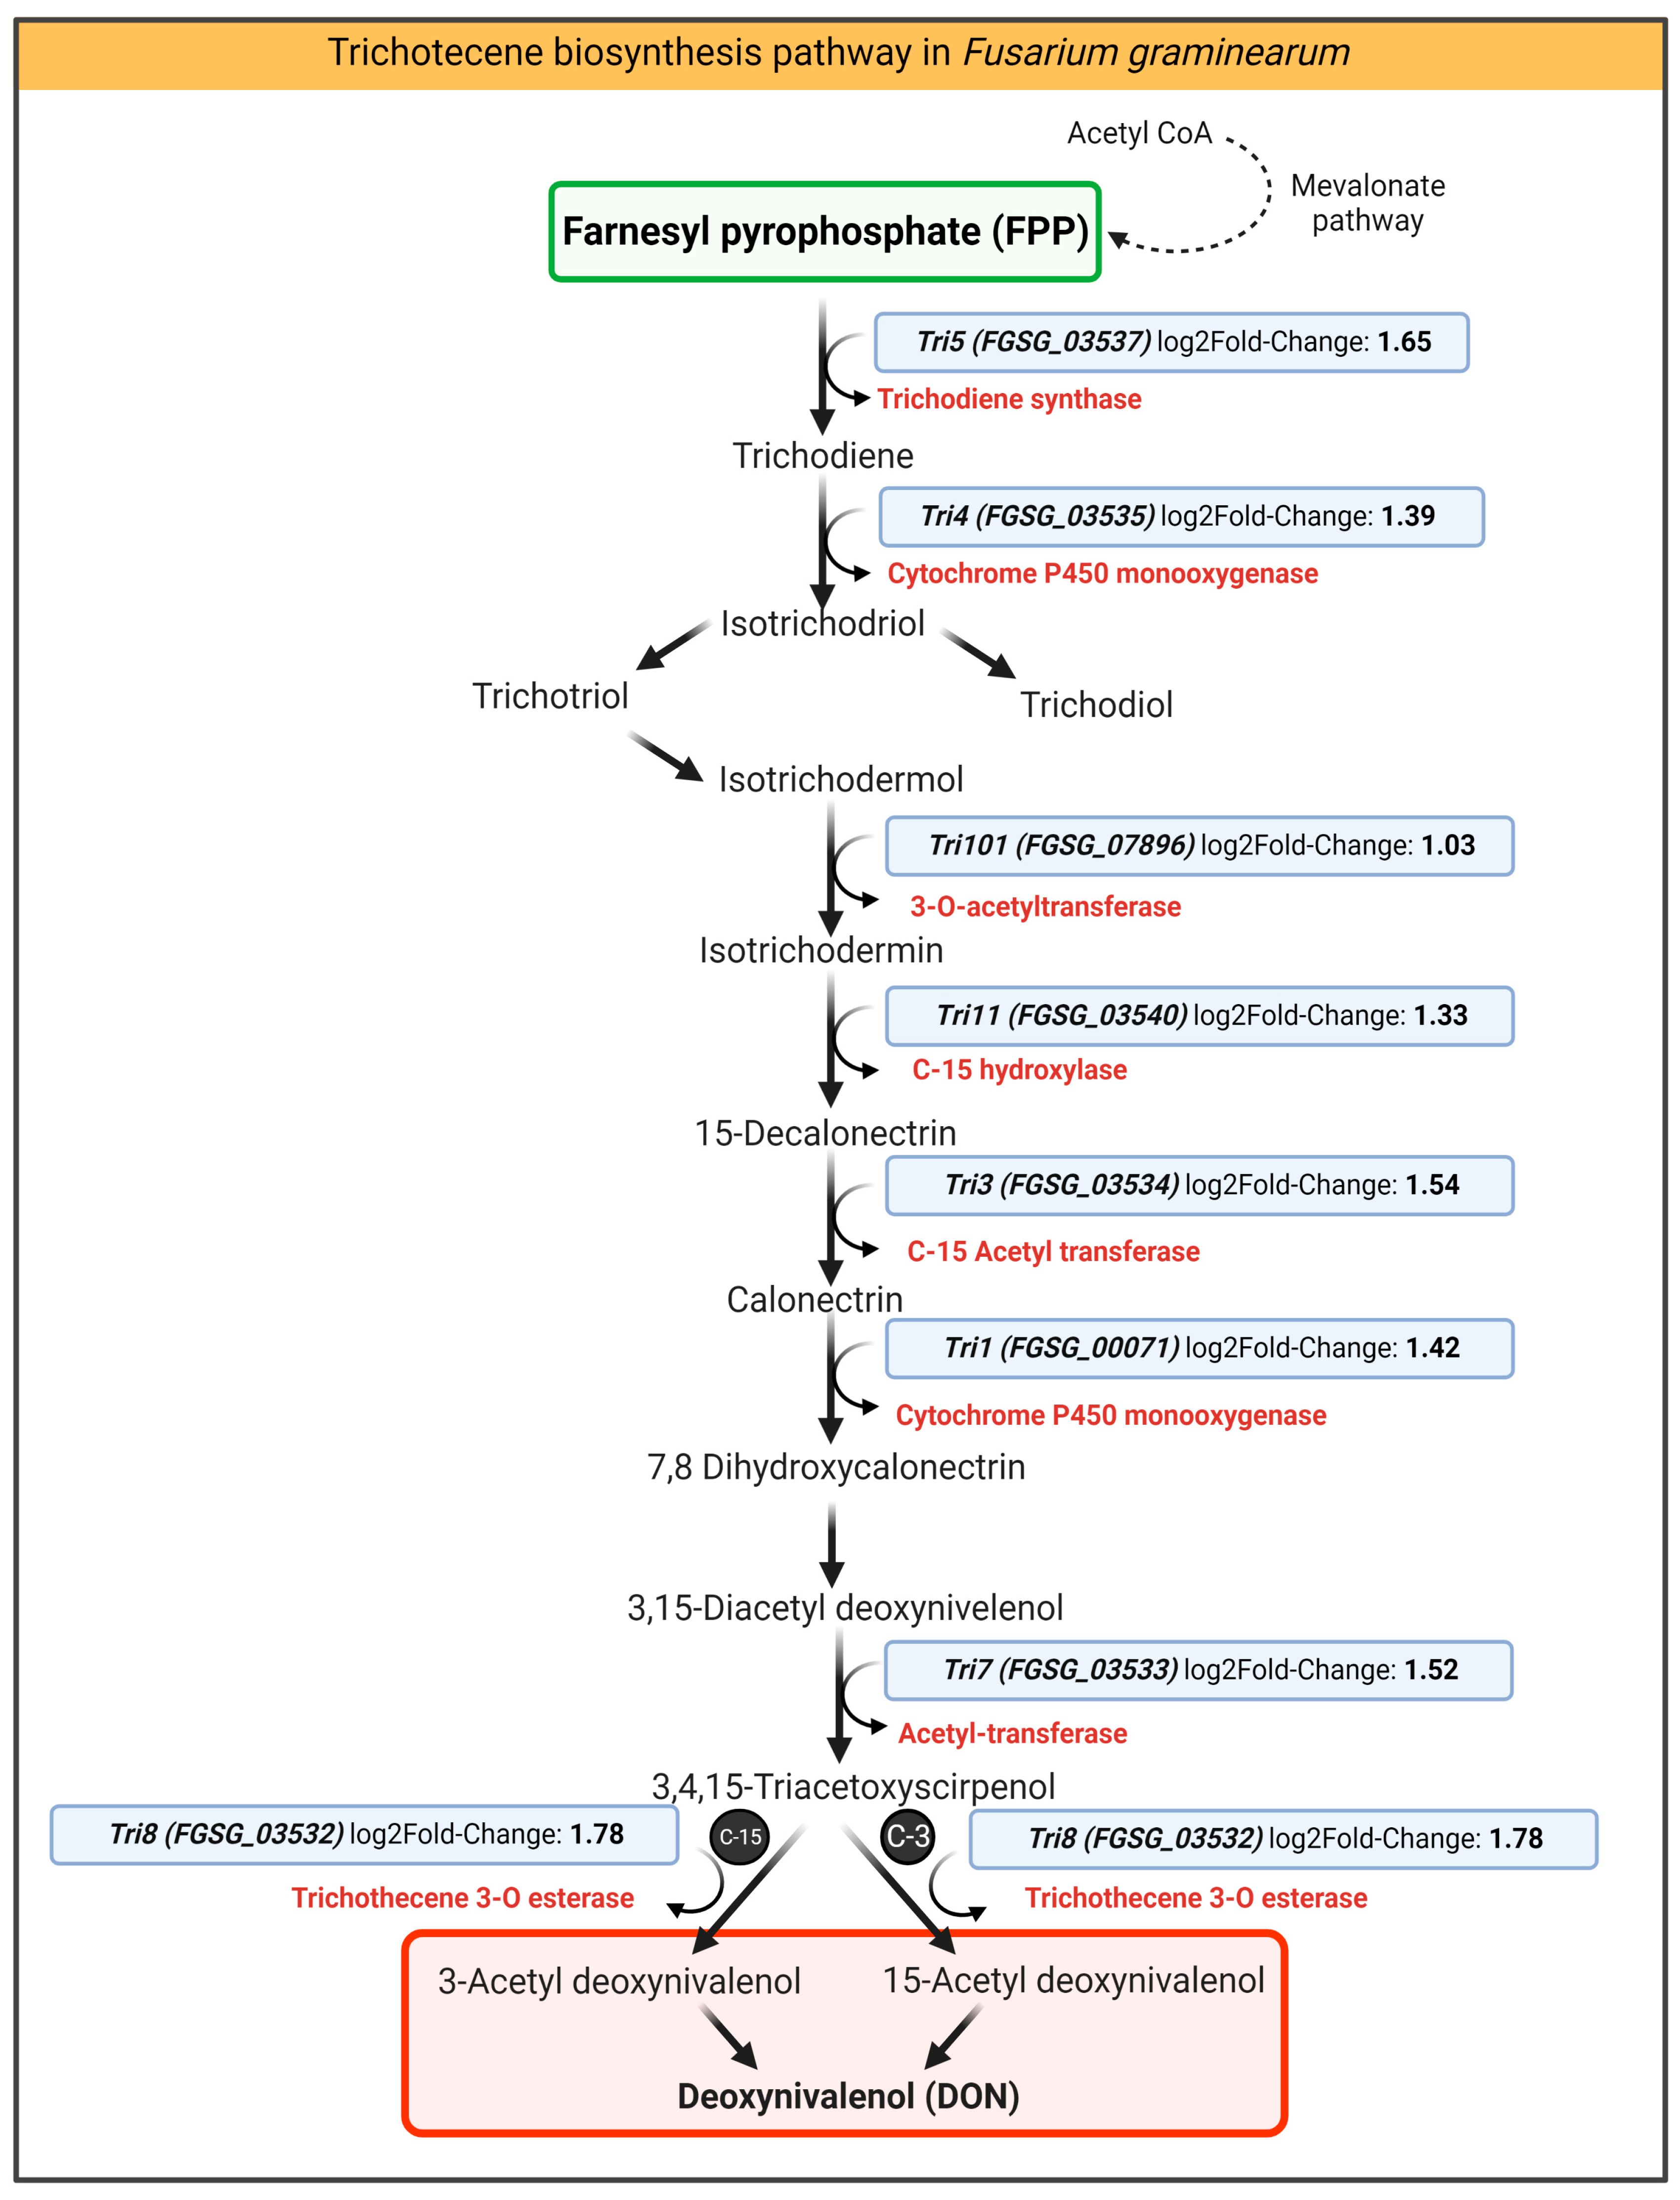
2.4.3. Chitosan Impact on DON-Related Transcripts of F. graminearum

Here, we observed a significant reduction in DON accumulation in barley treated with CS_10 in planta designed experiments (Figure 4). The enrichment analysis of DEGs showed several different gene groups that were dominantly involved in biological processes (BP), molecular functions (MF), and cellular components (CC). Table 2 shows an overview of the top four major genes involved in these pathways/processes that are up- and down-regulated. RNA-Seq data revealed a significant down-regulation of Fg genes; a total of 90 genes were involved in the carbohydrate metabolic process, 17 in the catabolic process of polysaccharides, and 316 in catalytic activities (Table 2).
The time point for the Fg transcriptome was established as 72 hpi and 48 h after treatment with batch CS_10 chitosan. To find the molecular regulation behind this, we analyzed transcripts of genes that function in the trichothecene biosynthesis pathway. Over the past decade, a significant part of the research was conducted on the routes of trichothecene biosynthesis in the Fg and related species [4,25]. The Fg genome encodes 16 trichothecene biosynthesis genes (TRI genes), including TRI1, TRI3-TRI16, and TRI101 that reside in a genomic region of 25 kb [26]. Wang, et al. [27] identified the trichothecene production capacity of different strains of Fg isolates and reported DEGs associated with variable trichothecene accumulations between different fungi. This group identified some new candidate genes (FGSG_01403, FGSG_10571, FGSG_01959, FGSG_09786, FGSG_03796, FGSG_02367, FGSG_07765, FGSG_01786, FGSG_02113, FGSG_02366, FGSG_02371) that are associated with trichothecene biosynthesis in Fg species. However, as Wang, et al. [28] stated, this needs further characterization for molecular and biological functions. For example, proteome analysis of the FGSG_01403 protein showed negative regulation with trichothecene production. Knockout mutations in this gene resulted in increased production of trichothecenes in the Fg isolate PH1 [27].
Here, in our data, we observed up-regulation of genes from the trichothecene biosynthesis pathway: Tri5, FGSG_03537, 3.13-fold change; Tri4, FGSG_03535, 2.62-fold change; Tri101, FGSG_07896, 2.04-fold change; Tri11, FGSG_03540, 2.46-fold change; Tri3, FGSG_03534, 2.91-fold change; Tri1, FGSG_00071, 2.68-fold change; Tri7, FGSG_03533, 2.87-fold change and Tri8, FGSG_03532, 3.44-fold change (Figure 7, Supplementary Table S2).
Up-regulation of TRI genes (Figure 7, Supplementary Table S2) and significantly lower concentration of DON and DON-3G in CS treated leaves (Figure 4) could be a cumulative result of inhibition of Fg growth and a lower number of fungal cells in infected barley leaves (Section 3.3, Supplementary Figure S3) and significant down-regulation of genes of general metabolism that are associated with toxin synthesis. As reviewed by Chen, Kistler and Ma [4], trichothecenes biosynthesis is strictly associated with glycolysis because one of the glycolysis by-products, farnesyl pyrophosphate (FPP), is a substrate for DON biosynthesis [29].
Here, we observed a strong and significant down-regulation of several key genes involved in glycolysis: FGSG_00571 (0.005-fold change), FGSG_03049 (0.019-fold change), FGSG_03628 (0.011-fold change), FGSG_03795 (0.008-fold change), FGSG_06445 (0.010-fold change), FGSG_07695 (0.008-fold change), FGSG_08011 (0.010-fold change), FGSG_10999 (0.10-fold change), FGSG_11208 (0.016-fold change), FGSG_11258 (0.007-fold change), FGSG_11428 (0.018-fold change), FGSG_12551 (0.012-fold change), FGSG_07694 (not assigned) and FGSG_13855 (50.825-fold change) and metabolic processes: FGSG_03624 (0.179-fold change), and FGSG_10999 (0.010-fold change) (Supplementary Table S2).

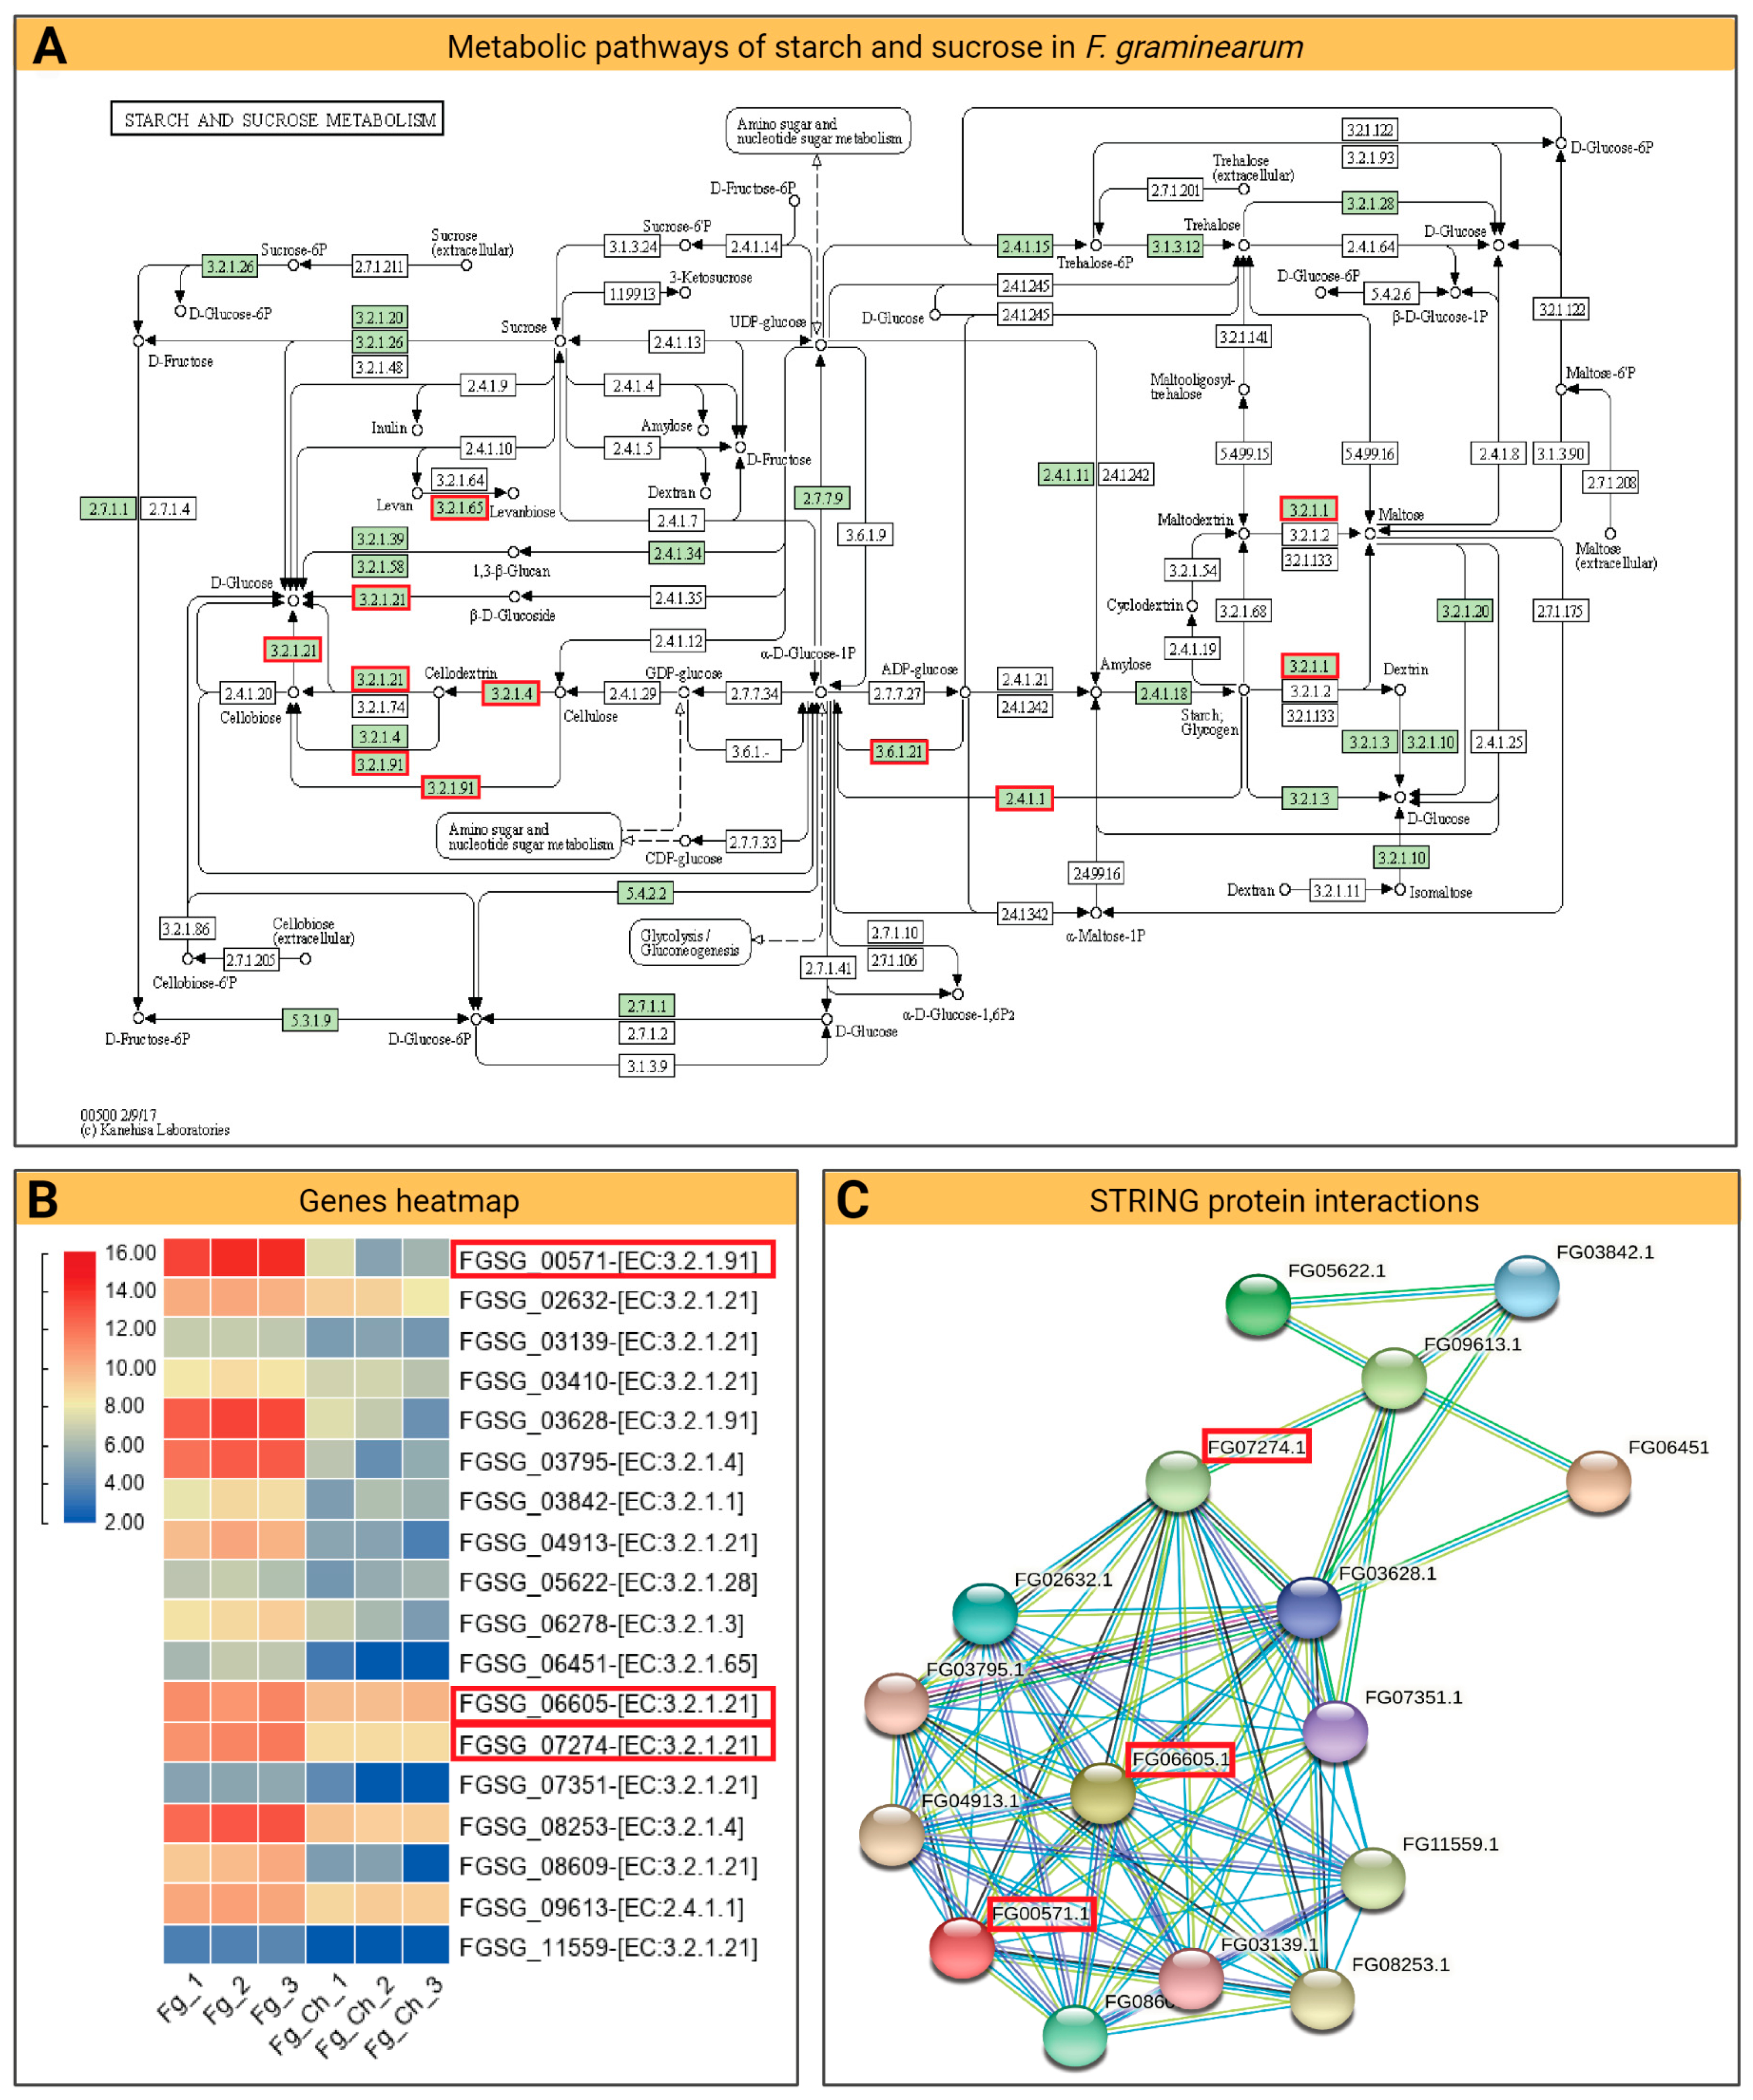
2.4.4. DEG and KEGG Path Analysis

Based on the fold-change values obtained by DESeq2 for all genes, pathway analyses were performed to look for DEGs specifically involved in a crucial biological process. For this purpose, the diagram of the KEGG pathway [30] was drawn and we looked for the significantly down-regulated genes involved in that specific pathway (Figure 8).
For top-down-regulated genes in Fg (ensemble IDs; FGSG_00571, FGSG_06605, and FGSG_07274), significant involvement was observed at various stages of starch and sucrose metabolism. Here, in the KEGG diagram, FGSG_00571 was involved in the binding of cellulose and cellodextrin and conversions to D-glucose. The CS_10 application strongly reduced the expression of this gene (0.005-fold change) compared to the control (Supplementary Table S2). Similarly, the other genes, FGSG_06605 and FGSG_07274, have a significant down-regulation of 0.56- and 0.141-fold change, respectively (Supplementary Table S2). Both genes play a key role in the carbohydrate metabolic process in fungi cells that function in the conversions of β-D-glucose, cellodextrin, cellobiose into D-glucose, and ADO-glucose into α-D-glucose-IP. Down-regulation of the key pathways may have a strong impact on carbohydrate metabolism and may lead to Fg cell death, as observed in the current experiment. To see the predicted coordination among these genes, the STRING database [31] was used to draw protein–protein interactions that included direct (physical) and indirect (functional) associations. The outcome scheme showed a strong network of interaction among FGSG_00571 and FGSG_06605 that cointegrated strongly with several other proteins in the network system (Figure 8).
Figure 8. Metabolic pathways of starch and sucrose in F. graminearum and their relationship to the transcriptome: (A) The KEGG pathway illustration of the starch and sucrose metabolic process in Fg cells. Reprinted/adapted with permission from Refs. [32,33,34], 2023, KEGG, Kanehisa Laboratories. The red rectangles correspond to genes down-regulated after CS_10 treatment. (B) Heatmap of important Fg genes down-regulated with CS_10 treatment. Red corresponds to higher gene expression, while blue corresponds to lower gene expression. (C) Diagram of the protein–protein network showing the interaction among different genes. The red rectangles describe the significant genes.
Ijms 24 12894 g008

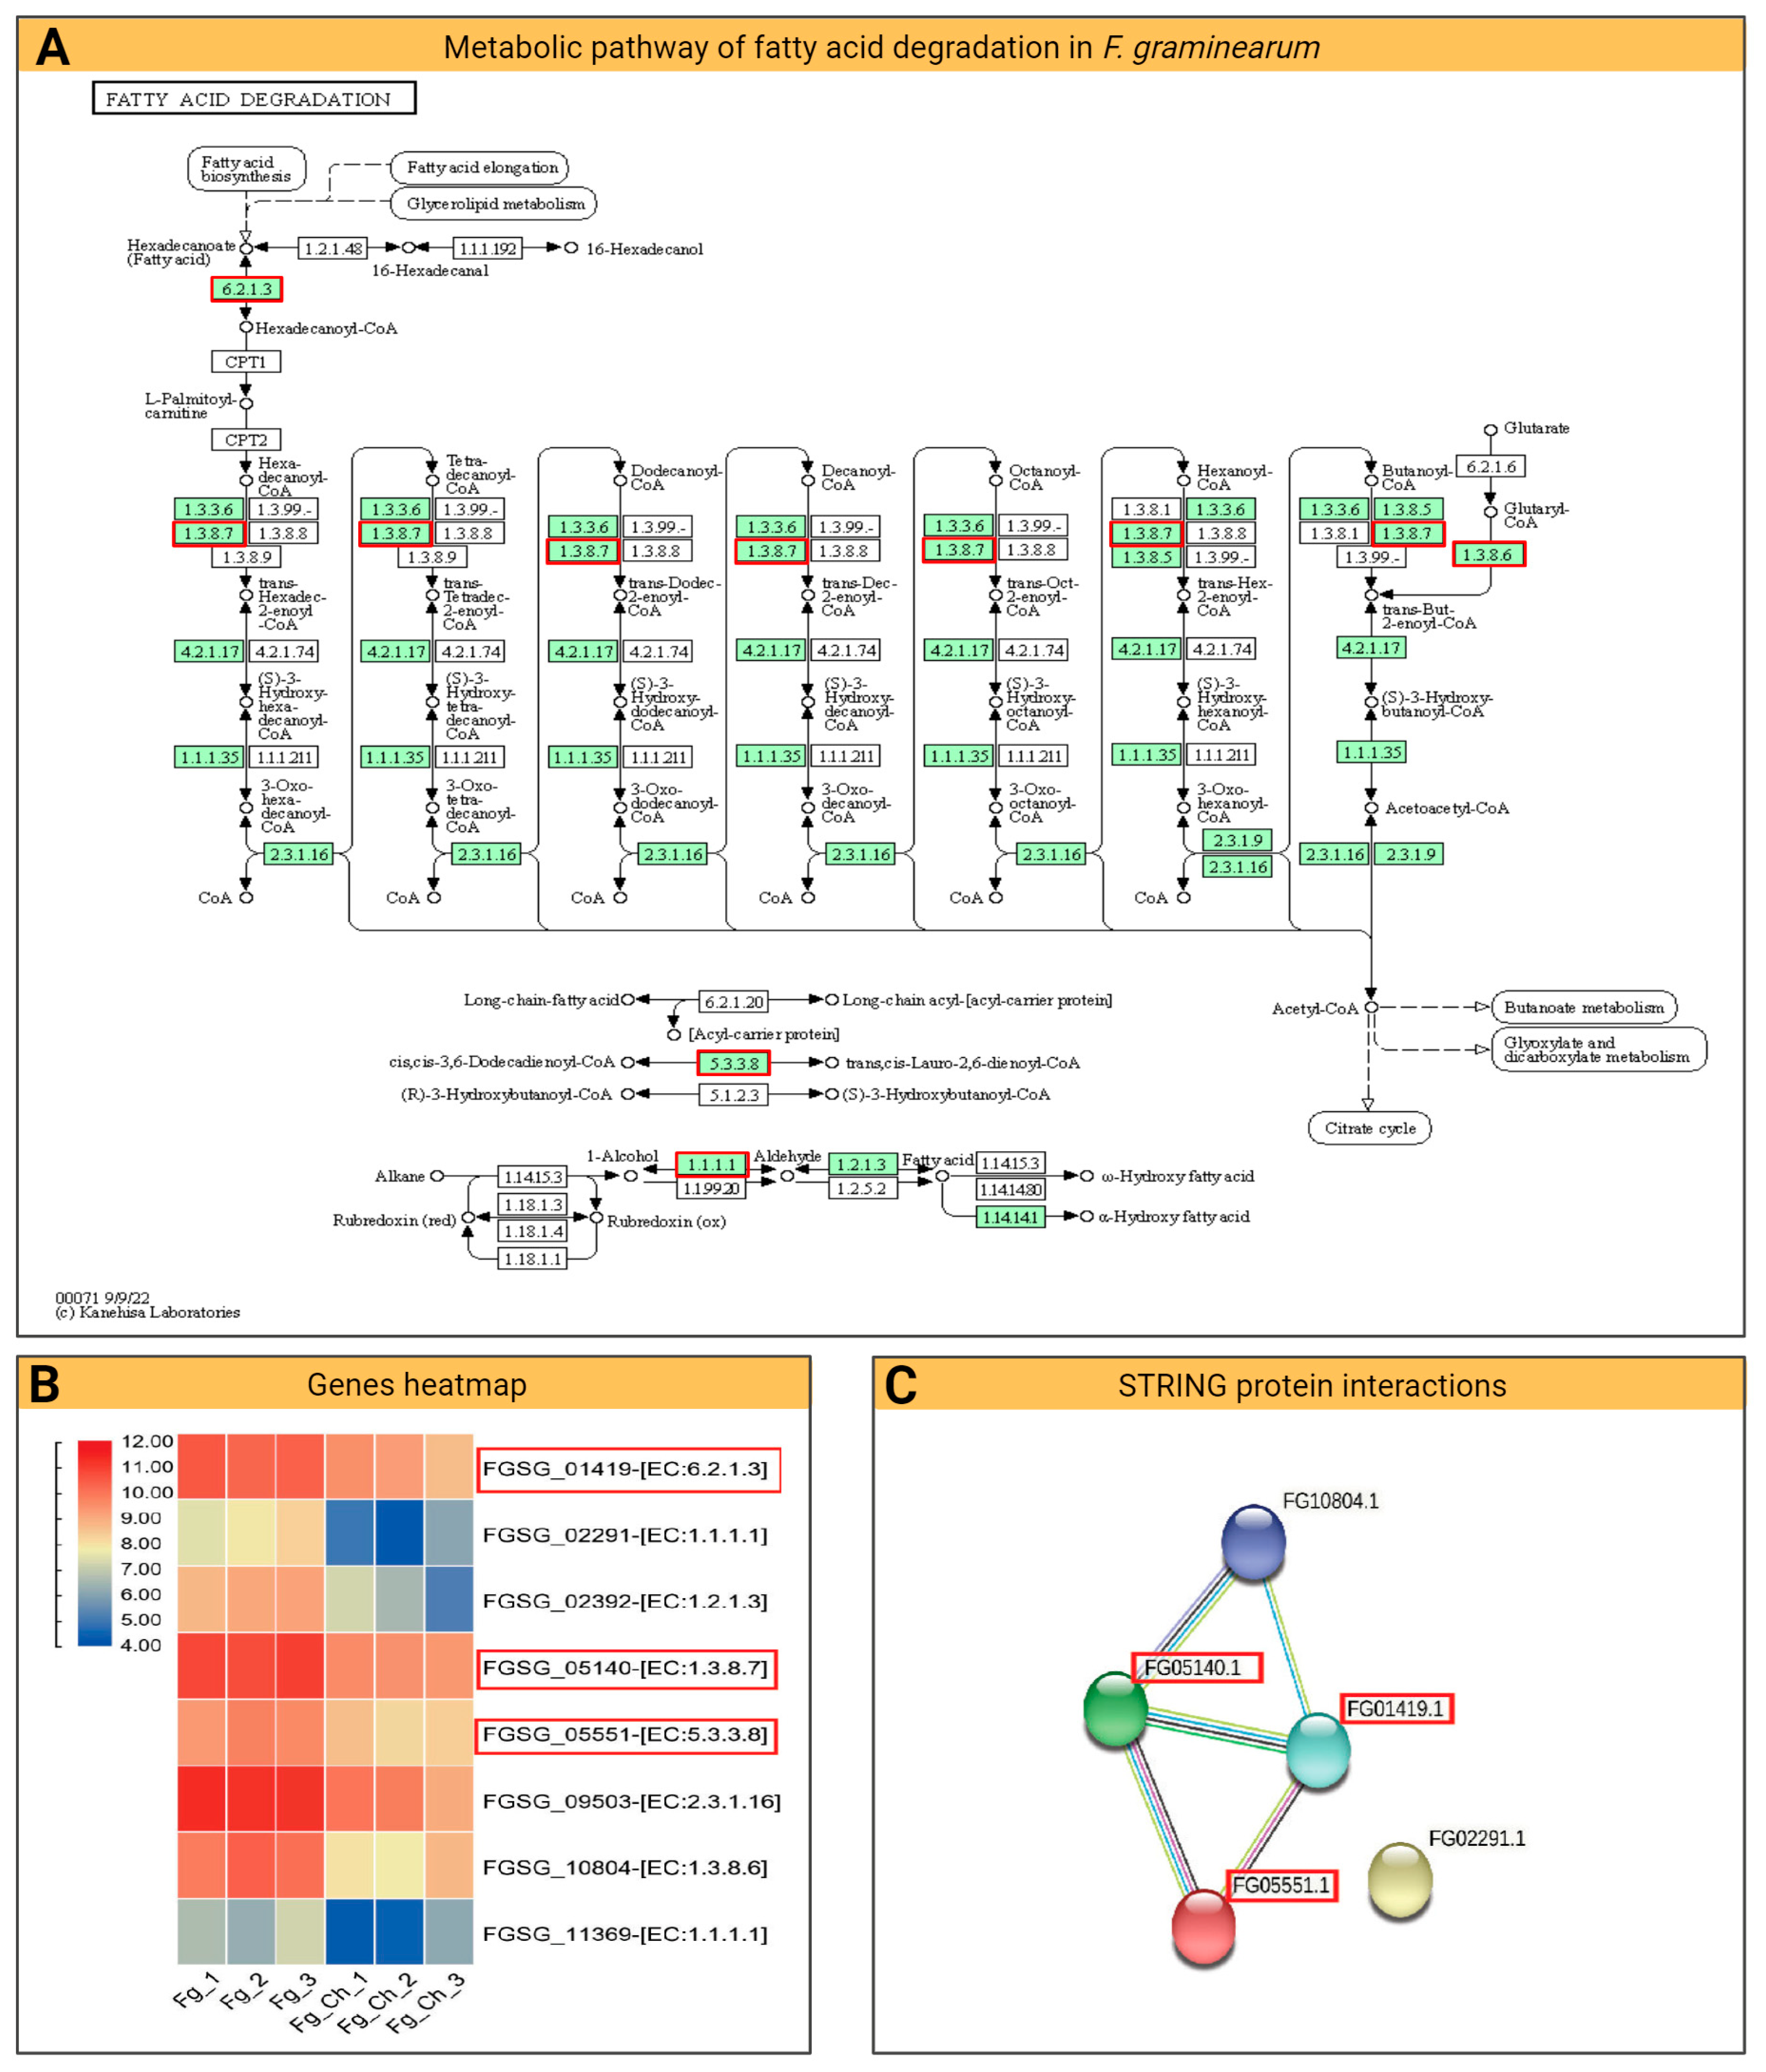
2.4.5. Fatty Acid Degradation Pathway

Fatty acid metabolism is important for the β-oxidation of fatty acids, the release of secondary metabolites, and the catalytic degradation of reactive oxygen species (ROS). Fatty acid pathways are involved in Fg pathogenicity [35], colonization in different hosts [36], maintaining cell wall integrity [37], and vegetative and reproductive growth of fungi [38]. Here, in this study, CS_10 used at 200 ppm significantly affected the Fg transcriptome and down-regulated several genes that are primarily involved in the metabolic pathways of fatty acids (Figure 9). The key genes found in multiple cores of the fatty acid pathways are FGSG_05140, FGSG_05551, and FGSG_01419. The FGSG_01419 gene is involved in the conversion of hexadecanoyl-CoA to hexadecanoate during fatty acid degradation. The paralogue of this gene in F. asiaticum revealed a role in virulence and vegetative growth when observed through mutation studies. More specifically, deletion mutants of the two septin genes (FaCdc3 and FaCdc12) in wheat-infecting F. asiaticum showed reduced levels of DON in wheat kernels, restricted mycelial growth, and irregular hyphae [39]. Here, the CS_10 application reduced the expression of this gene (FGSG_01419) by up to 0.433 times (Supplementary Table S2), which could reduce the metabolism of fatty acids. Similarly, another gene, FGSG_05140, down-regulated by 0.386 times (Supplementary Table S2), was found to function in several stages of fatty acid degradation pathways. The Fg FGSG_05551 is another critical gene that has catalytic activity in the conversion of long-chain fatty acids into short-chain fatty acids. Here, a down-regulation of 0.436 (Supplementary Table S2) was observed after treatment with CS_10.

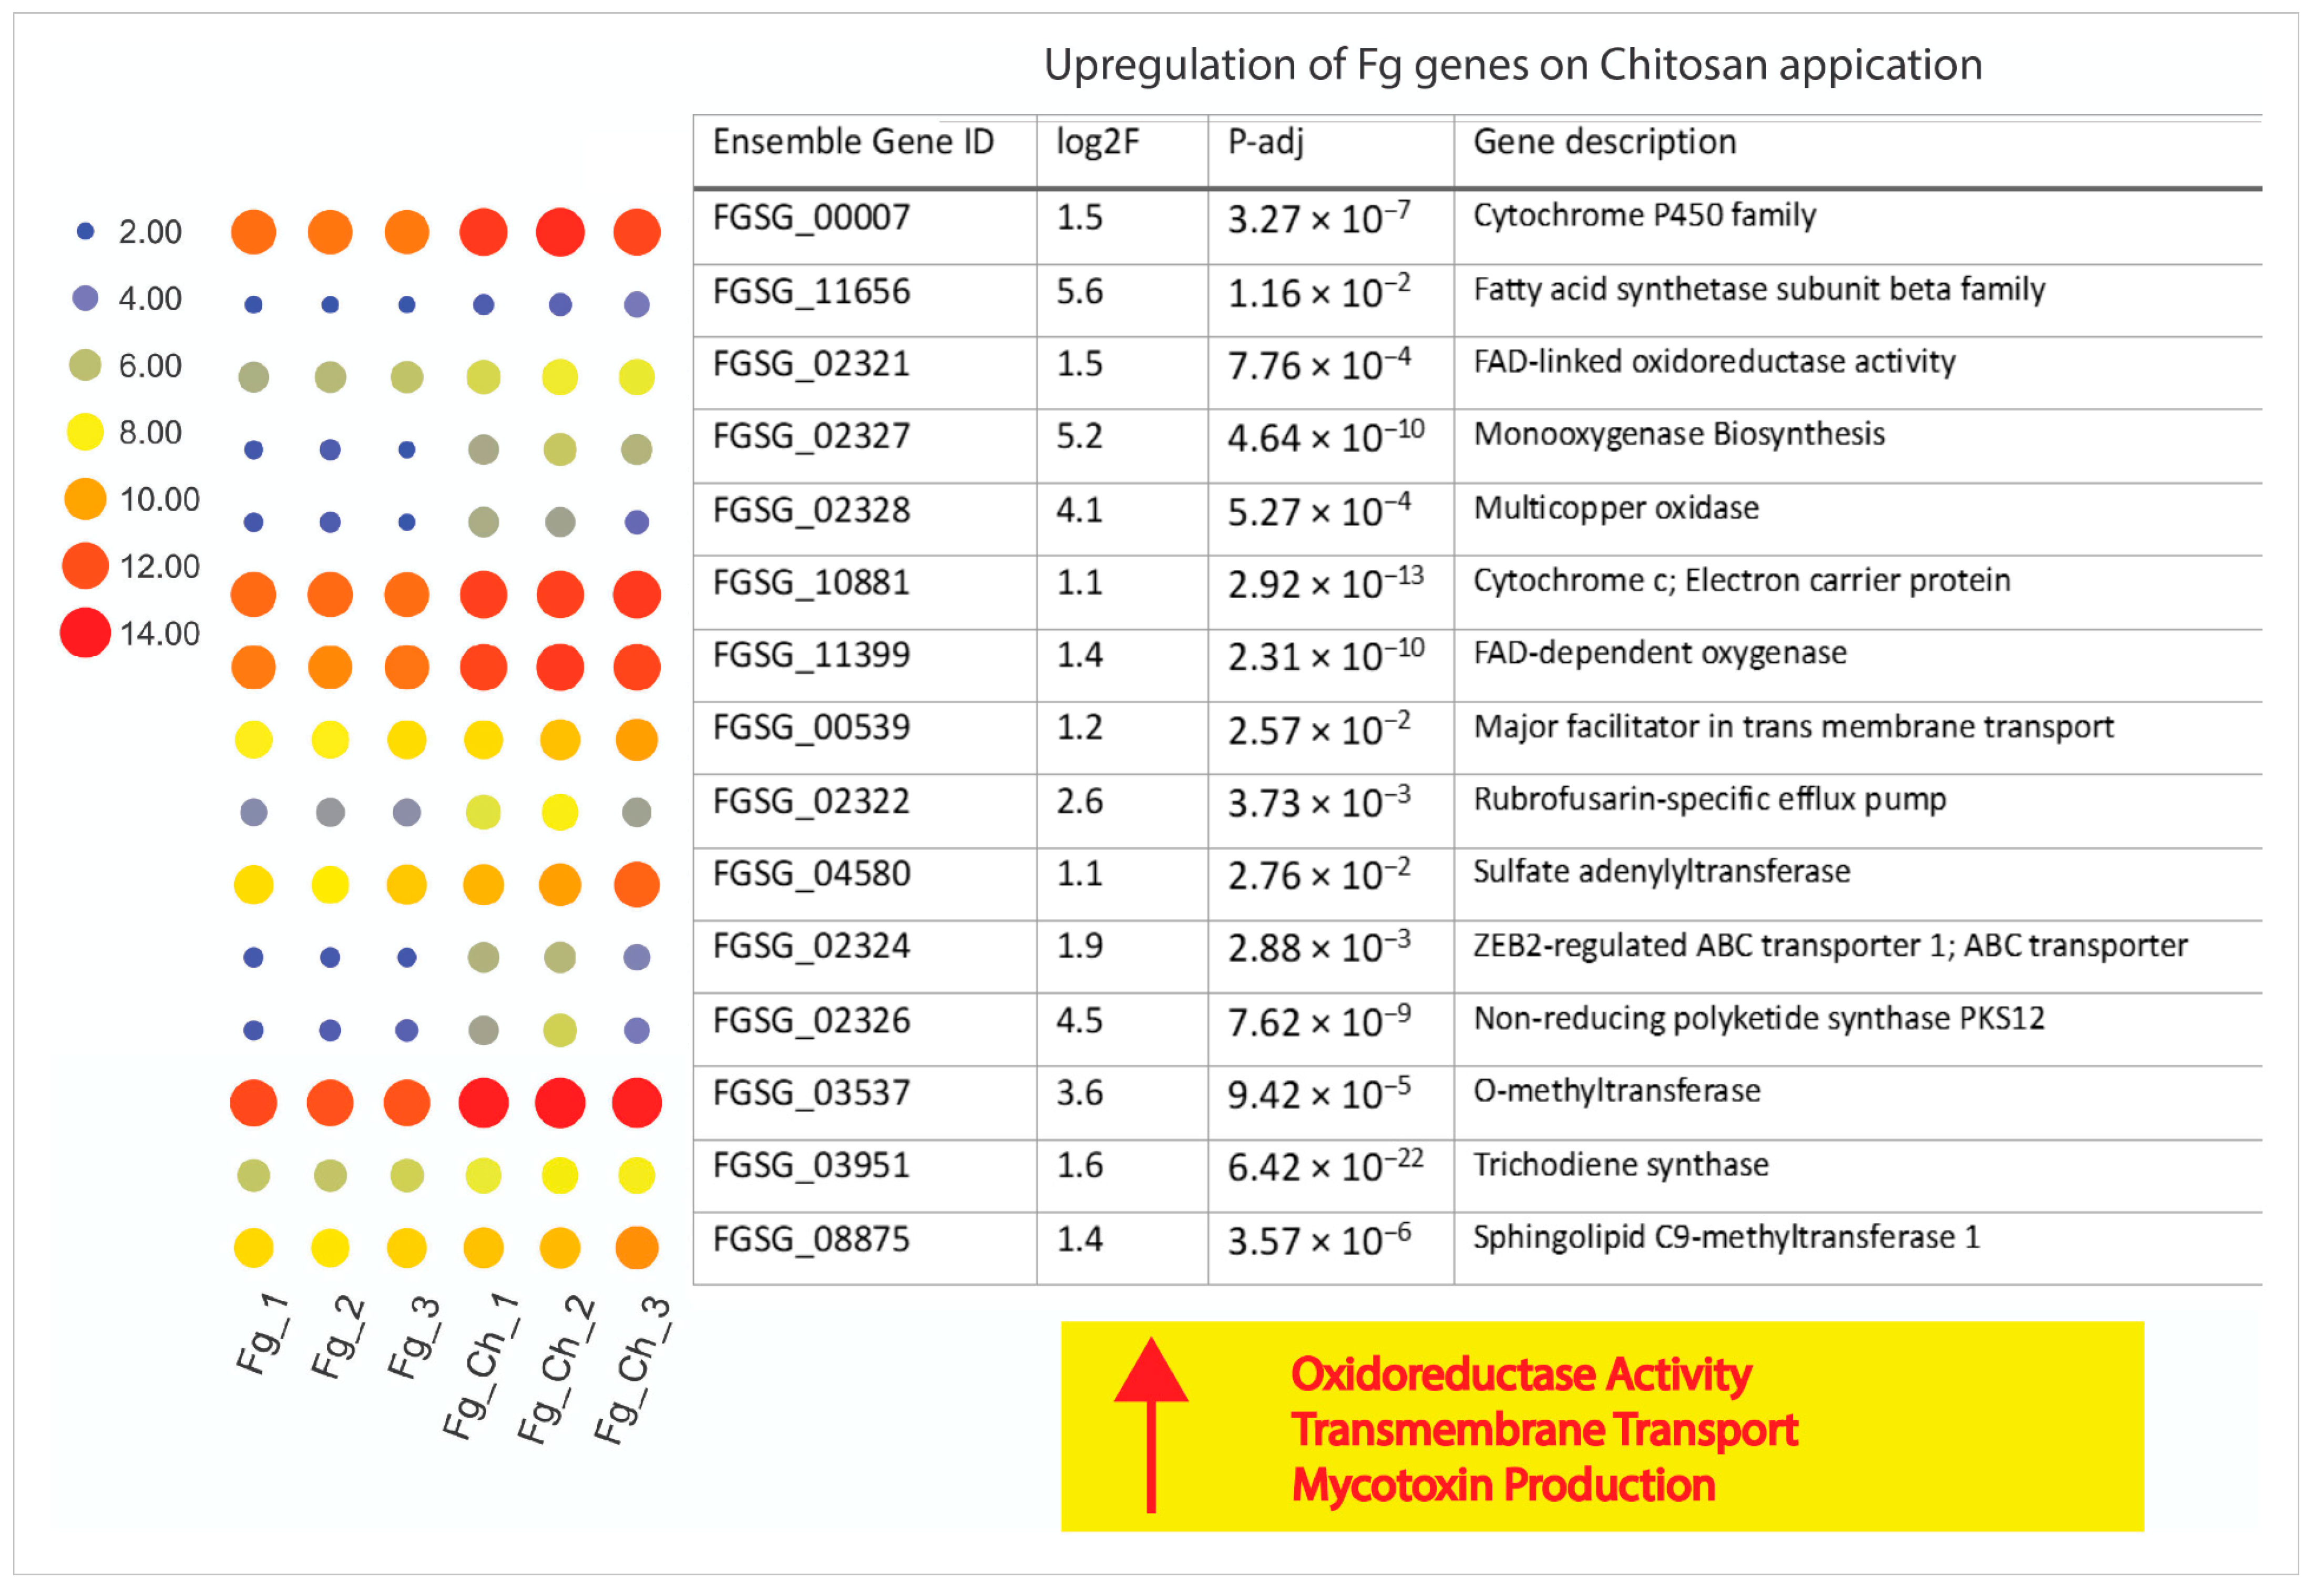
2.4.6. Chitosan Treatment Up-Regulates Stress-Responsive Genes of F. graminearum

CS_10 triggered a transcriptome response in Fg and was measured in terms of some major molecular functions such as oxidoreductase, transmembrane transport, and mycotoxin production. Significant up-regulation of genes involved in ergosterol biosynthesis and cell wall synthesis is a type of antistress strategy adopted by Fg. For example, FGSG_11656 is involved in fatty acid synthase activity regulated by S-acetyltransferase activity, enoyl-[acyl-carrier-protein] reductase (NADH) activity, and/or transferase activity. The gene showed a strong up-regulation of 48.370 times after CS_10 treatment (Supplementary Table S2). The synthesis of fatty acids is important for vegetative growth and for the response to stress in eukaryotes. In Fg, deletion mutation of the ergosterol pathway gene (elongase gene; Fg ELO2) decreased fungi sensitivity to tebuconazole and also reduced virulence [40]. In the case of chitosan-treated Fg, we observed a strong up-regulation of genes connected directly with response to oxidative stress such as: catalase 1 (FGSG_06554), catalase 3 (FGSG_06733), catalase 4 (FGSG_12369) up-regulated, respectively, 6.32, 4.02 and 2.18 fold [41].
Superoxide dismutases, as ROS scavengers, are the first line of defense against stressful situations. Here, 17,036- and 36,843-fold up-regulations of the multicopper oxidase (FGSG_02328) and flavin adenine dinucleotide (FAD) protein (FGSG_02327), respectively, were a strong response against chitosan CS_10 treatment (Figure 10, Supplementary Table S2). Up-regulation of superoxide dismutases (Cu-Zn) in Fg corresponds to the elimination of ROS and the enhancement of virulence in wheat head infections [42]. The response of Fg to oxidative stress is related to the synthesis of mycotoxins [41]. The transcription factor Fgap1 (FGSG_08800) (1.2-fold change) activates the transcription of antioxidant enzymes while affecting the regulation of Tri genes and the production of trichothecenes [41,43].

2.4.7. qPCR Validation of RNA-Seq Data

The expression of selected genes by qPCR verifies the results of the RNA-Seq data (Supplementary Figure S2). To confirm this, we selected four different genes from Fg that showed significant down- and up-regulation after treatment with CS_10. The same template RNA used for mRNA sequencing was subjected to qPCR and relative quantification was measured using the 2−ΔΔCt method. The strongest down-regulation was observed in the case of the FGSG_00571 gene (0.005-fold change) and was also consistent with lower expression in the qPCR data. Similarly, the up-regulated expression of FGSG_0007 was consistent with the qPCR data, and the results confirmed the RNA-Seq approach to quantify the expression. Previously, several articles have used qPCR as an alternative to gene expression data to verify the authenticity of results [27,40,44].

3. Materials and Methods

3.1. Materials

In this study, a set of CS batches, representing various physicochemical parameters (viscosity, molecular weight, degree of deacetylation) and of different origins from different providers were used (Table 1). Acetic acid (99.5–99.9%) was supplied by POCH, Poland. Sodium hydroxide (NaOH) was supplied by POCH, (Warsaw, Poland), and Trypan blue was supplied by Pol-Aura, (Warsaw, Poland). Potato dextrose agar (PDA) and Potato dextrose broth (PDB) were supplied by ROTH, (Karlsruhe, Germany). Milli-Q water was used to prepare dilutions of the CS samples.

3.2. Methods

Different methods were used to evaluate the antifungal effects of chitosan on Fg growth. Fg toxin production was also analyzed. The following section describes the methods involved in these experiments.

3.2.1. Chitosan Solution Preparation

The stock solution of each CS sample was prepared in the same manner. An amount of 3 g of specified CS was dissolved in 1 L of Milli-Q water containing 1% acetic acid (pH 3.0). The solution was stirred overnight at room temperature. The stock solution was then diluted with Milli-Q water at different concentrations, and the pH of the solution was set at pH 5.6 with NaOH. The solutions were then filtrated (0.22 µm).

3.2.2. Production of Macroconidia of F. graminearum

The F. graminearum BW5 strain was obtained from the collection of the Plant Breeding and Acclimatization Institute (Radzikow, Poland). For this purpose, Fg was cultured on a plate with PDA medium for several days and then inoculated through 3–4 cm2 pieces of PDA into a 150 mL autoclaved medium (adapted V8) containing 170 mL/L potato and vegetable juice (Fortuna®, Poland) and 1.5 g/L calcium carbonate in a 500 mL flask. The flasks were shaken in a rotating incubator at 120 rpm at 25 °C under UV for 2 weeks. The presence of macroconidia was checked under a light microscope (Nikon®, Tokyo, Japan). The mixture was filtered through autoclaved Miracloth. The final macroconidia concentrations were counted under a light microscope (Nikon®, Tokyo, Japan) using the Fuchs–Rosenthal counting chamber. Macroconidia were stored at −80 °C.

3.2.3. Determination of the Impact of Chitosan on F. graminearum Growth

  • Antifungal activity of various batches of chitosan
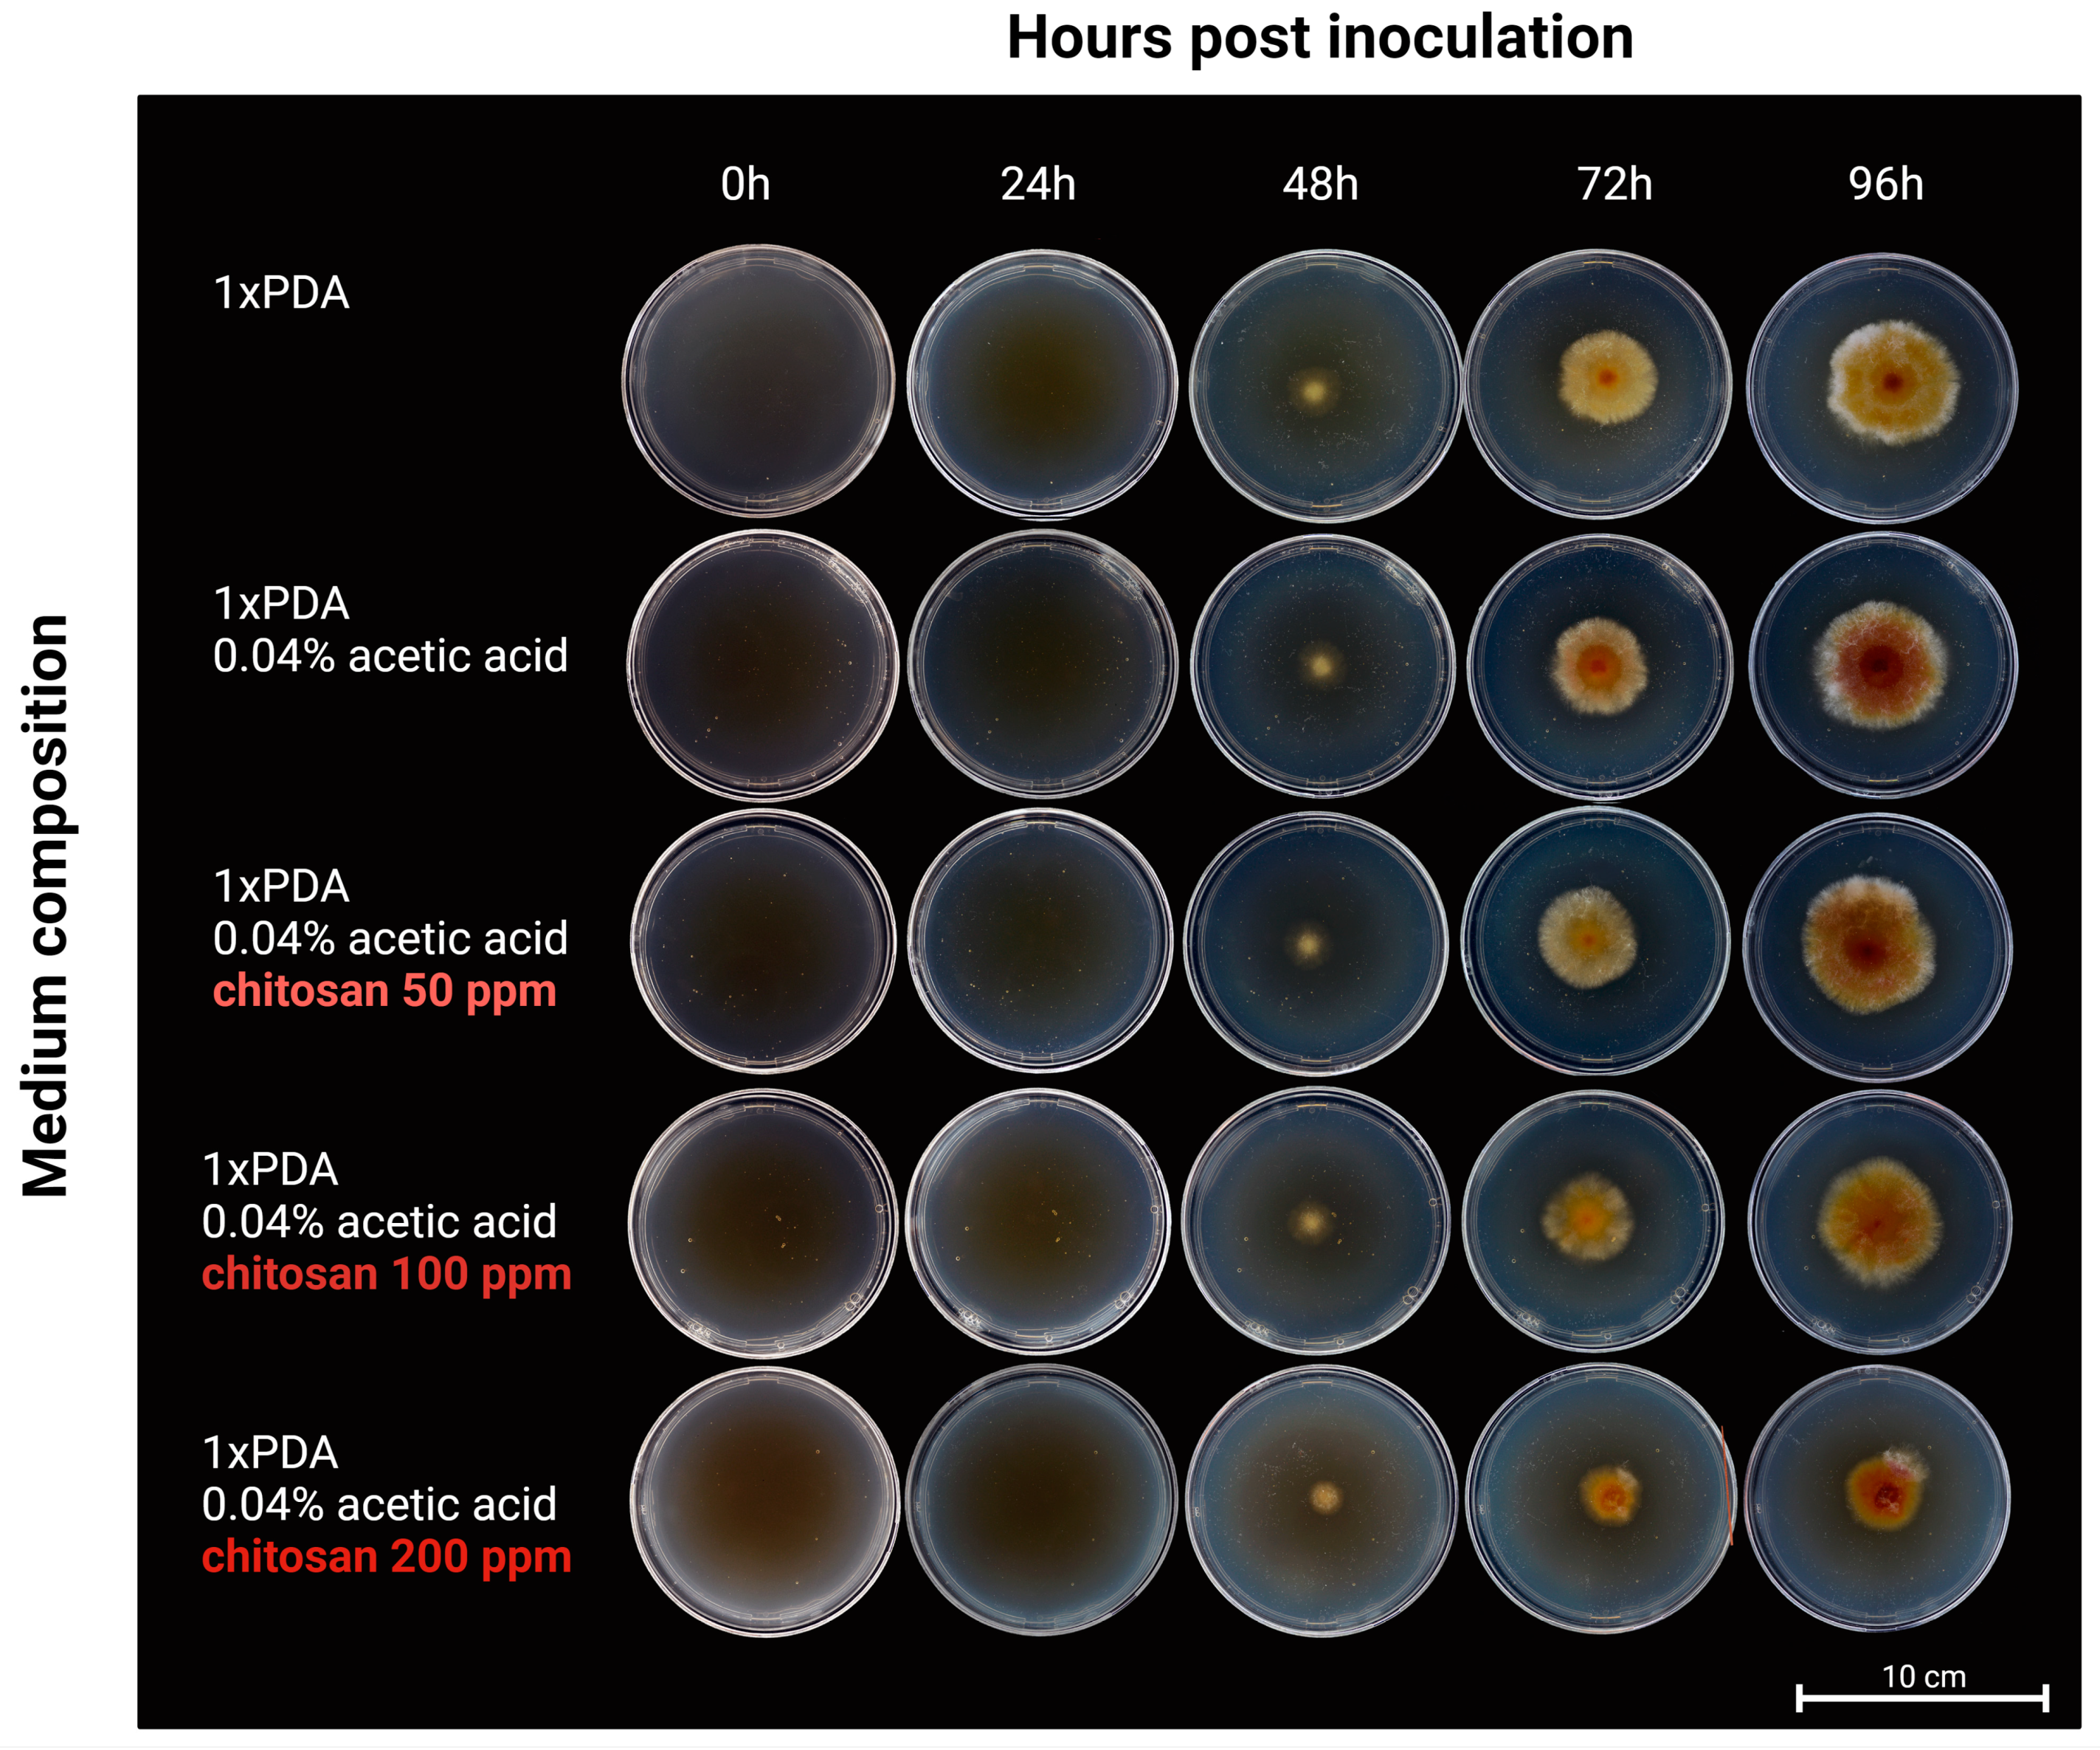
A 96-well microtiter plate assay was used to determine the antifungal activity of each batch of CS. Each well in the plate contained PDB medium supplemented with 50, 100, and 200 ppm of the tested CS sample. The wells were inoculated by adding 10 µL of Fg macroconidia suspension (1 × 10⁵ spores/mL). The plates were incubated for 120 h in the dark at 25 °C. At the indicated time points, the optical density (OD450) of each well was measured. Relative optical density was counted by subtracting read-outs from the noninoculated wells, which acted as a background. Each measurement was related to control wells containing PDB medium, inoculated with Fg, but without the addition of CS.
  • Petri plates assay
The batch of CS with the strongest antifungal activity CS_10 was further tested to determine the effect of CS on Fg surface growth in the PDA culture. To confirm the results of the in vitro microtiter assay in Petri plate assay, 10 μL of macroconidia suspension (1 × 10⁵ spores/mL) was added to the center of the PDA medium supplemented with CS_10 at a concentration of 0 (control), 50, 100, and 200 ppm. Photos were taken after each 24 h interval.
  • Time-dependent response of Fg macroconidia and mycelium to chitosan application
To investigate the time-dependent response of Fg to chitosan application, the PDB Fg culture was carried out on two Fg developmental stages: macroconidia and mycelium. The PDB culture carried out in a 96-well microplate was inoculated alternatively with 10 µL of Fg macroconidia suspension (1 × 10⁵ spores/mL), or with freshly grown Fg mycelium transferred by a pipette tip. Each well was supplemented with 200 ppm of CS_10 for 0, 8, 20, 30, and 42 h after inoculation (Figure 3) and the culture was carried out up to 100 h in the dark, at 25 °C. The Fg growth was monitored by measuring optical density (OD450) of each well.
  • F. graminearum macroconidia Trypan blue viability test
To further investigate the impact of CS on Fg macroconidia, Trypan blue staining was used. The protocol was adopted from Boenisch and Schäfer [45]. For this purpose, PDB medium (100 µL) supplemented with CS_10 (200 ppm) was inoculated with macroconidia suspension (1 × 10⁵ spores/mL). Trypan blue (100 μL) was added and incubated at 25 °C in the dark for 20 min. The whole suspension was mixed by pipping and 10 μL was transferred to a glass slide for examination of Fg macroconidia under a white-light microscope (Nikon®, Tokyo, Japan).
  • Statistical analysis
The data presented in the graphs are the mean ± standard error of three replicates of each treatment. The ANOVA test and the least significant difference (LSD) post hoc test were performed using Statistix software (Statistics 8.1, Analytical Software®, Tallahassee, FL, USA). Results were designated significant at p < 0.05 * and designated with different * symbols.

3.2.4. Inoculating Barley Leaves with F. graminearum

Seeds of Hordeum vulgare cv. Golden Promise were placed on glass balls inside a Petri plate with the addition of water. The seeds were imbibed for 24 h (4 °C, dark) and 48 h for initial germination (21 °C, dark). The germinated seeds were planted in plastic pots (15 cm × 10 cm) filled with substrate soil (Aura-Hollas®, Paslek, Poland). The plants were grown for one week under controlled conditions (20 °C with a 16 h light/8 h dark photoperiod). For fungal inoculum, 1 mL of Fg macroconidia suspension (2 × 10⁵ conidia/mL) was added to the Eppendorf tube with 1 mL of 10% PDB to induce germination. BREAK-THRU S301 surfactant (Evonik®, Essen, Germany) was added to the final concentration of 0.01%. Two droplets (20 μL each) of this inoculum mix were placed on the distal parts of the barley leaf. The entire plant was covered under a cellophane foil hood to maintain a relatively high humidity inside and placed in the dark for 24 h after inoculation. After 24 hpi, the cellophane hood was removed and barley leaves were sprayed with CS_10 at a concentration of 200 ppm.

3.2.5. Deoxynivalenol Analysis in Barley Leaf Samples

The pre-weighed barley leaf samples (580–990 mg) were homogenized in 50 mL Falcon tubes in 5 mL of water with the Unidrive homogenizer (CAT Scientific®, Paso Robles, CA, USA) for 2 min. The samples were centrifuged (MPV, Med. Instruments®, Poland) at 10,730× g for 10 min, and 4 mL of collected supernatant was diluted with 2 mL of phosphate-buffered saline (PBS). A total of 3 mL of the mixture was passed through the immunoaffinity column (IAC) adapted for DON isolation (Vicam®, Milford, MA, USA) at a rate of 1–2 drops per second. Subsequently, the column was rinsed with 2 mL of PBS and 2 mL of deionized water at a rate of 2–3 drops per second. The analytes were eluted from the column first with 0.5 mL of methanol and then with 1.5 mL of acetonitrile. The eluate was collected in a reaction bowl and the solvent was evaporated under a stream of nitrogen. The samples were redissolved in 10% acetonitrile solution and the extract was filtered through a 0.45 µm nylon syringe filter. Each test sample was prepared in two independent replicates. Each independent replicate (on the same sample extract) was prepared twice.
The analytes were analyzed using the technique of high-performance liquid chromatography coupled with a UV detector (A Knauer® K 1001 HPLC instrument, Berlin, Germany). The analyses were separated on a Cosmosil 5C18-AR-II, 4.6 mm × 250 mm chromatography column (Nacalai Tesque, Kyoto, Japan) thermostatic at 45 °C. Analytes were separated in the isocratic mode. The mobile phase was an aqueous solution of acetonitrile (10%) with a flow rate of 1 mL/min. The analytical wavelength set on the UV detector was 218 nm. To determine the concentrations of the tested analytes in the samples, seven-point calibration curves were prepared. These curves were created as a result of the analysis of a mixture of standard solutions prepared by successive dilutions of 0.05 and 1.60 µg/kg of DON and DON-3G, respectively. The calibration curves were characterized by high values (>0.99) of the R2 coefficients. The limits of detection (LOD) and limits of quantitation (LOQ) values were determined on the basis of signal-to-noise (S/N) analysis. For LOD and LOQ, these were the analyte concentration values at which the S/N was 3 and 10, respectively. LOD values for DON and DON-3G were 150 and 180 µg/kg, respectively, while LOQ values were 500 and 600 µg/kg for DON and DON-3G, respectively. Recovery (R%) and repeatability of the method (expressed as relative standard deviation, RSD%) were also determined for fortified barley leaf samples (600–2400 µg/kg). Depending on the level of fortification and the analyte analyzed, the recovery value of the method ranged was from 91 to 109%, while repeatability did not exceed 14%.

3.3. RNA-Seq Data Analysis

3.3.1. RNA Extraction and mRNA Sequencing

Total RNA was extracted from 100 mg of barley leaves infected with Fg using the RNA isolation kit (Zymo-R2072, Irvine, CA, USA), RNA extraction buffer (50 mM Tris-HCl pH = 8.0, 150 mM LiCl, 5 mM EDTA pH = 8.0, 1% SDS), Trizol reagent, and phenol: chloroform (1:1), 80% ethanol) according to the manufacturer’s protocol. The isolated RNA was quantified using a NanoDrop spectrophotometer (NanoDrop Technologies®, Wilmington, DE, USA). Quality was assessed using 1% agarose gel and running on BioAnalyzer 2100 (Agilent Technologies®, Santa Clara, CA, USA). Samples having 260/A280 > 2.0, RIN > 8, and concentration >50 ng/µL were selected for downstream applications. Approximately 2 μg of high-quality RNA was sent to a biotech company (GENEWIZ®, Leipzig, Germany) to prepare the Illumina standard RNA library with polyA selection. The company performed Illumina NovaSeq sequencing with an estimated data output of ~20 M paired-end reads with a quality score of Q30. The company provided FASTQ format data that were used for further analysis.

3.3.2. The Quality Control and Mapping Sequence Read

The FastQ raw data were processed for quality control checks using the FastQC toolkit v0.12.0 (https://www.bioinformatics.babraham.ac.uk/projects/fastqc/, accessed on 14 December 2022) with standard command lines. High quality reads with sufficient base length (Phred Score > 30) were retained, while all the low quality reads and adapter sequences were subsequently trimmed using Trimmomatic program (http://www.usadellab.org/cms/?page=trimmomatic, accessed on 17 December 2022) [46]. The genome of Fg (Assembly: GCA_000240135.3) and the gene annotation file (GFF3) was retrieved from EnsemblFungi (https://fungi.ensembl.org/index.html, accessed on 17 December 2022). The trimmed reads were aligned to the reference genome using Bowtie v2.5.0 [47] with default settings. The output alignment (.sam) was converted to a .bam file using SAMtools. The transcript reads were counted using featureCounts [48], and the differential expression analysis was performed using DESeq2 (Bioconductor R package) [49]. Genes with false discovery rate (FDR, adjusted p-value) < 0.05 and log2 fold change > 2 between two experimental conditions were designated as differentially expressed genes (DEG).

3.3.3. Analyzing RNA-Seq Outputs

To determine the variations between treatment samples, a two-dimensional principal component analysis (PCA) was performed using the Bioconductor R PGSEA package (https://www.bioconductor.org/packages//2.10/bioc/html/PGSEA.html, accessed on 20 December 2022). The percentage variance was detected with the default settings that depend on the adjusted p-values to rank the specific gene set pathways according to biological processes. For functional enrichment analysis (Gene ontology (GO), and Kyoto Encyclopedia of Genes and Genomes (KEGG)), the iDEP server was used to interpret the data with an FDR cutoff < 0.05 [50]. GO data were used to find gene groups involved in specific biological processes (BP), molecular functions (MF), and cellular components (CC) with a significant p-value of 0.05 and log2 fold change > 2.0. Other expression patterns such as k-means clustering were performed for the top 2000 DEGs to look for their participation in different processes across all samples [50]. Other general features such as heatmaps, volcano plots, and MA plots were also constructed using the iDEP web portal (http://bioinformatics.sdstate.edu/idep96/, accessed on 20 December 2022) to obtain meaningful results. To detect the DEG expression networks, we used the WGCNA package in R through the iDEP network analysis tool. This package utilizes the normalized gene expression data to find co-expression networks which can be visualized in Cytoscape [51]. Protein–protein interaction networks were drawn by using the top DEGs in the selective pathway in the STRING server (https://string-db.org/, accessed on 21 December 2022). The targeted organism was Fusarium graminearum and multiple protein interactions were identified with the following parameters: Network Type; full STRING network; required score; medium confidence (0.400) and FDR stringency; medium (5%).

3.4. Quantitative Real-Time PCR (qRT-PCR) of Selected F. graminearum Genes

Total RNA extracted (Section 3.3.1) was treated with 2 U of RiboLock RNase inhibitor and 2 U of DNase1 (Roche Diagnostics®, Munich, Germany) to remove genomic DNA impurities. To confirm the absence of DNA traces, 100 ng of DNase-treated RNA was subjected to a polymerase chain reaction (PCR) with Fg-Elongation Factor 1 (FGSG_08811; [52]) gene primers (Supplementary Table S1) for possible genomic amplification. The lack of any template product after 37 cycles of amplification confirmed the purity of DNA-free template RNA. Then, 2 µg of this RNA was subjected to cDNA synthesis using the RevertAid First Strand cDNA Synthesis Kit (ThermoFisher Scientific®, Waltham, MA, USA) following the manufacturer’s instructions. A 50:50 ratio of Oligo-dt and random hexamer primers was used to synthesize the maximum length of the cDNA templates. The resulting cDNA reaction mixture (5-fold dilution) was used as a template for quantitative PCR (qPCR). The relative expression of fungal genes was estimated using the 2−ΔΔCt method, as previously described [53]. The standard qPCR reaction mix was composed of 2 µL of 5× HOT FIREPol EvaGreen qPCR Mix Plus (ROX) (Solis Biodyne®, Tartu, Estonia), 0.3 µL of primer F (10 µM), 0.3 µL of primer R (10 µM), 15 ng of template cDNA, and water to 10 µL. Quantification values for the transcripts represent a medium with a minimum of three biological replicates and three technical repeats for each. The primers used for qPCR are listed in Table S1.

3.5. Estimation of F. graminearum in Barley Leaves

To determine the amount of Fg in inoculated barley leaves, the transcript reads of the following Fg housekeeping genes were analyzed: Gamma-actin (FGSG_07335) [54], GAPDH (FGSG_06257), EF1A (FGSG_08811), and B-tubulin (FGSG_09530) [52,55]. The transcript reads of each selected housekeeping gene, based on featureCounts, were compared between Fg inoculated barley leaves not treated with CS_10 (Fg) and treated with CS_10 (Fg_CS variant). The results were shown as the relative number of reads of the transcripts of each Fg selected gene.

4. Conclusions

The collection of different batches of CS showed different antifungal properties, indicating that this type of biological activity depends on the physicochemical properties of a particular CS sample. Based on the results of the microtiter and Petri plates assays, CS_10 showed the strongest effect on the growth of Fg. It was selected for all other studies and used at a concentration of 200 ppm. Batches of medium to high MW showed decreasing antifungal activities, clearly lower compared to CS-10. Batches of oligo chitosan with very low MW showed very weak antifungal properties, barely detectable at a concentration of 200 ppm.
The experimental time points, 48 hpi for CS treatment, 120 hpi for collection of transcriptomics, metabolomics, and for evaluation of disease symptoms, were found to be the best. HPLC-based toxin quantification showed a significant, over 4.4-fold reduction in DON and DON-3G toxins in Fg inoculated and CS_10 treated leaves compared to the control.
The transcriptional response of Fg for CS_10 treatment, analyzed in the Fusarium-barley leaf pathosystem revealed a significant effect on gene expression with 730 down-regulated DEGs and 297 up-regulated DEGs. In particular, among the genes strongly down-regulated, we found a set of genes involved in carbohydrate and fatty acid metabolism. Furthermore, genes of the glycolysis pathway were strongly down-regulated, possibly restricting the supply of toxin precursors and negatively affecting fungal survival and pathogenesis. Strong up-regulation of Fg genes involved in the oxidative stress response was observed. Surprisingly, the Tri genes (Tri3, Tri4, Tri5, Tri7, Tri8, Tri11, Tri101), which are directly related to the synthesis of trichothecene mycotoxin, were also up-regulated.
The study indicates Fg genes that could be used as gene-specific targets for SIGS, HIGS, or CRISP/Cas strategies aiming at restricting pathogenesis. Furthermore, the biological properties of CS were explored, providing more information on the molecular basis of the antifungal activity of chitosan.

Supplementary Materials

The following supporting information can be downloaded at: https://www.mdpi.com/article/10.3390/ijms241612894/s1.

Author Contributions

W.O. perceived the idea and proposed the research outline. P.P. and A.H. performed the experiments and wrote the first draft of the manuscript. M.D.-B. prepared the macroconidia, qPCR and helped in data analysis. M.B. performed the mycotoxin analysis. All authors have read and agreed to the published version of the manuscript.

Funding

This research was funded by the National Science Centre, Poland grant no 2019/35/B/NZ9/00323 (W.O.).

Institutional Review Board Statement

Not applicable.

Informed Consent Statement

Not applicable.

Acknowledgments

We apologize to colleagues whose relevant work could not be cited because of space restrictions, as well as for any unknown reasons. We thank anonymous reviewers for their constructive comments on the manuscript.

Conflicts of Interest

The authors declare no conflict of interest.

References

  1. Mielniczuk, E.; Skwaryło-Bednarz, B. Fusarium head blight, mycotoxins and strategies for their reduction. Agronomy 2020, 10, 509. [Google Scholar] [CrossRef]
  2. Dweba, C.C.; Figlan, S.; Shimelis, H.A.; Motaung, T.E.; Sydenham, S.; Mwadzingeni, L.; Tsilo, T.J. Fusarium head blight of wheat: Pathogenesis and control strategies. Crop Prot. 2017, 91, 114–122. [Google Scholar] [CrossRef]
  3. Alisaac, E.M.; Fusarium, A.-K. Head Blight on Wheat: Biology, Modern Detection and Diagnosis and Integrated Disease Management. Toxins 2023, 15, 192. [Google Scholar] [CrossRef]
  4. Chen, Y.; Kistler, H.C.; Ma, Z. Fusarium graminearum Trichothecene Mycotoxins: Biosynthesis, Regulation, and Management. Annu. Rev. Phytopathol. 2019, 57, 15–39. [Google Scholar] [CrossRef] [PubMed]
  5. Payros, D.; Alassane-Kpembi, I.; Pierron, A.; Loiseau, N.; Pinton, P.; Oswald, I.P. Toxicology of deoxynivalenol and its acetylated and modified forms. Forms. Arch. Toxicol. 2016, 90, 2931–2957. [Google Scholar] [CrossRef]
  6. Pinotti, L.; Ottoboni, M.; Giromini, C.; Dell’Orto, V.; Cheli, F. Mycotoxin contamination in the EU feed supply chain: A focus on cereal byproducts. Toxins 2016, 8, 45. [Google Scholar] [CrossRef]
  7. Bai, G.; Shaner, G. Management and resistance in wheat and barley to Fusarium head blight. Annu. Rev. Phytopathol. 2004, 42, 135–161. [Google Scholar] [CrossRef] [PubMed]
  8. Kumar, M.R.; Muzzarelli, R.A.; Muzzarelli, C.; Sashiwa, H.; Domb, A. Chitosan chemistry and pharmaceutical perspectives. Chem. Rev. 2004, 104, 6017–6084. [Google Scholar] [CrossRef]
  9. Wu, D.; Wan, J.; Lu, J.; Wang, X.; Zhong, S.; Schwarz, P.; Chen, B.; Rao, J. Chitosan coatings on lecithin stabilized emulsions inhibit mycotoxin production by Fusarium pathogens. Food Control 2018, 92, 276–285. [Google Scholar] [CrossRef]
  10. Poznanski, P.; Hameed, A.; Orczyk, W. Chitosan and Chitosan Nanoparticles: Parameters Enhancing Antifungal Activity. Molecules 2023, 28, 2996. [Google Scholar] [CrossRef]
  11. Francesconi, S.; Steiner, B.; Buerstmayr, H.; Lemmens, M.; Sulyok, M.; Balestra, G.M. Chitosan Hydrochloride Decreases Fusarium graminearum Growth and Virulence and Boosts Growth, Development and Systemic Acquired Resistance in Two Durum Wheat Genotypes. Molecules 2020, 25, 4752. [Google Scholar] [CrossRef] [PubMed]
  12. Buzón-Durán, L.; Martín-Gil, J.; Marcos-Robles, J.L.; Fombellida-Villafruela, Á.; Pérez-Lebeña, E.; Martín-Ramos, P. Antifungal Activity of Chitosan Oligomers–Amino Acid Conjugate Complexes against Fusarium culmorum in Spelt (Triticum spelta L.). Agronomy 2020, 10, 1427. [Google Scholar] [CrossRef]
  13. Al-Hetar, M.; Zainal Abidin, M.; Sariah, M.; Wong, M. Antifungal activity of chitosan against Fusarium oxysporum f. sp. Cubense. J. Appl. Polym. Sci. 2011, 120, 2434–2439. [Google Scholar] [CrossRef]
  14. Schenk, P.M.; Carvalhais, L.C.; Kazan, K. Unraveling plant–microbe interactions: Can multi-species transcriptomics help? Trends Biotechnol. 2012, 30, 177–184. [Google Scholar] [CrossRef] [PubMed]
  15. Sharma, C.M.; Vogel, J. Differential RNA-seq: The approach behind and the biological insight gained. Curr. Opin. Microbiol. 2014, 19, 97–105. [Google Scholar] [CrossRef]
  16. Hameed, A.; Poznanski, P.; Noman, M.; Ahmed, T.; Iqbal, A.; Nadolska-Orczyk, A.; Orczyk, W. Barley Resistance to Fusarium graminearum Infections: From Transcriptomics to Field with Food Safety Concerns. J. Agric. Food Chem. 2022, 70, 14571–14587. [Google Scholar] [CrossRef]
  17. Park, Y.-K.; Kim, M.-H.; Park, S.-C.; Cheong, H.-S.; Jang, M.-K.; Nah, J.-W.; Hahm, K.-S. Investigation of the antifungal activity and mechanism of action of LMWS-chitosan. J. Microbiol. Biotechnol. 2008, 18, 1729–1734. [Google Scholar]
  18. El-Mohamedya, R.; El-Aziz, M.A.; Kamel, S. Antifungal activity of chitosan nanoparticles against some plant pathogenic fungi in vitro. Agric. Eng. Int. CIGR J 2019, 21, 201–209. [Google Scholar]
  19. Lopez-Moya, F.; Kowbel, D.; Nueda, M.J.; Palma-Guerrero, J.; Glass, N.L.; Lopez-Llorca, L.V. Neurospora crassa transcriptomics reveals oxidative stress and plasma membrane homeostasis biology genes as key targets in response to chitosan. Mol. Biosyst. 2016, 12, 391–403. [Google Scholar] [CrossRef]
  20. Zhang, H.; Li, B.; Fang, Q.; Li, Y.; Zheng, X.; Zhang, Z. SNARE protein FgVam7 controls growth, asexual and sexual development, and plant infection in Fusarium graminearum. Mol. Plant Pathol. 2016, 17, 108–119. [Google Scholar] [CrossRef]
  21. Deshaies, M.; Lamari, N.; Ng, C.K.Y.; Ward, P.; Doohan, F.M. The impact of chitosan on the early metabolomic response of wheat to infection by Fusarium graminearum. BMC Plant Biol. 2022, 22, 73. [Google Scholar] [CrossRef] [PubMed]
  22. Steiger, J.H. Tests for comparing elements of a correlation matrix. Psychol. Bull. 1980, 87, 245. [Google Scholar] [CrossRef]
  23. McDermaid, A.; Monier, B.; Zhao, J.; Liu, B.; Ma, Q. Interpretation of differential gene expression results of RNA-seq data: Review and integration. Brief. Bioinform. 2019, 20, 2044–2054. [Google Scholar] [CrossRef]
  24. Weirauch, M.T.; Yang, A.; Albu, M.; Cote, A.G.; Montenegro-Montero, A.; Drewe, P.; Najafabadi, H.S.; Lambert, S.A.; Mann, I.; Cook, K. Determination and inference of eukaryotic transcription factor sequence specificity. Cell 2014, 158, 1431–1443. [Google Scholar] [CrossRef] [PubMed]
  25. Merhej, J.; Urban, M.; Dufresne, M.; Hammond-Kosack, K.E.; Richard-Forget, F.; Barreau, C. The velvet gene, FgVe1, affects fungal development and positively regulates trichothecene biosynthesis and pathogenicity in Fusarium graminearum. Mol. Plant Pathol. 2012, 13, 363–374. [Google Scholar] [CrossRef]
  26. Kimura, M.; Tokai, T.; O’Donnell, K.; Ward, T.J.; Fujimura, M.; Hamamoto, H.; Shibata, T.; Yamaguchi, I. The trichothecene biosynthesis gene cluster of Fusarium graminearum F15 contains a limited number of essential pathway genes and expressed non-essential genes. FEBS Lett. 2003, 539, 105–110. [Google Scholar] [CrossRef]
  27. Wang, L.-Q.; Wu, K.-T.; Yang, P.; Hou, F.; Rajput, S.A.; Qi, D.-S.; Wang, S. Transcriptomics Reveals the Effect of Thymol on the Growth and Toxin Production of Fusarium graminearum. Toxins 2022, 14, 142. [Google Scholar] [CrossRef]
  28. Wang, J.; Lin, S.; Zhu, G.; Zhao, Z.; Wang, H.; Zhou, M.; Zhao, X.; Wu, A. Identification of Candidate Genes Associated with Trichothecene Biosynthesis in Fusarium graminearum Species Complex Combined with Transcriptomic and Proteomic Analysis. Microorganisms 2022, 10, 1479. [Google Scholar] [CrossRef]
  29. Zhang, L.; Zhou, X.; Li, P.; Wang, Y.; Hu, Q.; Shang, Y.; Chen, Y.; Zhu, X.; Feng, H.; Zhang, C. Transcriptome Profile of Fusarium graminearum Treated by Putrescine. J. Fungi 2022, 9, 60. [Google Scholar] [CrossRef]
  30. Kanehisa, M.; Furumichi, M.; Tanabe, M.; Sato, Y.; Morishima, K. new perspectives on genomes, pathways, diseases and drugs. Nucleic Acids Res. 2017, 45, D353–D361. [Google Scholar] [CrossRef]
  31. Mering, C.V.; Huynen, M.; Jaeggi, D.; Schmidt, S.; Bork, P.; Snel, B. STRING: A database of predicted functional associations between proteins. Nucleic Acids Res. 2003, 31, 258–261. [Google Scholar] [CrossRef]
  32. Kanehisa, M. Toward understanding the origin and evolution of cellular organisms. Protein Sci. 2019, 28, 1947–1951. [Google Scholar] [CrossRef] [PubMed]
  33. Kanehisa, M.; Furumichi, M.; Sato, Y.; Kawashima, M.; Ishiguro-Watanabe, M. KEGG for taxonomy-based analysis of pathways and genomes. Nucleic Acids Res. 2023, 51, D587–D592. [Google Scholar] [CrossRef] [PubMed]
  34. Kanehisa, M.; Goto, S. KEGG: Kyoto encyclopedia of genes and genomes. Nucleic Acids Res. 2000, 28, 27–30. [Google Scholar] [CrossRef] [PubMed]
  35. Min, K.; Son, H.; Lee, J.; Choi, G.J.; Kim, J.-C.; Lee, Y.-W. Peroxisome function is required for virulence and survival of Fusarium graminearum. Mol. Plant-Microbe Interact. 2012, 25, 1617–1627. [Google Scholar] [CrossRef] [PubMed]
  36. Guenther, J.C.; Hallen-Adams, H.E.; Bücking, H.; Shachar-Hill, Y.; Trail, F. Triacylglyceride metabolism by Fusarium graminearum during colonization and sexual development on wheat. Mol. Plant-Microbe Interact. 2009, 22, 1492–1503. [Google Scholar] [CrossRef] [PubMed]
  37. Zhang, L.; Wang, L.; Liang, Y.; Yu, J. FgPEX4 is involved in development, pathogenicity, and cell wall integrity in Fusarium graminearum. Curr. Genet. 2019, 65, 747–758. [Google Scholar] [CrossRef]
  38. Kong, X.; Zhang, H.; Wang, X.; van Der Lee, T.; Waalwijk, C.; Van Diepeningen, A.; Brankovics, B.; Xu, J.; Xu, J.; Chen, W. FgPex3, a peroxisome biogenesis factor, is involved in regulating vegetative growth, conidiation, sexual development, and virulence in Fusarium graminearum. Front. Microbiol. 2019, 10, 2088. [Google Scholar] [CrossRef]
  39. Zhang, Y.; Gao, T.; Shao, W.; Zheng, Z.; Zhou, M.; Chen, C. The septins FaCdc3 and FaCdc12 are required for cytokinesis and affect asexual and sexual development, lipid metabolism and virulence in Fusarium asiaticum. Mol. Plant Pathol. 2017, 18, 1282–1294. [Google Scholar] [CrossRef]
  40. Wang, H.; Chen, Y.; Hou, T.; Jian, Y.; Ma, Z. The very long-chain fatty acid elongase FgElo2 governs tebuconazole sensitivity and virulence in Fusarium graminearum. Environ. Microbiol. 2022, 24, 5362–5377. [Google Scholar] [CrossRef]
  41. Montibus, M.; Ducos, C.; Bonnin-Verdal, M.N.; Bormann, J.; Ponts, N.; Richard-Forget, F.; Barreau, C. The bZIP transcription factor Fgap1 mediates oxidative stress response and trichothecene biosynthesis but not virulence in Fusarium graminearum. PLoS ONE 2013, 8, e83377. [Google Scholar] [CrossRef] [PubMed]
  42. Yao, S.-H.; Guo, Y.; Wang, Y.-Z.; Zhang, D.; Xu, L.; Tang, W.-H. A cytoplasmic Cu-Zn superoxide dismutase SOD1 contributes to hyphal growth and virulence of Fusarium graminearum. Fungal Genet. Biol. 2016, 91, 32–42. [Google Scholar] [CrossRef] [PubMed]
  43. Wu, C.; Chen, H.; Yuan, M.; Zhang, M.; Abubakar, Y.S.; Chen, X.; Zhong, H.; Zheng, W.; Zheng, H.; Zhou, J. FgAP1σ Is Critical for Vegetative Growth, Conidiation, Virulence, and DON Biosynthesis in Fusarium graminearum. J. Fungi 2010, 9, 145. [Google Scholar] [CrossRef]
  44. Puri, K.D.; Yan, C.; Leng, Y.; Zhong, S. RNA-Seq revealed differences in transcriptomes between 3ADON and 15ADON populations of Fusarium graminearum in vitro and in planta. PLoS ONE 2016, 11, e0163803. [Google Scholar] [CrossRef] [PubMed]
  45. Boenisch, M.J.; Schäfer, W. Fusarium graminearum forms mycotoxin producing infection structures on wheat. BMC Plant Biol. 2011, 11, 110. [Google Scholar] [CrossRef]
  46. Bolger, A.M.; MLohse; Usadel, B. Trimmomatic: A flexible trimmer for Illumina sequence data. Bioinformatics 2014, 30, 2114–2120. [Google Scholar] [CrossRef]
  47. Langmead, B.; Salzberg, S.L. Fast gapped-read alignment with Bowtie 2. Nat. Methods 2012, 9, 357–359. [Google Scholar] [CrossRef]
  48. Liao, Y.; Smyth, G.K.; Shi, W. FeatureCounts: An efficient general purpose program for assigning sequence reads to genomic features. Bioinformatics 2014, 30, 923–930. [Google Scholar] [CrossRef]
  49. Anders, S.; Huber, W. Differential Expression of RNA-Seq Data at the Gene Level—The DESeq Package; European Molecular Biology Laboratory (EMBL): Heidelberg, Germany, 2012; Volume 10, p. f1000research. [Google Scholar]
  50. Ge, S.X.; ESon, W.; Yao, R. iDEP: An integrated web application for differential expression and pathway analysis of RNA-Seq data. BMC Bioinform. 2018, 19, 534. [Google Scholar] [CrossRef]
  51. Saito, R.; Smoot, M.E.; Ono, K.; Ruscheinski, J.; Wang, P.-L.; Lotia, S.; Pico, A.R.; Bader, G.D.; Ideker, T. A travel guide to Cytoscape plugins. Nat. Methods 2012, 9, 1069–1076. [Google Scholar] [CrossRef]
  52. Harris, L.J.; Balcerzak, M.; Johnston, A.; Schneiderman, D.; Ouellet, T. Host-preferential Fusarium graminearum gene expression during infection of wheat, barley, and maize. Fungal Biol. 2016, 120, 111–123. [Google Scholar] [CrossRef] [PubMed]
  53. Song, X.-S.; Li, H.-P.; Zhang, J.-B.; Song, B.; Huang, T.; Du, X.-M.; Gong, A.-D.; Liu, Y.-K.; Feng, Y.-N.; Agboola, R.S. Trehalose 6-phosphate phosphatase is required for development, virulence and mycotoxin biosynthesis apart from trehalose biosynthesis in Fusarium graminearum. Fungal Genet. Biol. 2014, 63, 24–41. [Google Scholar] [CrossRef] [PubMed]
  54. Brown, N.A.; Bass, C.; Baldwin, T.K.; Chen, H.; Massot, F.; Carion, P.W.; Urban, M.; van de Meene, A.M.; Hammond-Kosack, K.E. Characterisation of the Fusarium graminearum-Wheat Floral Interaction. J. Pathog. 2011, 2011, 626345. [Google Scholar] [CrossRef]
  55. Kim, H.-K.; Yun, S.-H. Evaluation of Potential Reference Genes for Quantitative RT-PCR Analysis in Fusarium graminearum under Different Culture Conditions. Plant Pathol. J. 2011, 27, 301–309. [Google Scholar] [CrossRef]
Figure 1. Relative OD450 values of F. graminearum culture in PDB medium containing 0.01% acetic acid (control) and chitosan at concentrations of 50, 100, and 200 ppm. The OD450 readings were taken 120 h post inoculation. The red bar represents relative OD450 values of F. graminearum in the control medium (PDA with 0.04% acetic acid), medium values, and SD of the relative growth, and the significant p-values: *** p ≤ 0.001, * p ≤ 0.05.
Ijms 24 12894 g001
Figure 2. Antifungal activity of the chitosan batch CS_10 shown on PDA Petri plates. Representative pictures, taken at 0, 24, 48, 72, and 96 hpi of Petri plate culture of F. graminearum indicated different radii of mycelium on the control (PDA with 0.04% acetic acid) and in the PDA medium containing chitosan.
Ijms 24 12894 g002
Figure 3. Relative growth of F. graminearum in PDB medium (green) and in the PDB medium supplemented with chitosan CS_10 at 200 ppm final concentration (red) at the following time points: 0, 8, 20, 30, and 42 h post inoculation (hpi). The final OD450 values were measured at 98 hpi. The green lines represent the growth of Fg in the control PDB medium. The red lines represent the growth of Fg in the PDB medium supplemented with CS_10.
Ijms 24 12894 g003
Figure 4. Effect of chitosan on F. graminearum toxin production and infection symptoms in barley leaves: (A) The application of CS_10 at a concentration of 200 ppm significantly reduced the concentration of toxins (DON and DON-3G) in barley leaves measured at 72 hpi. (B) Necrosis symptoms in the positive control (Fg-infected barley leaves) and no/fewer symptoms in the Fg-infected barley leaves treated with CS_10 show the strong antifungal activity of CS. The photos were taken at 72 hpi.
Ijms 24 12894 g004
Figure 5. Response of F. graminearum to chitosan CS_10 at 200 ppm treatment: (A) Hierarchical clustering of DEGs that respond to Fg against treatment with CS_10 at 48 hpi. The red color shows induced genes, whereas the blue color shows repressed genes. (B) Hierarchical clustering based on Pearson correlation coefficients during experimental conditions. (C) The PCA of the transcriptome of six samples. Principal component 1 (PC1) describes the variance (51%) between biological replicates of Fg samples treated with CS_10 at 48 hpi. The principal component 2 (PC2) describes the variance (25%) between the biological replicates of the control samples of Fg.
Ijms 24 12894 g005
Figure 6. Overview of the transcriptome of F. graminearum after chitosan CS_10 treatment: (A) Volcano plot exhibiting default log2 fold change against adjusted p-value (0.05). (B) MA plot generated against log2 fold change ranging from −1 to 1 default threshold level. (C) K-means enrichment analysis clustering group of genes into four different groups (A, B, C, D) based on their core molecular and biological functions. Blue/red colors indicate down- or up-regulation respectively.
Ijms 24 12894 g006
Figure 7. Schematic illustration of the DON biosynthesis pathway in F. graminearum. The table represents the values of DEGs related to DON biosynthesis observed in this study. The CS_10 applications affected the Fg trichothecene pathways.
Ijms 24 12894 g007
Figure 9. Fatty acid metabolic pathways in F. graminearum and their relation to the transcriptome: (A) The KEGG pathway illustration of the fatty acid metabolic process in Fg cells. Reprinted/adapted with permission from Refs. [32,33,34], 2023, Kanehisa Laboratories. The red rectangles correspond to genes down-regulated after CS_10 treatment. (B) Heatmap of important Fg genes down-regulated with CS_10 treatment. Red corresponds to higher gene expression, while blue corresponds to lower gene expression. (C) Diagram of the protein–protein network showing the interaction among different genes. The red rectangles describe the significant genes.
Ijms 24 12894 g009
Figure 10. Up-regulation of F. graminearum genes after chitosan treatment. Heat map display of up-regulated genes corresponding to the abundance of their transcripts. The bigger the size of the dots, the more copies of that specific gene are expressed.
Ijms 24 12894 g010
Table 1. Characteristics of the chitosan batches used in this study.
No.Name of the SampleViscosity [cps]Molecular Weight [kDa]Degree of Deacetylation [%]OriginProvider
1CS_oligo_FNP *≤5NP *FungalPol-Aura
2CS_oligo_NP *≤5≥72ShrimpPol-Aura
3CS_5520≥90ShrimpGlentham
4CS_101030≥90ShrimpHMC+
5CS_8-158–1520–10087.6–92.5ShrimpPol-Aura
6CS_10-12010–120NP *≥85Aspergillus nigerPol-Aura
7CS_10-10010–100580≥90SquidPol-Aura
8CS_20-300200–30050-19075–85ShrimpSigma-Aldrich
9CS_30-10030–100250≥90ShrimpPol-Aura
10CS_100-300100–300890≥90ShrimpPol-Aura
11CS_200-800200–800NP *75–85ShrimpSigma-Aldrich
12CS_300-1k300–10001250≥90ShrimpPol-Aura
13CS_800-2k800–20001500≥72ShrimpSigma-Aldrich
14CS_1k-2k1000–20001500≥90ShrimpPol-Aura
* NP—not provided.
Table 2. Significant up and down-regulated pathways in the F. graminearum transcriptome after chitosan CS_10 application.
DirectionAdj. p ValuenGenesPathways
Enriched Pathways in DEGs for GO Molecular Functions
Down-regulated3.2 × 10−4477Hydrolase activity, hydrolyzing O-glycosyl compounds
1.4 × 10−25316Catalytic activity
4.4 × 10−1120Carbohydrate binding
7.4 × 10−10100Oxidoreductase activity
Up-regulated1.4 × 10−1559Transporter activity
4.2 × 10−617Tetrapyrrole binding
4.2 × 10−617Heme-binding
9.7 × 10−511Monooxygenase activity
Enriched pathways in DEGs for GO Biological Process
Down-regulated3.5 × 10−3990Carbohydrate metabolic process
1.8 × 10−1417Polysaccharide catabolic process
1.8 × 10−1212Xylan metabolic process
3.9 × 10−1216Cell wall organization or biogenesis
Up-regulated2.9 × 10−1762Transmembrane transport
1.5 × 10−1264Establishment of localization
5.1 × 10−414Ion transport
8.4 × 10−55Secondary metabolic process
Enriched pathways in DEGs for GO Cellular Component
Down-regulated4.7 × 10−1420Extracellular region
Up-regulated3.7 × 10−748Membrane
9.8 × 10−631An integral component of the membrane
1.8 × 10⁻³²Fatty acid synthase complex
Disclaimer/Publisher’s Note: The statements, opinions and data contained in all publications are solely those of the individual author(s) and contributor(s) and not of MDPI and/or the editor(s). MDPI and/or the editor(s) disclaim responsibility for any injury to people or property resulting from any ideas, methods, instructions or products referred to in the content.

