

A Model of iPSC-Derived Macrophages with TNFAIP3 Overexpression Reveals the Peculiarities of TNFAIP3 Protein Expression and Function in Human Macrophages
 , , , , , and
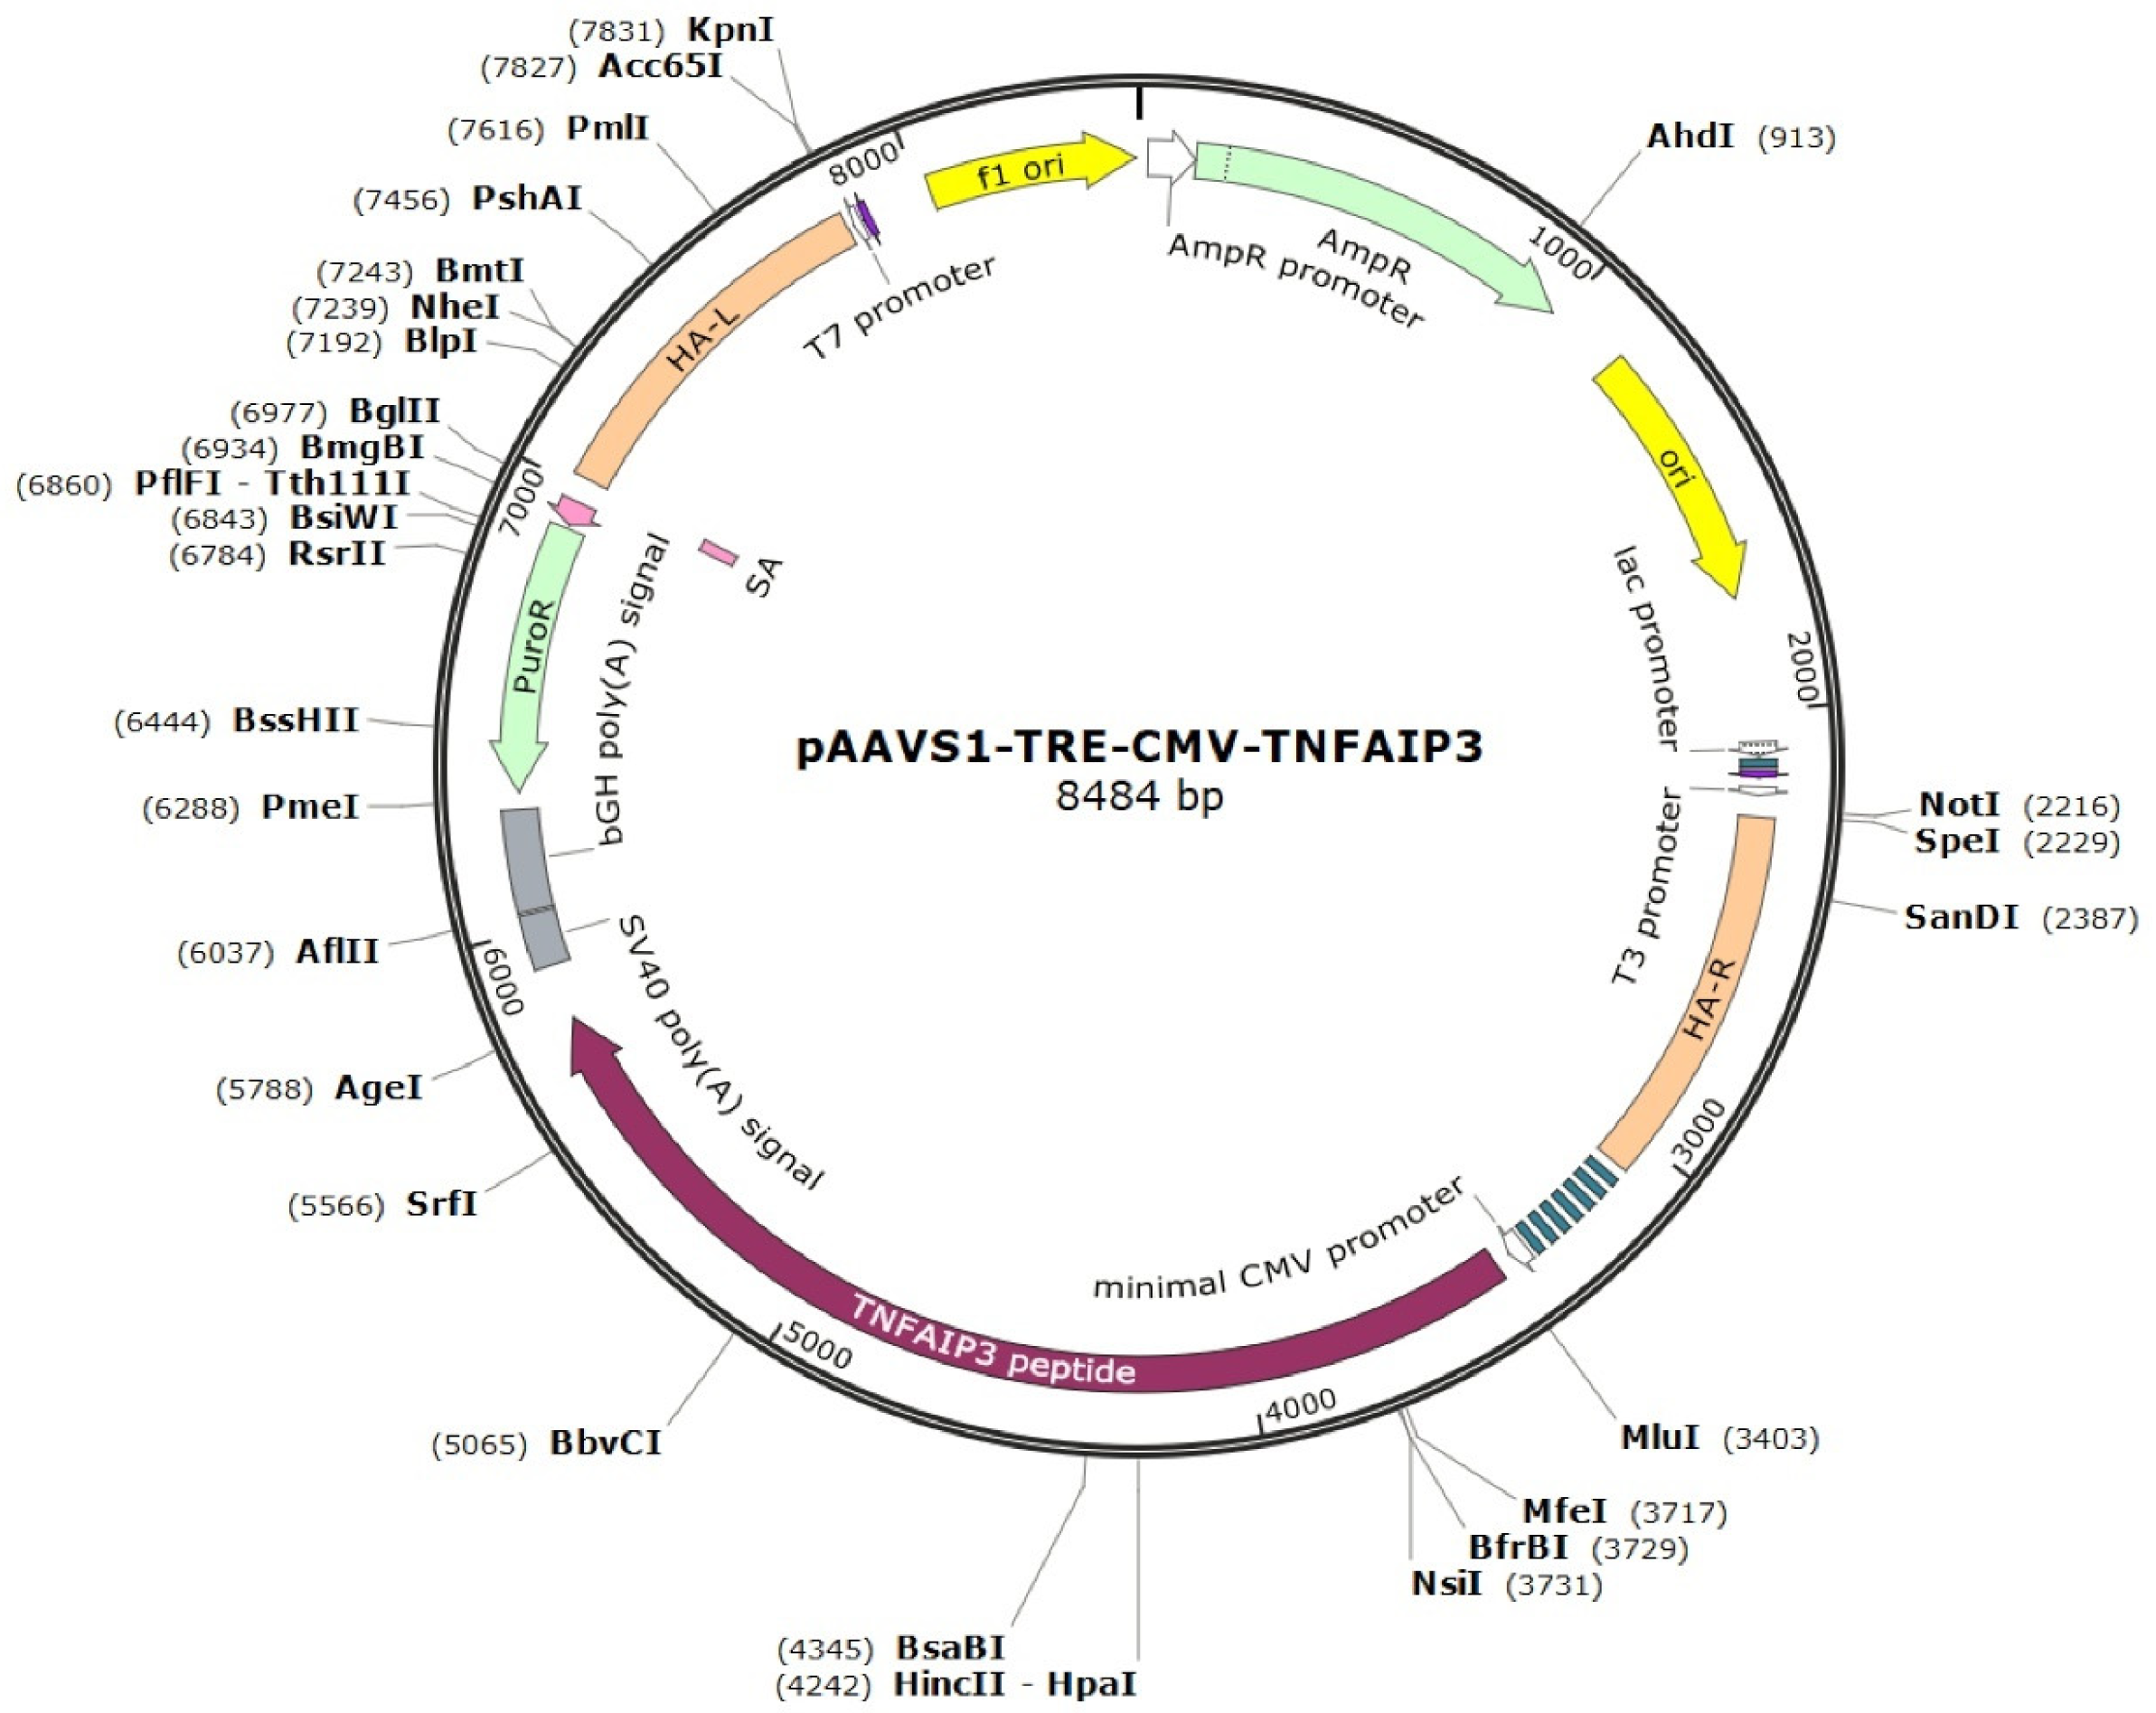
Abstract
:1. Introduction
2. Results
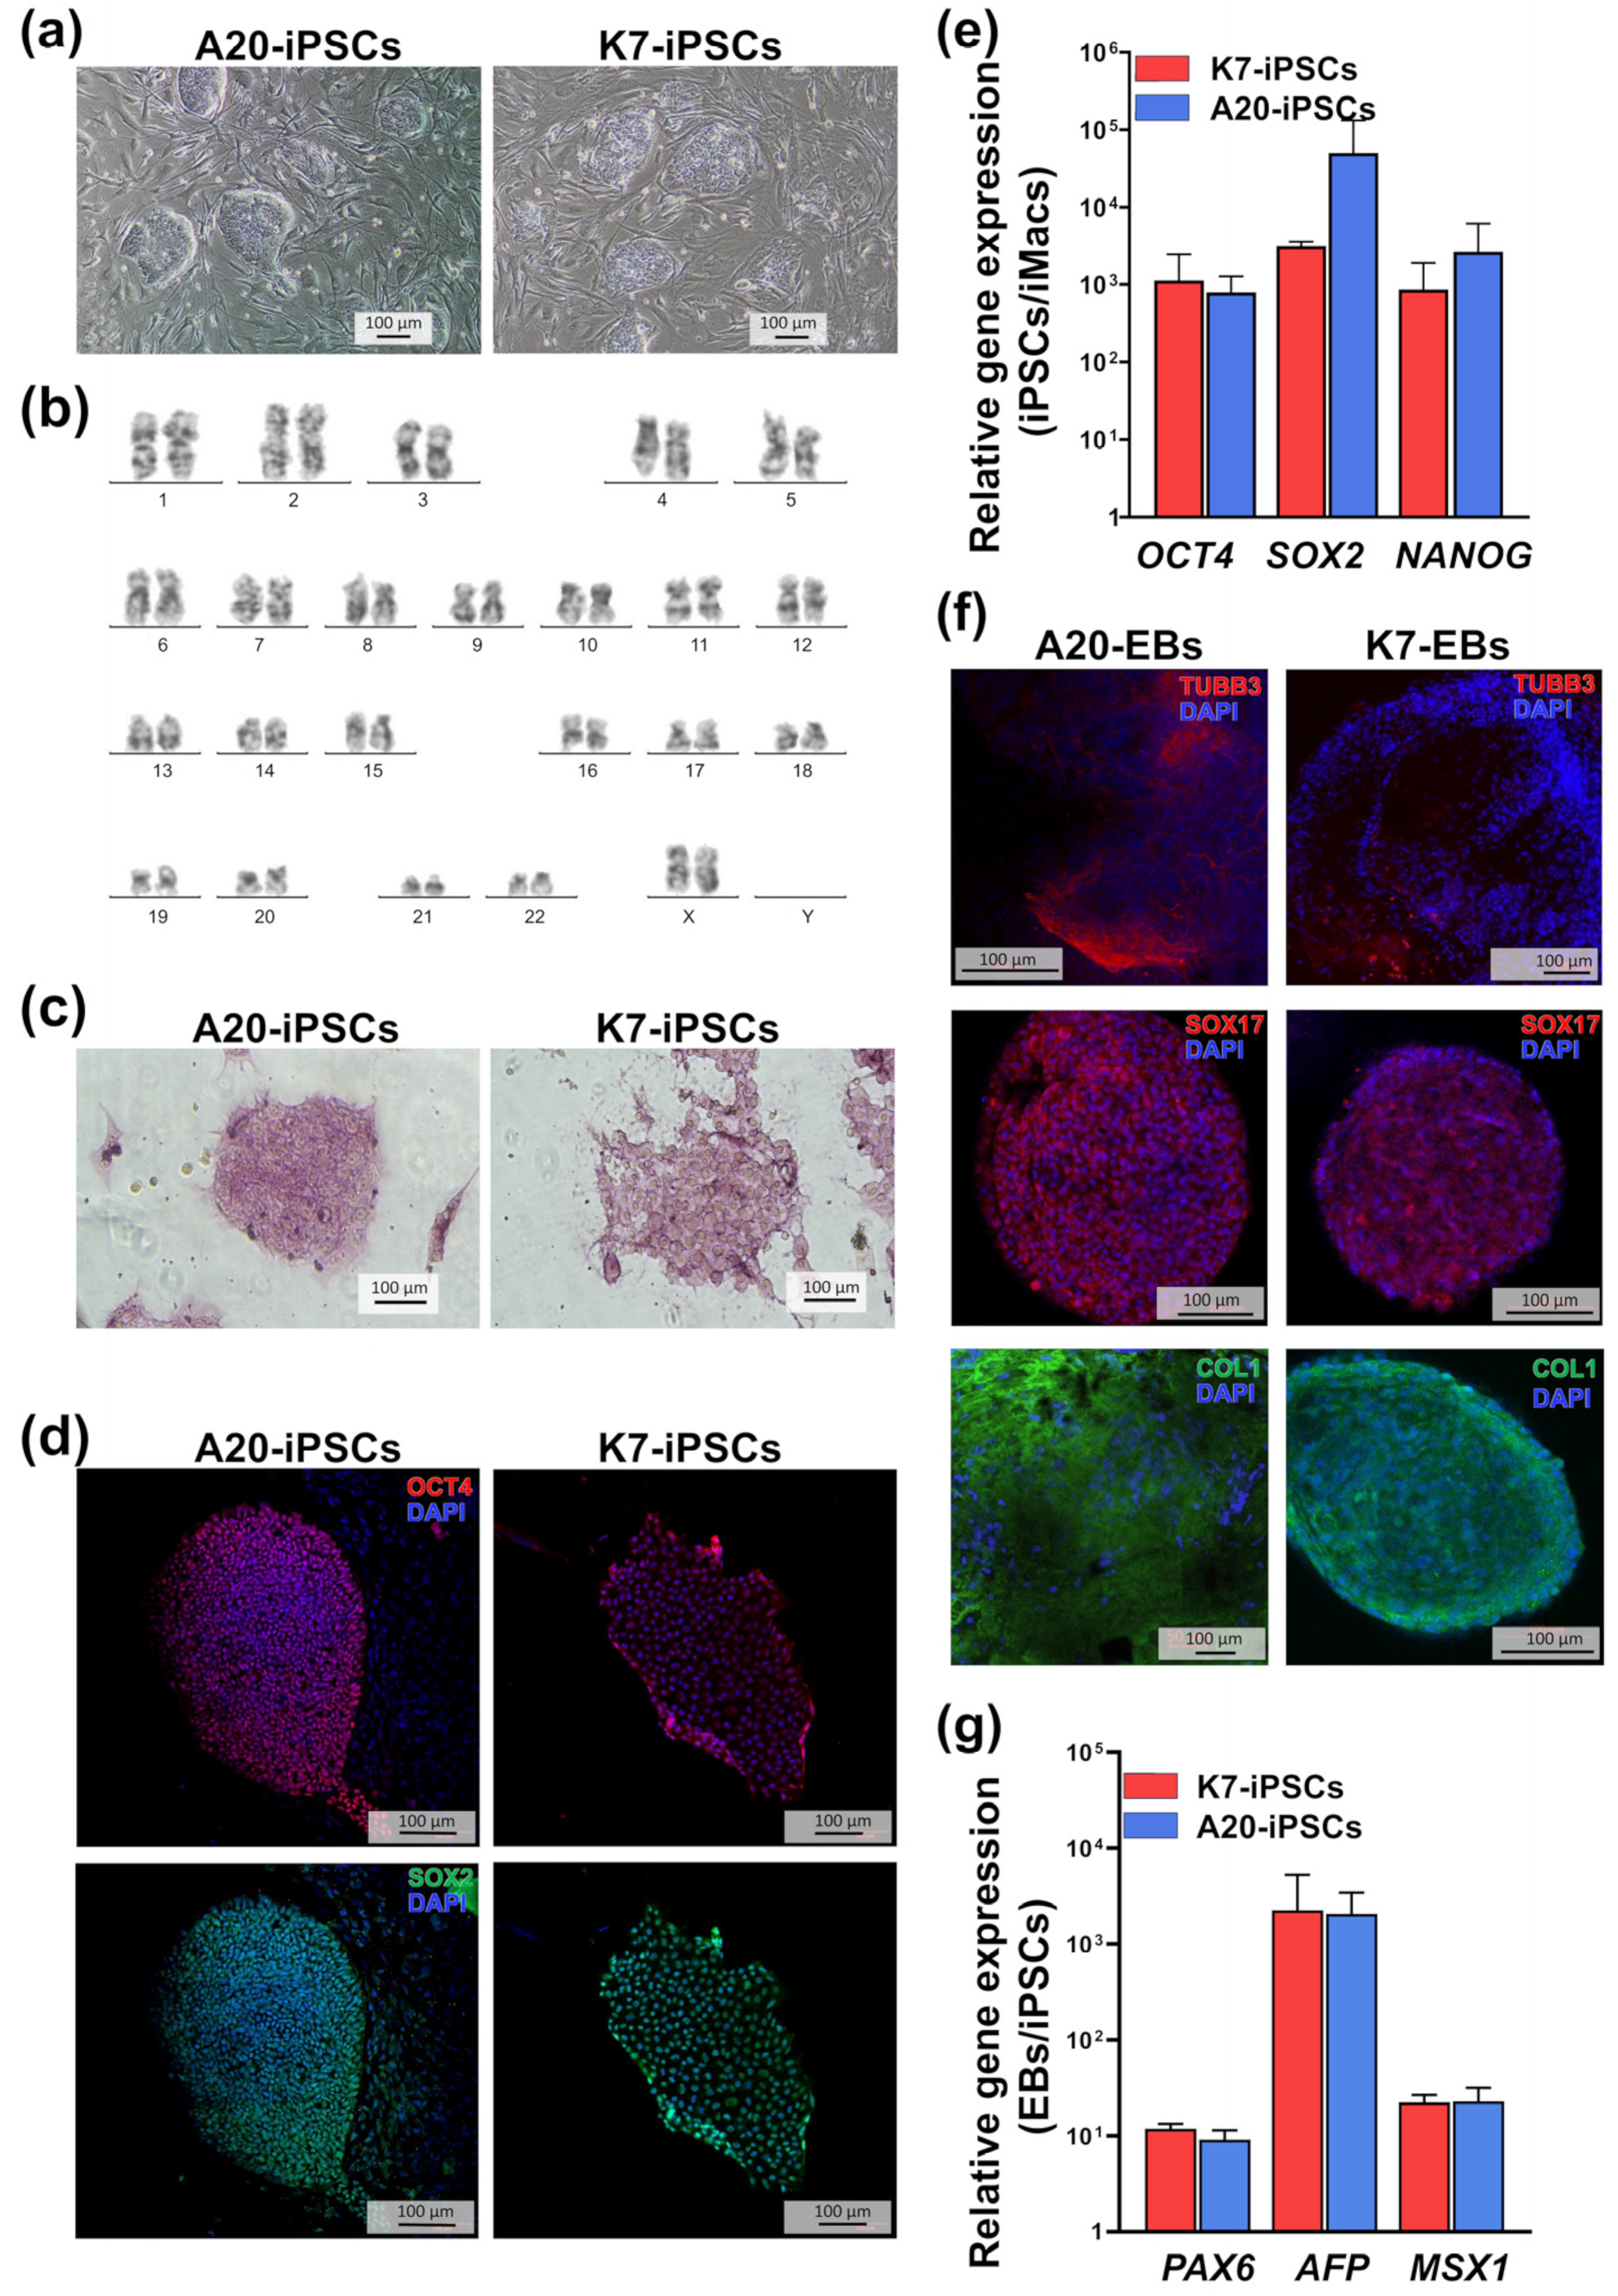
2.1. A20-Transfected iPSCs Retain Pluripotent Properties
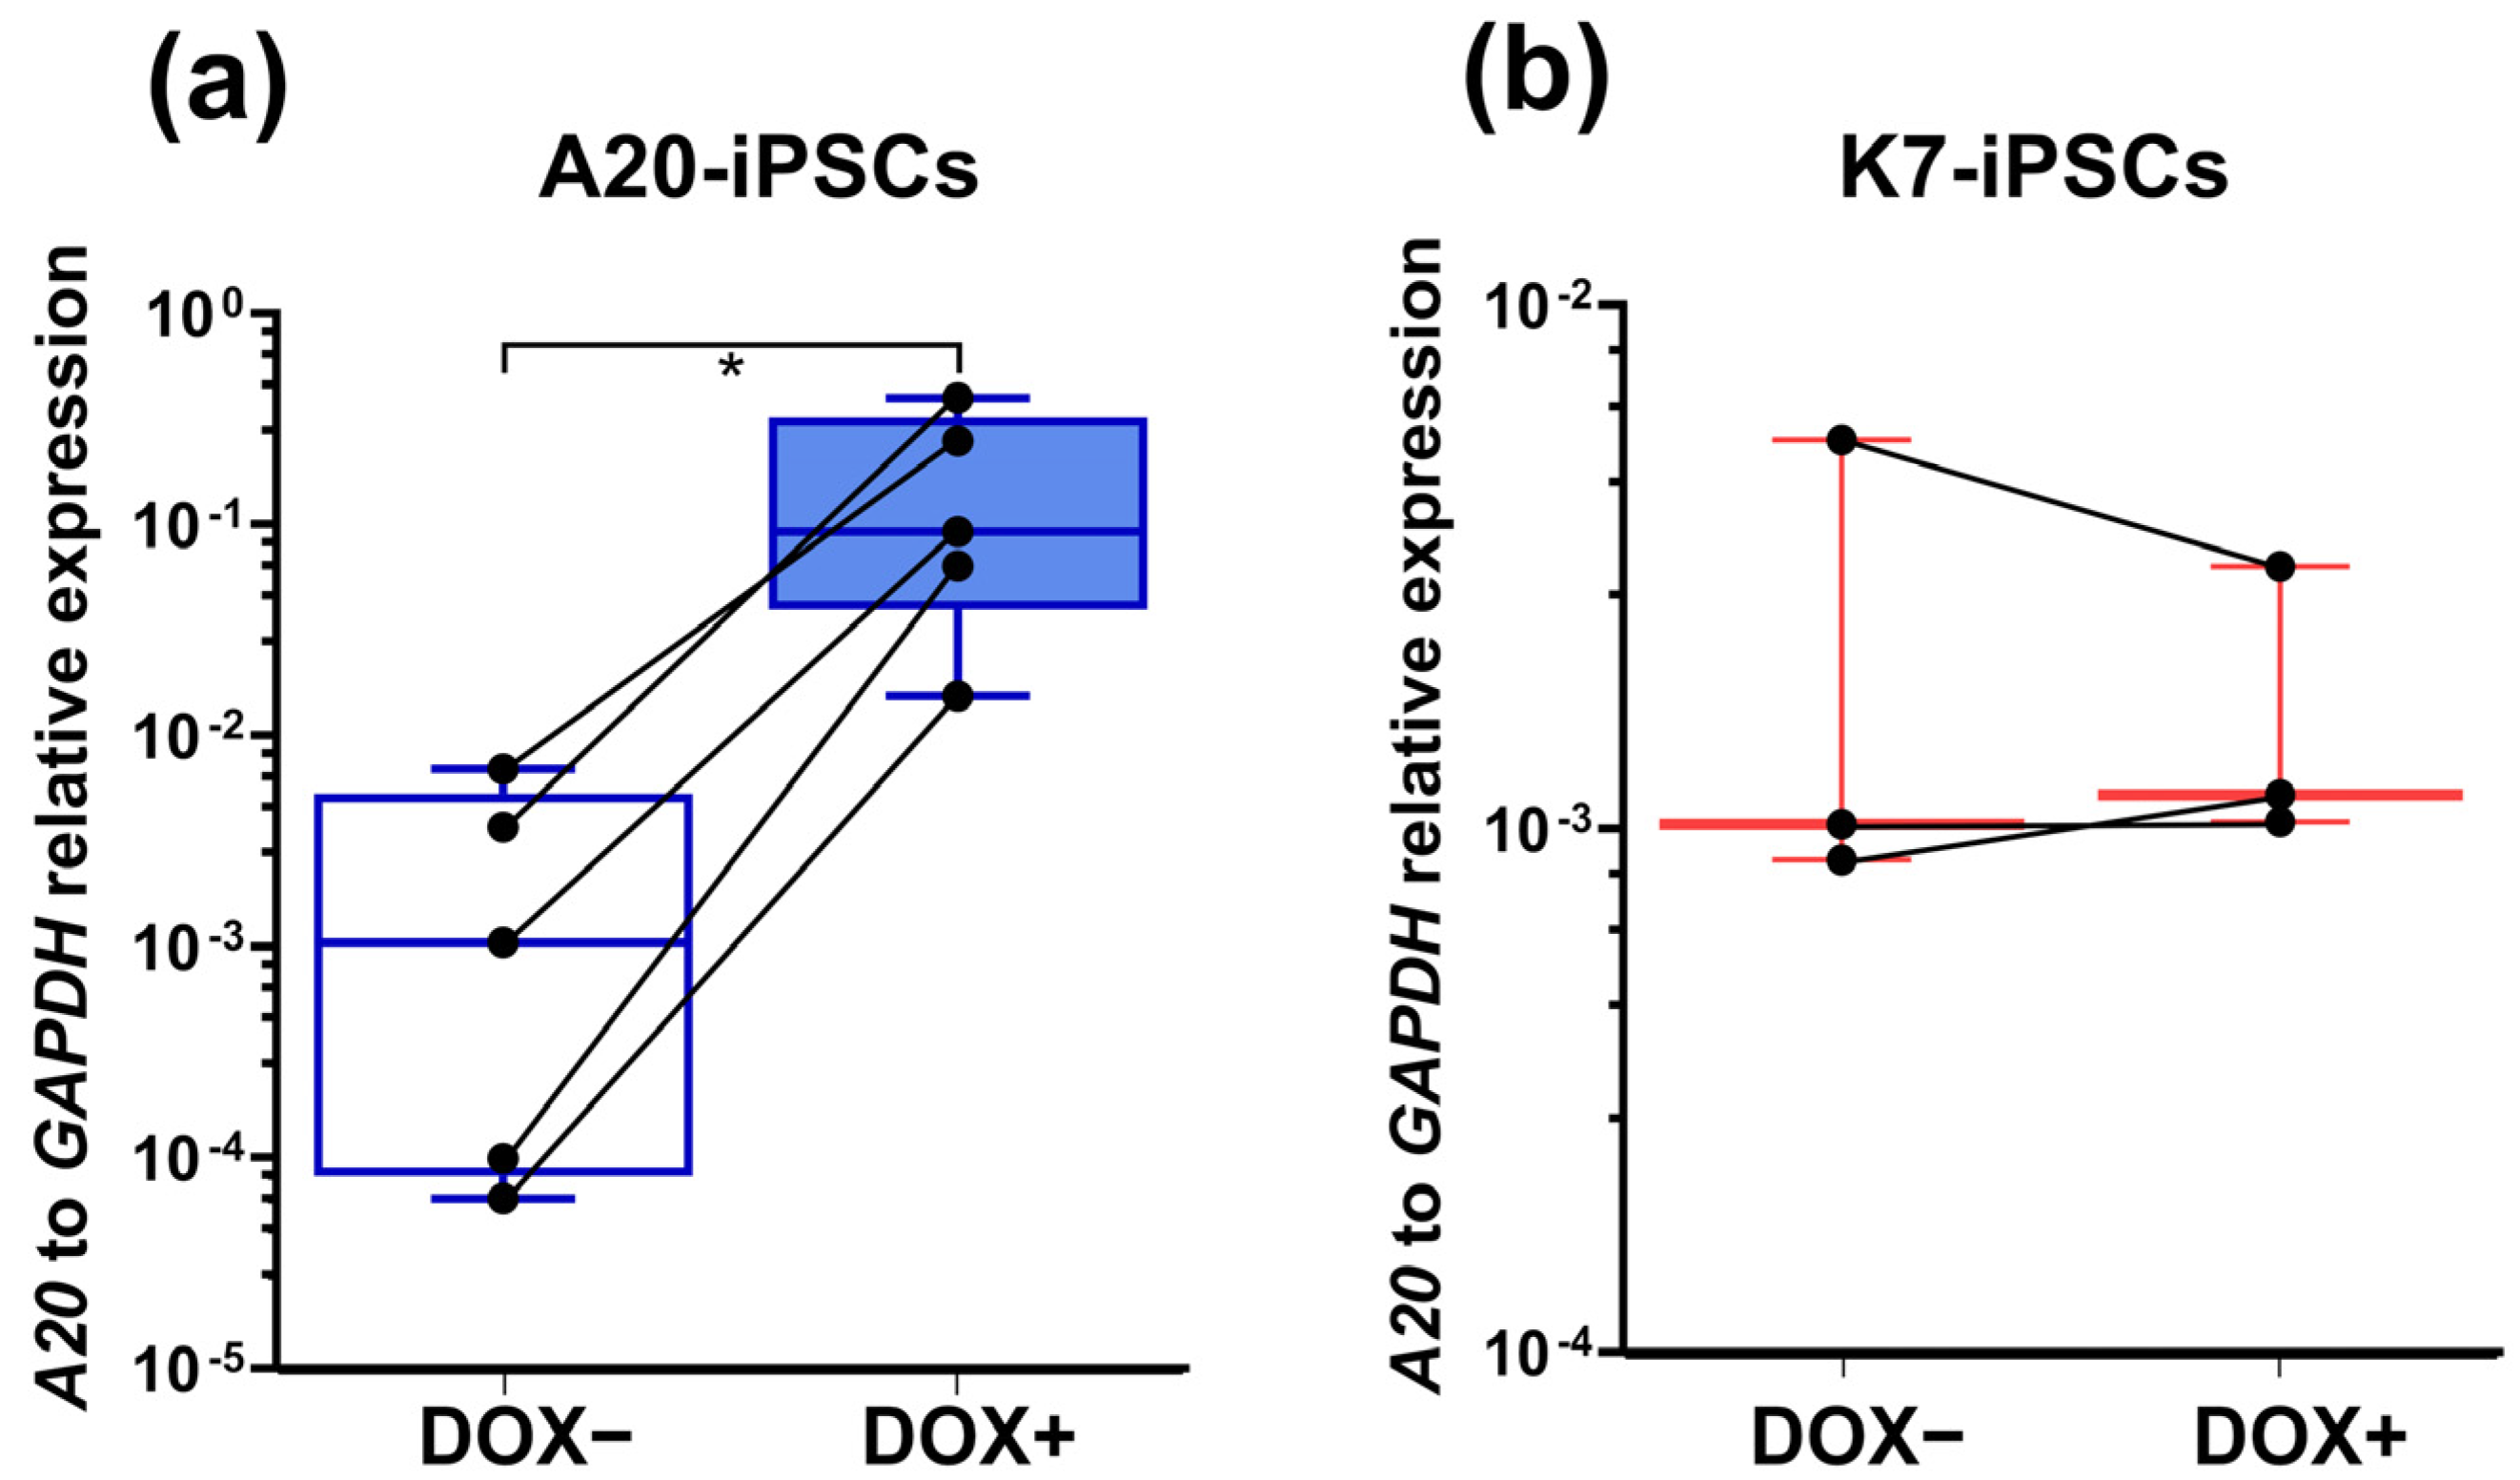
2.2. A20-Transfected iPSCs Respond to Doxycycline by a Significant Increase in A20 Expression
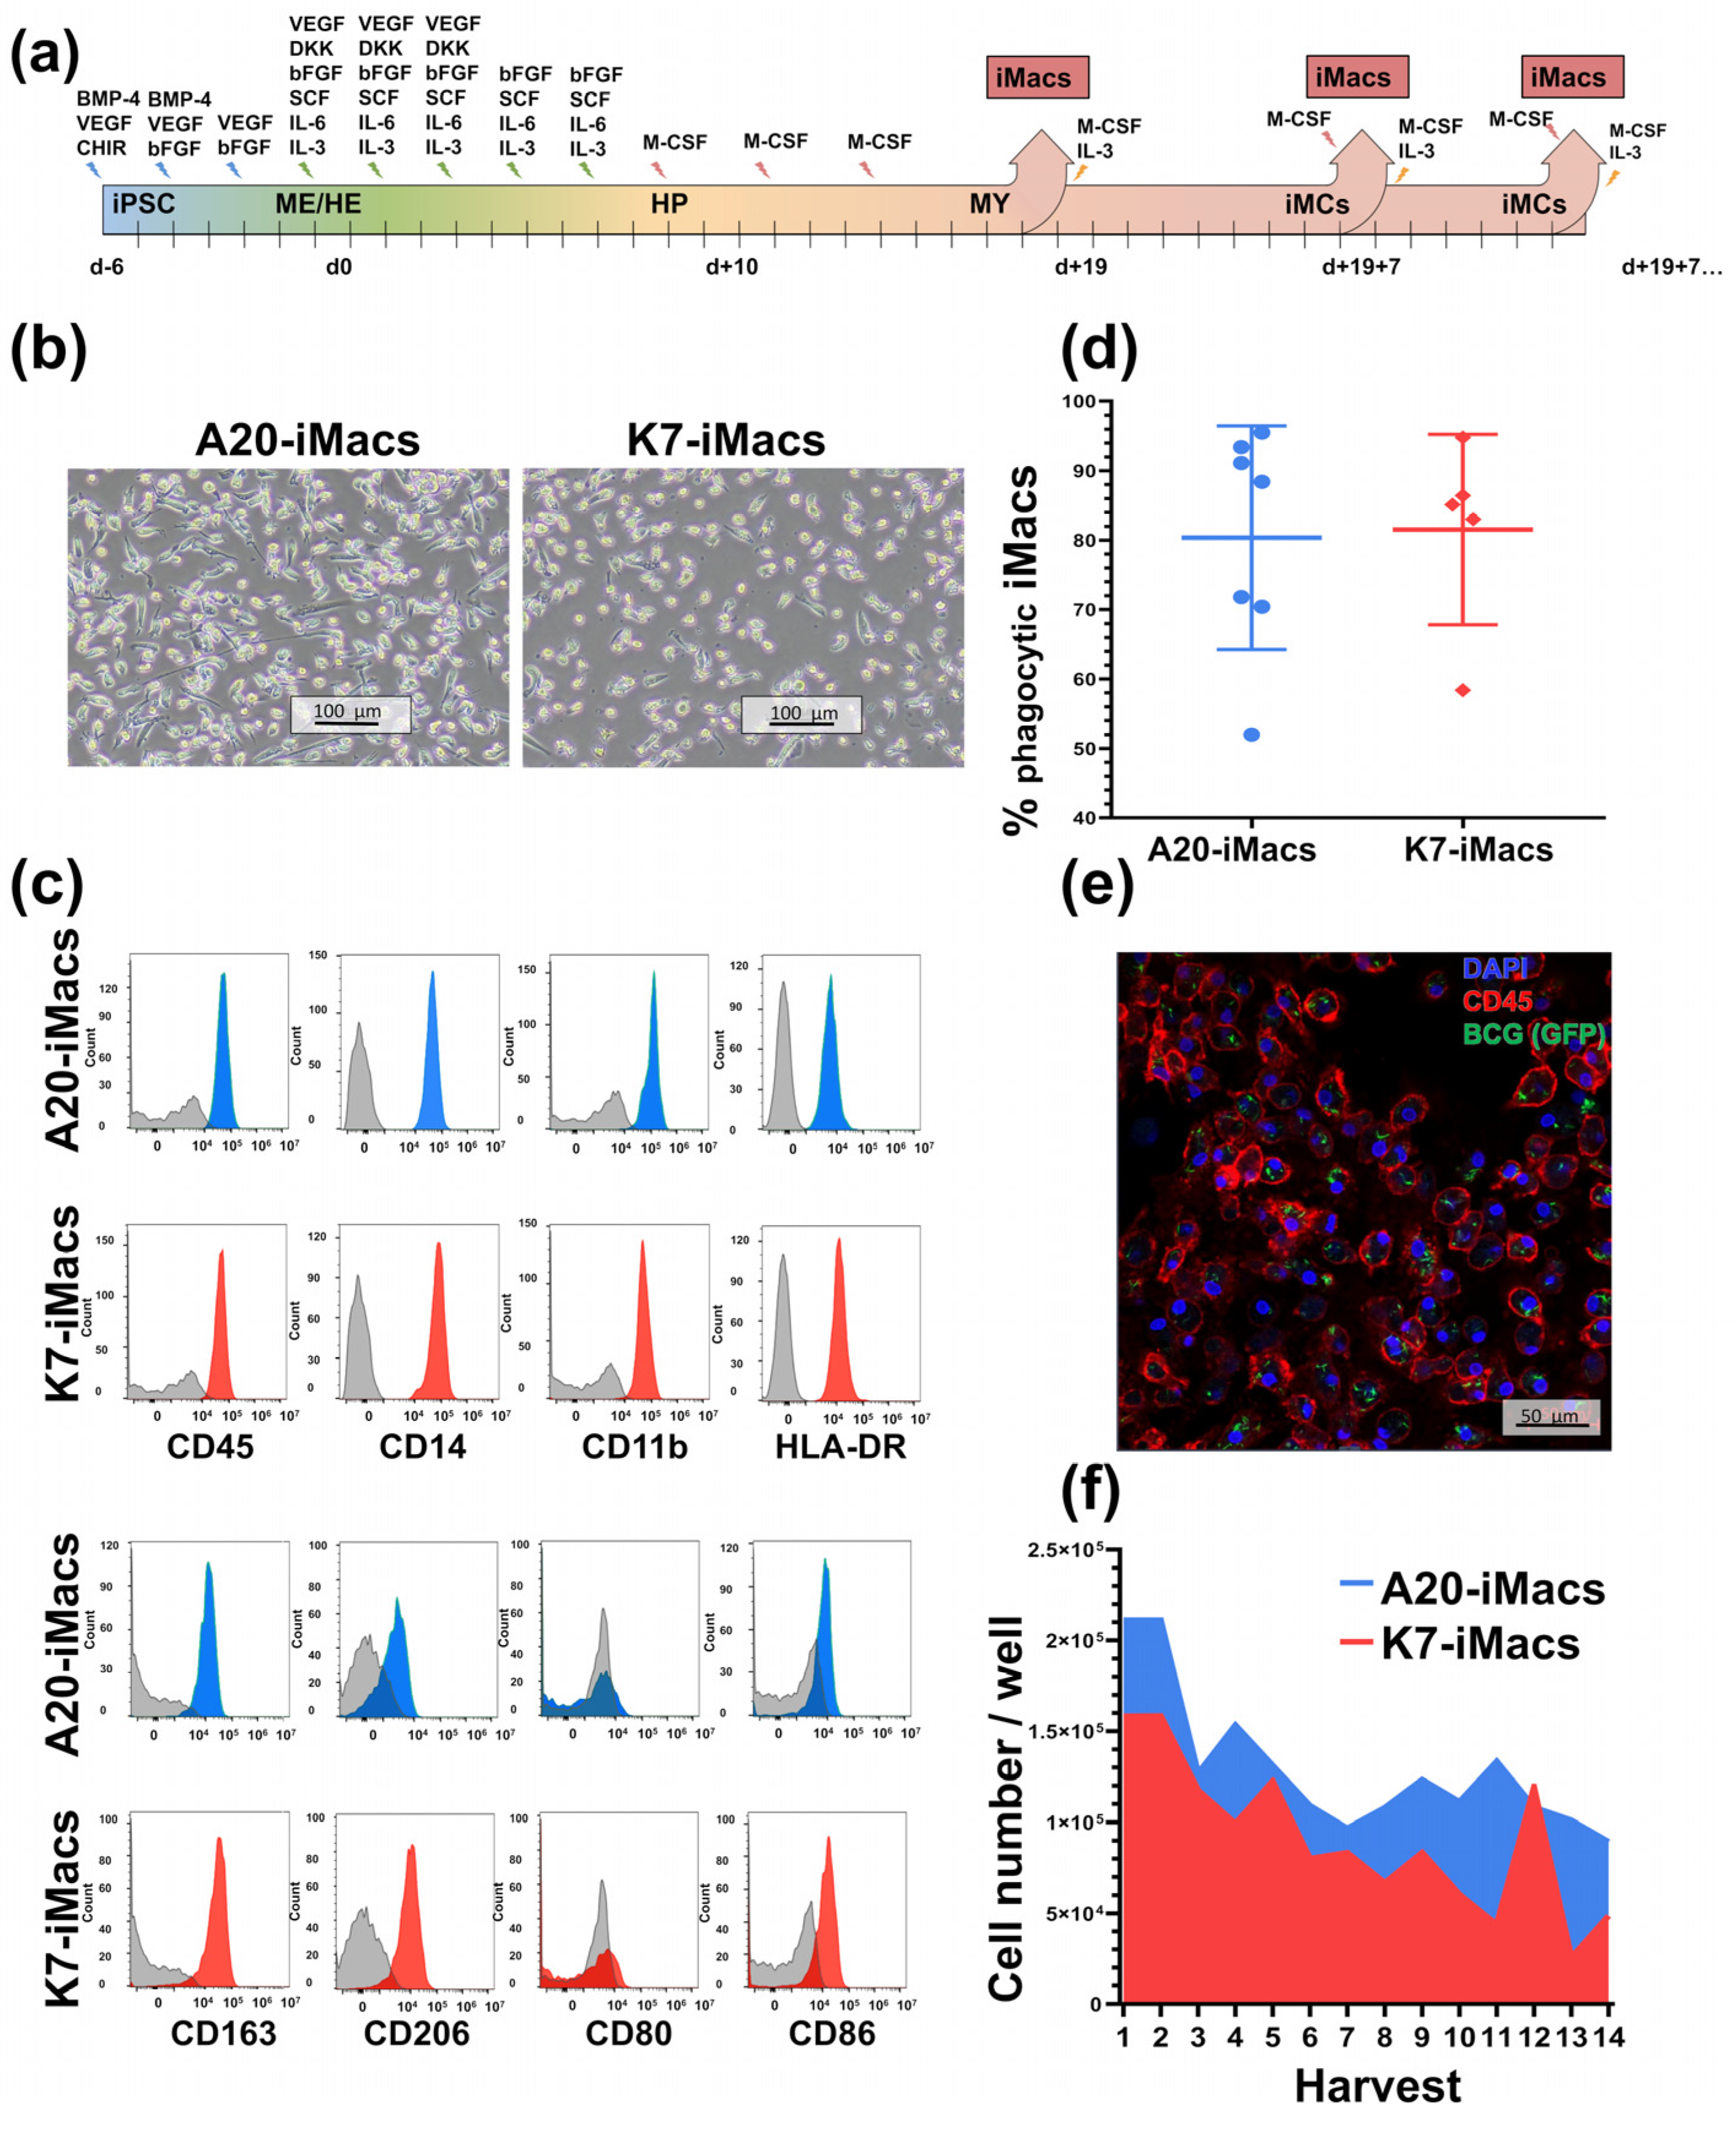
2.3. A20-Transfected iPSCs Can Be Efficiently Differentiated into iMacs
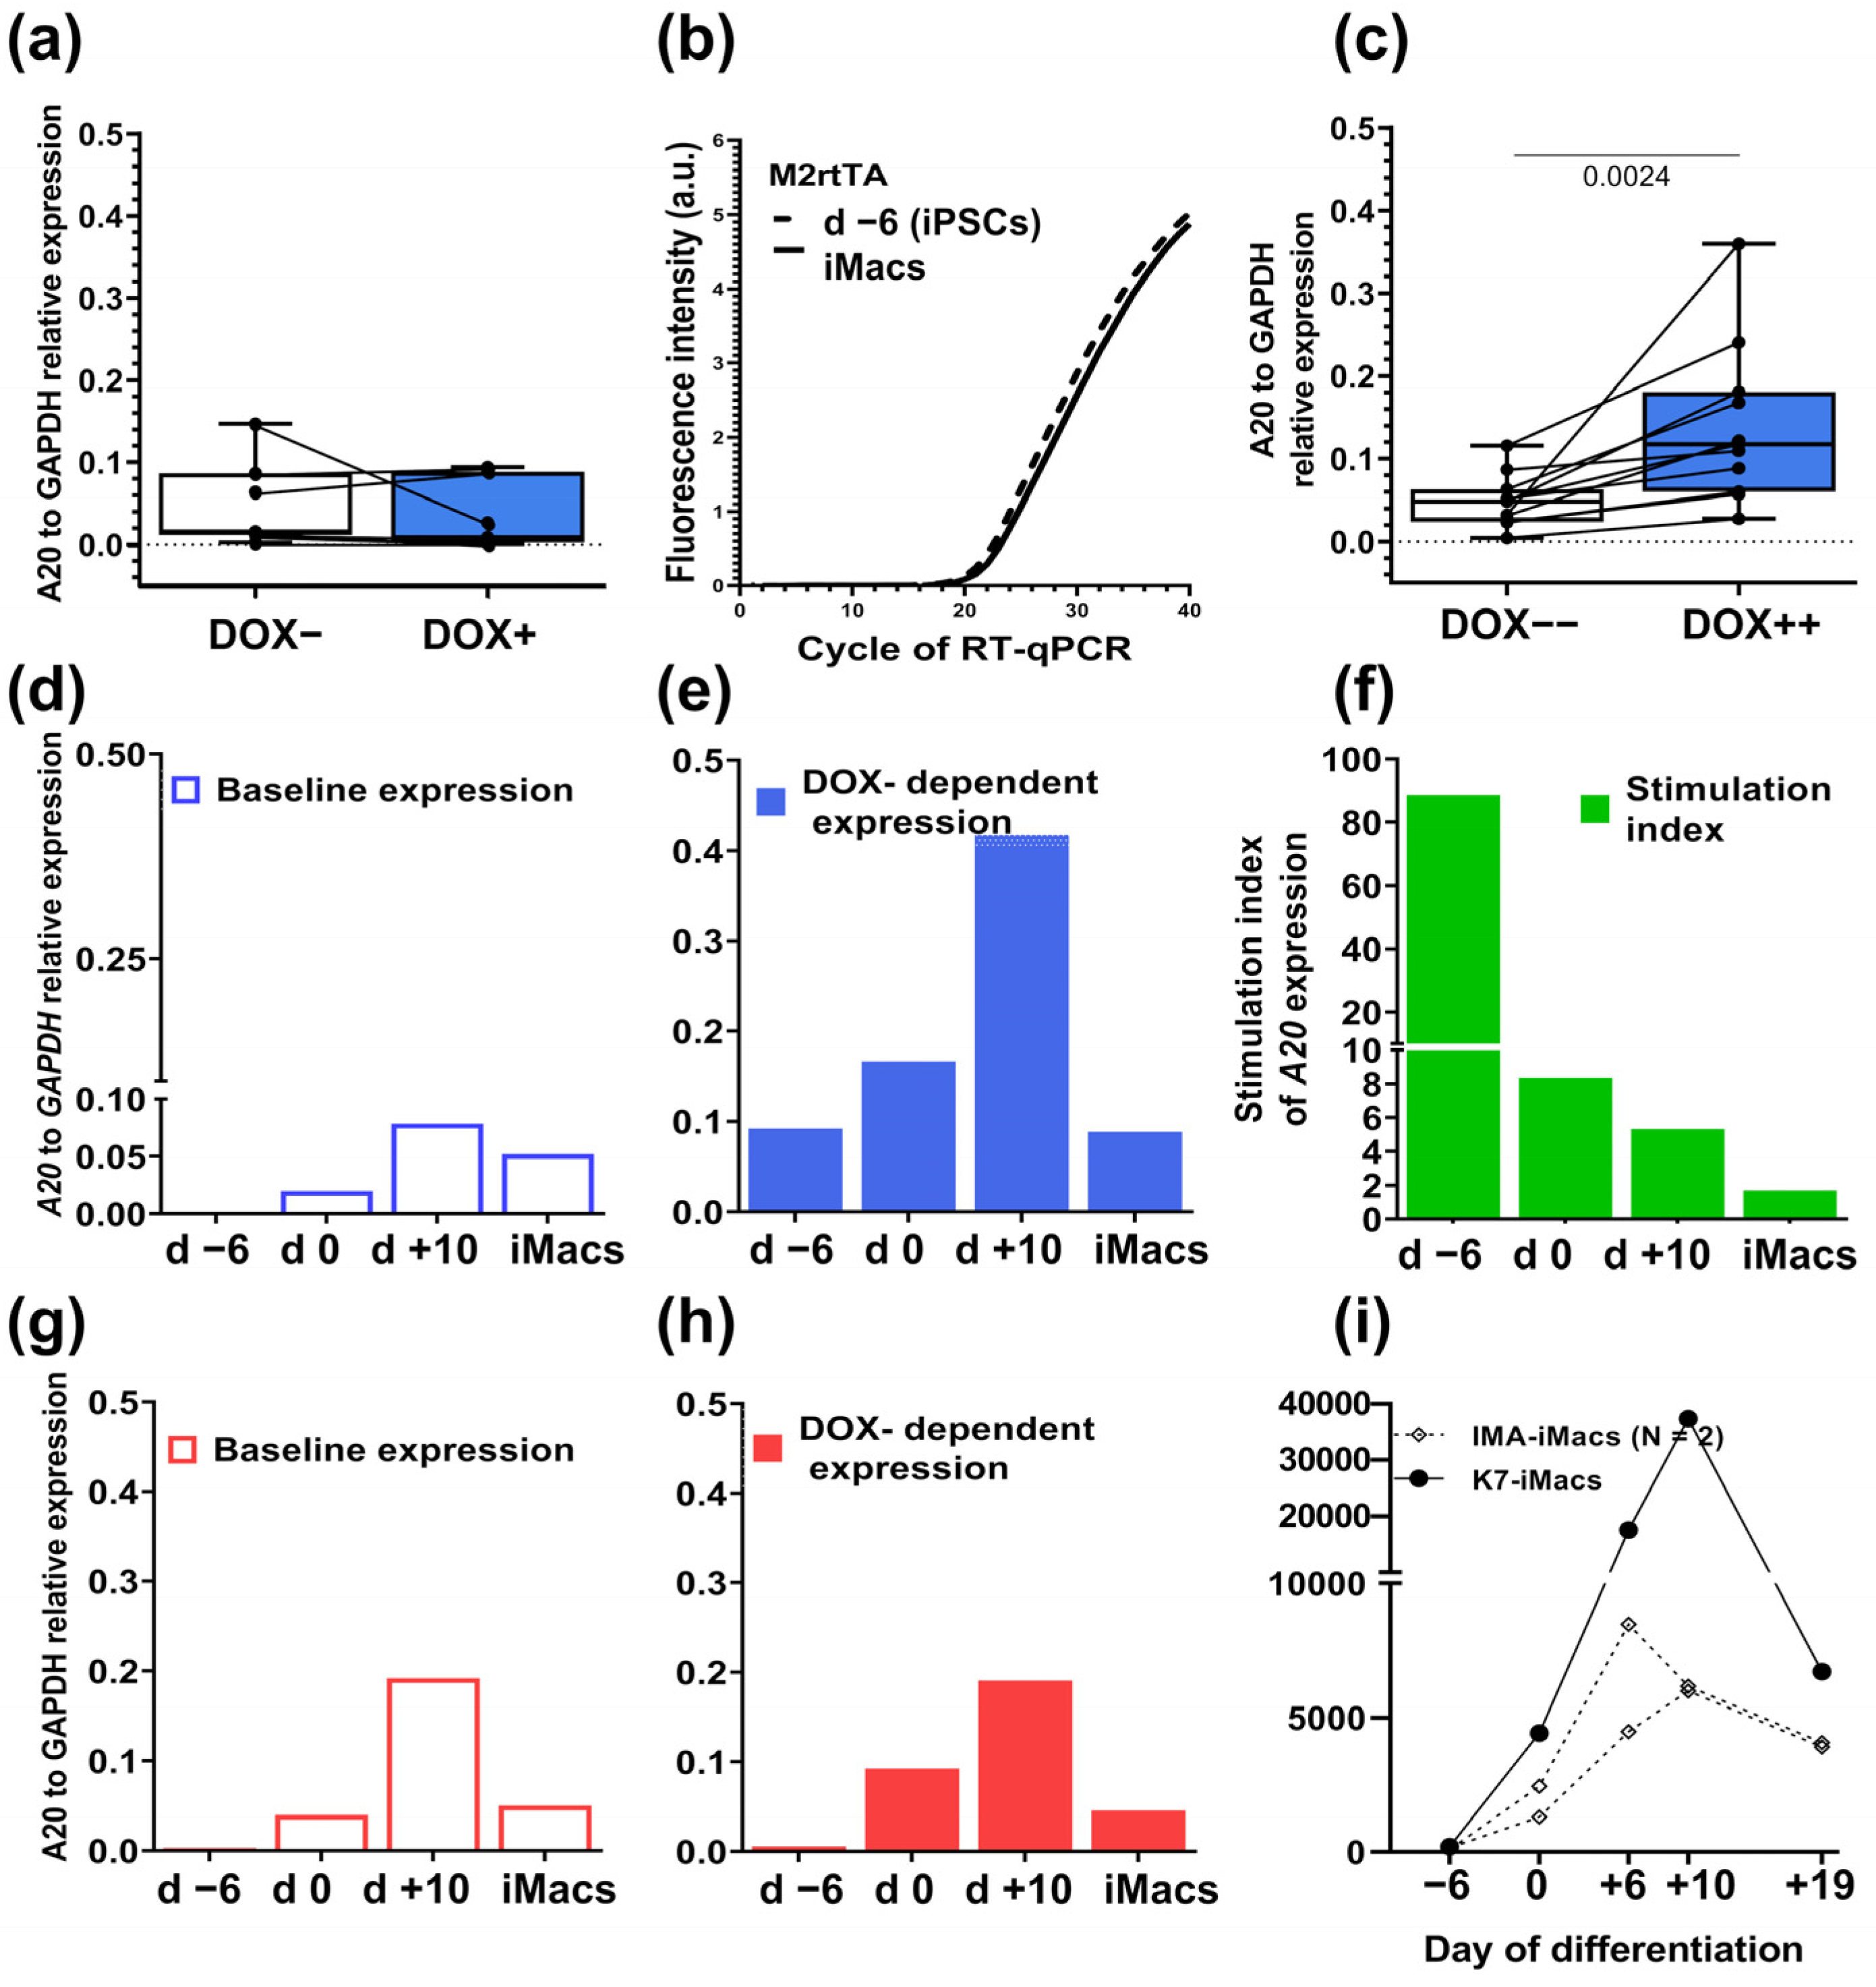
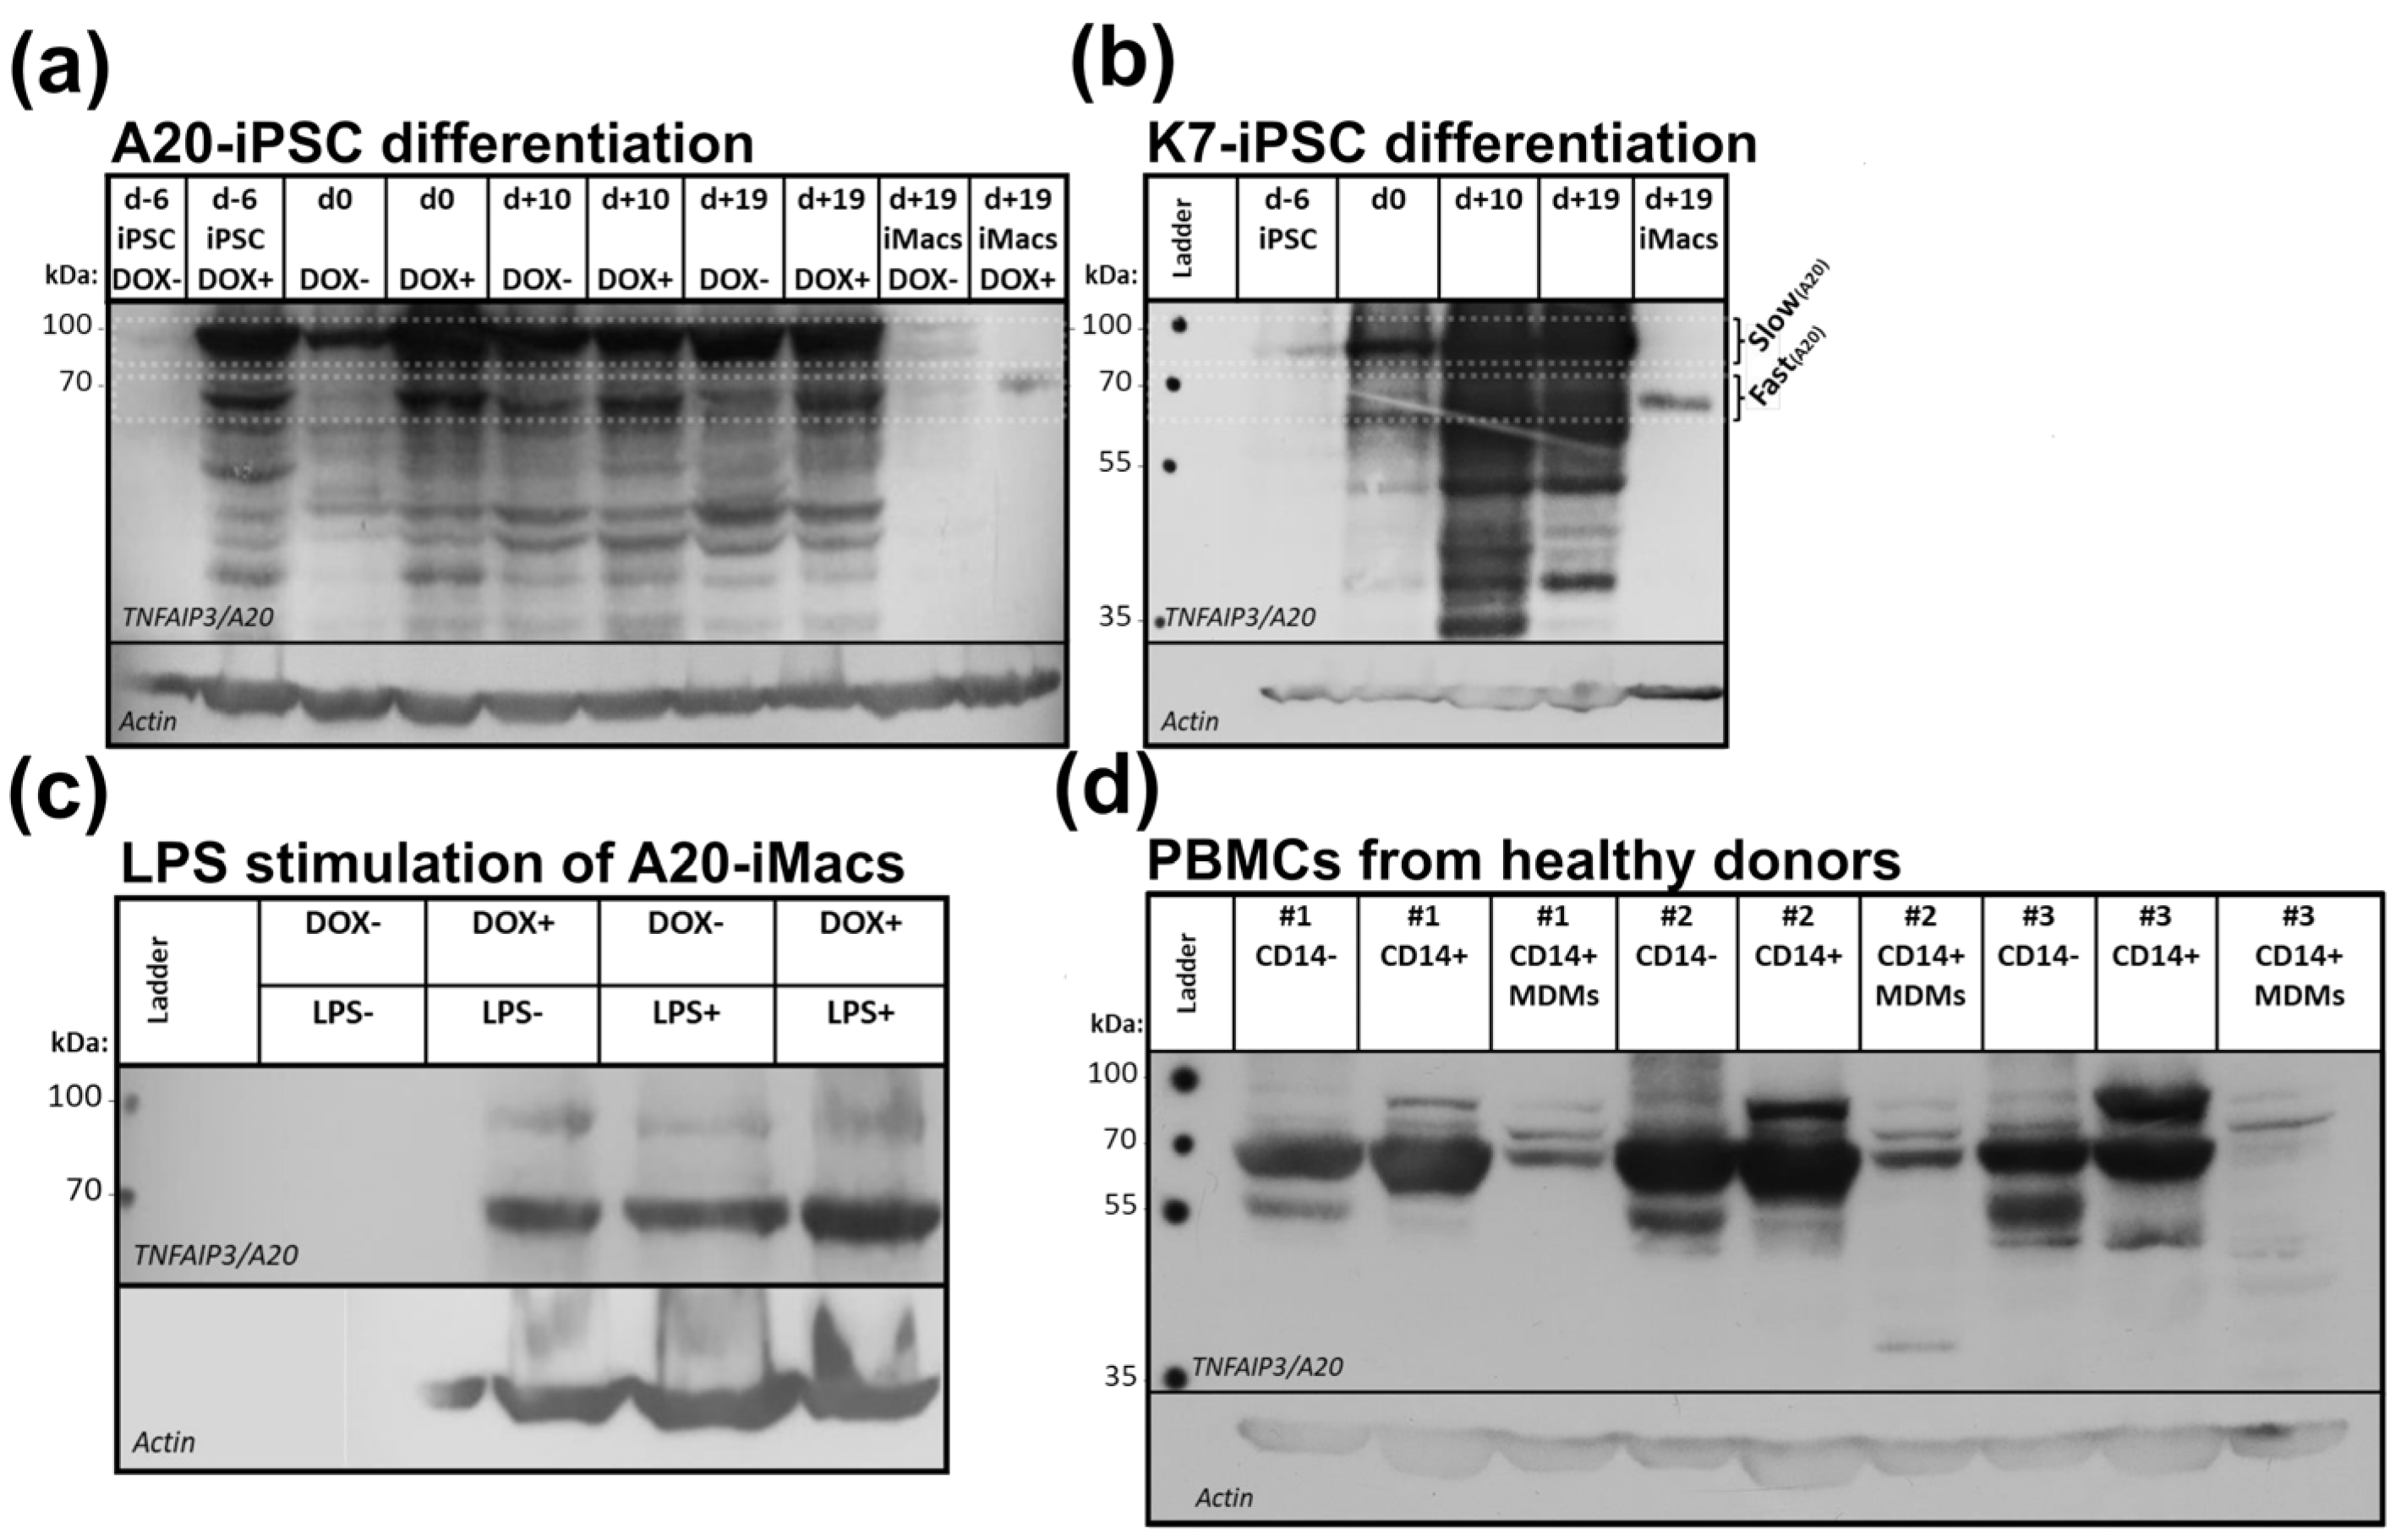
2.4. Macrophages Differentiated from A20-Transfected iPSCs Lose DOX-Inducible A20 Expression, Which Can Be Fixed by Modifying the iMac Differentiation Protocol
2.5. Macrophages Are Characterized by the Expression of a Low-Weight form of the A20 Protein
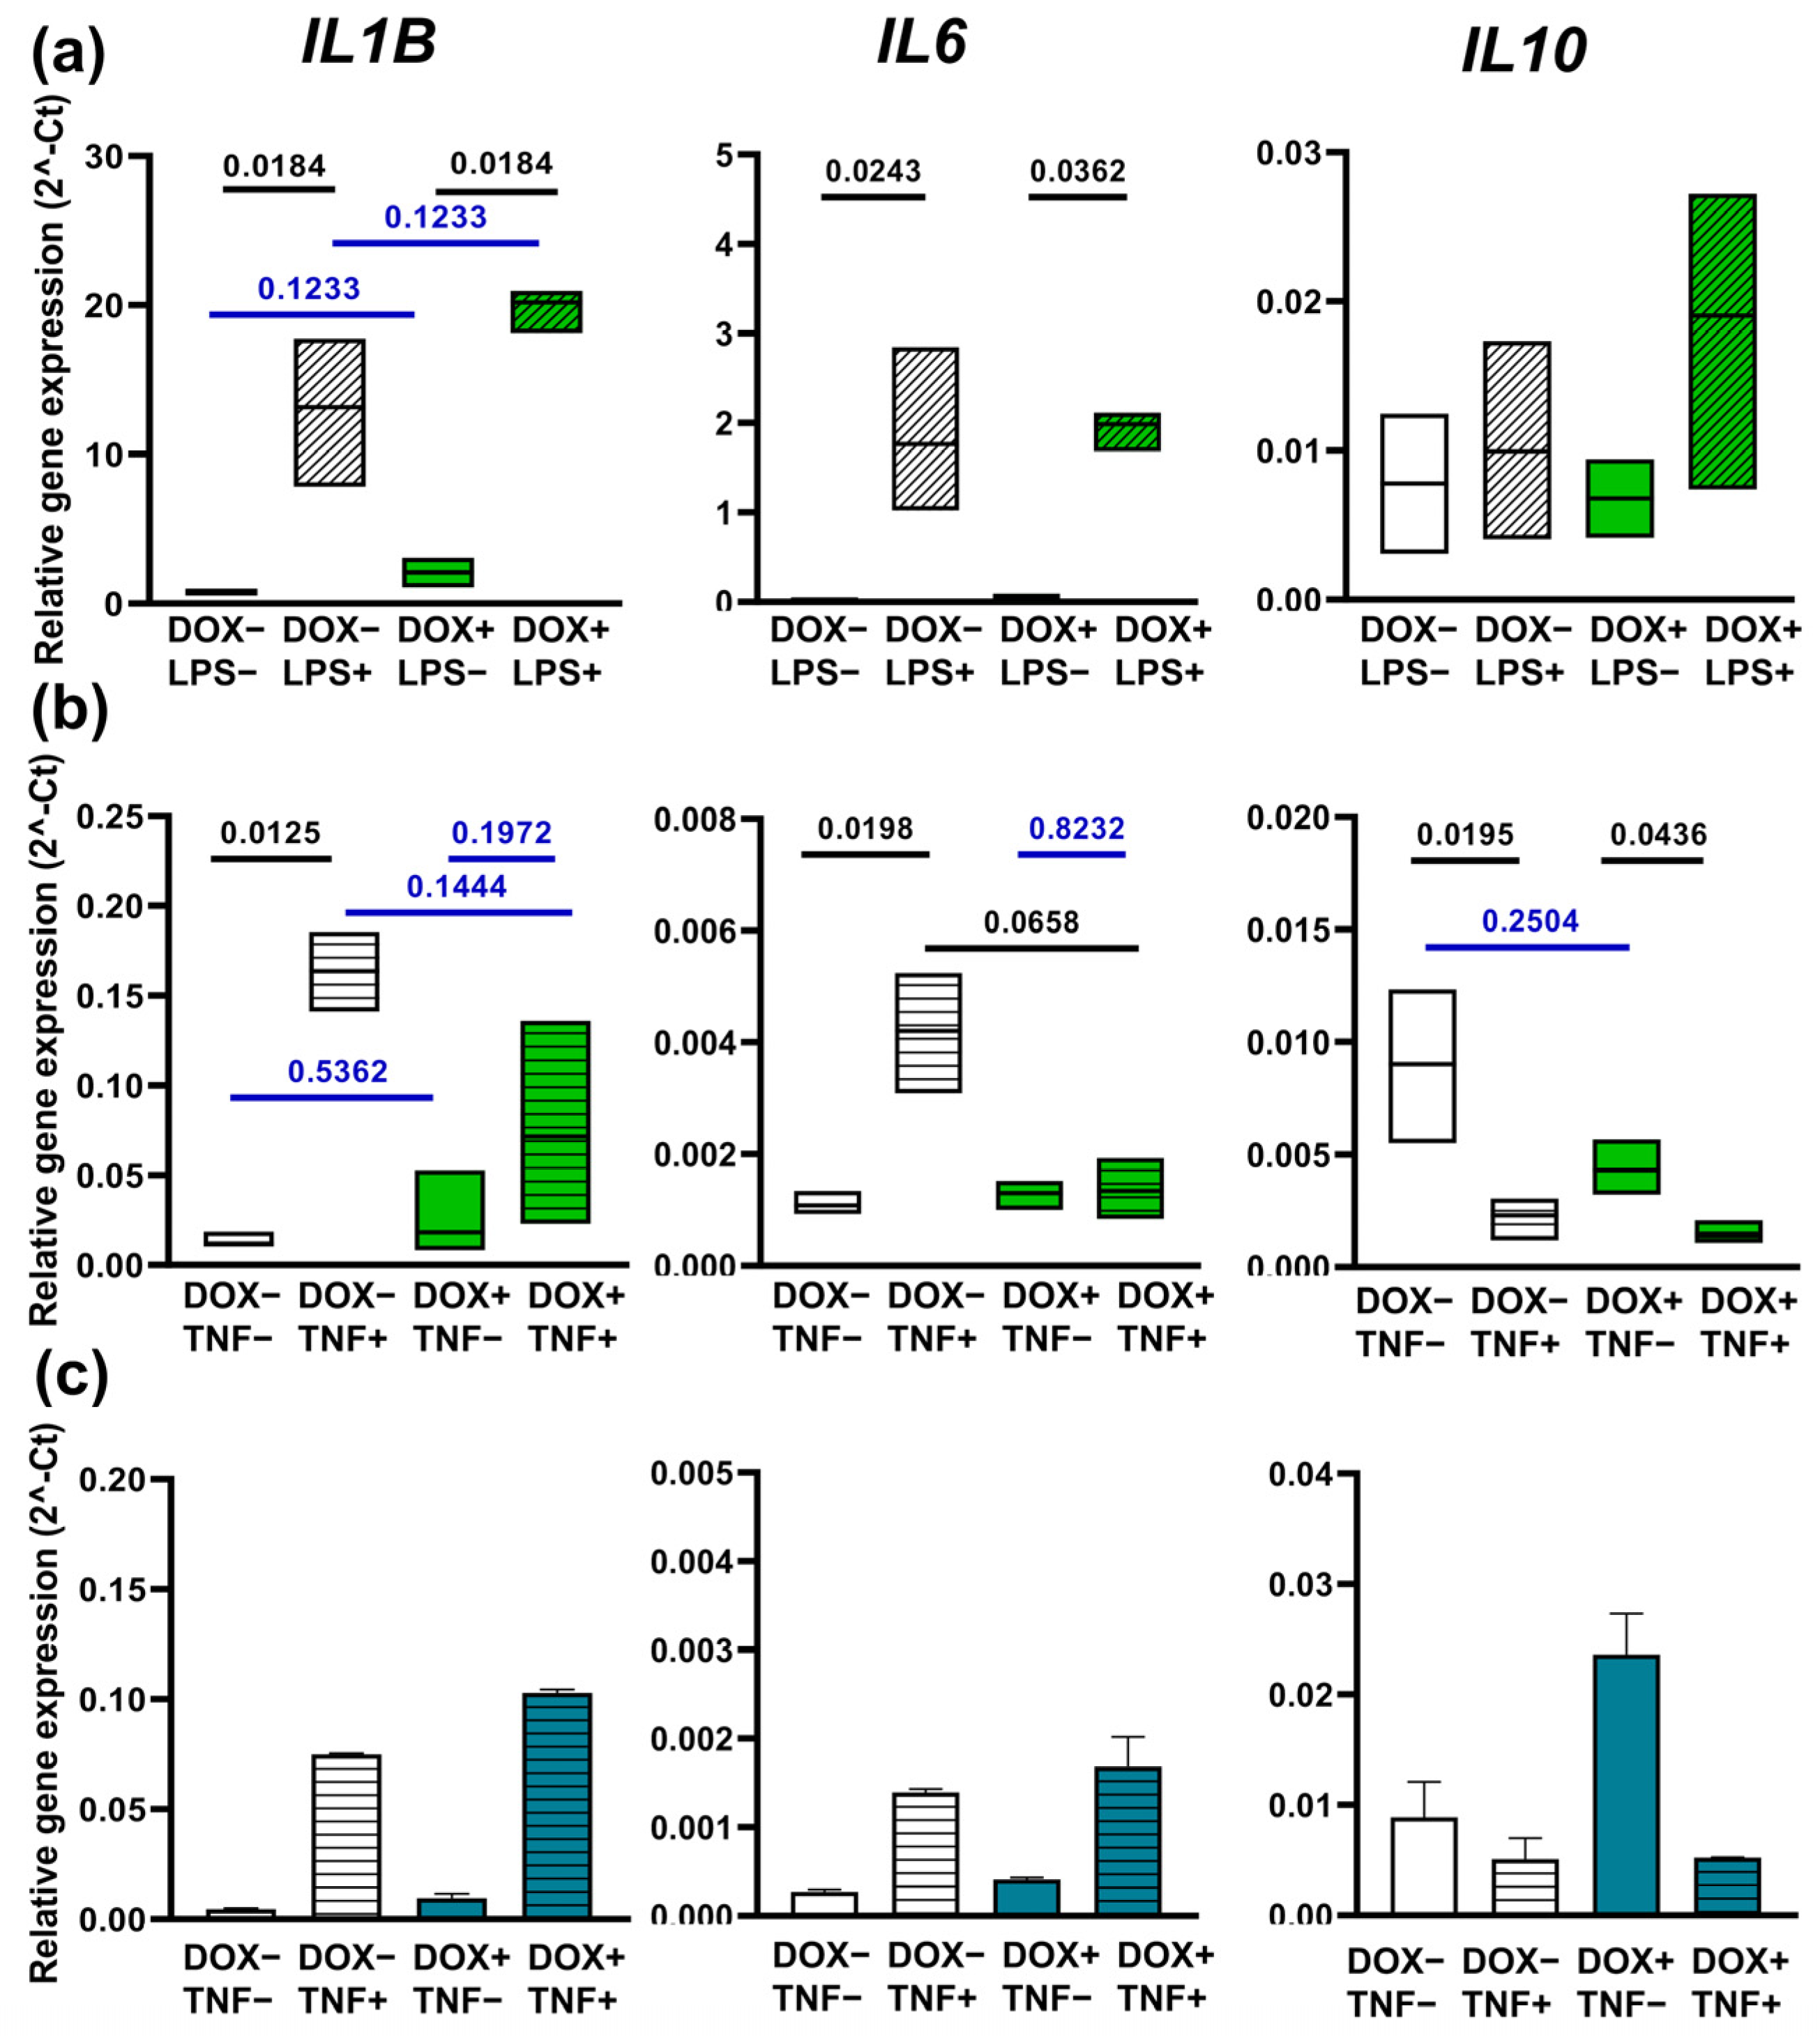
2.6. Overexpression of A20 Exhibits Different Effects on iMac Response to LPS and TNF-α
3. Discussion
4. Materials and Methods
4.1. Reagents and Media
4.2. iPSC Line Generation and Maintenance
4.3. Generation of iPSC Lines with Tetracycline-Controllable A20 Expression
4.4. Histochemical and Immunofluorescent Characterization and Karyotyping of iPSC Lines with Tetracycline-Controllable A20 Expression
4.5. iPSC Differentiation into iMacs
4.6. Cell Treatment with Doxycycline
4.7. Real-Time qPCR
4.8. Western Blotting
4.9. Flow Cytometry
4.10. Phagocytosis Assays
4.11. The Generation of Monocyte-Derived Macrophages
4.12. Cell Stimulation with LPS and TNF-α
4.13. Statistical Analysis
Supplementary Materials
Author Contributions
Funding
Institutional Review Board Statement
Informed Consent Statement
Data Availability Statement
Acknowledgments
Conflicts of Interest
Abbreviations
References
- Murray, P.J.; Wynn, T.A. Protective and pathogenic functions of macrophage subsets. Nat. Rev. Immunol. 2011, 11, 723–737. [Google Scholar] [CrossRef] [PubMed]
- Mosser, D.M.; Hamidzadeh, K.; Goncalves, R. Macrophages and the maintenance of homeostasis. Cell Mol. Immunol. 2021, 18, 579–587. [Google Scholar] [CrossRef] [PubMed]
- Mantovani, A.; Allavena, P.; Marchesi, F.; Garlanda, C. Macrophages as tools and targets in cancer therapy. Nat. Rev. Drug Discov. 2022, 21, 799–820. [Google Scholar] [CrossRef] [PubMed]
- Mamilos, A.; Winter, L.; Schmitt, V.H.; Barsch, F.; Grevenstein, D.; Wagner, W.; Babel, M.; Keller, K.; Schmitt, C.; Gürtler, F.; et al. Macrophages: From simple phagocyte to an integrative regulatory cell for inflammation and tissue regeneration—A review of the literature. Cells 2023, 12, 276. [Google Scholar] [CrossRef] [PubMed]
- Arango Duque, G.; Descoteaux, A. Macrophage cytokines: Involvement in immunity and infectious diseases. Front. Immunol. 2014, 5, 491. [Google Scholar] [CrossRef] [PubMed]
- Wynn, T.A.; Chawla, A.; Pollard, J.W. Macrophage biology in development; homeostasis and disease. Nature 2013, 496, 445–455. [Google Scholar] [CrossRef]
- Vannella, K.M.; Wynn, T.A. Mechanisms of organ injury and repair by macrophages. Annu. Rev. Physiol. 2017, 79, 593–617. [Google Scholar] [CrossRef]
- Ross, E.A.; Devitt, A.; Johnson, J.R. Macrophages: The good; the bad; and the gluttony. Front. Immunol. 2021, 12, 708186. [Google Scholar] [CrossRef]
- Dixit, V.M.; Green, S.; Sarma, V.; Holzman, L.B.; Wolf, F.W.; O’Rourke, K.; Ward, P.A.; Prochownik, E.V.; Marks, R.M. Tumor necrosis factor-alpha induction of novel gene products in human endothelial cells including a macrophage-specific chemotaxin. J. Biol. Chem. 1990, 265, 2973–2978. [Google Scholar] [CrossRef]
- Boone, D.L.; Turer, E.E.; Lee, E.G.; Ahmad, R.C.; Wheeler, M.T.; Tsui, C.; Hurley, P.; Chien, M.; Chai, S.; Hitotsumatsu, O.; et al. The ubiquitin-modifying enzyme A20 is required for termination of Toll-like receptor responses. Nat. Immunol. 2004, 5, 1052–1060. [Google Scholar] [CrossRef]
- Ma, A.; Malynn, B.A. A20: Linking a complex regulator of ubiquitylation to immunity and human disease. Nat. Rev. Immunol. 2012, 12, 774–785. [Google Scholar] [CrossRef]
- Catrysse, L.; Vereecke, L.; Beyaert, R.; van Loo, G. A20 in inflammation and autoimmunity. Trends Immunol. 2014, 35, 22–31. [Google Scholar] [CrossRef] [PubMed]
- Das, T.; Chen, Z.; Hendriks, R.W.; Kool, M. A20/tumor necrosis factor α-induced protein 3 in immune cells controls development of autoinflammation and autoimmunity: Lessons from mouse models. Front. Immunol. 2018, 9, 104. [Google Scholar] [CrossRef] [PubMed]
- Verstrepen, L.; Verhelst, K.; van Loo, G.; Carpentier, I.; Ley, S.C.; Beyaert, R. Expression; biological activities and mechanisms of action of A20 (TNFAIP3). Biochem. Pharmacol. 2010, 80, 2009–2020. [Google Scholar] [CrossRef] [PubMed]
- Shembade, N.; Harhaj, E.W. Regulation of NF-κB signaling by the A20 deubiquitinase. Cell Mol. Immunol. 2012, 9, 123–130. [Google Scholar] [CrossRef]
- Wu, Y.; He, X.; Huang, N.; Yu, J.; Shao, B. A20: A master regulator of arthritis. Arthritis Res. Ther. 2020, 22, 220. [Google Scholar] [CrossRef]
- Duong, B.H.; Onizawa, M.; Oses-Prieto, J.A.; Advincula, R.; Burlingame, A.; Malynn, B.A.; Ma, A. A20 restricts ubiquitination of pro-interleukin-1β protein complexes and suppresses NLRP3 inflammasome activity. Immunity 2015, 42, 55–67. [Google Scholar] [CrossRef]
- Vande Walle, L.; Van Opdenbosch, N.; Jacques, P.; Fossoul, A.; Verheugen, E.; Vogel, P.; Beyaert, R.; Elewaut, D.; Kanneganti, T.D.; van Loo, G.; et al. Negative regulation of the NLRP3 inflammasome by A20 protects against arthritis. Nature 2014, 512, 69–73. [Google Scholar] [CrossRef]
- Lin, R.; Yang, L.; Nakhaei, P.; Sun, Q.; Sharif-Askari, E.; Julkunen, I.; Hiscott, J. Negative regulation of the retinoic acid-inducible gene I-induced antiviral state by the ubiquitin-editing protein A20. J. Biol. Chem. 2006, 281, 2095–2103. [Google Scholar] [CrossRef]
- De Wilde, K.; Martens, A.; Lambrecht, S.; Jacques, P.; Drennan, M.B.; Debusschere, K.; Govindarajan, S.; Coudenys, J.; Verheugen, E.; Windels, F.; et al. A20 inhibition of STAT1 expression in myeloid cells: A novel endogenous regulatory mechanism preventing development of enthesitis. Ann. Rheum. Dis. 2017, 76, 585–592. [Google Scholar] [CrossRef]
- Liuwantara, D.; Elliot, M.; Smith, M.W.; Yam, A.O.; Walters, S.N.; Marino, E.; McShea, A.; Grey, S.T. Nuclear factor-kappaB regulates beta-cell death: A critical role for A20 in beta-cell protection. Diabetes 2006, 55, 2491–2501. [Google Scholar] [CrossRef] [PubMed]
- Bao, Z.; Fan, L.; Zhao, L.; Xu, X.; Liu, Y.; Chao, H.; Liu, N.; You, Y.; Liu, Y.; Wang, X.; et al. Silencing of A20 aggravates neuronal death and inflammation after traumatic brain injury: A potential trigger of necroptosis. Front. Mol. Neurosci. 2019, 12, 222. [Google Scholar] [CrossRef] [PubMed]
- Chen, J.; Ma, Y.; Yang, Z.; Lan, H.; Liu, G.; Zhang, Y.; Xia, H.; Wang, X.; Han, F.; Tu, X.; et al. TNFAIP3 ameliorates the degeneration of inflammatory human nucleus pulposus cells by inhibiting mTOR signaling and promoting autophagy. Aging 2020, 12, 24242–24254. [Google Scholar] [CrossRef] [PubMed]
- Lee, E.G.; Boone, D.L.; Chai, S.; Libby, S.L.; Chien, M.; Lodolce, J.P.; Ma, A. Failure to regulate TNF-induced NF-kappaB and cell death responses in A20-deficient mice. Science 2000, 289, 2350–2354. [Google Scholar] [CrossRef] [PubMed]
- Razani, B.; Whang, M.I.; Kim, F.S.; Nakamura, M.C.; Sun, X.; Advincula, R.; Turnbaugh, J.A.; Pendse, M.; Tanbun, P.; Achacoso, P.; et al. Non-catalytic ubiquitin binding by A20 prevents psoriatic arthritis-like disease and inflammation. Nat. Immunol. 2020, 21, 422–433. [Google Scholar] [CrossRef]
- Matmati, M.; Jacques, P.; Maelfait, J.; Verheugen, E.; Kool, M.; Sze, M.; Geboes, L.; Louagie, E.; Mc Guire, C.; Vereecke, L.; et al. A20 (TNFAIP3) deficiency in myeloid cells triggers erosive polyarthritis resembling rheumatoid arthritis. Nat Genet. 2011, 43, 908–912. [Google Scholar] [CrossRef]
- Montarolo, F.; Perga, S.; Tessarolo, C.; Spadaro, M.; Martire, S.; Bertolotto, A. TNFAIP3 deficiency affects monocytes; monocytes-derived cells and microglia in mice. Int. J. Mol. Sci. 2020, 21, 2830. [Google Scholar] [CrossRef]
- Takagi, M.; Ogata, S.; Ueno, H.; Yoshida, K.; Yeh, T.; Hoshino, A.; Piao, J.; Yamashita, M.; Nanya, M.; Okano, T.; et al. Haploinsufficiency of TNFAIP3 (A20) by germline mutation is involved in autoimmune lymphoproliferative syndrome. J. Allergy Clin. Immunol. 2017, 139, 1914–1922. [Google Scholar] [CrossRef]
- Aeschlimann, F.A.; Batu, E.D.; Canna, S.W.; Go, E.; Gül, A.; Hoffmann, P.; Leavis, H.L.; Ozen, S.; Schwartz, D.M.; Stone, D.L.; et al. A20 haploinsufficiency (HA20): Clinical phenotypes and disease course of patients with a newly recognised NF-kB-mediated autoinflammatory disease. Ann. Rheum. Dis. 2018, 77, 728–735. [Google Scholar] [CrossRef]
- Kadowaki, T.; Kadowaki, S.; Ohnishi, H. A20 haploinsufficiency in East Asia. Front. Immunol. 2021, 12, 780689. [Google Scholar] [CrossRef]
- Rossi, M.N.; Federici, S.; Uva, A.; Passarelli, C.; Celani, C.; Caiello, I.; Matteo, V.; Petrocchi, S.; Mortari, E.P.; De Benedetti, F.; et al. Identification of a novel mutation in TNFAIP3 in a family with poly-autoimmunity. Front. Immunol. 2022, 13, 804401. [Google Scholar] [CrossRef] [PubMed]
- Vereecke, L.; Beyaert, R.; van Loo, G. The ubiquitin-editing enzyme A20 (TNFAIP3) is a central regulator of immunopathology. Trends Immunol. 2009, 30, 383–391. [Google Scholar] [CrossRef] [PubMed]
- Dieguez-Gonzalez, R.; Calaza, M.; Perez-Pampin, E.; Balsa, A.; Blanco, F.J.; Cañete, J.D. Analysis of TNFAIP3; a feedback inhibitor of nuclear factor-κB and the neighbor intergenic 6q23 region in rheumatoid arthritis susceptibility. Arthritis Res. Ther. 2009, 11, R42. [Google Scholar] [CrossRef] [PubMed]
- Dieudé, P.; Guedj, M.; Wipff, J.; Ruiz, B.; Riemekasten, G.; Matucci-Cerinic, M.; Melchers, I.; Hachulla, E.; Airo, P.; Diot, E.; et al. Association of the TNFAIP3 rs5029939 variant with systemic sclerosis in the European Caucasian population. Ann. Rheum. Dis. 2010, 69, 1958–1964. [Google Scholar] [CrossRef] [PubMed]
- Musone, S.L.; Taylor, K.E.; Nititham, J.; Chu, C.; Poon, A.; Liao, W.; Lam, E.T.; Ma, A.; Kwok, P.Y.; Criswell, L.A. Sequencing of TNFAIP3 and association of variants with multiple autoimmune diseases. Genes. Immun. 2011, 12, 176–182. [Google Scholar] [CrossRef]
- Koumakis, E.; Giraud, M.; Dieudé, P.; Cohignac, V.; Cuomo, G.; Airò, P.; Hachulla, E.; Matucci-Cerinic, M.; Diot, E.; Caramaschi, P.; et al. Brief report: Candidate gene study in systemic sclerosis identifies a rare and functional variant of the TNFAIP3 locus as a risk factor for polyautoimmunity. Arthritis Rheum. 2012, 64, 2746–2752. [Google Scholar] [CrossRef]
- Navone, N.D.; Perga, S.; Martire, S.; Berchialla, P.; Malucchi, S.; Bertolotto, A. Monocytes and CD4+ T cells contribution to the under-expression of NR4A2 and TNFAIP3 genes in patients with multiple sclerosis. J. Neuroimmunol. 2014, 272, 99–102. [Google Scholar] [CrossRef]
- Perga, S.; Martire, S.; Montarolo, F.; Navone, N.D.; Calvo, A.; Fuda, G.; Marchet, A.; Leotta, D.; Chiò, A.; Bertolotto, A. A20 in multiple sclerosis and Parkinson’s disease: Clue to a common dysregulation of anti-inflammatory pathways? Neurotox. Res. 2017, 32, 1–7. [Google Scholar] [CrossRef]
- Momtazi, G.; Lambrecht, B.N.; Naranjo, J.R.; Schock, B.C. Regulators of A20 (TNFAIP3): New drug-able targets in inflammation. Am. J. Physiol. Lung Cell Mol. Physiol. 2019, 316, L456–L469. [Google Scholar] [CrossRef]
- He, K.L.; Ting, A.T. A20 inhibits tumor necrosis factor (TNF) alpha-induced apoptosis by disrupting recruitment of TRADD and RIP to the TNF receptor 1 complex in Jurkat T cells. Mol. Cell Biol. 2002, 22, 6034–6045. [Google Scholar] [CrossRef]
- Wang, Y.Y.; Li, L.; Han, K.J.; Zhai, Z.; Shu, H.B. A20 is a potent inhibitor of TLR3- and Sendai virus-induced activation of NF-kappaB and ISRE and IFN-beta promoter. FEBS Lett. 2004, 576, 86–90. [Google Scholar] [CrossRef] [PubMed]
- Weng, M.; Walker, W.A.; Sanderson, I.R. Butyrate regulates the expression of pathogen-triggered IL-8 in intestinal epithelia. Pediatr. Res. 2007, 62, 542–546. [Google Scholar] [CrossRef] [PubMed]
- Wang, J.; Ouyang, Y.; Guner, Y.; Ford, H.R.; Grishin, A.V. Ubiquitin-editing enzyme A20 promotes tolerance to lipopolysaccharide in enterocytes. J. Immunol. 2009, 183, 1384–1392. [Google Scholar] [CrossRef]
- Zhao, H.; Wang, L.; Luo, H.; Li, Q.Z.; Zuo, X. TNFAIP3 downregulation mediated by histone modification contributes to T-cell dysfunction in systemic lupus erythematosus. Rheumatology 2017, 56, 835–843. [Google Scholar] [CrossRef]
- Antonia, R.J.; Karelehto, E.; Toriguchi, K.; Matli, M.; Warren, R.S.; Pfeffer, L.M.; Donner, D.B. STAT3 regulates inflammatory cytokine production downstream of TNFR1 by inducing expression of TNFAIP3/A20. J. Cell Mol. Med. 2022, 26, 4591–4601. [Google Scholar] [CrossRef] [PubMed]
- Li, B.; Xie, X. A20 (TNFAIP3) alleviates viral myocarditis through ADAR1/miR-1a-3p-dependent regulation. BMC Cardiovasc. Disord. 2022, 22, 10. [Google Scholar] [CrossRef] [PubMed]
- Burke, B.; Sumner, S.; Maitland, N.; Lewis, C.E. Macrophages in gene therapy: Cellular delivery vehicles and in vivo targets. J. Leukoc. Biol. 2002, 72, 417–428. [Google Scholar] [CrossRef]
- Keller, A.A.; Maeß, M.B.; Schnoor, M.; Scheiding, B.; Lorkowski, S. Transfecting macrophages. Methods Mol. Biol. 2018, 1784, 187–195. [Google Scholar] [CrossRef]
- Lyadova, I.; Vasiliev, A. Macrophages derived from pluripotent stem cells: Prospective applications and research gaps. Cell Biosci. 2022, 12, 96. [Google Scholar] [CrossRef]
- Malakhova, A.A.; Grigor’eva, E.V.; Pavlova, S.V.; Malankhanova, T.B.; Valetdinova, K.R.; Vyatkin, Y.V.; Khabarova, E.A.; Rzaev, J.A.; Zakian, S.M.; Medvedev, S.P. Generation of induced pluripotent stem cell lines ICGi021-A and ICGi022-A from peripheral blood mononuclear cells of two healthy individuals from Siberian population. Stem Cell Res. 2020, 48, 101952. [Google Scholar] [CrossRef]
- Martins, T.M.; de Paula, A.C.; Gomes, D.A.; Goes, A.M. Alkaline phosphatase expression/activity and multilineage differentiation potential are the differences between fibroblasts and orbital fat-derived stem cells—A study in animal serum-free culture conditions. Stem Cell Rev. Rep. 2014, 10, 697–711. [Google Scholar] [CrossRef] [PubMed]
- Štefková, K.; Procházková, J.; Pacherník, J. Alkaline phosphatase in stem cells. Stem Cells Int. 2015, 2015, 628368. [Google Scholar] [CrossRef] [PubMed]
- Rizzino, A. Concise review: The Sox2-Oct4 connection: Critical players in a much larger interdependent network integrated at multiple levels. Stem Cells 2013, 31, 1033–1039. [Google Scholar] [CrossRef]
- van Schaijik, B.; Davis, P.F.; Wickremesekera, A.C.; Tan, S.T.; Itinteang, T. Subcellular localisation of the stem cell markers OCT4; SOX2; NANOG.; KLF4 and c-MYC in cancer: A review. J. Clin. Pathol. 2018, 71, 88–91. [Google Scholar] [CrossRef] [PubMed]
- Wang, Z.; Oron, E.; Nelson, B.; Razis, S.; Ivanova, N. Distinct lineage specification roles for NANOG.; OCT4; and SOX2 in human embryonic stem cells. Cell Stem Cell 2012, 10, 440–454. [Google Scholar] [CrossRef]
- Wilkinson, D.G.; Bhatt, S.; Herrmann, B.G. Expression pattern of the mouse T gene and its role in mesoderm formation. Nature 1990, 343, 657–659. [Google Scholar] [CrossRef]
- Burtscher, I.; Lickert, H. Foxa2 regulates polarity and epithelialization in the endoderm germ layer of the mouse embryo. Development 2009, 136, 1029–1038. [Google Scholar] [CrossRef]
- Zhang, X.; Huang, C.T.; Chen, J.; Pankratz, M.T.; Xi, J.; Li, J.; Yang, Y.; Lavaute, T.M.; Li, X.J.; Ayala, M.; et al. Pax6 is a human neuroectoderm cell fate determinant. Cell Stem Cell 2010, 7, 90–100. [Google Scholar] [CrossRef]
- Kuang, Y.L.; Munoz, A.; Nalula, G.; Santostefano, K.E.; Sanghez, V.; Sanchez, G.; Terada, N.; Mattis, A.N.; Iacovino, M.; Iribarren, C.; et al. Evaluation of commonly used ectoderm markers in IPSC trilineage differentiation. Stem Cell Res. 2019, 37, 101434. [Google Scholar] [CrossRef]
- Takata, K.; Kozaki, T.; Lee, C.; Thion, M.S.; Otsuka, M.; Lim, S.; Utami, K.H.; Fidan, K.; Park, D.S.; Malleret, B.; et al. Induced-pluripotent-stem-cell-derived primitive macrophages provide a platform for modeling tissue-resident macrophage differentiation and function. Immunity 2017, 47, 183–198. [Google Scholar] [CrossRef]
- Klepikova, A.; Nenasheva, T.; Sheveleva, O.; Protasova, E.; Antonov, D.; Gainullina, A.; Chikina, E.; Sakovnich, O.; Gerasimova, T.; Nikitina, I.; et al. iPSC-derived macrophages: The differentiation protocol affects cell immune characteristics and differentiation trajectories. Int. J. Mol. Sci. 2022, 23, 16087. [Google Scholar] [CrossRef] [PubMed]
- Nenasheva, T.; Gerasimova, T.; Serdyuk, Y.; Grigor’eva, E.; Kosmiadi, G.; Nikolaev, A.; Dashinimaev, E.; Lyadova, I. Macrophages derived from human induced pluripotent stem cells are low-activated “naïve-like” cells capable of restricting mycobacteria growth. Front. Immunol. 2020, 11, 1016. [Google Scholar] [CrossRef] [PubMed]
- Gene Expression Omnibus (GEO.; NCBI); Accession Number GSE220450. Available online: https://www.ncbi.nlm.nih.gov/geo/ (accessed on 23 May 2023).
- Lyadova, I.; Gerasimova, T.; Nenasheva, T. Macrophages derived from human induced pluripotent stem cells: The diversity of protocols; future prospects; and outstanding questions. Front. Cell Dev Biol. 2021, 9, 640703. [Google Scholar] [CrossRef] [PubMed]
- Uhlén, M.; Fagerberg, L.; Hallström, B.M.; Lindskog, C.; Oksvold, P.; Mardinoglu, A.; Sivertsson, Å.; Kampf, C.; Sjöstedt, E.; Asplund, A.; et al. Proteomics. Tissue-based map of the human proteome. Science 2015, 347, 1260419. [Google Scholar] [CrossRef]
- Human Protein Atlas. Available online: https://www.proteinatlas.org/ENSG00000118503-TNFAIP3/structure (accessed on 23 May 2023).
- Sharif, O.; Bolshakov, V.N.; Raines, S.; Newham, P.; Perkins, N.D. Transcriptional profiling of the LPS induced NF-κB response in macrophages. BMC Immunol. 2007, 8, 1. [Google Scholar] [CrossRef]
- Ackermann, M.; Kuhn, A.; Kunkiel, J.; Merkert, S.; Martin, U.; Moritz, T.; Lachmann, N. Ex vivo generation of genetically modified macrophages from human induced pluripotent stem cells. Transfus. Med. Hemother. 2017, 44, 135–142. [Google Scholar] [CrossRef]
- Lachmann, N.; Happle, C.; Ackermann, M.; Lüttge, D.; Wetzke, M.; Merkert, S.; Hetzel, M.; Kensah, G.; Jara-Avaca, M.; Mucci, A.; et al. Gene correction of human induced pluripotent stem cells repairs the cellular phenotype in pulmonary alveolar proteinosis. Amer J. Resp. Critic Care Med. 2014, 189, 167–182. [Google Scholar] [CrossRef]
- Flynn, R.; Grundmann, A.; Renz, P.; Hänseler, W.; James, W.S.; Cowley, S.A.; Moore, M.D. CRISPR-mediated genotypic and phenotypic correction of a chronic granulomatous disease mutation in human iPS cells. Exp. Hematol. 2015, 43, 838–848.e3. [Google Scholar] [CrossRef]
- Kuhn, A.; Ackermann, M.; Mussolino, C.; Cathomen, T.; Lachmann, N.; Moritz, T. TALEN-mediated functional correction of human iPSC-derived macrophages in context of hereditary pulmonary alveolar proteinosis. Sci. Rep. 2017, 7, 15195. [Google Scholar] [CrossRef]
- Takada, S.; Kambe, N.; Kawasaki, Y.; Niwa, A.; Honda-Ozaki, F.; Kobayashi, K.; Osawa, M.; Nagahashi, A.; Semi, K.; Hotta, A.; et al. Pluripotent stem cell models of Blau syndrome reveal an IFN-γ-dependent inflammatory response in macrophages. J. Allergy Clin. Immunol. 2018, 141, 339–349. [Google Scholar] [CrossRef]
- Klatt, D.; Cheng, E.; Philipp, F.; Selich, A.; Dahlke, J.; Schmidt, R.E.; Schott, J.W.; Büning, H.; Hoffmann, D.; Thrasher, A.J.; et al. Targeted repair of p47-CGD in iPSCs by CRISPR/Cas9: Functional correction without cleavage in the highly homologous pseudogenes. Stem Cell Rep. 2019, 13, 590–598. [Google Scholar] [CrossRef] [PubMed]
- Sens, J.; Hoffmann, D.; Lange, L.; Vollmer Barbosa, P.; Morgan, M.A.; Falk, C.S.; Schambach, A. Knock-out iPSCs for disease and therapy modeling of IL-10 associated primary immunodeficiencies. Hum. Gene Ther. 2021, 32, 77–95. [Google Scholar] [CrossRef] [PubMed]
- Taylor, J.P.; Cash, M.N.; Santostefano, K.E.; Nakanishi, M.; Terada, N.; Wallet, M.A. CRISPR/Cas9 knockout of USP18 enhances type I IFN responsiveness and restricts HIV-1 infection in macrophages. J. Leukoc. Biol. 2018, 103, 1225–1240. [Google Scholar] [CrossRef] [PubMed]
- Lee, H.; Flynn, R.; Sharma, I.; Haberman, E.; Carling, P.J.; Nicholls, F.J.; Stegmann, M.; Vowles, J.; Haenseler, W.; Wade-Martins, R.; et al. LRRK2 is recruited to phagosomes and co-recruits RAB8 and RAB10 in human pluripotent stem cell-derived macrophages. Stem Cell Rep. 2020, 14, 940–955. [Google Scholar] [CrossRef] [PubMed]
- Senju, S.; Haruta, M.; Matsumura, K.; Matsunaga, Y.; Fukushima, S.; Ikeda, T.; Takamatsu, K.; Irie, A.; Nishimura, Y. Generation of dendritic cells and macrophages from human induced pluripotent stem cells aiming at cell therapy. Gene Ther. 2011, 18, 874–883. [Google Scholar] [CrossRef] [PubMed]
- Miyashita, A.; Fukushima, S.; Nakahara, S.; Kubo, Y.; Tokuzumi, A.; Yamashita, J.; Aoi, J.; Haruta, M.; Senju, S.; Nishimura, Y.; et al. Immunotherapy against metastatic melanoma with human iPS cell-derived myeloid cell lines producing type I interferons. Cancer Immunol. Res. 2016, 4, 248–258. [Google Scholar] [CrossRef]
- Zhu, P.; Aller, M.I.; Baron, U.; Cambridge, S.; Bausen, M.; Herb, J.; Sawinski, J.; Cetin, A.; Osten, P.; Nelson, M.L.; et al. Silencing and un-silencing of tetracycline-controlled genes in neurons. PLoS ONE 2007, 2, e533. [Google Scholar] [CrossRef]
- Ustyantseva, E.; Pavlova, S.V.; Malakhova, A.A.; Ustyantsev, K.; Zakian, S.M.; Medvedev, S.P. Oxidative stress monitoring in iPSC-derived motor neurons using genetically encoded biosensors of H2O2. Sci. Rep. 2022, 12, 8928. [Google Scholar] [CrossRef]
- Buchrieser, J.; James, W.; Moore, M.D. Human induced pluripotent stem cell-derived macrophages share ontogeny with MYB-independent tissue-resident macrophages. Stem Cell Rep. 2017, 8, 334–345. [Google Scholar] [CrossRef]
- Nakagawa, M.M.; Thummar, K.; Mandelbaum, J.; Pasqualucci, L.; Rathinam, C.V. Lack of the ubiquitin-editing enzyme A20 results in loss of hematopoietic stem cell quiescence. J. Exp. Med. 2015, 212, 203–216. [Google Scholar] [CrossRef]
- Nakagawa, M.M.; Davis, H.; Rathinam, C.V. A20 deficiency in multipotent progenitors perturbs quiescence of hematopoietic stem cells. Stem Cell Res. 2018, 33, 199–205. [Google Scholar] [CrossRef] [PubMed]
- Smith, M.A.; Culver-Cochran, A.E.; Adelman, E.R.; Rhyasen, G.W.; Ma, A.; Figueroa, M.E.; Starczynowski, D.T. TNFAIP3 plays a role in aging of the hematopoietic system. Front. Immunol. 2020, 11, 536442. [Google Scholar] [CrossRef] [PubMed]
- Frenzel, L.P.; Claus, R.; Plume, N.; Schwamb, J.; Konermann, C.; Pallasch, C.P.; Claasen, J.; Brinker, R.; Wollnik, B.; Plass, C.; et al. Sustained NF-kappaB activity in chronic lymphocytic leukemia is independent of genetic and epigenetic alterations in the TNFAIP3 (A20) locus. Int. J. Cancer 2011, 128, 2495–2500. [Google Scholar] [CrossRef] [PubMed]
- Lai, T.Y.; Wu, S.D.; Tsai, M.H.; Chuang, E.Y.; Chuang, L.L.; Hsu, L.C.; Lai, L.C. Transcription of Tnfaip3 is regulated by NF-κB and p38 via C/EBPβ in activated macrophages. PLoS ONE 2013, 8, e73153. [Google Scholar] [CrossRef]
- Zammit, N.W.; Siggs, O.M.; Gray, P.E.; Horikawa, K.; Langley, D.B.; Walters, S.N.; Daley, S.R.; Loetsch, C.; Warren, J.; Yap, J.Y.; et al. Denisovan; modern human and mouse TNFAIP3 alleles tune A20 phosphorylation and immunity. Nat. Immunol. 2019, 20, 1299–1310. [Google Scholar] [CrossRef]
- NCBI SRA; Accession Number SRR11413027. Available online: https://www.ncbi.nlm.nih.gov/clinvar/variation/1281403/?oq= (accessed on 23 May 2023).
- Coornaert, B.; Baens, M.; Heyninck, K.; Bekaert, T.; Haegman, M.; Staal, J.; Sun, L.; Chen, Z.J.; Marynen, P.; Beyaert, R. T cell antigen receptor stimulation induces MALT1 paracaspase–mediated cleavage of the NF-κB inhibitor A20. Nat. Immunol. 2008, 9, 263–271. [Google Scholar] [CrossRef]
- Düwel, M.; Welteke, V.; Oeckinghaus, A.; Baens, M.; Kloo, B.; Ferch, U.; Darnay, B.G.; Ruland, J.; Marynen, P.; Krappmann, D. A20 negatively regulates T cell receptor signaling to NF-kappaB by cleaving Malt1 ubiquitin chains. J. Immunol. 2009, 182, 7718–7728. [Google Scholar] [CrossRef]
- Malinverni, C.; Unterreiner, A.; Staal, J.; Demeyer, A.; Galaup, M.; Luyten, M.; Luyten, M.; Beyaert, R.; Bornancin, F. Cleavage by MALT1 induces cytosolic release of A20. Biochem. Biophys. Res. Commun. 2010, 400, 543–547. [Google Scholar] [CrossRef]
- Pinna, F.; Bissinger, M.; Beuke, K.; Huber, N.; Longerich, T.; Kummer, U.; Schirmacher, P.; Sahle, S.; Breuhahn, K. A20/TNFAIP3 discriminates tumor necrosis factor (TNF)-induced NF-κB from JNK pathway activation in hepatocytes. Front. Physiol. 2017, 8, 610. [Google Scholar] [CrossRef]
- Human Pluripotent Stem Cell Registry; Accession Number ICGi022-A. Available online: https://hpscreg.eu/cell-line/ICGi022-A (accessed on 3 July 2023).
- Grigor’eva, E.V.; Malankhanova, T.B.; Surumbayeva, A.; Pavlova, S.V.; Minina, J.M.; Kizilova, E.A.; Suldina, L.A.; Morozova, K.N.; Kiseleva, E.; Sorokoumov, E.D.; et al. Generation of GABAergic striatal neurons by a novel iPSC differentiation protocol enabling scalability and cryopreservation of progenitor cells. Cytotechnology 2020, 72, 649–663. [Google Scholar] [CrossRef]
- Laemmli, U.K. Cleavage of structural proteins during the assembly of the head of bacteriophage T4. Nature 1970, 227, 680–685. [Google Scholar] [CrossRef] [PubMed]


Disclaimer/Publisher’s Note: The statements, opinions and data contained in all publications are solely those of the individual author(s) and contributor(s) and not of MDPI and/or the editor(s). MDPI and/or the editor(s) disclaim responsibility for any injury to people or property resulting from any ideas, methods, instructions or products referred to in the content. |
© 2023 by the authors. Licensee MDPI, Basel, Switzerland. This article is an open access article distributed under the terms and conditions of the Creative Commons Attribution (CC BY) license (https://creativecommons.org/licenses/by/4.0/).
Share and Cite
Sheveleva, O.; Protasova, E.; Nenasheva, T.; Butorina, N.; Melnikova, V.; Gerasimova, T.; Sakovnich, O.; Kurinov, A.; Grigor’eva, E.; Medvedev, S.; et al. A Model of iPSC-Derived Macrophages with TNFAIP3 Overexpression Reveals the Peculiarities of TNFAIP3 Protein Expression and Function in Human Macrophages. Int. J. Mol. Sci. 2023, 24, 12868. https://doi.org/10.3390/ijms241612868
Sheveleva O, Protasova E, Nenasheva T, Butorina N, Melnikova V, Gerasimova T, Sakovnich O, Kurinov A, Grigor’eva E, Medvedev S, et al. A Model of iPSC-Derived Macrophages with TNFAIP3 Overexpression Reveals the Peculiarities of TNFAIP3 Protein Expression and Function in Human Macrophages. International Journal of Molecular Sciences. 2023; 24(16):12868. https://doi.org/10.3390/ijms241612868
Chicago/Turabian StyleSheveleva, Olga, Elena Protasova, Tatiana Nenasheva, Nina Butorina, Victoria Melnikova, Tatiana Gerasimova, Olga Sakovnich, Alexander Kurinov, Elena Grigor’eva, Sergey Medvedev, and et al. 2023. "A Model of iPSC-Derived Macrophages with TNFAIP3 Overexpression Reveals the Peculiarities of TNFAIP3 Protein Expression and Function in Human Macrophages" International Journal of Molecular Sciences 24, no. 16: 12868. https://doi.org/10.3390/ijms241612868
APA StyleSheveleva, O., Protasova, E., Nenasheva, T., Butorina, N., Melnikova, V., Gerasimova, T., Sakovnich, O., Kurinov, A., Grigor’eva, E., Medvedev, S., & Lyadova, I. (2023). A Model of iPSC-Derived Macrophages with TNFAIP3 Overexpression Reveals the Peculiarities of TNFAIP3 Protein Expression and Function in Human Macrophages. International Journal of Molecular Sciences, 24(16), 12868. https://doi.org/10.3390/ijms241612868