
Platelet-Derived Extracellular Vesicles as Lipid Carriers in Severe Allergic Inflammation
 ,
,  ,
,  ,
,  , , ,
, , ,  and
and 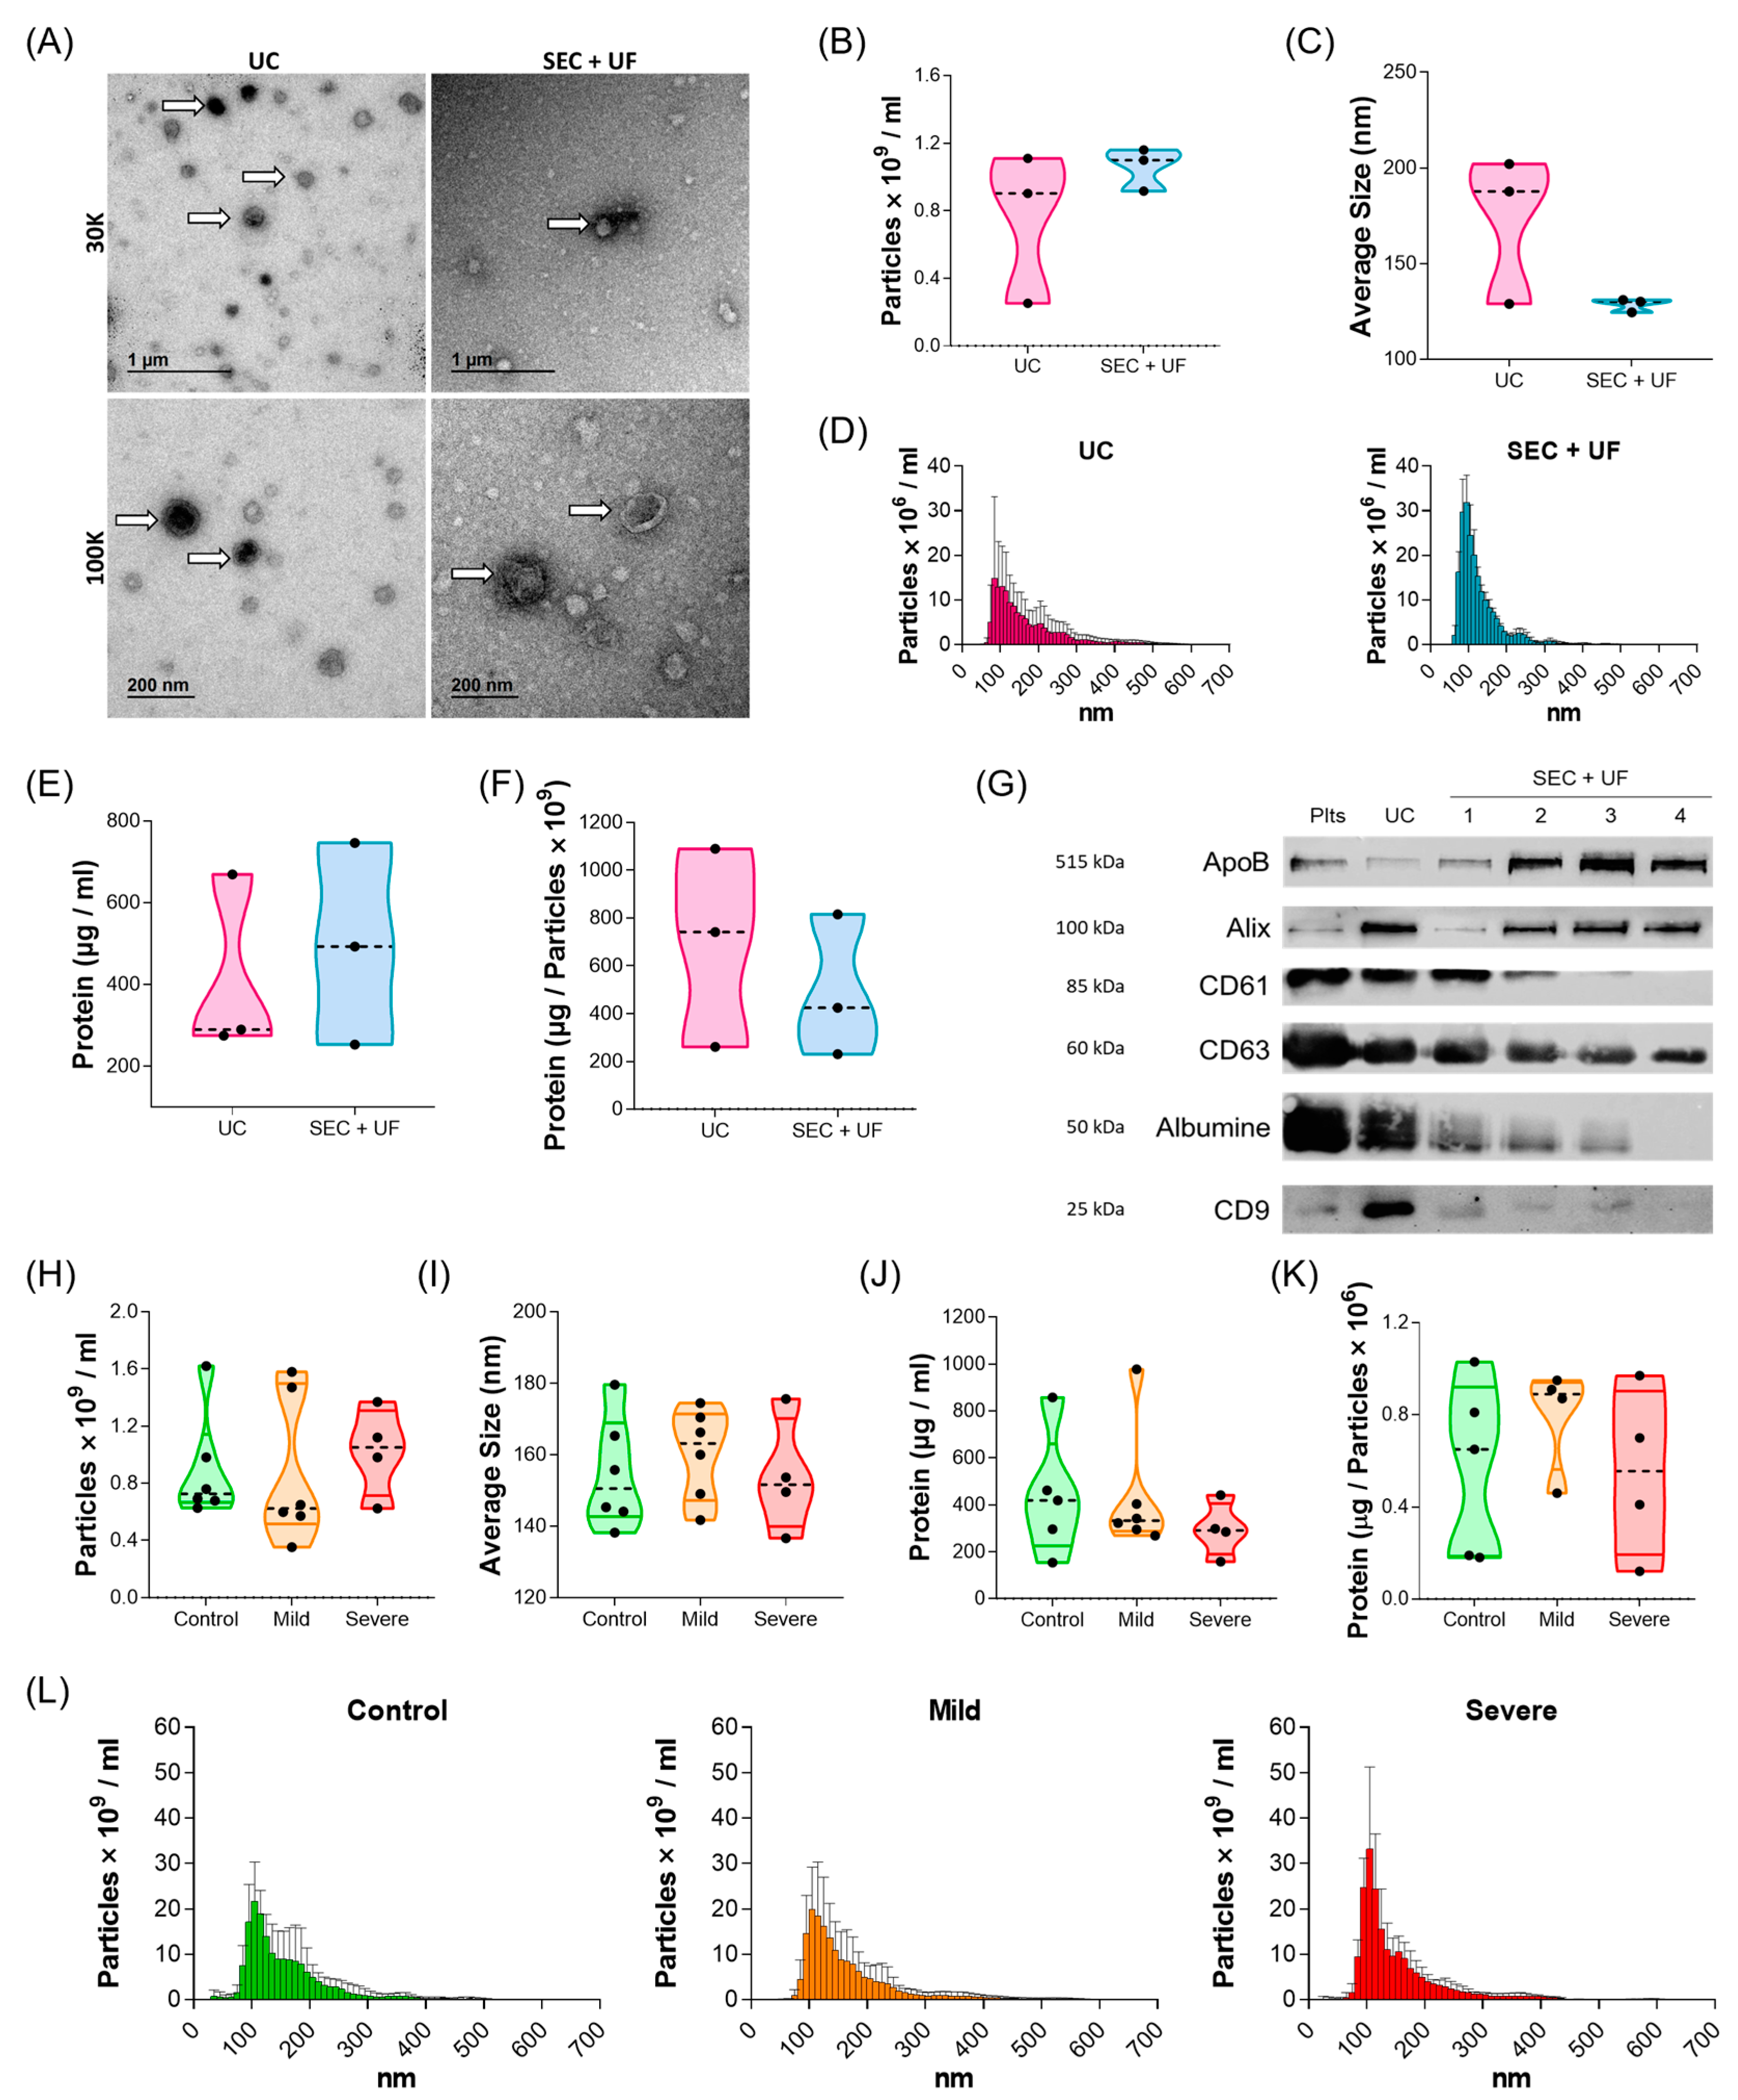
Abstract
1. Introduction
2. Results
2.1. Patient Cohort and Platelet Sample Characterisation
2.2. Characterisation of PL-EVs in Patients with Different Allergic Inflammatory Degrees
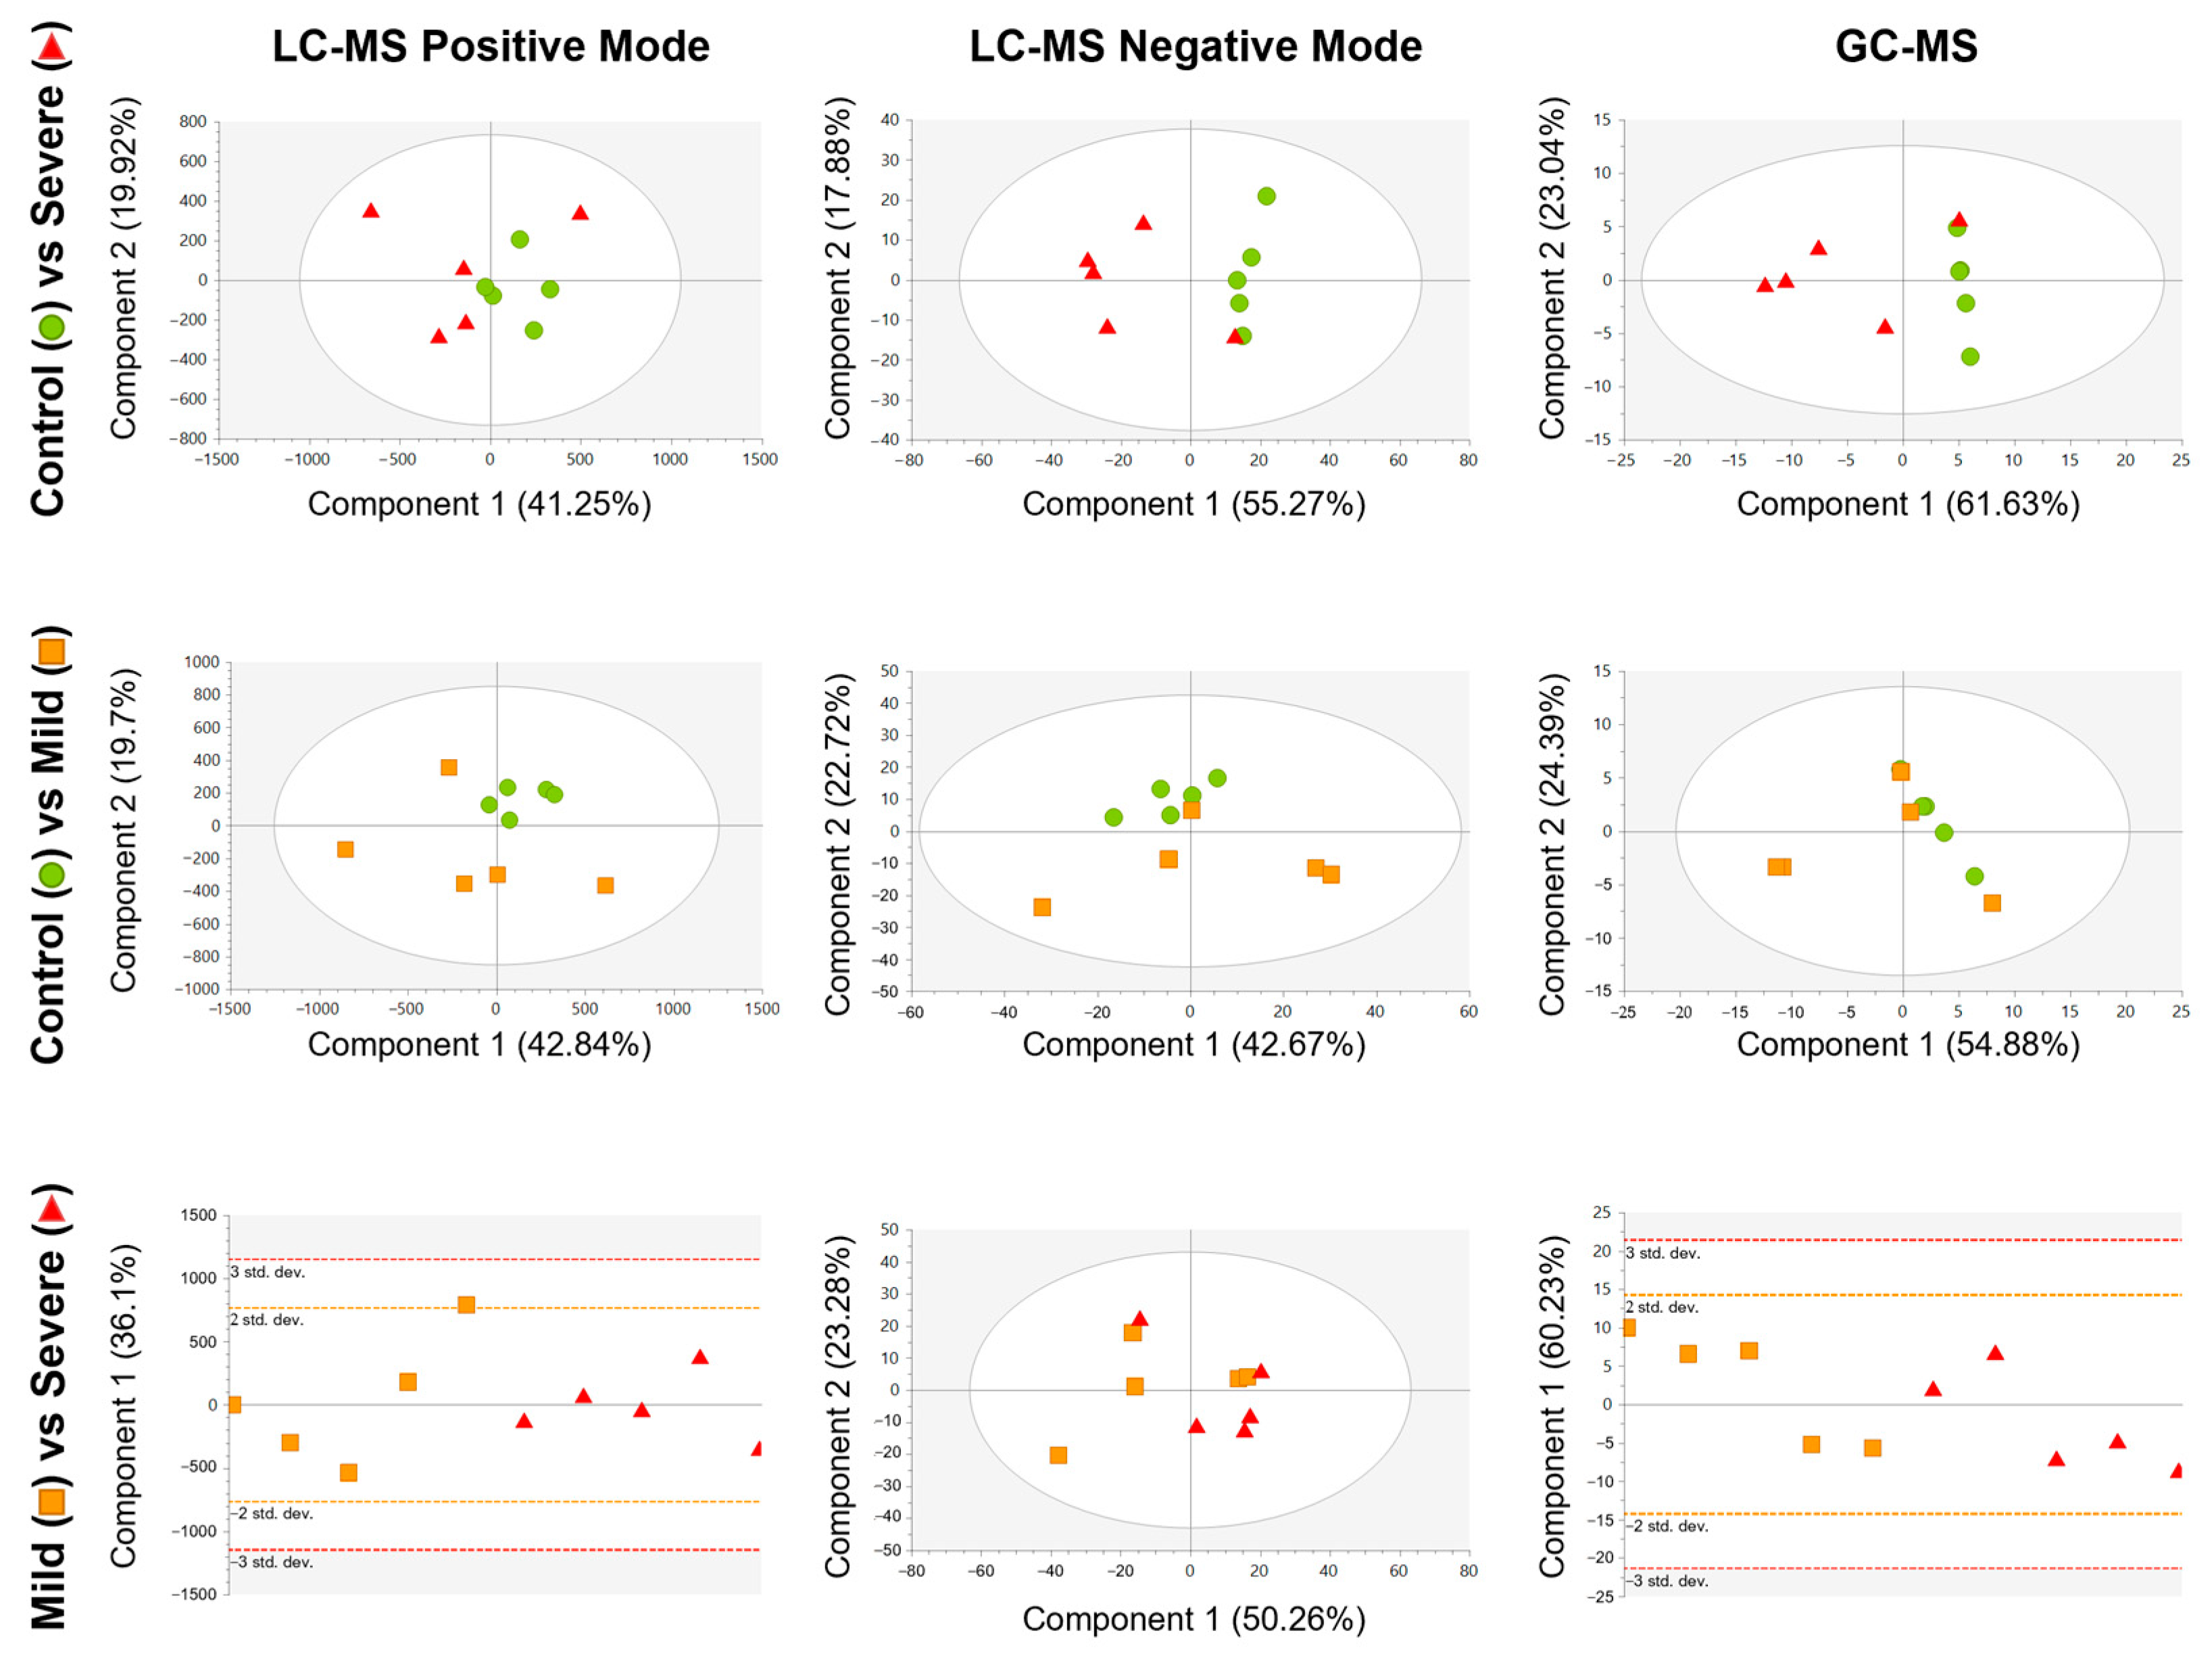
2.3. Comparative Metabolic Analysis of PL-EVs from Patients with Different Allergic Inflammatory Grades
2.4. Defining the Lipid and Metabolic Changes in the PL-EV Cargo in Allergic Patients Compared to Control Subjects
2.5. Identifying Metabolites Carried by PL-EVs in Patients with Allergic Inflammation
2.6. Biological Pathways Associated with PL-EV Metabolomic Profiles in Allergic Inflammation
3. Discussion
4. Materials and Methods
4.1. Patients
4.2. Sample Collection and Processing
4.3. Isolation Methods for EVs
4.3.1. Ultracentrifugation (UC)
4.3.2. Size Exclusion Chromatography and Ultrafiltration (SEC + UF)
4.4. EV Characterisation
4.4.1. Protein Quantification
4.4.2. Western Blot
4.4.3. Nano Tracking Particle Analysis (NTA)
4.4.4. Transmission Electron Microscopy (TEM)
4.5. Statistical Analysis
4.6. Metabolomic Studies
4.6.1. Sample Treatment for LC-MS
4.6.2. Sample Treatment for GC-MS
5. Conclusions
Supplementary Materials
Author Contributions
Funding
Institutional Review Board Statement
Informed Consent Statement
Data Availability Statement
Acknowledgments
Conflicts of Interest
References
- Medzhitov, R. Origin and physiological roles of inflammation. Nature 2008, 454, 428–435. [Google Scholar] [CrossRef] [PubMed]
- Leuti, A.; Fazio, D.; Fava, M.; Piccoli, A.; Oddi, S.; Maccarrone, M. Bioactive lipids, inflammation and chronic diseases. Adv. Drug Deliv. Rev. 2020, 159, 133–169. [Google Scholar] [CrossRef] [PubMed]
- Pahwa, R.; Goyal, A. Chronic Inflammation. In StatPearls; Jialal, I., Ed.; StatPearls Publishing: Treasure Island, FL, USA, 2022. [Google Scholar]
- Sherwood, E.R.; Toliver-Kinsky, T. Mechanisms of the inflammatory response. Best Pract. Res. Clin. Anaesthesiol. 2004, 18, 385–405. [Google Scholar] [CrossRef] [PubMed]
- Boilard, E.; Bellio, M. Platelet extracellular vesicles and the secretory interactome join forces in health and disease. Immunol. Rev. 2022, 312, 38–51. [Google Scholar] [CrossRef]
- Orian, J.M.; D’Souza, C.S.; Kocovski, P.; Krippner, G.; Hale, M.W.; Wang, X.; Peter, K. Platelets in Multiple Sclerosis: Early and Central Mediators of Inflammation and Neurodegeneration and Attractive Targets for Molecular Imaging and Site-Directed Therapy. Front. Immunol. 2021, 12, 620963. [Google Scholar] [CrossRef]
- Matowicka-Karna, J. Markers of inflammation, activation of blood platelets and coagulation disorders in inflammatory bowel diseases. Postepy Hig. Med. Dosw. 2016, 70, 305–312. [Google Scholar] [CrossRef]
- Tokarz-Deptuła, B.; Palma, J.; Baraniecki, Ł.; Stosik, M.; Kołacz, R.; Deptuła, W. What Function Do Platelets Play in Inflammation and Bacterial and Viral Infections? Front. Immunol. 2021, 12, 770436. [Google Scholar] [CrossRef]
- Obeso, D.; Mera-Berriatua, L.; Rodríguez-Coira, J.; Rosace, D.; Fernández, P.; Martín-Antoniano, I.A.; Santaolalla, M.; Marco Martín, G.; Chivato, T.; Fernández-Rivas, M.; et al. Multi-omics analysis points to altered platelet functions in severe food-associated respiratory allergy. Allergy 2018, 73, 2137–2149. [Google Scholar] [CrossRef]
- Pablo-Torres, C.; Izquierdo, E.; Tan, T.J.; Obeso, D.; Layhadi, J.A.; Sánchez-Solares, J.; Mera-Berriatua, L.; Bueno-Cabrera, J.L.; Del Mar Reaño-Martos, M.; Iglesias-Cadarso, A.; et al. Deciphering the role of platelets in severe allergy by an integrative omics approach. Allergy 2023, 78, 1319–1332. [Google Scholar] [CrossRef]
- Puhm, F.; Boilard, E.; Machlus, K.R. Platelet Extracellular Vesicles: Beyond the Blood. Arterioscler. Thromb. Vasc. Biol. 2021, 41, 87–96. [Google Scholar] [CrossRef]
- Vajen, T.; Mause, S.F.; Koenen, R.R. Microvesicles from platelets: Novel drivers of vascular inflammation. Thromb. Haemost. 2015, 114, 228–236. [Google Scholar] [CrossRef] [PubMed]
- Théry, C.; Witwer, K.W.; Aikawa, E.; Alcaraz, M.J.; Anderson, J.D.; Andriantsitohaina, R.; Antoniou, A.; Arab, T.; Archer, F.; Atkin-Smith, G.K.; et al. Minimal information for studies of extracellular vesicles 2018 (MISEV2018): A position statement of the International Society for Extracellular Vesicles and update of the MISEV2014 guidelines. J. Extracell. Vesicles 2018, 7, 1535750. [Google Scholar] [CrossRef] [PubMed]
- Buzas, E.I.; György, B.; Nagy, G.; Falus, A.; Gay, S. Emerging role of extracellular vesicles in inflammatory diseases. Nat. Rev. Rheumatol. 2014, 10, 356–364. [Google Scholar] [CrossRef] [PubMed]
- Abels, E.R.; Breakefield, X.O. Introduction to Extracellular Vesicles: Biogenesis, RNA Cargo Selection, Content, Release, and Uptake. Cell. Mol. Neurobiol. 2016, 36, 301–312. [Google Scholar] [CrossRef]
- Berckmans, R.J.; Nieuwland, R.; Böing, A.N.; Romijn, F.P.; Hack, C.E.; Sturk, A. Cell-derived microparticles circulate in healthy humans and support low grade thrombin generation. Thromb. Haemost. 2001, 85, 639–646. [Google Scholar] [PubMed]
- Auber, M.; Svenningsen, P. An estimate of extracellular vesicle secretion rates of human blood cells. J. Extracell. Biol. 2022, 1, e46. [Google Scholar] [CrossRef]
- Barry, O.P.; Pratico, D.; Lawson, J.A.; FitzGerald, G.A. Transcellular activation of platelets and endothelial cells by bioactive lipids in platelet microparticles. J. Clin. Investig. 1997, 99, 2118–2127. [Google Scholar] [CrossRef]
- Spakova, T.; Janockova, J.; Rosocha, J. Characterization and Therapeutic Use of Extracellular Vesicles Derived from Platelets. Int. J. Mol. Sci. 2021, 22, 9701. [Google Scholar] [CrossRef]
- Sadallah, S.; Amicarella, F.; Eken, C.; Iezzi, G.; Schifferli, J.A. Ectosomes released by platelets induce differentiation of CD4+T cells into T regulatory cells. Thromb. Haemost. 2014, 112, 1219–1229. [Google Scholar] [CrossRef]
- Vasina, E.M.; Cauwenberghs, S.; Staudt, M.; Feijge, M.A.; Weber, C.; Koenen, R.R.; Heemskerk, J.W. Aging- and activation-induced platelet microparticles suppress apoptosis in monocytic cells and differentially signal to proinflammatory mediator release. Am. J. Blood Res. 2013, 3, 107–123. [Google Scholar]
- Diehl, P.; Nienaber, F.; Zaldivia, M.T.K.; Stamm, J.; Siegel, P.M.; Mellett, N.A.; Wessinger, M.; Wang, X.; McFadyen, J.D.; Bassler, N.; et al. Lysophosphatidylcholine is a Major Component of Platelet Microvesicles Promoting Platelet Activation and Reporting Atherosclerotic Plaque Instability. Thromb. Haemost. 2019, 119, 1295–1310. [Google Scholar] [CrossRef] [PubMed]
- Galli, S.J.; Tsai, M.; Piliponsky, A.M. The development of allergic inflammation. Nature 2008, 454, 445–454. [Google Scholar] [CrossRef]
- Page, C.; Pitchford, S. Platelets and allergic inflammation. Clin. Exp. Allergy 2014, 44, 901–913. [Google Scholar] [CrossRef] [PubMed]
- Idzko, M.; Pitchford, S.; Page, C. Role of platelets in allergic airway inflammation. J. Allergy Clin. Immunol. 2015, 135, 1416–1423. [Google Scholar] [CrossRef]
- Gomez-Casado, C.; Villaseñor, A.; Rodriguez-Nogales, A.; Bueno, J.L.; Barber, D.; Escribese, M.M. Understanding Platelets in Infectious and Allergic Lung Diseases. Int. J. Mol. Sci. 2019, 20, 1730. [Google Scholar] [CrossRef]
- Pablo-Torres, C.; Delgado-Dolset, M.I.; Sanchez-Solares, J.; Mera-Berriatua, L.; Núñez Martín Buitrago, L.; Reaño Martos, M.; Bueno, J.L.; Escribese, M.M.; Barber, D.; Gomez-Casado, C. A method based on plateletpheresis to obtain functional platelet, CD3+ and CD14+ matched populations for research immunological studies. Clin. Exp. Allergy 2022, 52, 1157–1168. [Google Scholar] [CrossRef] [PubMed]
- Knijff-Dutmer, E.a.J.; Koerts, J.; Nieuwland, R.; Kalsbeek-Batenburg, E.M.; van de Laar, M.A.F.J. Elevated levels of platelet microparticles are associated with disease activity in rheumatoid arthritis. Arthritis Rheum. 2002, 46, 1498–1503. [Google Scholar] [CrossRef]
- Sheremata, W.A.; Jy, W.; Horstman, L.L.; Ahn, Y.S.; Alexander, J.S.; Minagar, A. Evidence of platelet activation in multiple sclerosis. J. Neuroinflammation 2008, 5, 27. [Google Scholar] [CrossRef] [PubMed]
- Mobarrez, F.; Vikerfors, A.; Gustafsson, J.T.; Gunnarsson, I.; Zickert, A.; Larsson, A.; Pisetsky, D.S.; Wallén, H.; Svenungsson, E. Microparticles in the blood of patients with systemic lupus erythematosus (SLE): Phenotypic characterization and clinical associations. Sci. Rep. 2016, 6, 36025. [Google Scholar] [CrossRef]
- Duarte, D.; Taveira-Gomes, T.; Sokhatska, O.; Palmares, C.; Costa, R.; Negrão, R.; Guimarães, J.T.; Delgado, L.; Soares, R.; Moreira, A. Increased circulating platelet microparticles as a potential biomarker in asthma. Allergy 2013, 68, 1073–1075. [Google Scholar] [CrossRef]
- Willms, E.; Cabañas, C.; Mäger, I.; Wood, M.J.A.; Vader, P. Extracellular Vesicle Heterogeneity: Subpopulations, Isolation Techniques, and Diverse Functions in Cancer Progression. Front. Immunol. 2018, 9, 738. [Google Scholar] [CrossRef] [PubMed]
- Dolegowska, B.; Lubkowska, A.; De Girolamo, L. Platelet lipidomic. J. Biol. Regul. Homeost. Agents 2012, 26, 23S–33S. [Google Scholar] [PubMed]
- Albeituni, S.; Stiban, J. Roles of Ceramides and Other Sphingolipids in Immune Cell Function and Inflammation. Adv. Exp. Med. Biol. 2019, 1161, 169–191. [Google Scholar] [CrossRef] [PubMed]
- Taha, T.A.; Kitatani, K.; El-Alwani, M.; Bielawski, J.; Hannun, Y.A.; Obeid, L.M. Loss of sphingosine kinase-1 activates the intrinsic pathway of programmed cell death: Modulation of sphingolipid levels and the induction of apoptosis. FASEB J. 2006, 20, 482–484. [Google Scholar] [CrossRef]
- Hannun, Y.A.; Obeid, L.M. The Ceramide-centric universe of lipid-mediated cell regulation: Stress encounters of the lipid kind. J. Biol. Chem. 2002, 277, 25847–25850. [Google Scholar] [CrossRef]
- Aflaki, E.; Radovic, B.; Chandak, P.G.; Kolb, D.; Eisenberg, T.; Ring, J.; Fertschai, I.; Uellen, A.; Wolinski, H.; Kohlwein, S.; et al. Triacylglycerol accumulation activates the mitochondrial apoptosis pathway in macrophages. J. Biol. Chem. 2011, 286, 7418–7428. [Google Scholar] [CrossRef]
- Li, N.; Lizardo, D.Y.; Atilla-Gokcumen, G.E. Specific Triacylglycerols Accumulate via Increased Lipogenesis During 5-FU-Induced Apoptosis. ACS Chem. Biol. 2016, 11, 2583–2587. [Google Scholar] [CrossRef]
- Howie, D.; Ten Bokum, A.; Cobbold, S.P.; Yu, Z.; Kessler, B.M.; Waldmann, H. A Novel Role for Triglyceride Metabolism in Foxp3 Expression. Front. Immunol. 2019, 10, 1860. [Google Scholar] [CrossRef]
- Matias, M.I.; Yong, C.S.; Foroushani, A.; Goldsmith, C.; Mongellaz, C.; Sezgin, E.; Levental, K.R.; Talebi, A.; Perrault, J.; Rivière, A.; et al. Regulatory T cell differentiation is controlled by αKG-induced alterations in mitochondrial metabolism and lipid homeostasis. Cell Rep. 2021, 37, 109911. [Google Scholar] [CrossRef]
- Yan, Y.; Huang, L.; Liu, Y.; Yi, M.; Chu, Q.; Jiao, D.; Wu, K. Metabolic profiles of regulatory T cells and their adaptations to the tumor microenvironment: Implications for antitumor immunity. J. Hematol. Oncol. 2022, 15, 104. [Google Scholar] [CrossRef]
- Delgado-Dolset, M.I.; Obeso, D.; Rodríguez-Coira, J.; Tarin, C.; Tan, G.; Cumplido, J.A.; Cabrera, A.; Angulo, S.; Barbas, C.; Sokolowska, M.; et al. Understanding uncontrolled severe allergic asthma by integration of omic and clinical data. Allergy 2022, 77, 1772–1785. [Google Scholar] [CrossRef] [PubMed]
- Mauer, Y.; Taliercio, R.M. Managing adult asthma: The 2019 GINA guidelines. Cleve Clin. J. Med. 2020, 87, 569–575. [Google Scholar] [CrossRef] [PubMed]
- Garcia, A.; Barbas, C. Gas Chromatography-Mass Spectrometry (GC-MS)-Based Metabolomics. In Metabolic Profiling: Methods and Protocols; Metz, T.O., Ed.; Humana Press: Totowa, NJ, USA, 2011; pp. 191–204. [Google Scholar]
- Gonzalez-Riano, C.; Gradillas, A.; Barbas, C. Exploiting the formation of adducts in mobile phases with ammonium fluoride for the enhancement of annotation in liquid chromatography-high resolution mass spectrometry based lipidomics. J. Chromatogr. Open 2021, 1, 100018. [Google Scholar] [CrossRef]
- Melero-Fernandez de Mera, R.M.; Villaseñor, A.; Rojo, D.; Carrión-Navarro, J.; Gradillas, A.; Ayuso-Sacido, A.; Barbas, C. Ceramide Composition in Exosomes for Characterization of Glioblastoma Stem-Like Cell Phenotypes. Front. Oncol. 2022, 11, 788100. [Google Scholar] [CrossRef]
- Armitage, E.G.; Godzien, J.; Alonso-Herranz, V.; López-Gonzálvez, Á.; Barbas, C. Missing value imputation strategies for metabolomics data. Electrophoresis 2015, 36, 3050–3060. [Google Scholar] [CrossRef] [PubMed]
- de la Fuente, A.G.; Godzien, J.; Fernández López, M.; Rupérez, F.J.; Barbas, C.; Otero, A. Knowledge-based metabolite annotation tool: CEU Mass Mediator. J. Pharm. Biomed. Anal. 2018, 154, 138–149. [Google Scholar] [CrossRef]
- Gil-de-la-Fuente, A.; Godzien, J.; Saugar, S.; Garcia-Carmona, R.; Badran, H.; Wishart, D.S.; Barbas, C.; Otero, A. CEU Mass Mediator 3.0: A Metabolite Annotation Tool. J. Proteome Res. 2019, 18, 797–802. [Google Scholar] [CrossRef]
- Benjamini, Y.; Krieger, A.M.; Yekutieli, D. Adaptive linear step-up procedures that control the false discovery rate. Biometrika 2006, 93, 491–507. [Google Scholar] [CrossRef]
- Vinaixa, M.; Samino, S.; Saez, I.; Duran, J.; Guinovart, J.J.; Yanes, O. A Guideline to Univariate Statistical Analysis for LC/MS-Based Untargeted Metabolomics-Derived Data. Metabolites 2012, 2, 775–795. [Google Scholar] [CrossRef]
- Pang, Z.; Chong, J.; Zhou, G.; de Lima Morais, D.A.; Chang, L.; Barrette, M.; Gauthier, C.; Jacques, P.; Li, S.; Xia, J. MetaboAnalyst 5.0: Narrowing the gap between raw spectra and functional insights. Nucleic Acids Res. 2021, 49, W388–W396. [Google Scholar] [CrossRef]


Disclaimer/Publisher’s Note: The statements, opinions and data contained in all publications are solely those of the individual author(s) and contributor(s) and not of MDPI and/or the editor(s). MDPI and/or the editor(s) disclaim responsibility for any injury to people or property resulting from any ideas, methods, instructions or products referred to in the content. |
© 2023 by the authors. Licensee MDPI, Basel, Switzerland. This article is an open access article distributed under the terms and conditions of the Creative Commons Attribution (CC BY) license (https://creativecommons.org/licenses/by/4.0/).
Share and Cite
Couto-Rodriguez, A.; Villaseñor, A.; Pablo-Torres, C.; Obeso, D.; Rey-Stolle, M.F.; Peinado, H.; Bueno, J.L.; Reaño-Martos, M.; Iglesias Cadarso, A.; Gomez-Casado, C.; et al. Platelet-Derived Extracellular Vesicles as Lipid Carriers in Severe Allergic Inflammation. Int. J. Mol. Sci. 2023, 24, 12714. https://doi.org/10.3390/ijms241612714
Couto-Rodriguez A, Villaseñor A, Pablo-Torres C, Obeso D, Rey-Stolle MF, Peinado H, Bueno JL, Reaño-Martos M, Iglesias Cadarso A, Gomez-Casado C, et al. Platelet-Derived Extracellular Vesicles as Lipid Carriers in Severe Allergic Inflammation. International Journal of Molecular Sciences. 2023; 24(16):12714. https://doi.org/10.3390/ijms241612714
Chicago/Turabian StyleCouto-Rodriguez, Alba, Alma Villaseñor, Carmela Pablo-Torres, David Obeso, María Fernanda Rey-Stolle, Héctor Peinado, José Luis Bueno, Mar Reaño-Martos, Alfredo Iglesias Cadarso, Cristina Gomez-Casado, and et al. 2023. "Platelet-Derived Extracellular Vesicles as Lipid Carriers in Severe Allergic Inflammation" International Journal of Molecular Sciences 24, no. 16: 12714. https://doi.org/10.3390/ijms241612714
APA StyleCouto-Rodriguez, A., Villaseñor, A., Pablo-Torres, C., Obeso, D., Rey-Stolle, M. F., Peinado, H., Bueno, J. L., Reaño-Martos, M., Iglesias Cadarso, A., Gomez-Casado, C., Barbas, C., Barber, D., Escribese, M. M., & Izquierdo, E. (2023). Platelet-Derived Extracellular Vesicles as Lipid Carriers in Severe Allergic Inflammation. International Journal of Molecular Sciences, 24(16), 12714. https://doi.org/10.3390/ijms241612714