
A Prognostic Model of Head and Neck Cancer Based on Amino Acid Metabolism-Related Signature and Its Implication for Immunosuppressive Microenvironment


Abstract
1. Introduction
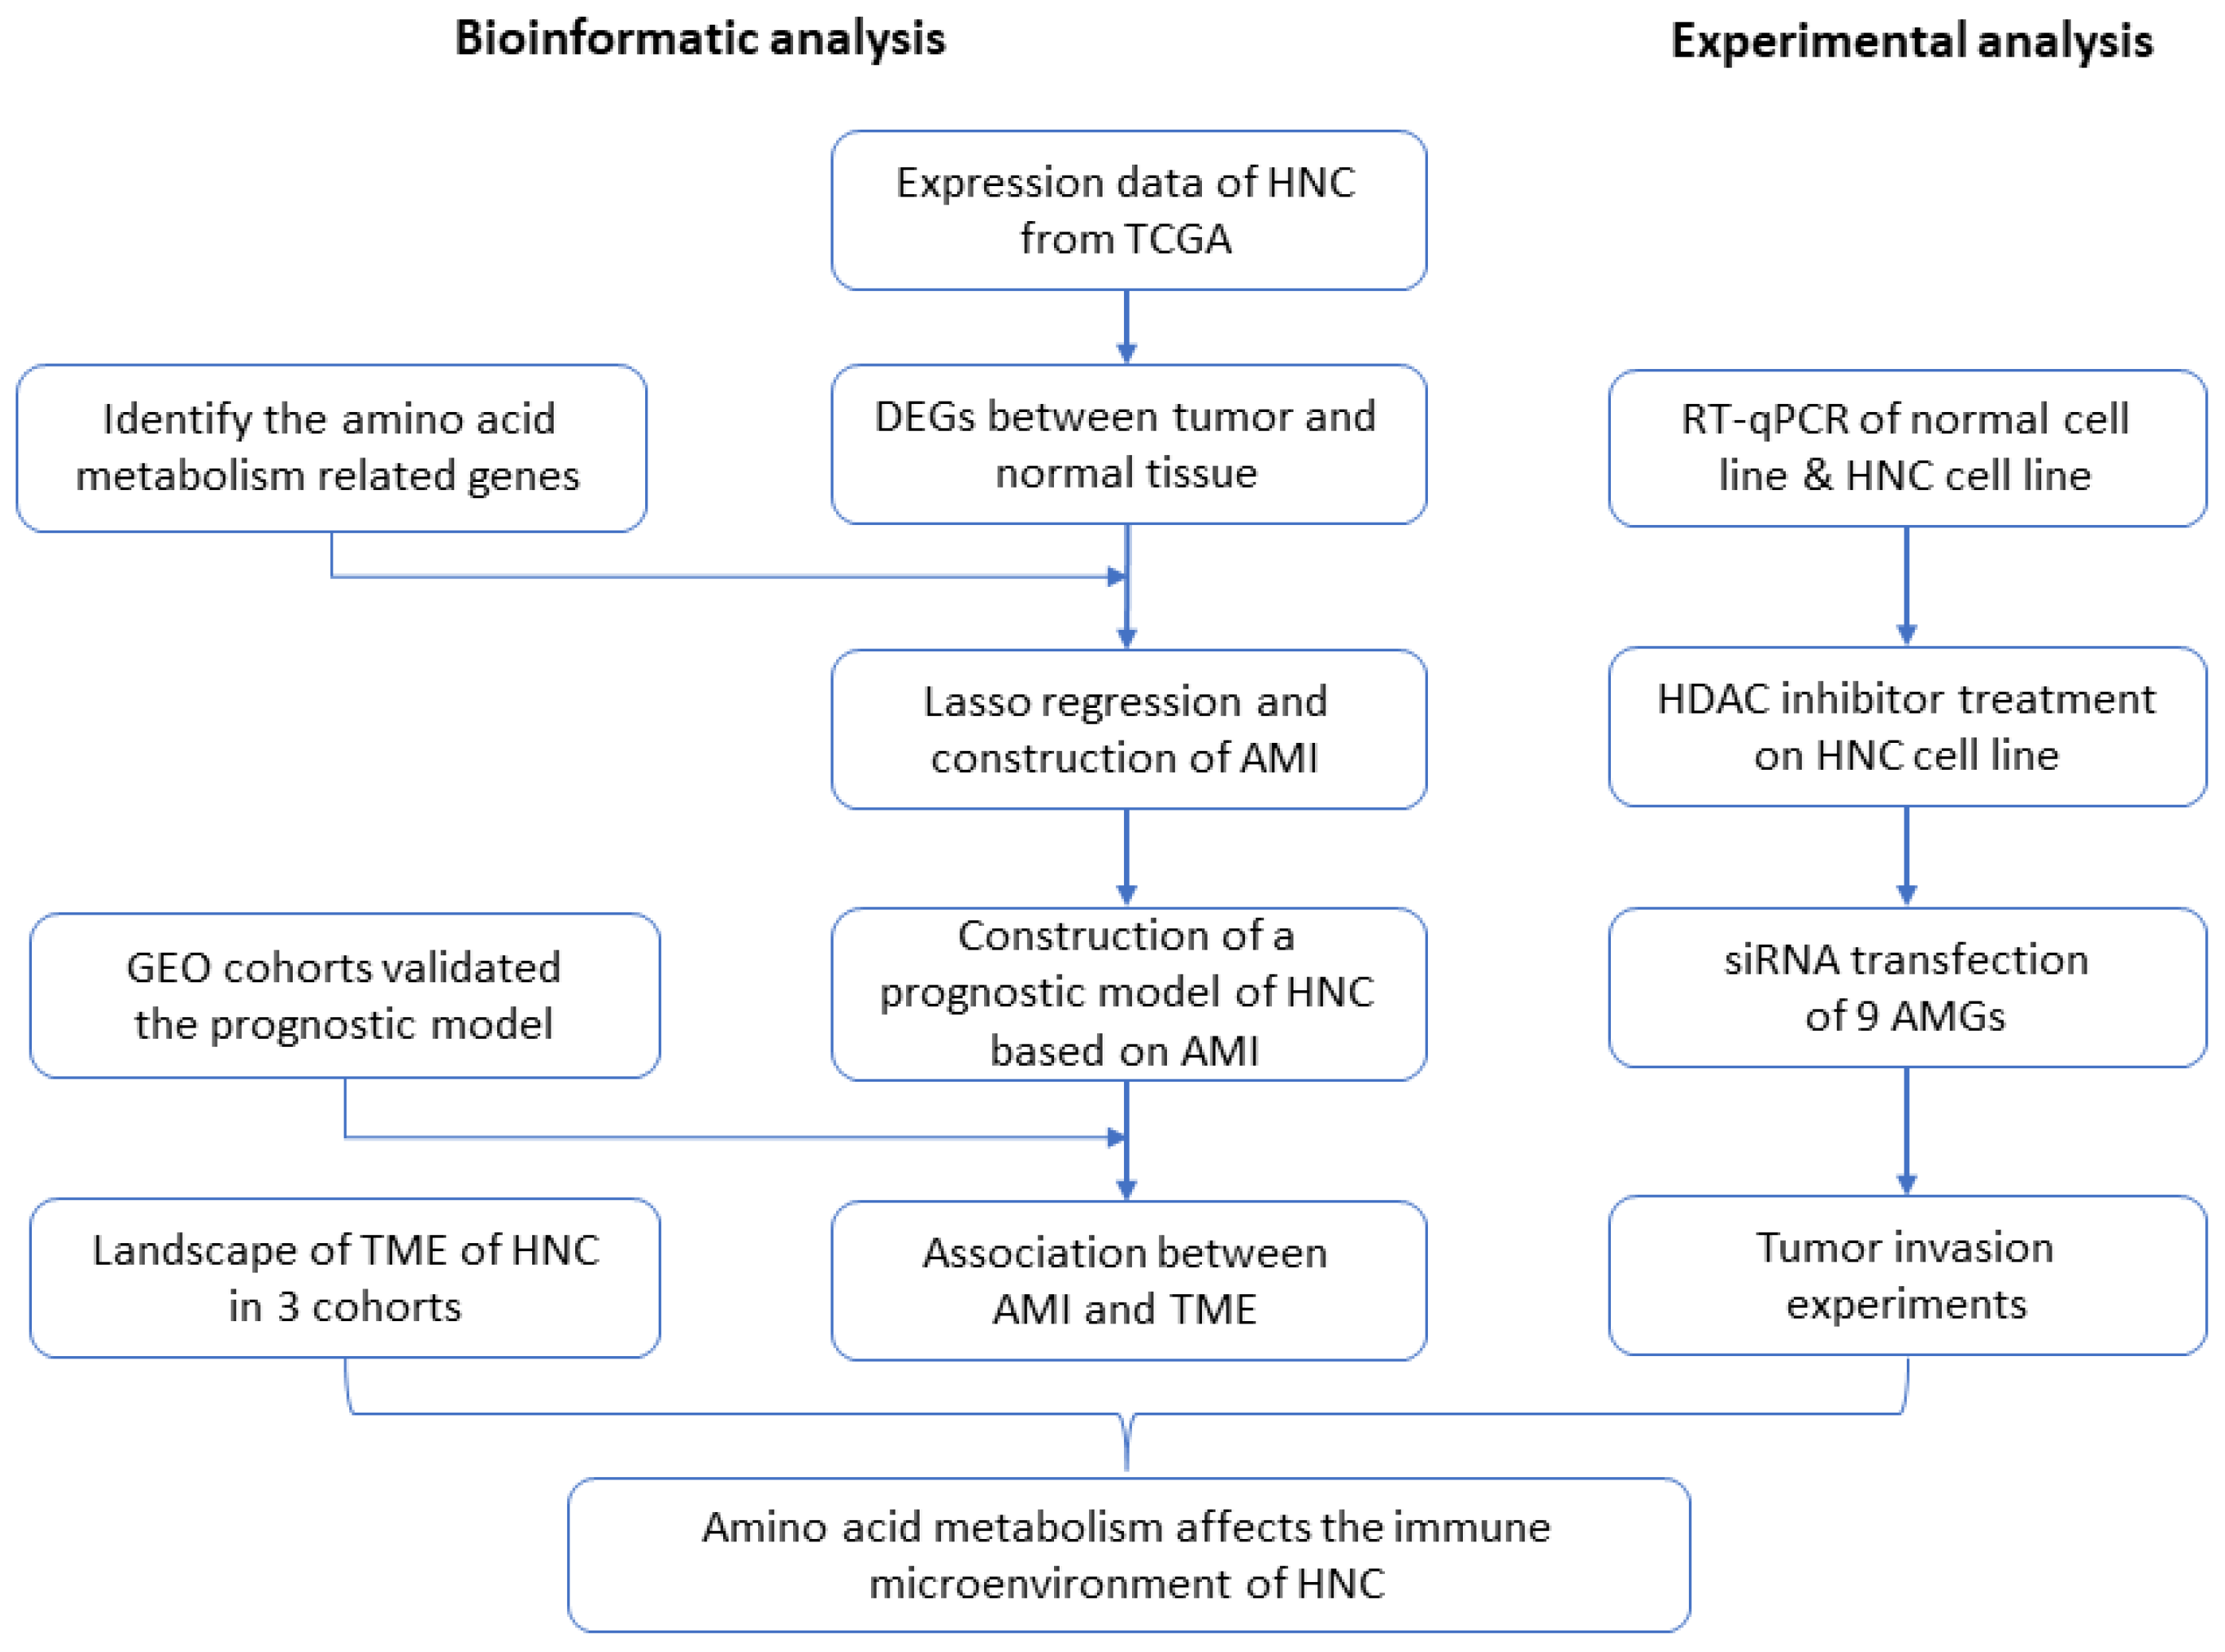
2. Results
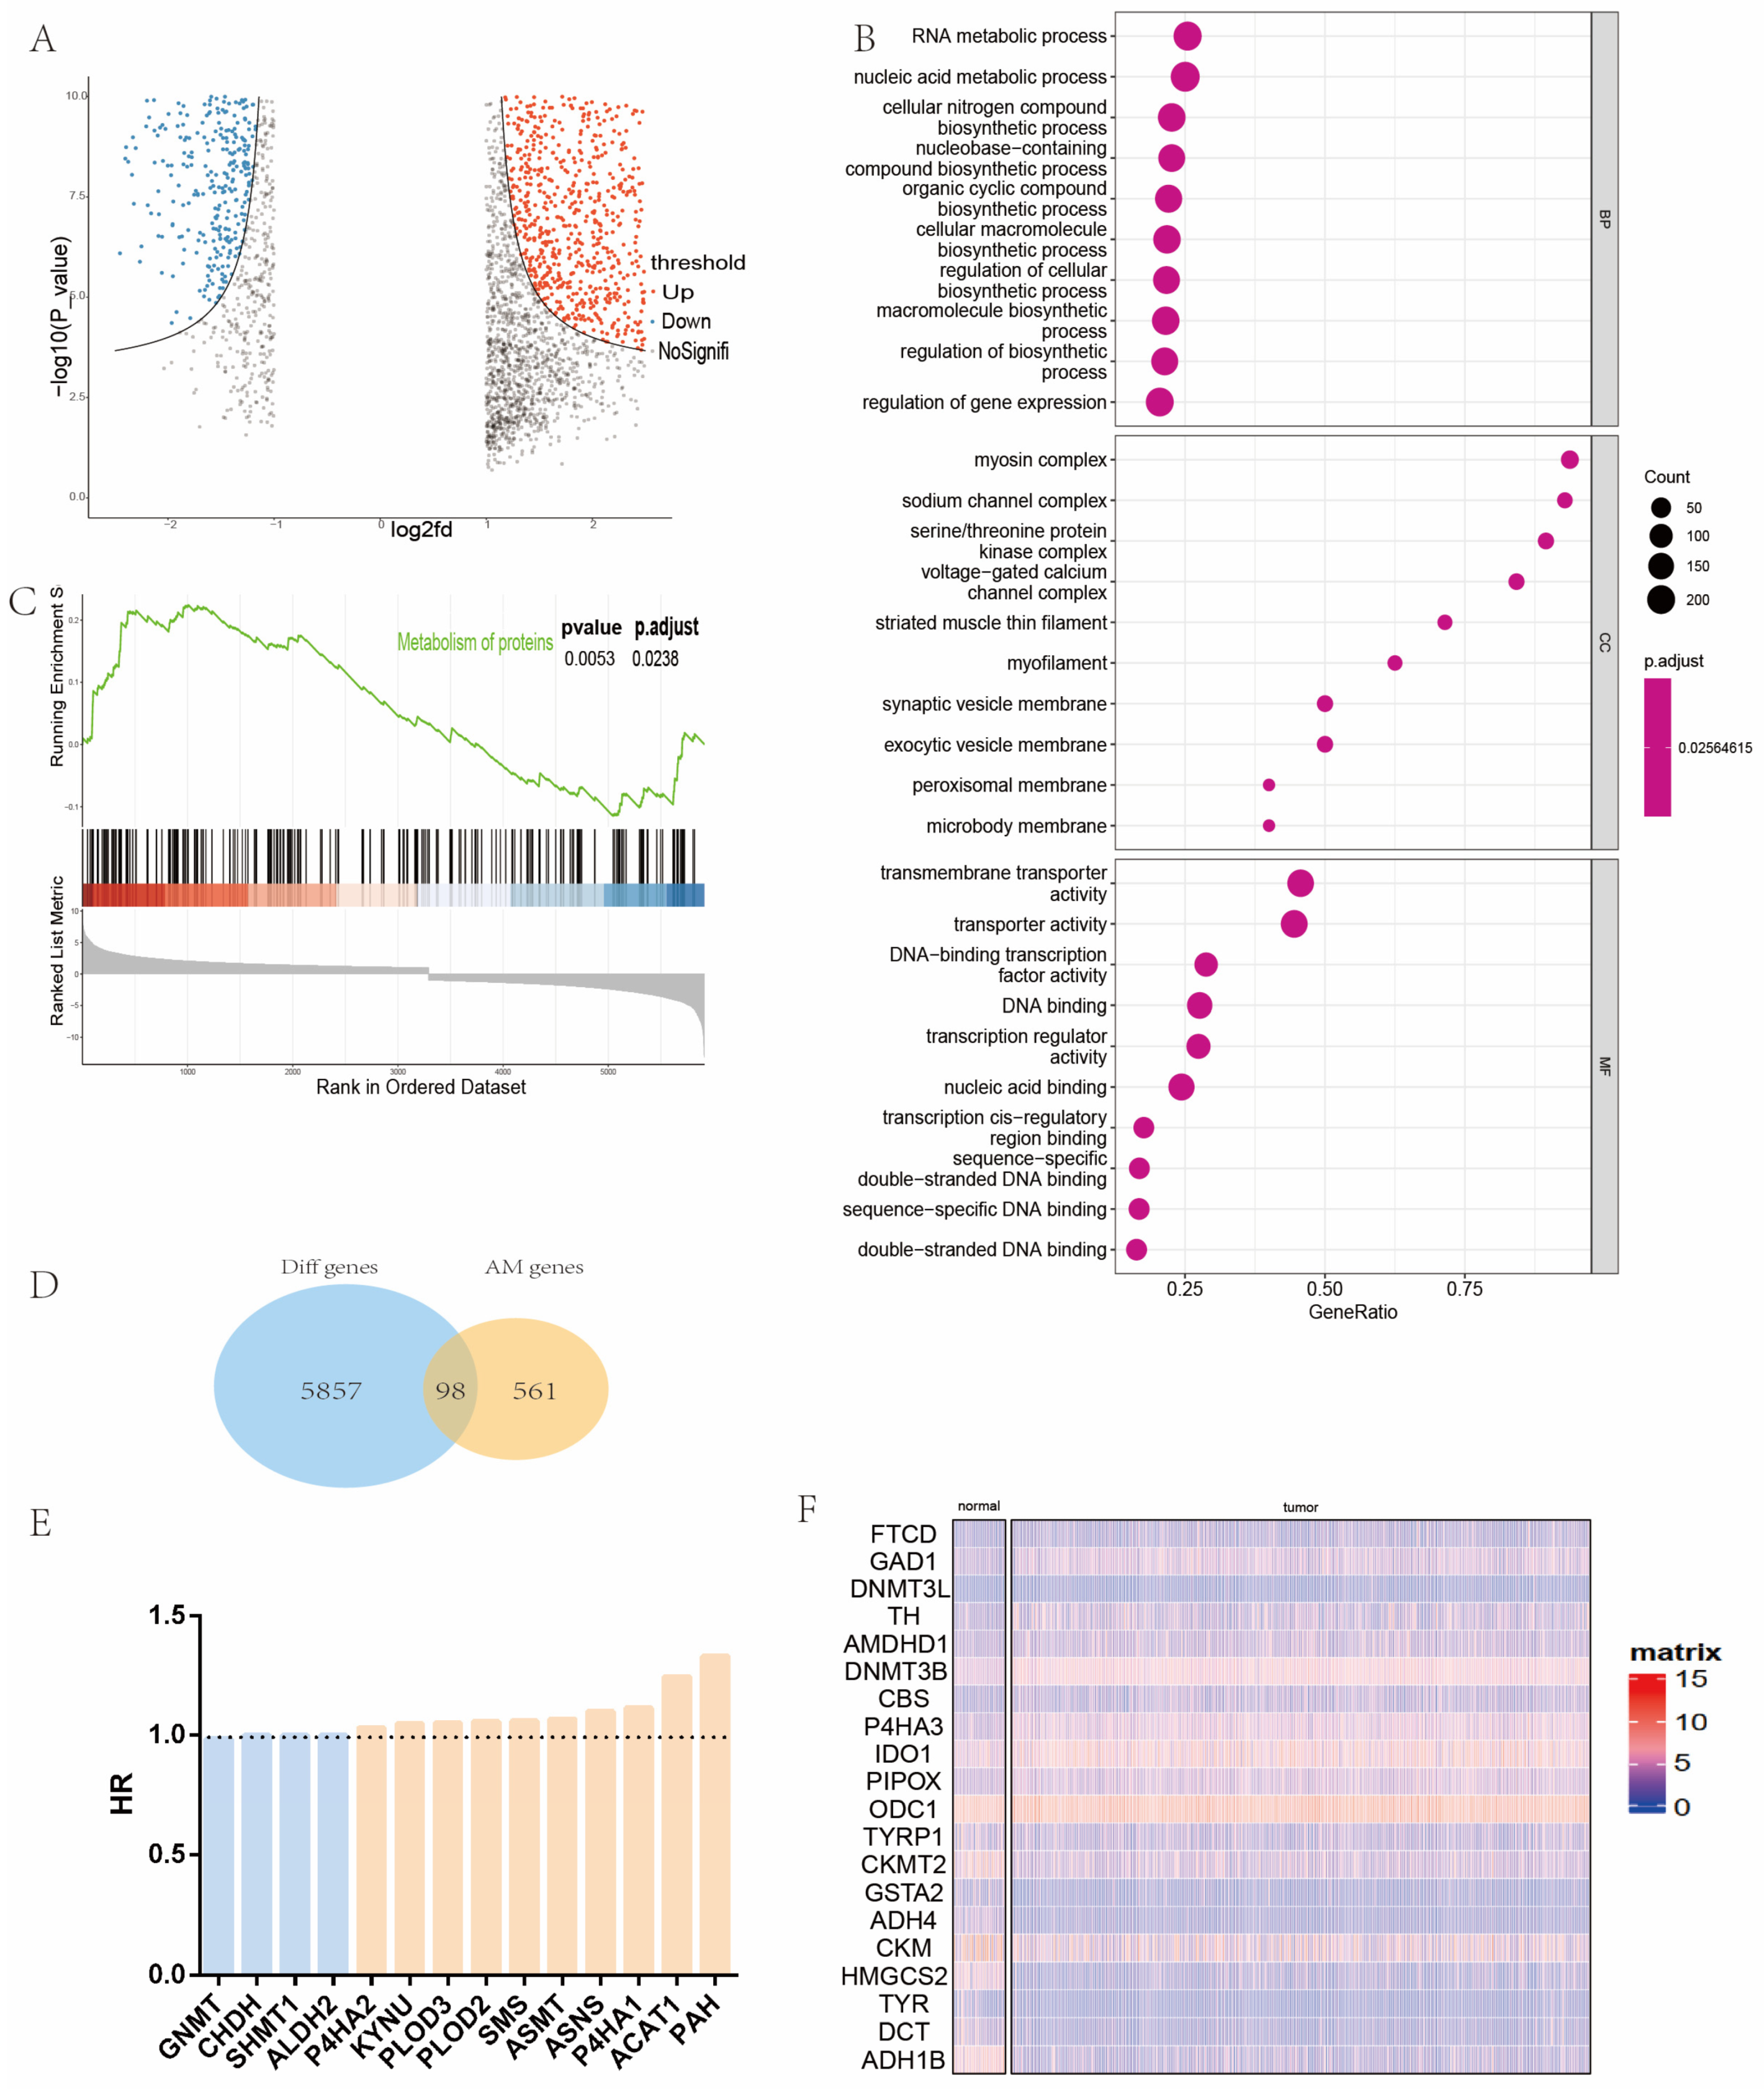
2.1. Identification and Analysis of Differential Amino Acid Metabolism-Related Genes in Patients with Head and Neck Cancer
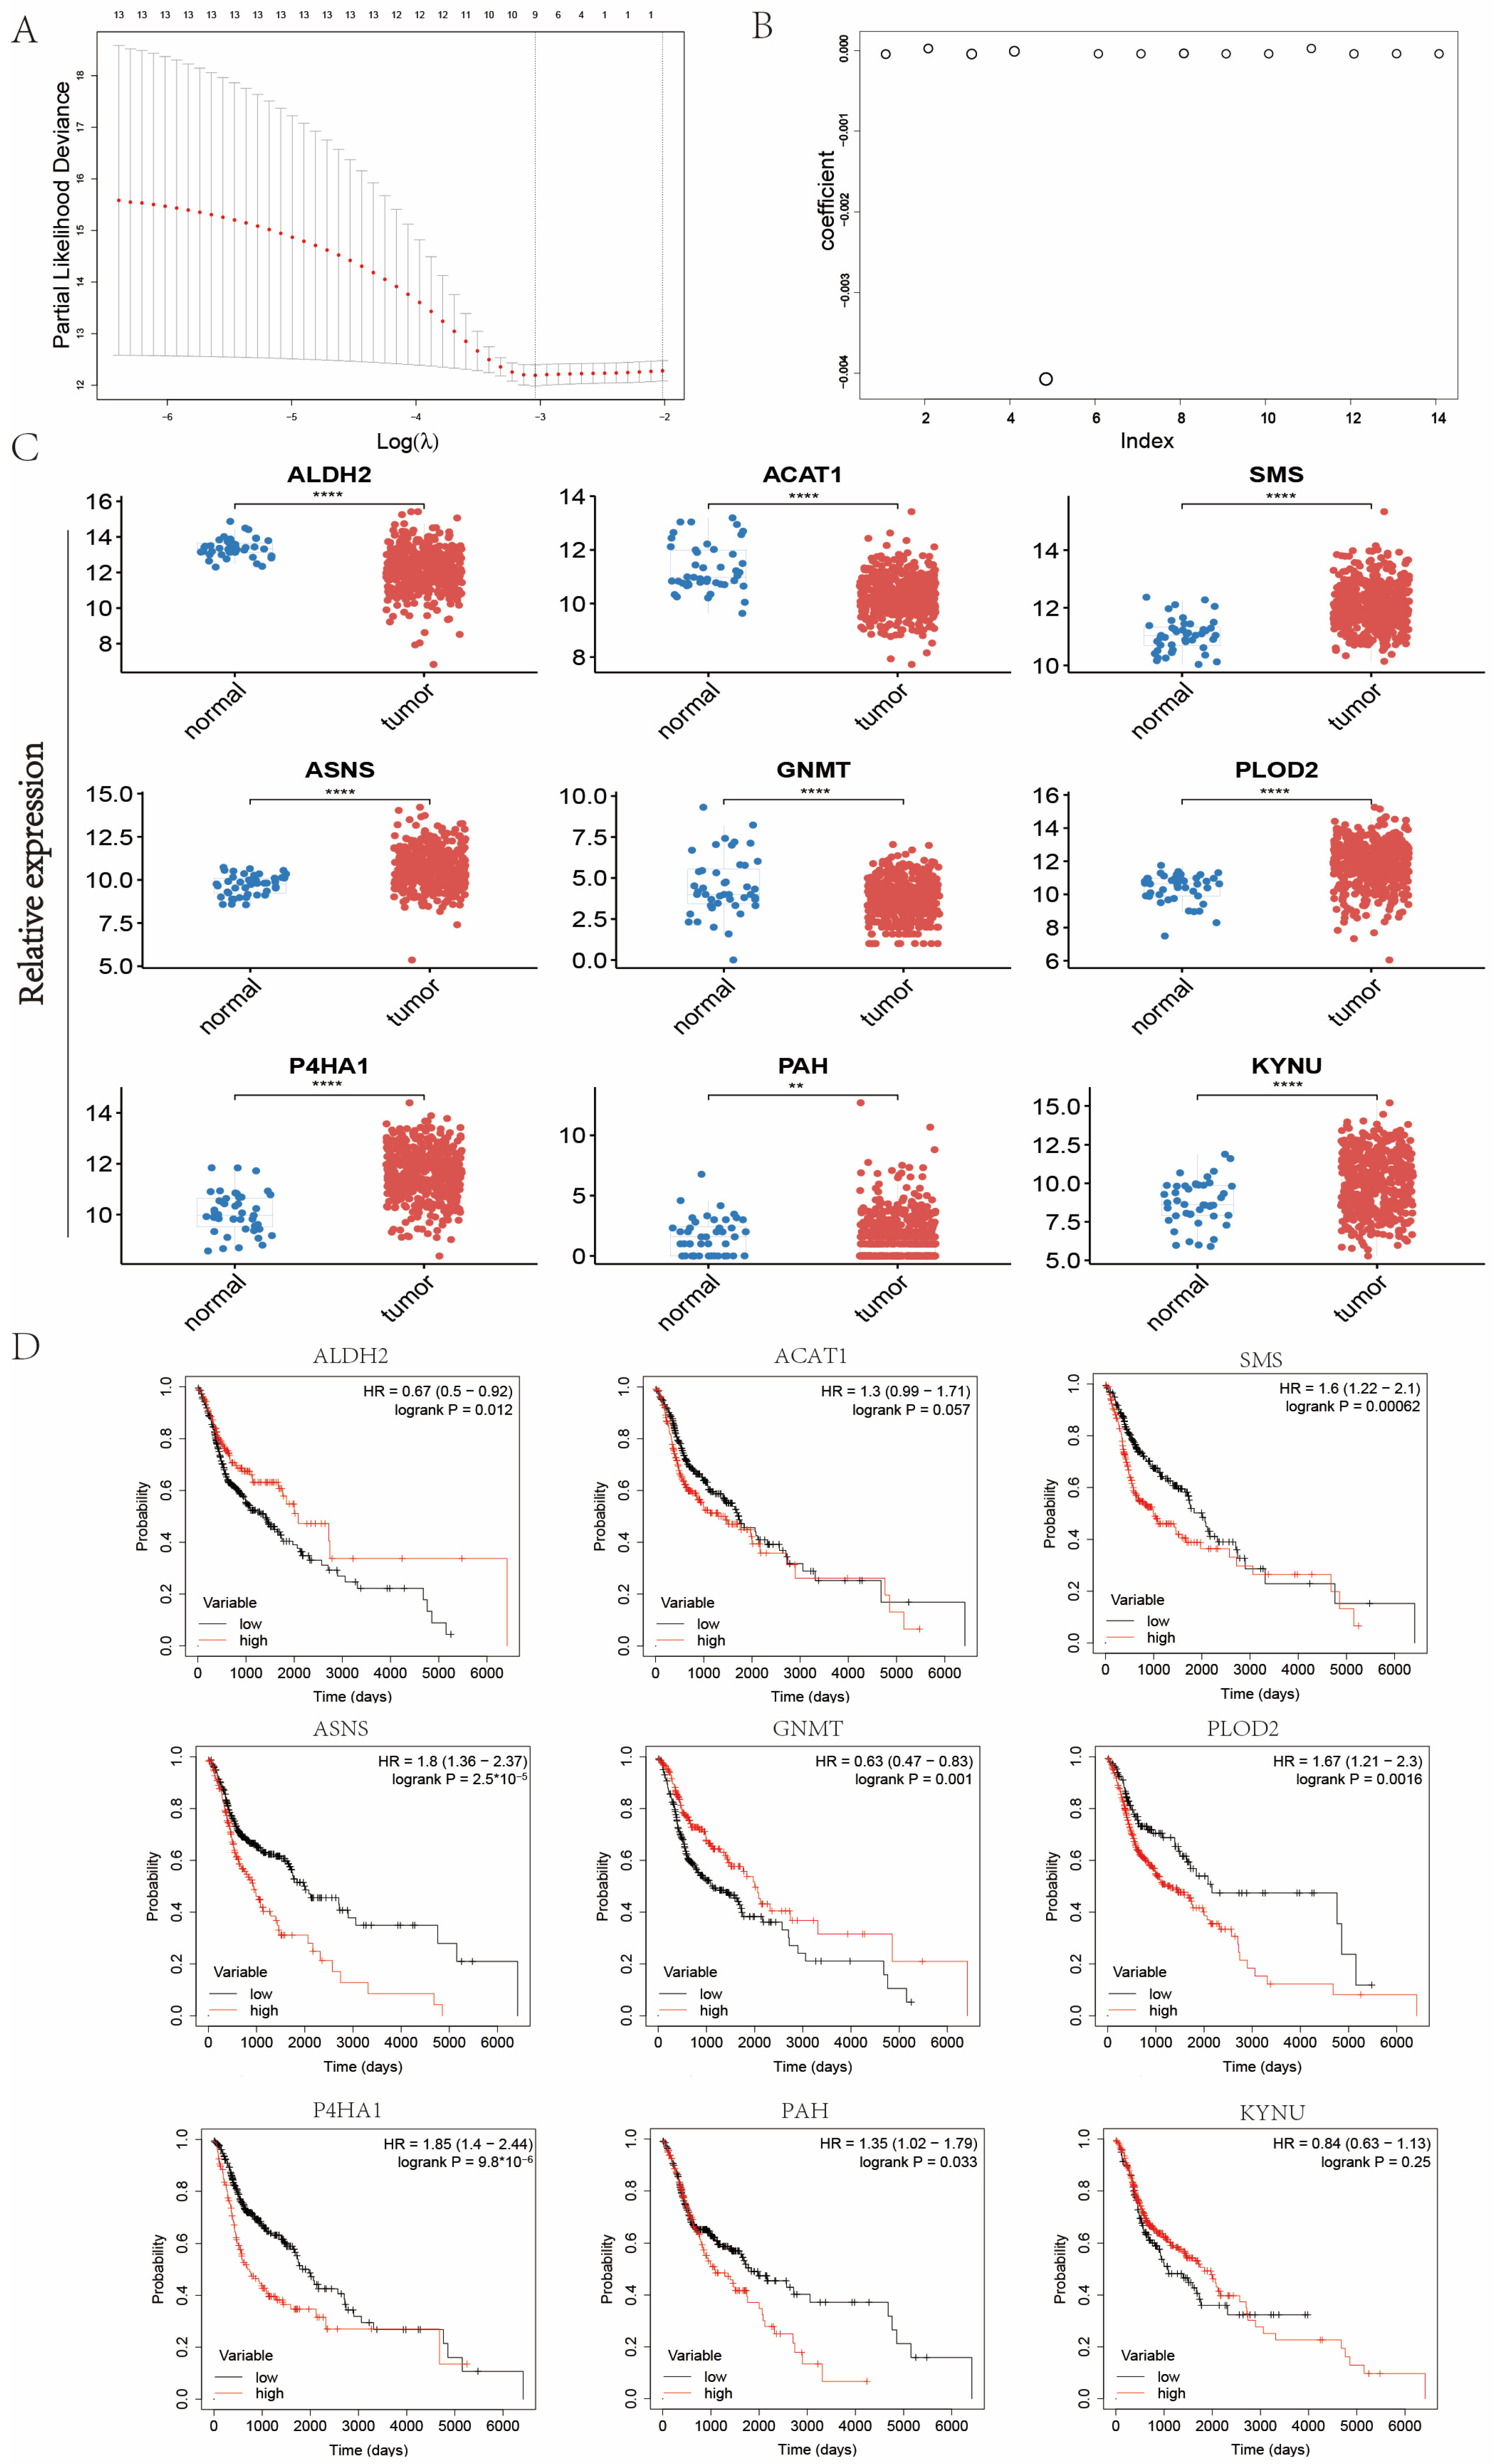
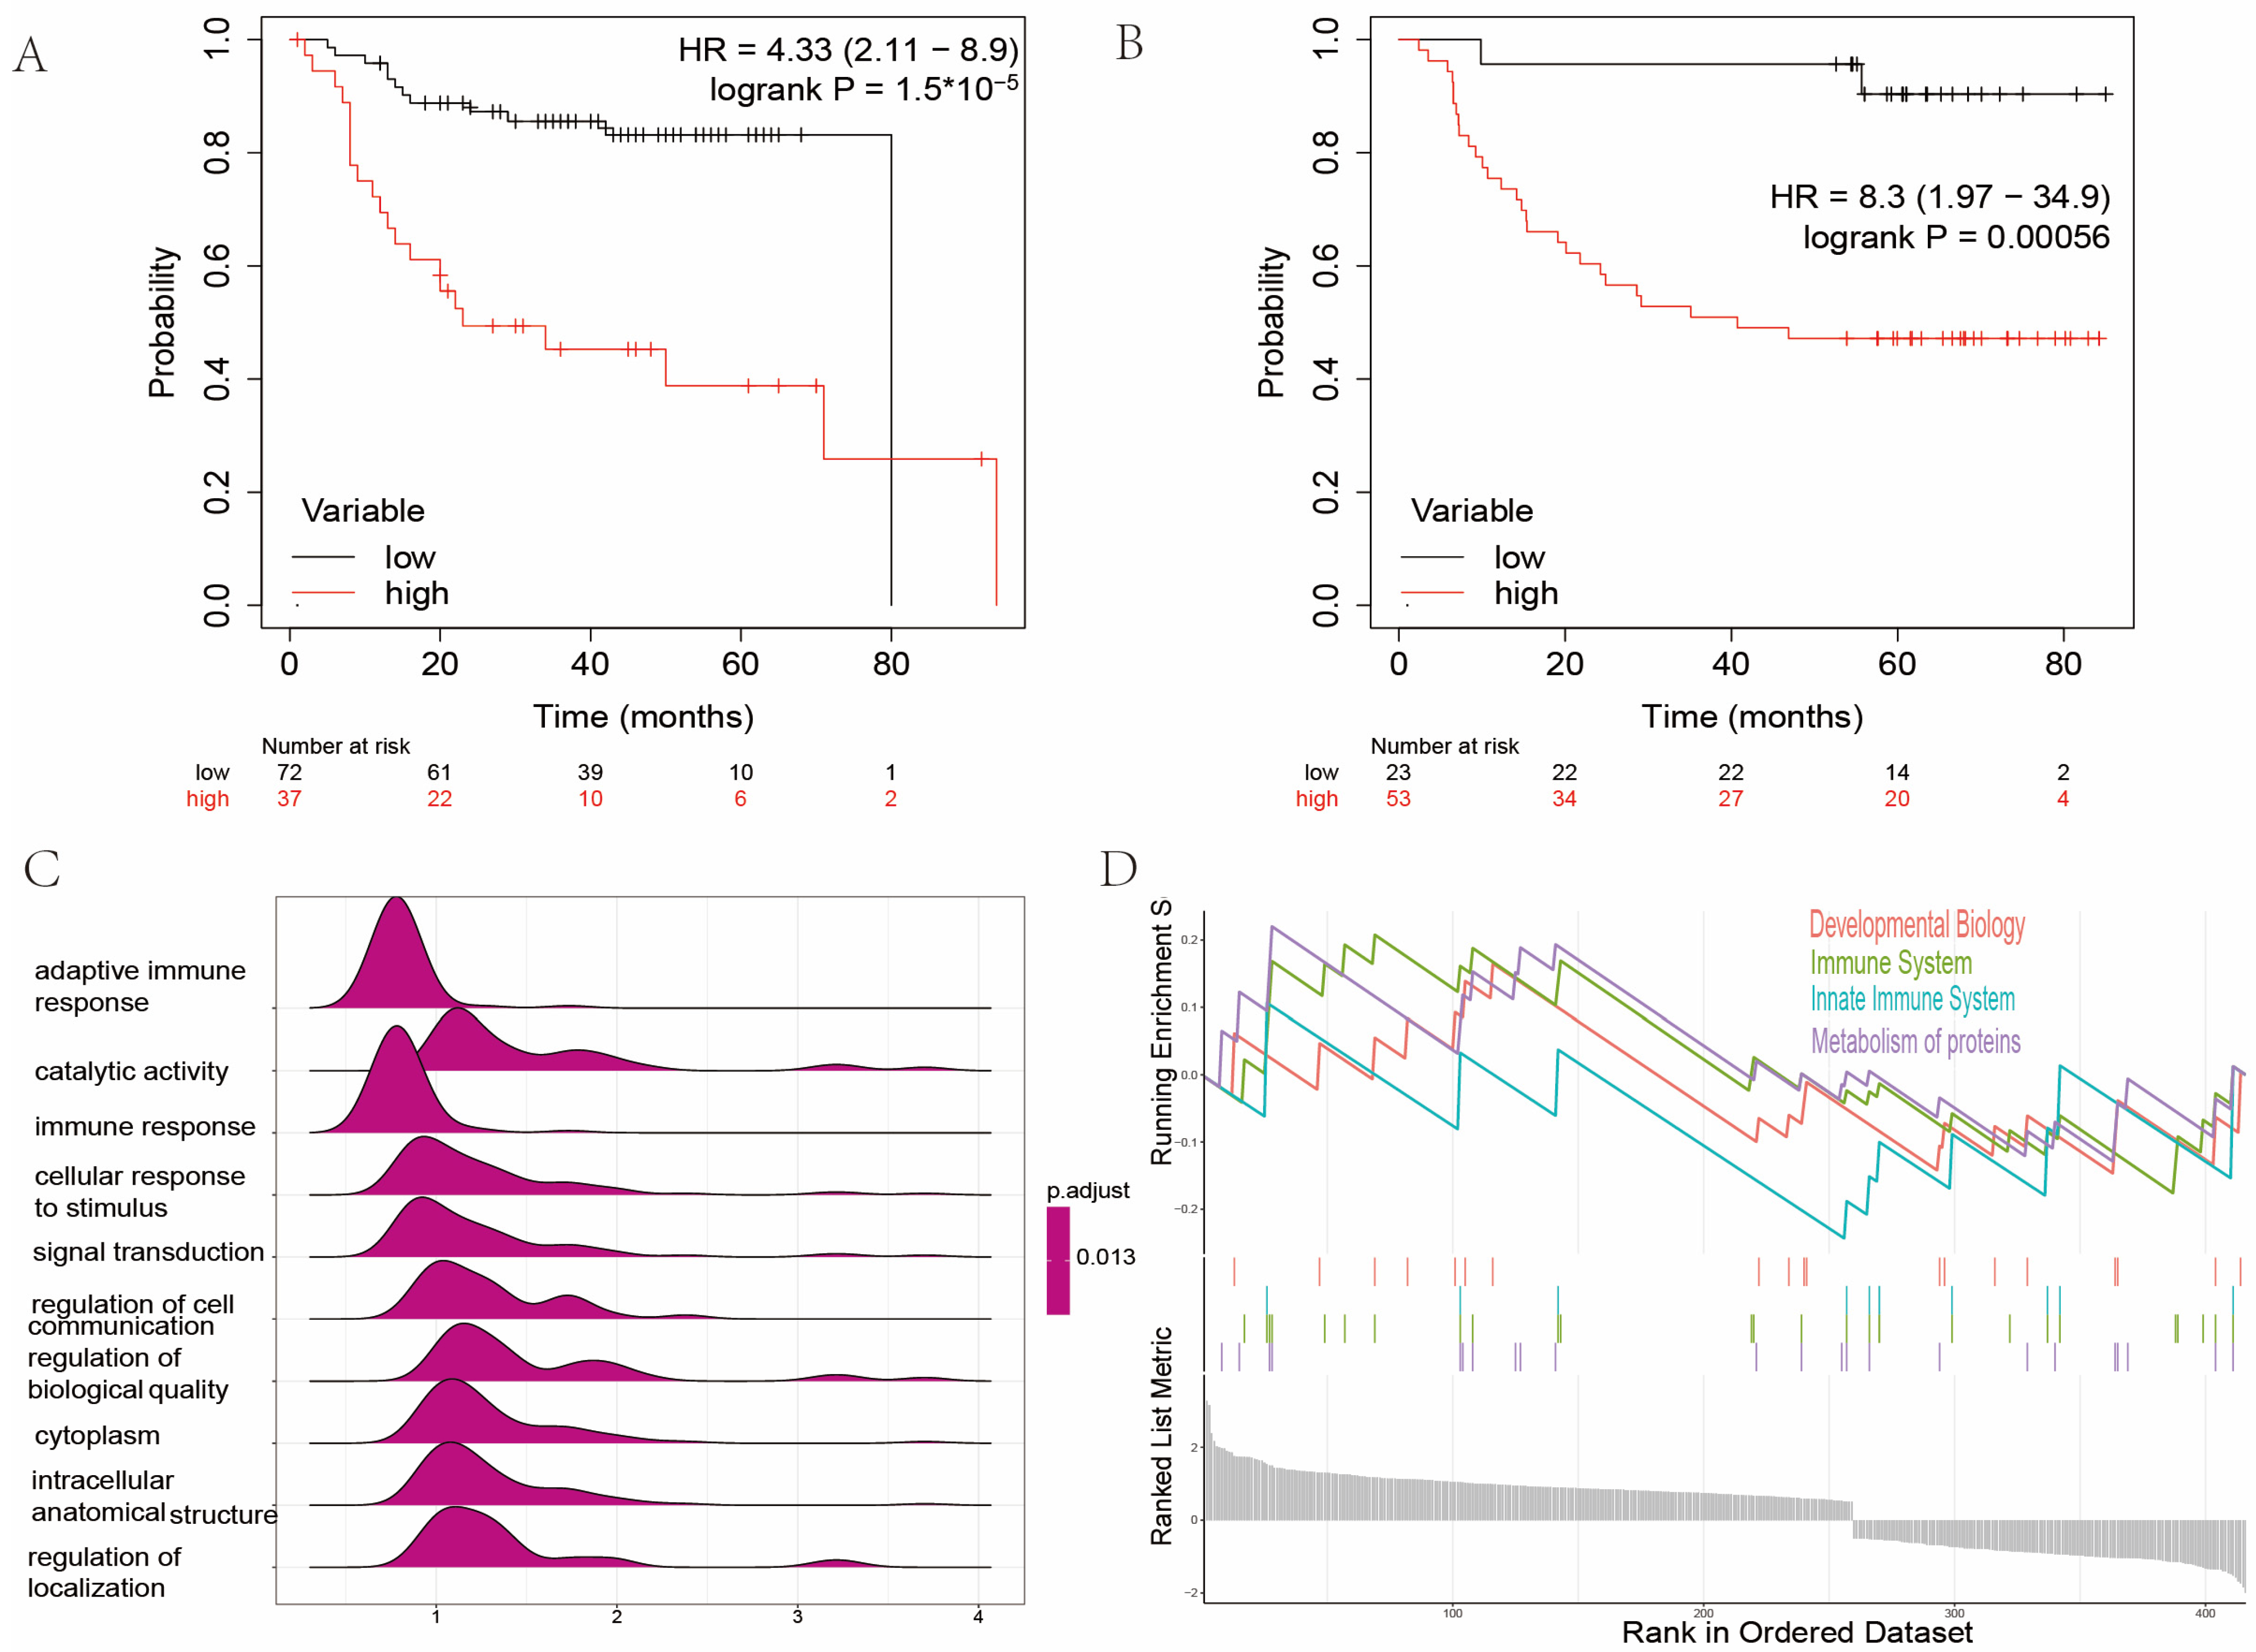
2.2. Establishment of Signature Related to Amino Acid Metabolism in Patients with Head and Neck Cancer
2.3. Gene Set Enrichment Analysis between High and Low Amino Acid Metabolism Index Groups
2.4. Landscape of Immune Status and Tumor Immune Microenvironment in Head and Neck Cancer
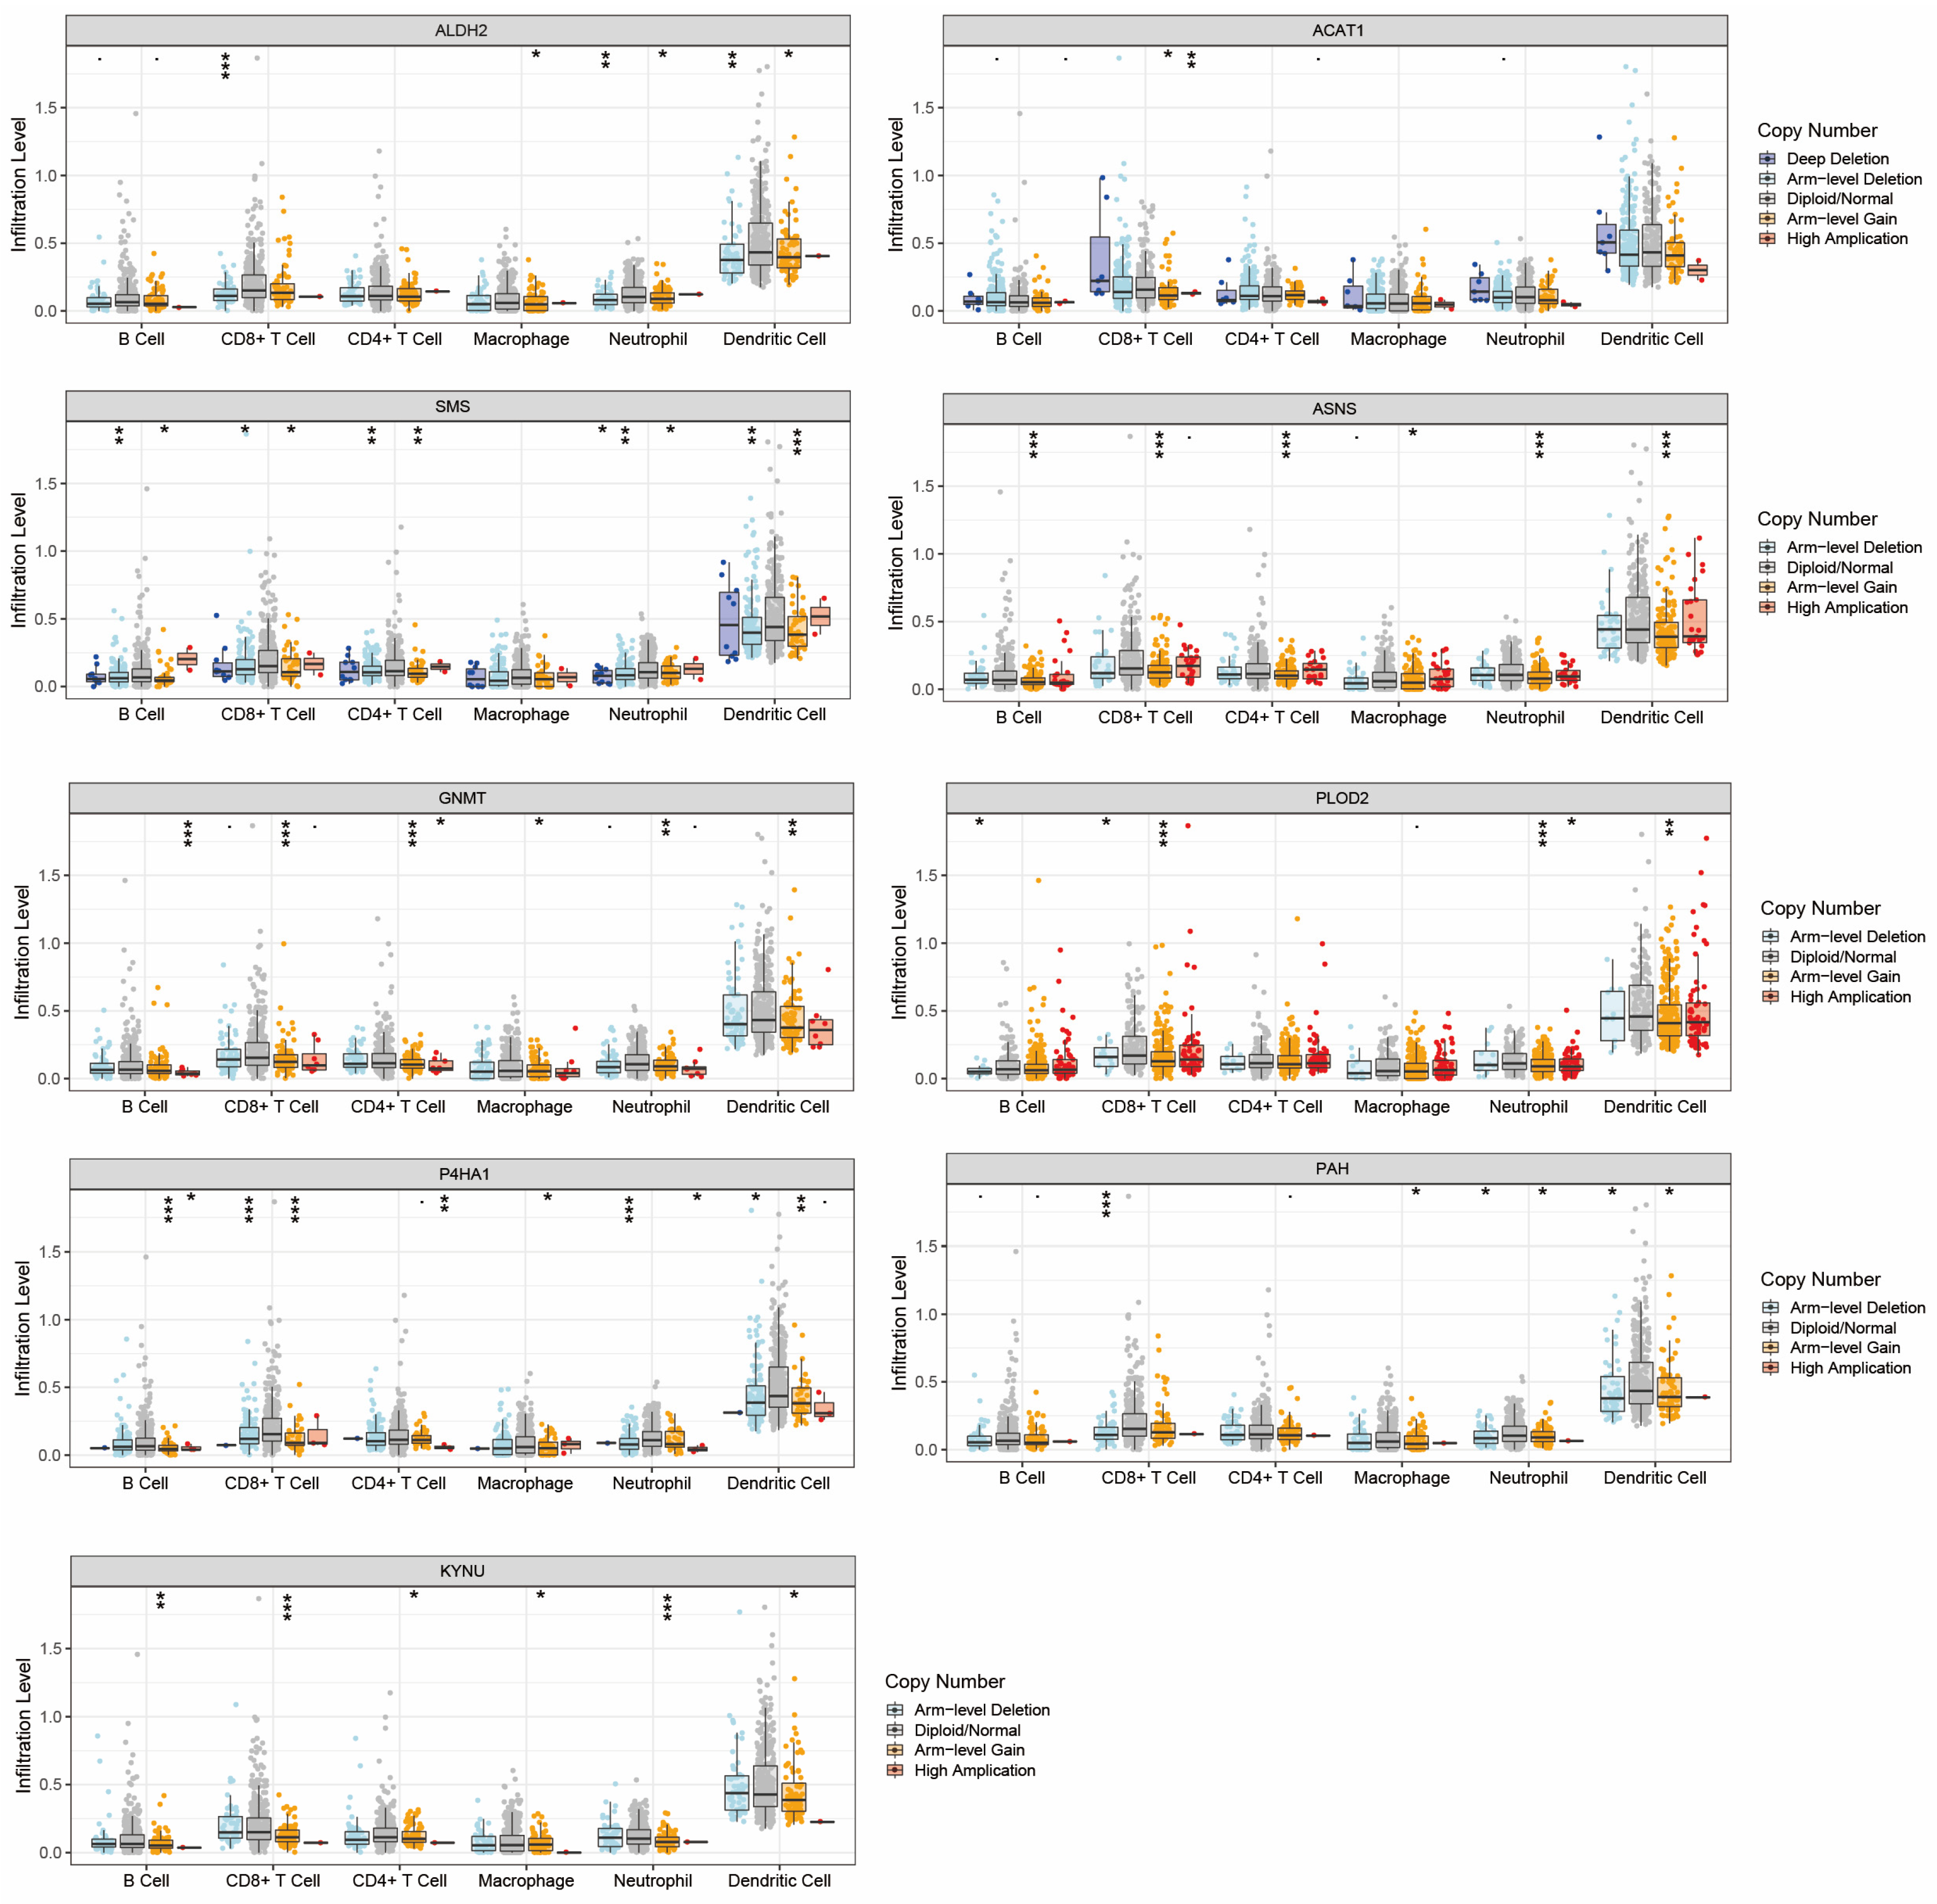
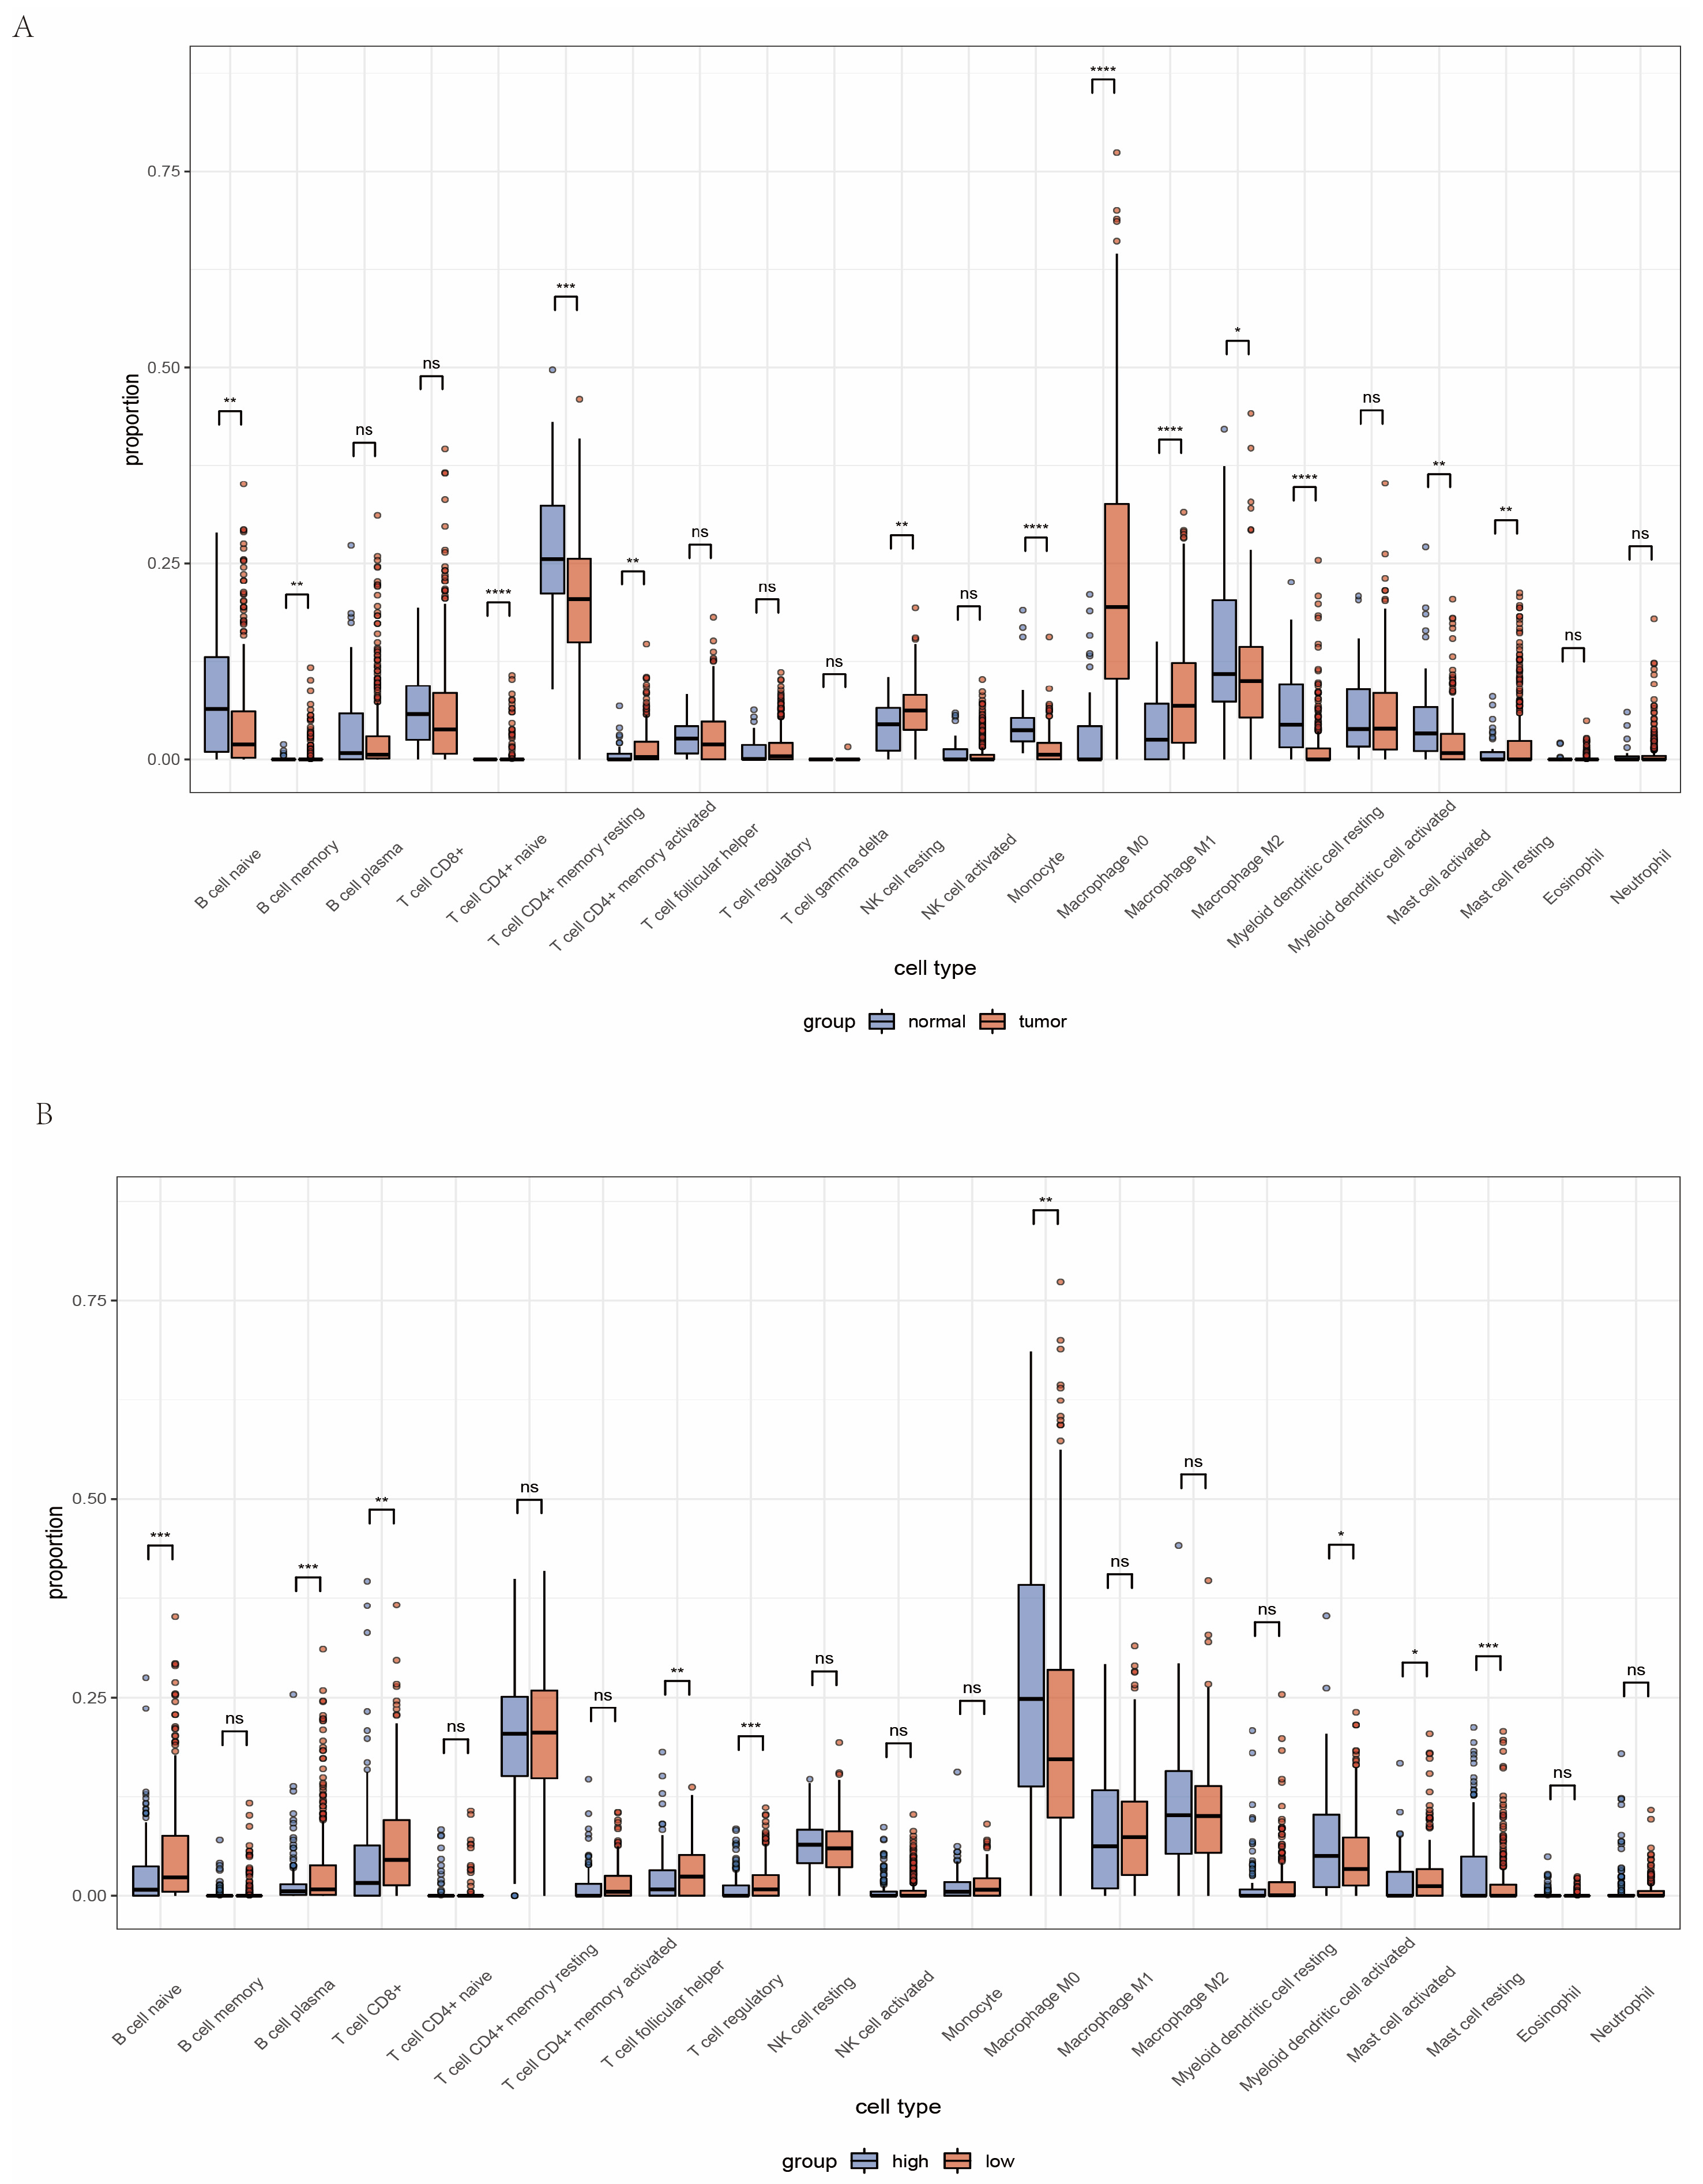
2.5. Analysis of Immune Microenvironment between High and Low Amino Acid Metabolism Index Groups
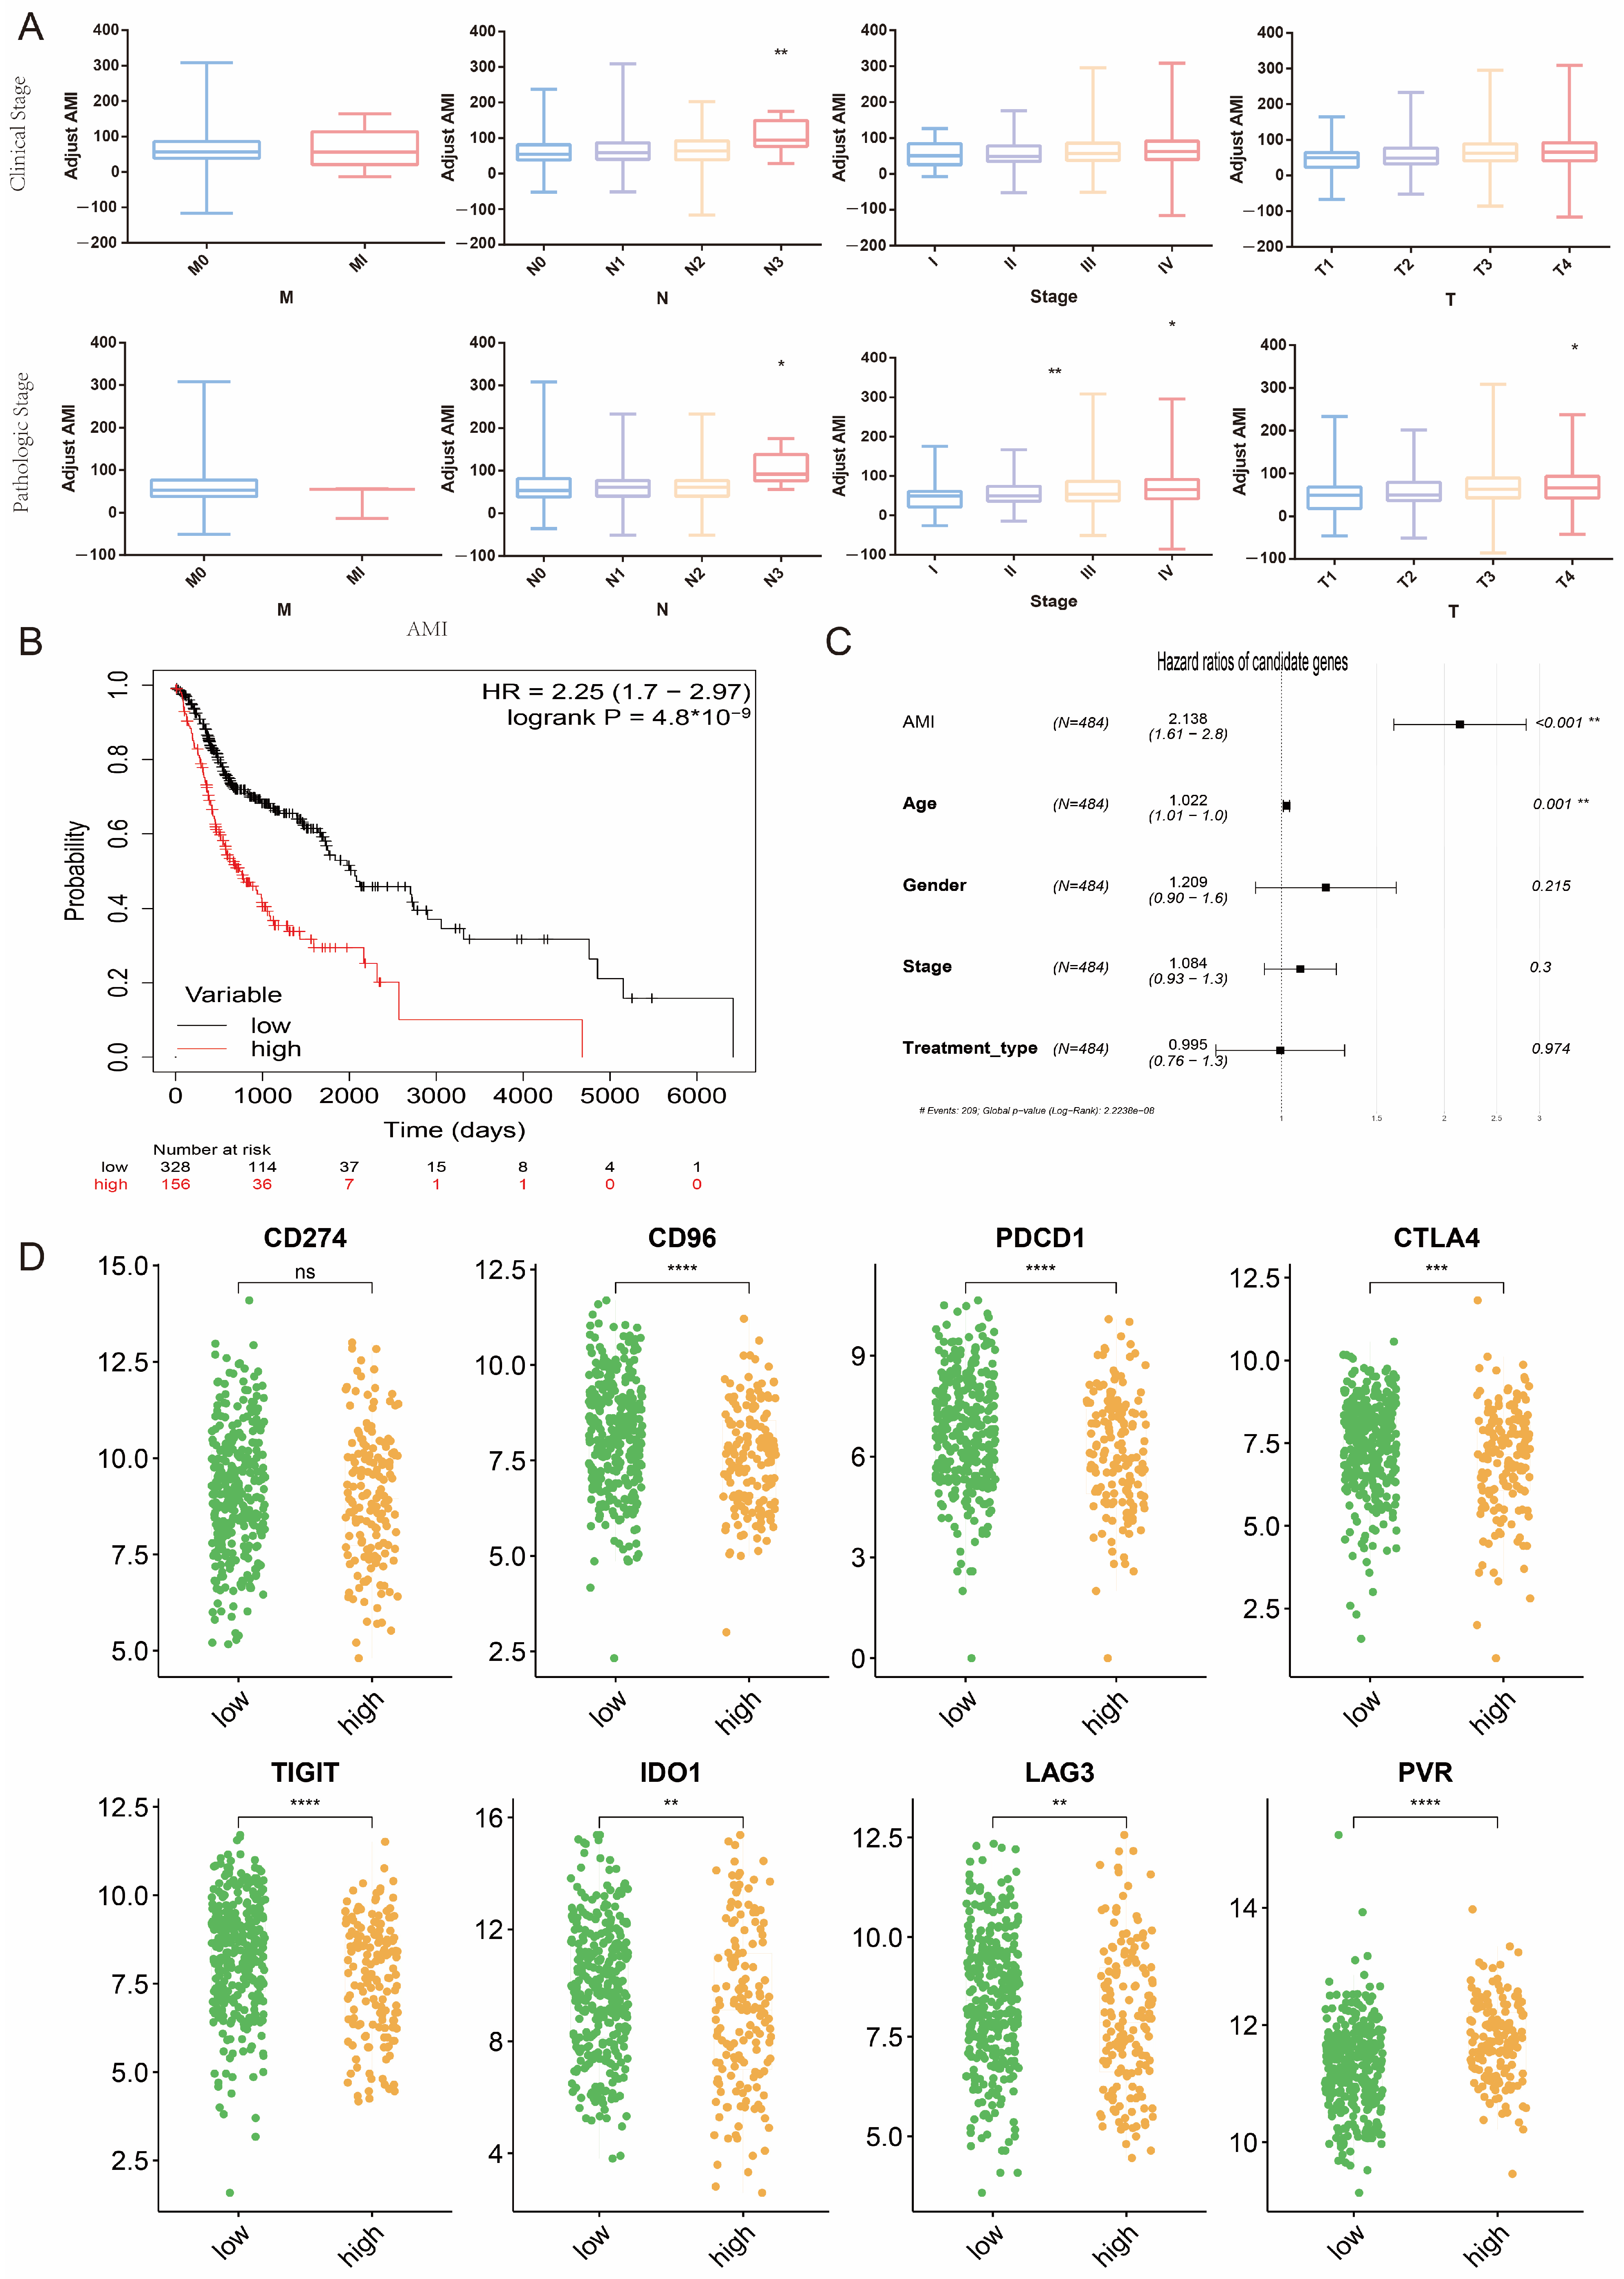
2.6. Potential Association between AMI and Clinical Indicators and Predictive Value of AMI for Response to Immunotherapy
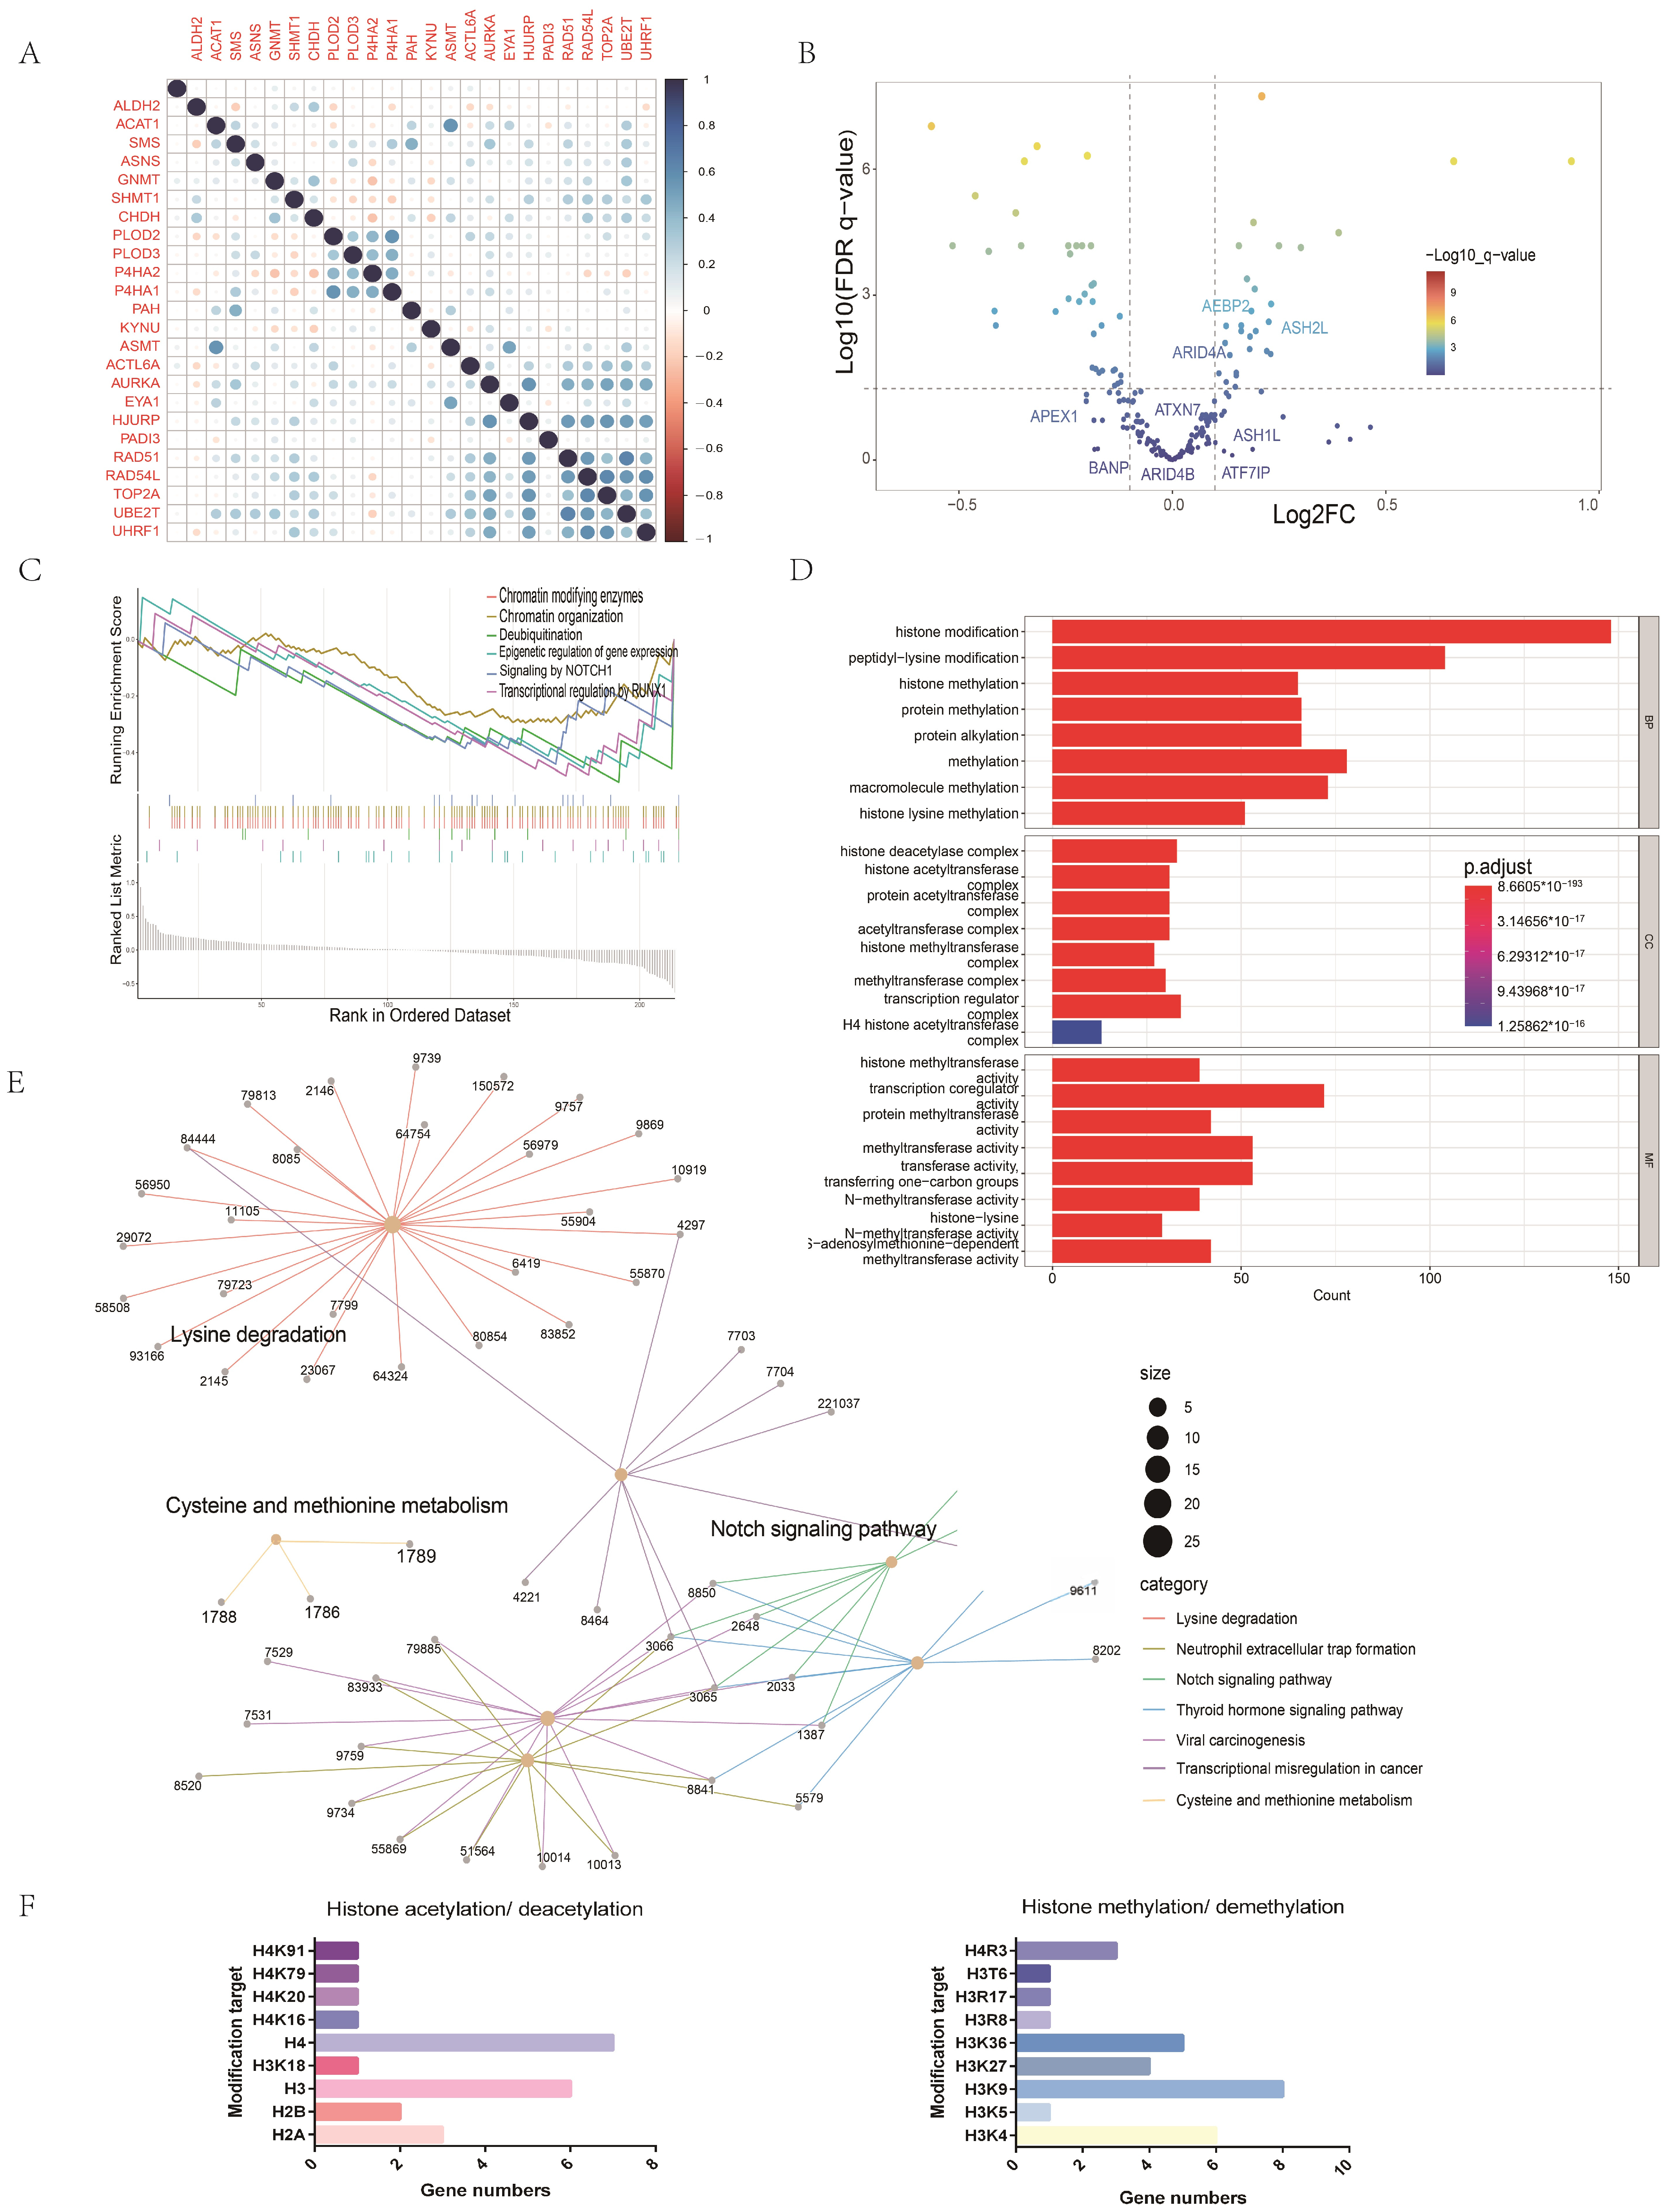
2.7. Potential Mechanisms of the Association between Amino Acid Metabolism Index and Tumor Immunity
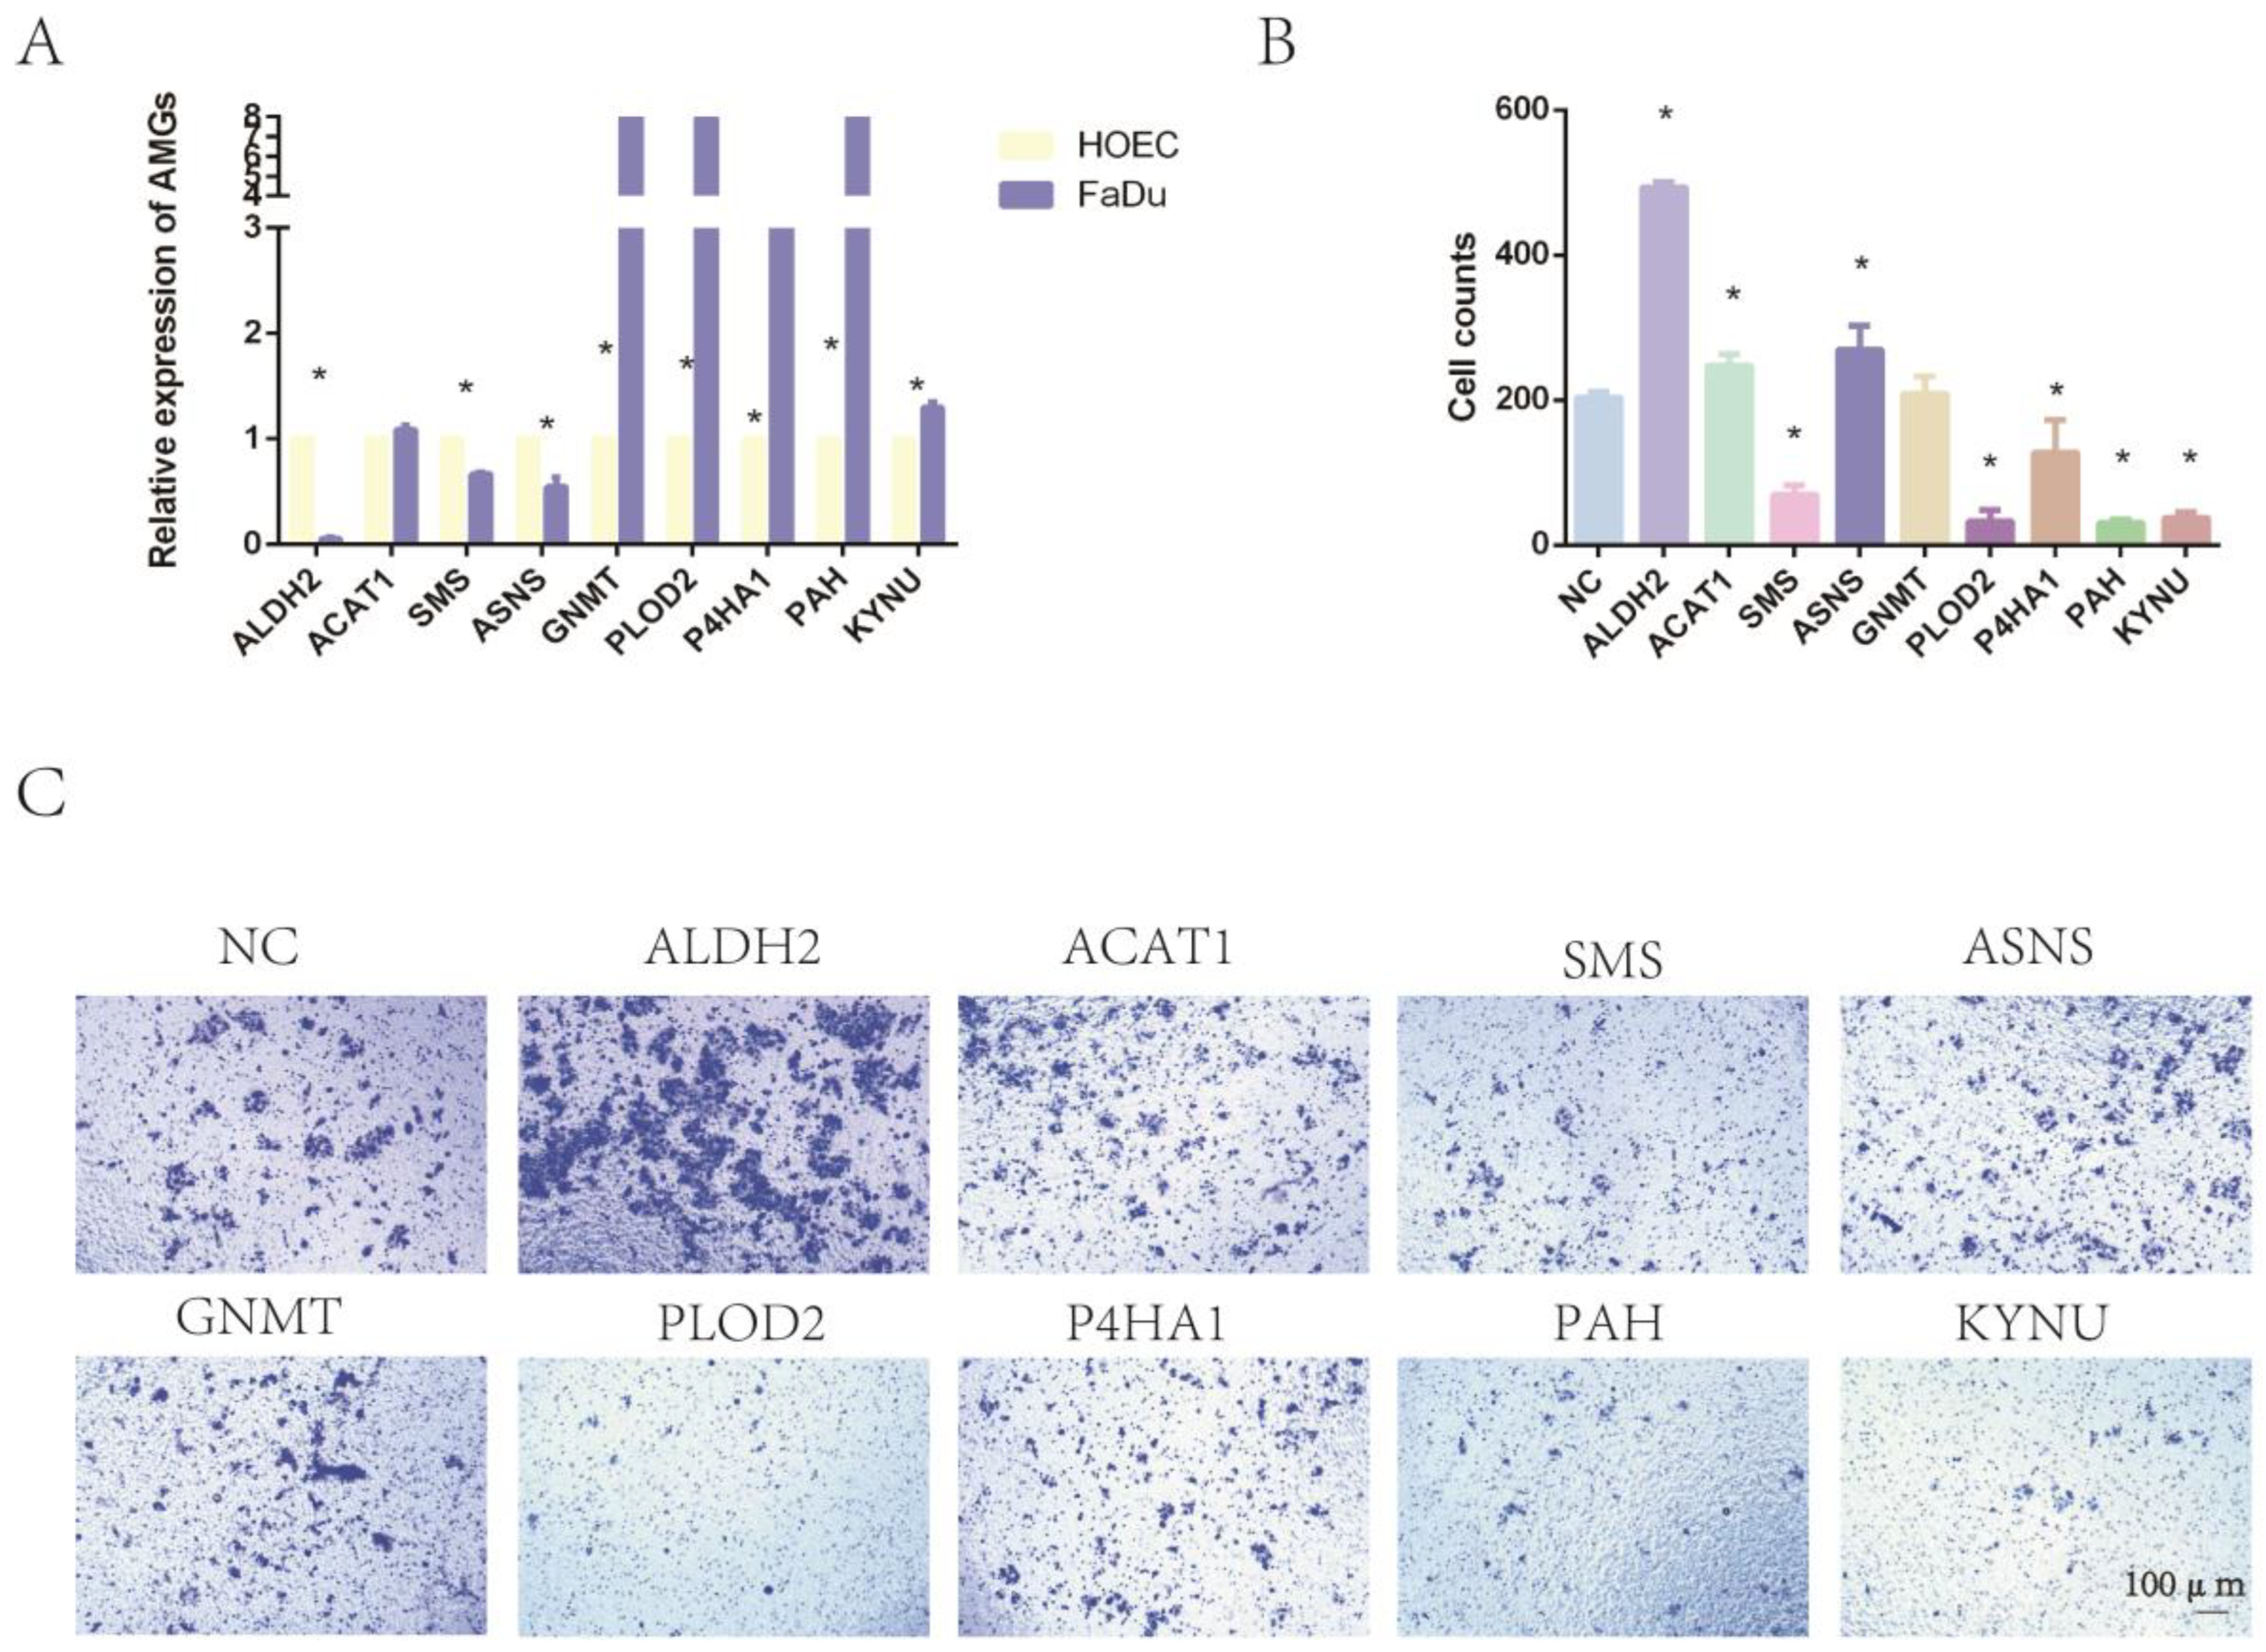
2.8. The Expression of Nine Amino-Acid-Related Genes and the Impact on Tumor Invasion
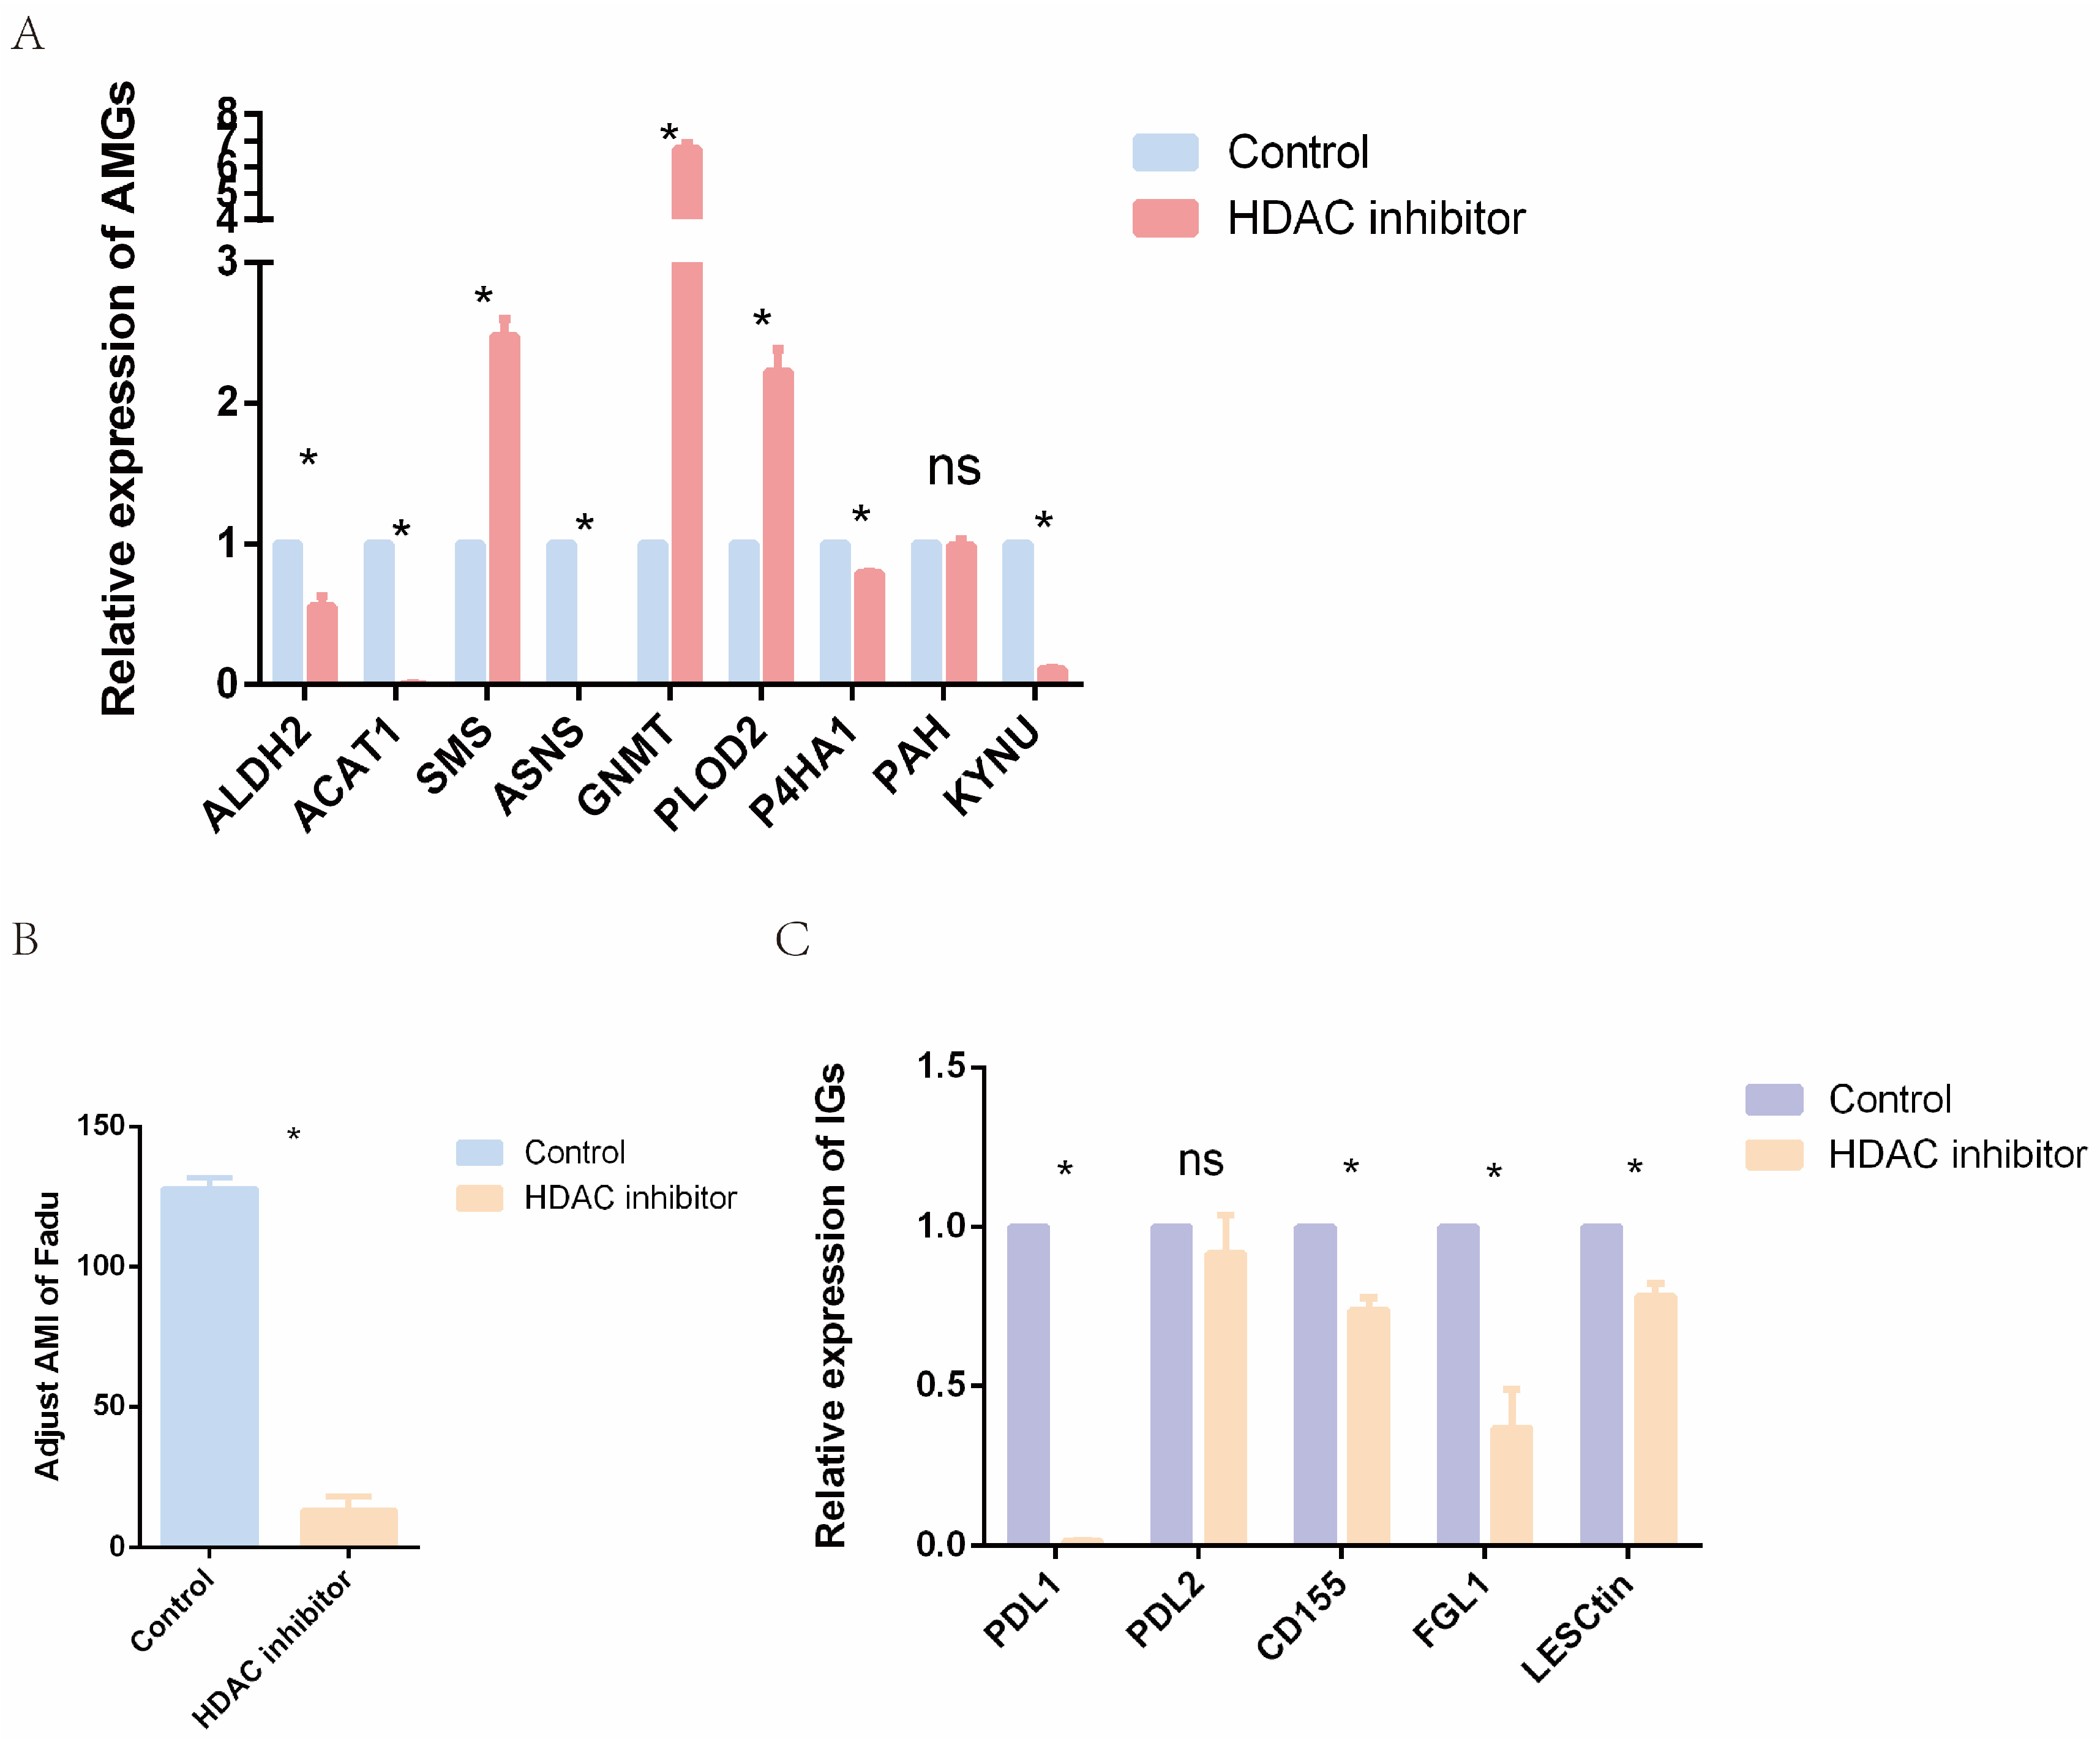
2.9. Epigenetic Drugs Affect the Expression Level of AMGs and Tumor Immunity In Vitro
3. Discussion
4. Materials and Methods
4.1. Transcriptome Data Preparation and Clinical Data Collection
4.2. Identification of Differentially Expressed Genes in Head and Neck Cancer
4.3. Collection and Identification of Differentially Expressed Amino Acid Metabolism-Related Genes
4.4. Screening of Survival-Related Amino Acid Metabolism Genes
4.5. Construction of Amino Acid Metabolism Index in Patients with Head and Neck Cancer and Verification of Its Clinical Significance
4.6. Function Enrichment Analysis between High and Low Amino Acid Metabolism Index Groups
4.7. Immune Landscape of Head and Neck Cancer and Significance of AMI to Tumor Immune Microenvironment and Immunotherapy
4.8. Potential Mechanisms of Amino Acid Metabolism Regulating Tumor Immune Microenvironment
4.9. Cell Culture and Agents
4.10. siRNA Transfection
4.11. RNA Isolation and Quantitative Real-Time PCR
4.12. The Expression of Nine AMGs in Cell Lines
4.13. Tumor Invasion Assay
4.14. Statistical Analysis
5. Conclusions
Supplementary Materials
Author Contributions
Funding
Institutional Review Board Statement
Informed Consent Statement
Data Availability Statement
Acknowledgments
Conflicts of Interest
References
- Chow, L.Q.M. Head and Neck Cancer. N. Engl. J. Med. 2020, 382, 60–72. [Google Scholar] [CrossRef]
- Kaidar-Person, O.; Gil, Z.; Billan, S. Precision medicine in head and neck cancer. Drug Resist. Updat. 2018, 40, 13–16. [Google Scholar] [CrossRef] [PubMed]
- Cramer, J.D.; Burtness, B.; Ferris, R.L. Immunotherapy for head and neck cancer: Recent advances and future directions. Oral Oncol. 2019, 99, 104460. [Google Scholar] [CrossRef] [PubMed]
- Lieu, E.L.; Nguyen, T.; Rhyne, S.; Kim, J. Amino acids in cancer. Exp. Mol. Med. 2020, 52, 15–30. [Google Scholar] [CrossRef]
- Labuschagne, C.F.; van den Broek, N.J.; Mackay, G.M.; Vousden, K.H.; Maddocks, O.D. Serine, but not glycine, supports one-carbon metabolism and proliferation of cancer cells. Cell Rep. 2014, 7, 1248–1258. [Google Scholar] [CrossRef]
- Li, Z.; Zhang, H. Reprogramming of glucose, fatty acid and amino acid metabolism for cancer progression. Cell. Mol. Life Sci. 2016, 73, 377–392. [Google Scholar] [CrossRef]
- Suzuki, S.; Tanaka, T.; Poyurovsky, M.V.; Nagano, H.; Mayama, T.; Ohkubo, S.; Lokshin, M.; Hosokawa, H.; Nakayama, T.; Suzuki, Y.; et al. Phosphate-activated glutaminase (GLS2), a p53-inducible regulator of glutamine metabolism and reactive oxygen species. Proc. Natl. Acad. Sci. USA 2010, 107, 7461–7466. [Google Scholar] [CrossRef] [PubMed]
- Wang, W.; Zou, W. Amino Acids and Their Transporters in T Cell Immunity and Cancer Therapy. Mol. Cell 2020, 80, 384–395. [Google Scholar] [CrossRef]
- Siska, P.J.; Rathmell, J.C. T cell metabolic fitness in antitumor immunity. Trends Immunol. 2015, 36, 257–264. [Google Scholar] [CrossRef]
- Gavrielatou, N.; Doumas, S.; Economopoulou, P.; Foukas, P.G.; Psyrri, A. Biomarkers for immunotherapy response in head and neck cancer. Cancer Treat. Rev. 2020, 84, 101977. [Google Scholar] [CrossRef]
- Fujii, S.I.; Shimizu, K. Immune Networks and Therapeutic Targeting of iNKT Cells in Cancer. Trends Immunol. 2019, 40, 984–997. [Google Scholar] [CrossRef]
- Sabado, R.L.; Balan, S.; Bhardwaj, N. Dendritic cell-based immunotherapy. Cell Res. 2017, 27, 74–95. [Google Scholar] [CrossRef]
- Tabe, Y.; Lorenzi, P.L. Amino acid metabolism in hematologic malignancies and the era of targeted therapy. Blood 2019, 134, 1014–1023. [Google Scholar] [CrossRef] [PubMed]
- Zhai, L.; Bell, A.; Ladomersky, E.; Lauing, K.L.; Bollu, L.; Sosman, J.A.; Zhang, B.; Wu, J.D.; Miller, S.D.; Meeks, J.J.; et al. Immunosuppressive IDO in Cancer: Mechanisms of Action, Animal Models, and Targeting Strategies. Front. Immunol. 2020, 11, 1185. [Google Scholar] [CrossRef]
- Hinshaw, D.C.; Shevde, L.A. The Tumor Microenvironment Innately Modulates Cancer Progression. Cancer Res. 2019, 79, 4557–4566. [Google Scholar] [CrossRef] [PubMed]
- Cheong, J.E.; Sun, L. Targeting the IDO1/TDO2-KYN-AhR Pathway for Cancer Immunotherapy—Challenges and Opportunities. Trends Pharmacol. Sci. 2018, 39, 307–325. [Google Scholar] [CrossRef]
- Mazzoni, A.; Capone, M.; Ramazzotti, M. IL4I1 Is Expressed by Head-Neck Cancer-Derived Mesenchymal Stromal Cells and Contributes to Suppress T Cell Proliferation. J. Clin. Med. 2021, 10, 2111. [Google Scholar] [CrossRef]
- Botticelli, A.; Mezi, S.; Pomati, G.; Cerbelli, B.; Cerbelli, E.; Roberto, M.; Giusti, R.; Cortellini, A.; Lionetto, L.; Scagnoli, S.; et al. Tryptophan Catabolism as Immune Mechanism of Primary Resistance to Anti-PD-1. Front. Immunol. 2020, 11, 1243. [Google Scholar] [CrossRef] [PubMed]
- Roy, D.G.; Chen, J.; Mamane, V.; Ma, E.H.; Muhire, B.M.; Sheldon, R.D.; Shorstova, T.; Koning, R.; Johnson, R.M.; Esaulova, E.; et al. Methionine Metabolism Shapes T Helper Cell Responses through Regulation of Epigenetic Reprogramming. Cell Metab. 2020, 31, 250–266. [Google Scholar] [CrossRef] [PubMed]
- Miranda Furtado, C.L.; Dos Santos Luciano, M.C.; Silva Santos, R.D.; Furtado, G.P.; Moraes, M.O.; Pessoa, C. Epidrugs: Targeting epigenetic marks in cancer treatment. Epigenetics 2019, 14, 1164–1176. [Google Scholar] [CrossRef]
- Jie, H.B.; Gildener-Leapman, N.; Li, J.; Srivastava, R.M.; Gibson, S.P.; Whiteside, T.L.; Ferris, R.L. Intratumoral regulatory T cells upregulate immunosuppressive molecules in head and neck cancer patients. Br. J. Cancer 2013, 109, 2629–2635. [Google Scholar] [CrossRef]
- Garcia-Gomez, A.; Rodriguez-Ubreva, J.; Ballestar, E. Epigenetic interplay between immune, stromal and cancer cells in the tumor microenvironment. Clin. Immunol. 2018, 196, 64–71. [Google Scholar] [CrossRef] [PubMed]
- Pavlova, N.N.; Thompson, C.B. The Emerging Hallmarks of Cancer Metabolism. Cell Metab. 2016, 23, 27–47. [Google Scholar] [CrossRef] [PubMed]
- Bertero, T.; Oldham, W.M.; Grasset, E.M.; Bourget, I.; Boulter, E.; Pisano, S.; Hofman, P.; Bellvert, F.; Meneguzzi, G.; Bulavin, D.V.; et al. Tumor-Stroma Mechanics Coordinate Amino Acid Availability to Sustain Tumor Growth and Malignancy. Cell Metab. 2019, 29, 124–140. [Google Scholar] [CrossRef] [PubMed]
- Garcia-Bermudez, J.; Baudrier, L.; La, K.; Zhu, X.G.; Fidelin, J.; Sviderskiy, V.O.; Papagiannakopoulos, T.; Molina, H.; Snuderl, M.; Lewis, C.A. Aspartate is a limiting metabolite for cancer cell proliferation under hypoxia and in tumours. Nat. Cell Biol. 2018, 20, 775–781. [Google Scholar] [CrossRef] [PubMed]
- Gaglio, D.; Soldati, C.; Vanoni, M.; Alberghina, L.; Chiaradonna, F. Glutamine deprivation induces abortive s-phase rescued by deoxyribonucleotides in k-ras transformed fibroblasts. PLoS ONE 2009, 4, e4715. [Google Scholar] [CrossRef]
- Yuneva, M.O.; Fan, T.W.; Allen, T.D.; Higashi, R.M.; Ferraris, D.V.; Tsukamoto, T.; Matés, J.M.; Alonso, F.J.; Wang, C.; Seo, Y.; et al. The metabolic profile of tumors depends on both the responsible genetic lesion and tissue type. Cell Metab. 2012, 15, 157–170. [Google Scholar] [CrossRef]
- Digomann, D.; Linge, A. SLC3A2/CD98hc, autophagy and tumor radioresistance: A link confirmed. Autophagy 2019, 15, 1850–1851. [Google Scholar] [CrossRef]
- Zhang, H.; Fu, L. The role of ALDH2 in tumorigenesis and tumor progression: Targeting ALDH2 as a potential cancer treatment. Acta. Pharm. Sin. B. 2021, 11, 1400–1411. [Google Scholar] [CrossRef]
- Zhang, H.; Xia, Y.; Wang, F.; Luo, M.; Yang, K.; Liang, S.; An, S.; Wu, S.; Yang, C.; Chen, D.; et al. Aldehyde Dehydrogenase 2 Mediates Alcohol-Induced Colorectal Cancer Immune Escape through Stabilizing PD-L1 Expression. Adv. Sci. 2021, 8, 2003404. [Google Scholar] [CrossRef]
- Hutson, S.M.; Lieth, E.; LaNoue, K.F. Function of leucine in excitatory neurotransmitter metabolism in the central nervous system. J. Nutr. 2001, 131, 846s–850s. [Google Scholar] [CrossRef]
- Yoo, H.C.; Yu, Y.C.; Sung, Y.; Han, J.M. Glutamine reliance in cell metabolism. Exp. Mol. Med. 2020, 52, 1496–1516. [Google Scholar] [CrossRef]
- Du, H.; Pang, M.; Hou, X.; Yuan, S.; Sun, L. PLOD2 in cancer research. Biomed. Pharmacother. 2017, 90, 670–676. [Google Scholar] [CrossRef] [PubMed]
- Orhan, F.; Bhat, M.; Sandberg, K.; Ståhl, S.; Piehl, F.; Svensson, C.; Erhardt, S.; Schwieler, L. Tryptophan Metabolism Along the Kynurenine Pathway Downstream of Toll-like Receptor Stimulation in Peripheral Monocytes. Scand. J. Immunol. 2016, 84, 262–271. [Google Scholar] [CrossRef] [PubMed]
- Cho, Y.A.; Yoon, H.J.; Lee, J.I.; Hong, S.P.; Hong, S.D. Relationship between the expressions of PD-L1 and tumor-infiltrating lymphocytes in oral squamous cell carcinoma. Oral. Oncol. 2011, 47, 1148–1153. [Google Scholar] [CrossRef]
- Nguyen, N.; Bellile, E.; Thomas, D.; McHugh, J.; Rozek, L.; Virani, S.; Peterson, L.; Carey, T.E.; Walline, H.; Moyer, J.; et al. Tumor infiltrating lymphocytes and survival in patients with head and neck squamous cell carcinoma. Head Neck 2016, 38, 1074–1084. [Google Scholar] [CrossRef] [PubMed]
- Mehla, K.; Singh, P.K. Metabolic Regulation of Macrophage Polarization in Cancer. Trends Cancer 2019, 5, 822–834. [Google Scholar] [CrossRef] [PubMed]
- Cho, J.H.; Lim, Y.C. Prognostic impact of regulatory T cell in head and neck squamous cell carcinoma: A systematic review and meta-analysis. Oral Oncol. 2021, 112, 105084. [Google Scholar] [CrossRef]
- Filaci, G.; Fravega, M.; Fenoglio, D.; Rizzi, M.; Negrini, S.; Viggiani, R.; Indiveri, F. Non-antigen specific CD8+ T suppressor lymphocytes. Clin. Exp. Med. 2004, 4, 86–92. [Google Scholar] [CrossRef]
- Filaci, G.; Rizzi, M.; Setti, M.; Fenoglio, D.; Fravega, M.; Basso, M.; Ansaldo, G.; Ceppa, P.; Borgonovo, G.; Murdaca, G.; et al. Non-antigen-specific CD8(+) T suppressor lymphocytes in diseases characterized by chronic immune responses and inflammation. Ann. N. Y. Acad. Sci. 2005, 1050, 115–123. [Google Scholar] [CrossRef]
- Jia, Y.; Domenico, J.; Takeda, K.; Han, J.; Wang, M.; Armstrong, M.; Reisdorph, N.; O’Connor, B.P.; Lucas, J.J.; Gelfand, E.W. Steroidogenic enzyme Cyp11a1 regulates Type 2 CD8+ T cell skewing in allergic lung disease. Proc. Natl. Acad. Sci. USA 2013, 110, 8152–8157. [Google Scholar] [CrossRef] [PubMed]
- Wang, H.; Zhao, Q.; Zhang, Y.; Zhang, Q.; Zheng, Z.; Liu, S.; Liu, Z.; Meng, L.; Xin, Y.; Jiang, X. Immunotherapy Advances in Locally Advanced and Recurrent/Metastatic Head and Neck Squamous Cell Carcinoma and Its Relationship With Human Papillomavirus. Front. Immunol. 2021, 12, 652054. [Google Scholar] [CrossRef] [PubMed]
- Matoba, T.; Imai, M.; Ohkura, N.; Kawakita, D. Regulatory T cells expressing abundant CTLA-4 on the cell surface with a proliferative gene profile are key features of human head and neck cancer. Int. J. Cancer. 2019, 144, 2811–2822. [Google Scholar] [CrossRef]
- Seiwert, T.Y.; Burtness, B.; Mehra, R.; Weiss, J.; Berger, R.; Eder, J.P.; Heath, K.; McClanahan, T.; Lunceford, J.; Gause, C.; et al. Safety and clinical activity of pembrolizumab for treatment of recurrent or metastatic squamous cell carcinoma of the head and neck (KEYNOTE-012): An open-label, multicentre, phase 1b trial. Lancet Oncol. 2016, 17, 956–965. [Google Scholar] [CrossRef] [PubMed]
- Rodriguez, C.P.; Wu, Q.V.; Voutsinas, J.; Fromm, J.R.; Jiang, X.; Pillarisetty, V.G. A Phase II Trial of Pembrolizumab and Vorinostat in Recurrent Metastatic Head and Neck Squamous Cell Carcinomas and Salivary Gland Cancer. Clin. Cancer Res. 2020, 26, 837–845. [Google Scholar] [CrossRef]
- Gallagher, S.J.; Shklovskaya, E.; Hersey, P. Epigenetic modulation in cancer immunotherapy. Curr. Opin. Pharmacol. 2017, 35, 48–56. [Google Scholar] [CrossRef]
- Woods, D.M.; Sodré, A.L.; Villagra, A.; Sarnaik, A.; Sotomayor, E.M.; Weber, J. HDAC Inhibition Upregulates PD-1 Ligands in Melanoma and Augments Immunotherapy with PD-1 Blockade. Cancer Immunol. Res. 2015, 3, 1375–1385. [Google Scholar] [CrossRef]
- Wang, J.; Sanmamed, M.F.; Datar, I.; Su, T.T.; Ji, L.; Sun, J.; Chen, L.; Chen, Y.; Zhu, G.; Yin, W.; et al. Fibrinogen-like Protein 1 Is a Major Immune Inhibitory Ligand of LAG-3. Cell 2019, 176, 334–347.e12. [Google Scholar] [CrossRef]
- Chauvin, J.M.; Zarour, H.M. TIGIT in cancer immunotherapy. J. Immunother. Cancer 2020, 8, e000957. [Google Scholar] [CrossRef]
- Lupo, K.B.; Matosevic, S. CD155 immunoregulation as a target for natural killer cell immunotherapy in glioblastoma. J. Hematol. Oncol. 2020, 13, 76. [Google Scholar] [CrossRef]


Disclaimer/Publisher’s Note: The statements, opinions and data contained in all publications are solely those of the individual author(s) and contributor(s) and not of MDPI and/or the editor(s). MDPI and/or the editor(s) disclaim responsibility for any injury to people or property resulting from any ideas, methods, instructions or products referred to in the content. |
© 2023 by the authors. Licensee MDPI, Basel, Switzerland. This article is an open access article distributed under the terms and conditions of the Creative Commons Attribution (CC BY) license (https://creativecommons.org/licenses/by/4.0/).
Share and Cite
Li, X.; Li, D.; Li, J.; Chen, Y.; Cai, Z.; Tan, F. A Prognostic Model of Head and Neck Cancer Based on Amino Acid Metabolism-Related Signature and Its Implication for Immunosuppressive Microenvironment. Int. J. Mol. Sci. 2023, 24, 11753. https://doi.org/10.3390/ijms241411753
Li X, Li D, Li J, Chen Y, Cai Z, Tan F. A Prognostic Model of Head and Neck Cancer Based on Amino Acid Metabolism-Related Signature and Its Implication for Immunosuppressive Microenvironment. International Journal of Molecular Sciences. 2023; 24(14):11753. https://doi.org/10.3390/ijms241411753
Chicago/Turabian StyleLi, Xuran, Danni Li, Jiaojiao Li, Yiliang Chen, Zhenyu Cai, and Fei Tan. 2023. "A Prognostic Model of Head and Neck Cancer Based on Amino Acid Metabolism-Related Signature and Its Implication for Immunosuppressive Microenvironment" International Journal of Molecular Sciences 24, no. 14: 11753. https://doi.org/10.3390/ijms241411753
APA StyleLi, X., Li, D., Li, J., Chen, Y., Cai, Z., & Tan, F. (2023). A Prognostic Model of Head and Neck Cancer Based on Amino Acid Metabolism-Related Signature and Its Implication for Immunosuppressive Microenvironment. International Journal of Molecular Sciences, 24(14), 11753. https://doi.org/10.3390/ijms241411753