
Creatine Kinase MB Isoenzyme Is a Complementary Biomarker in Amyotrophic Lateral Sclerosis

 and
and 
Abstract
1. Introduction
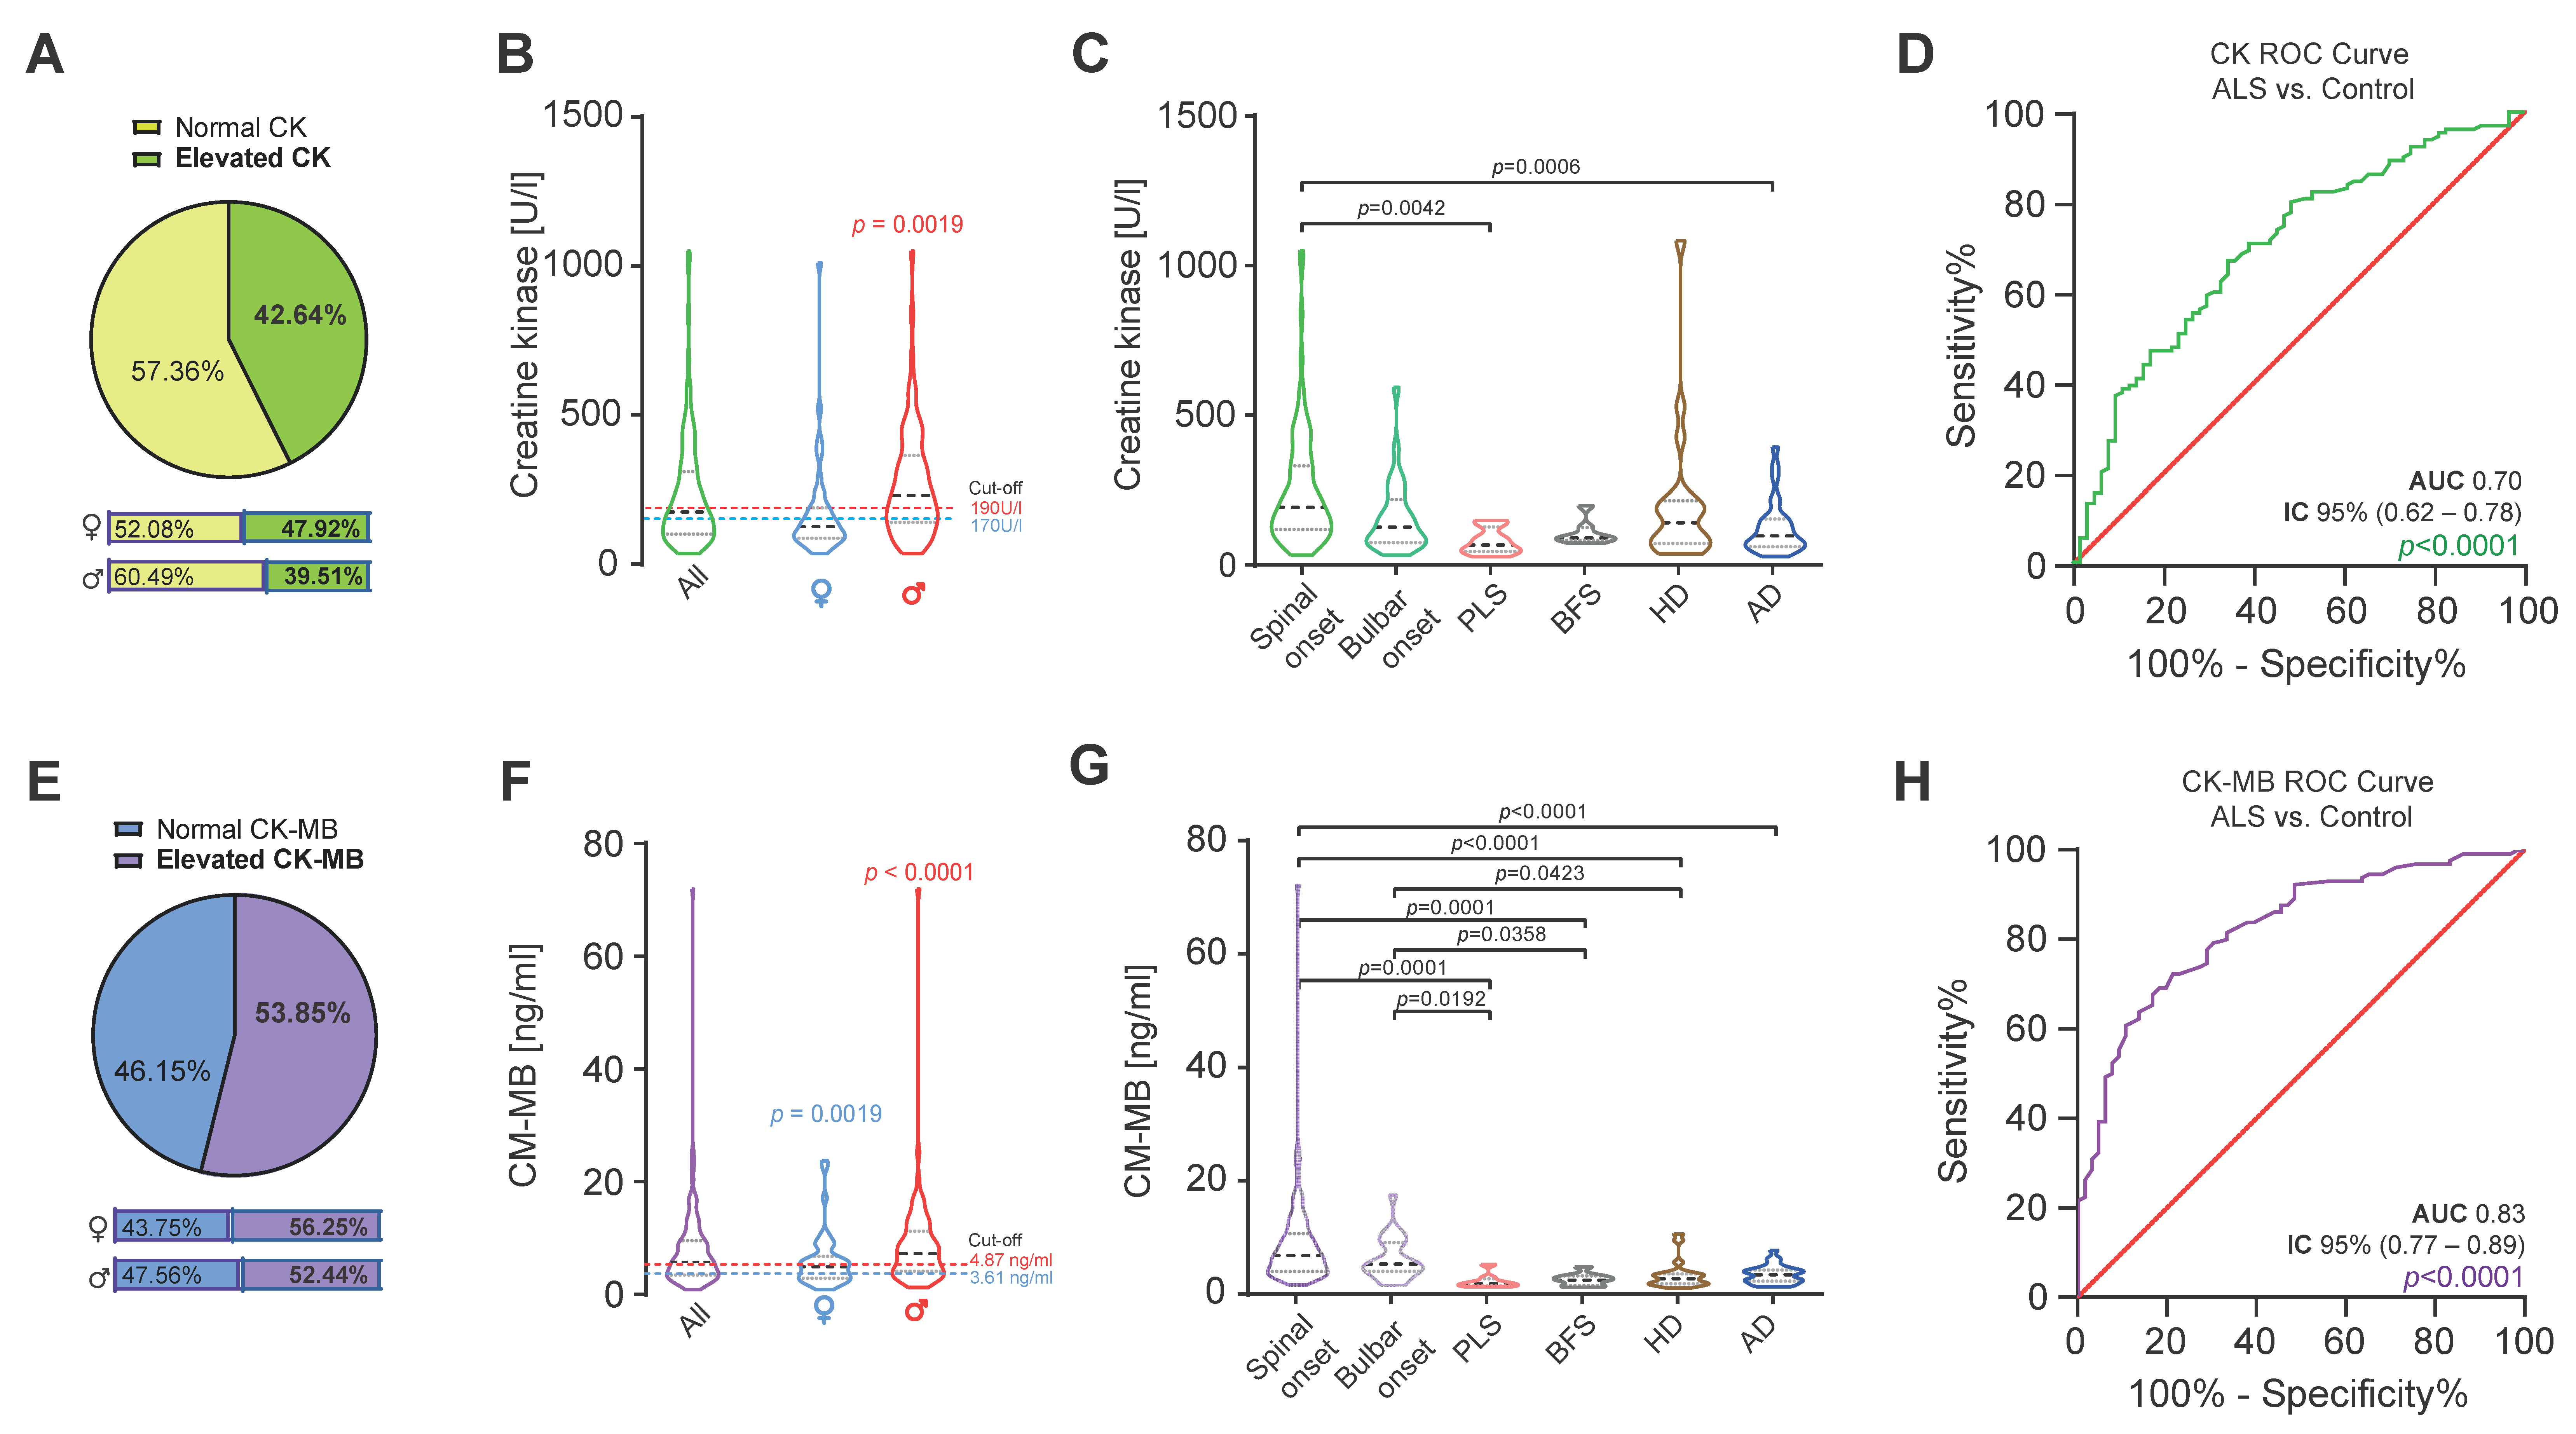
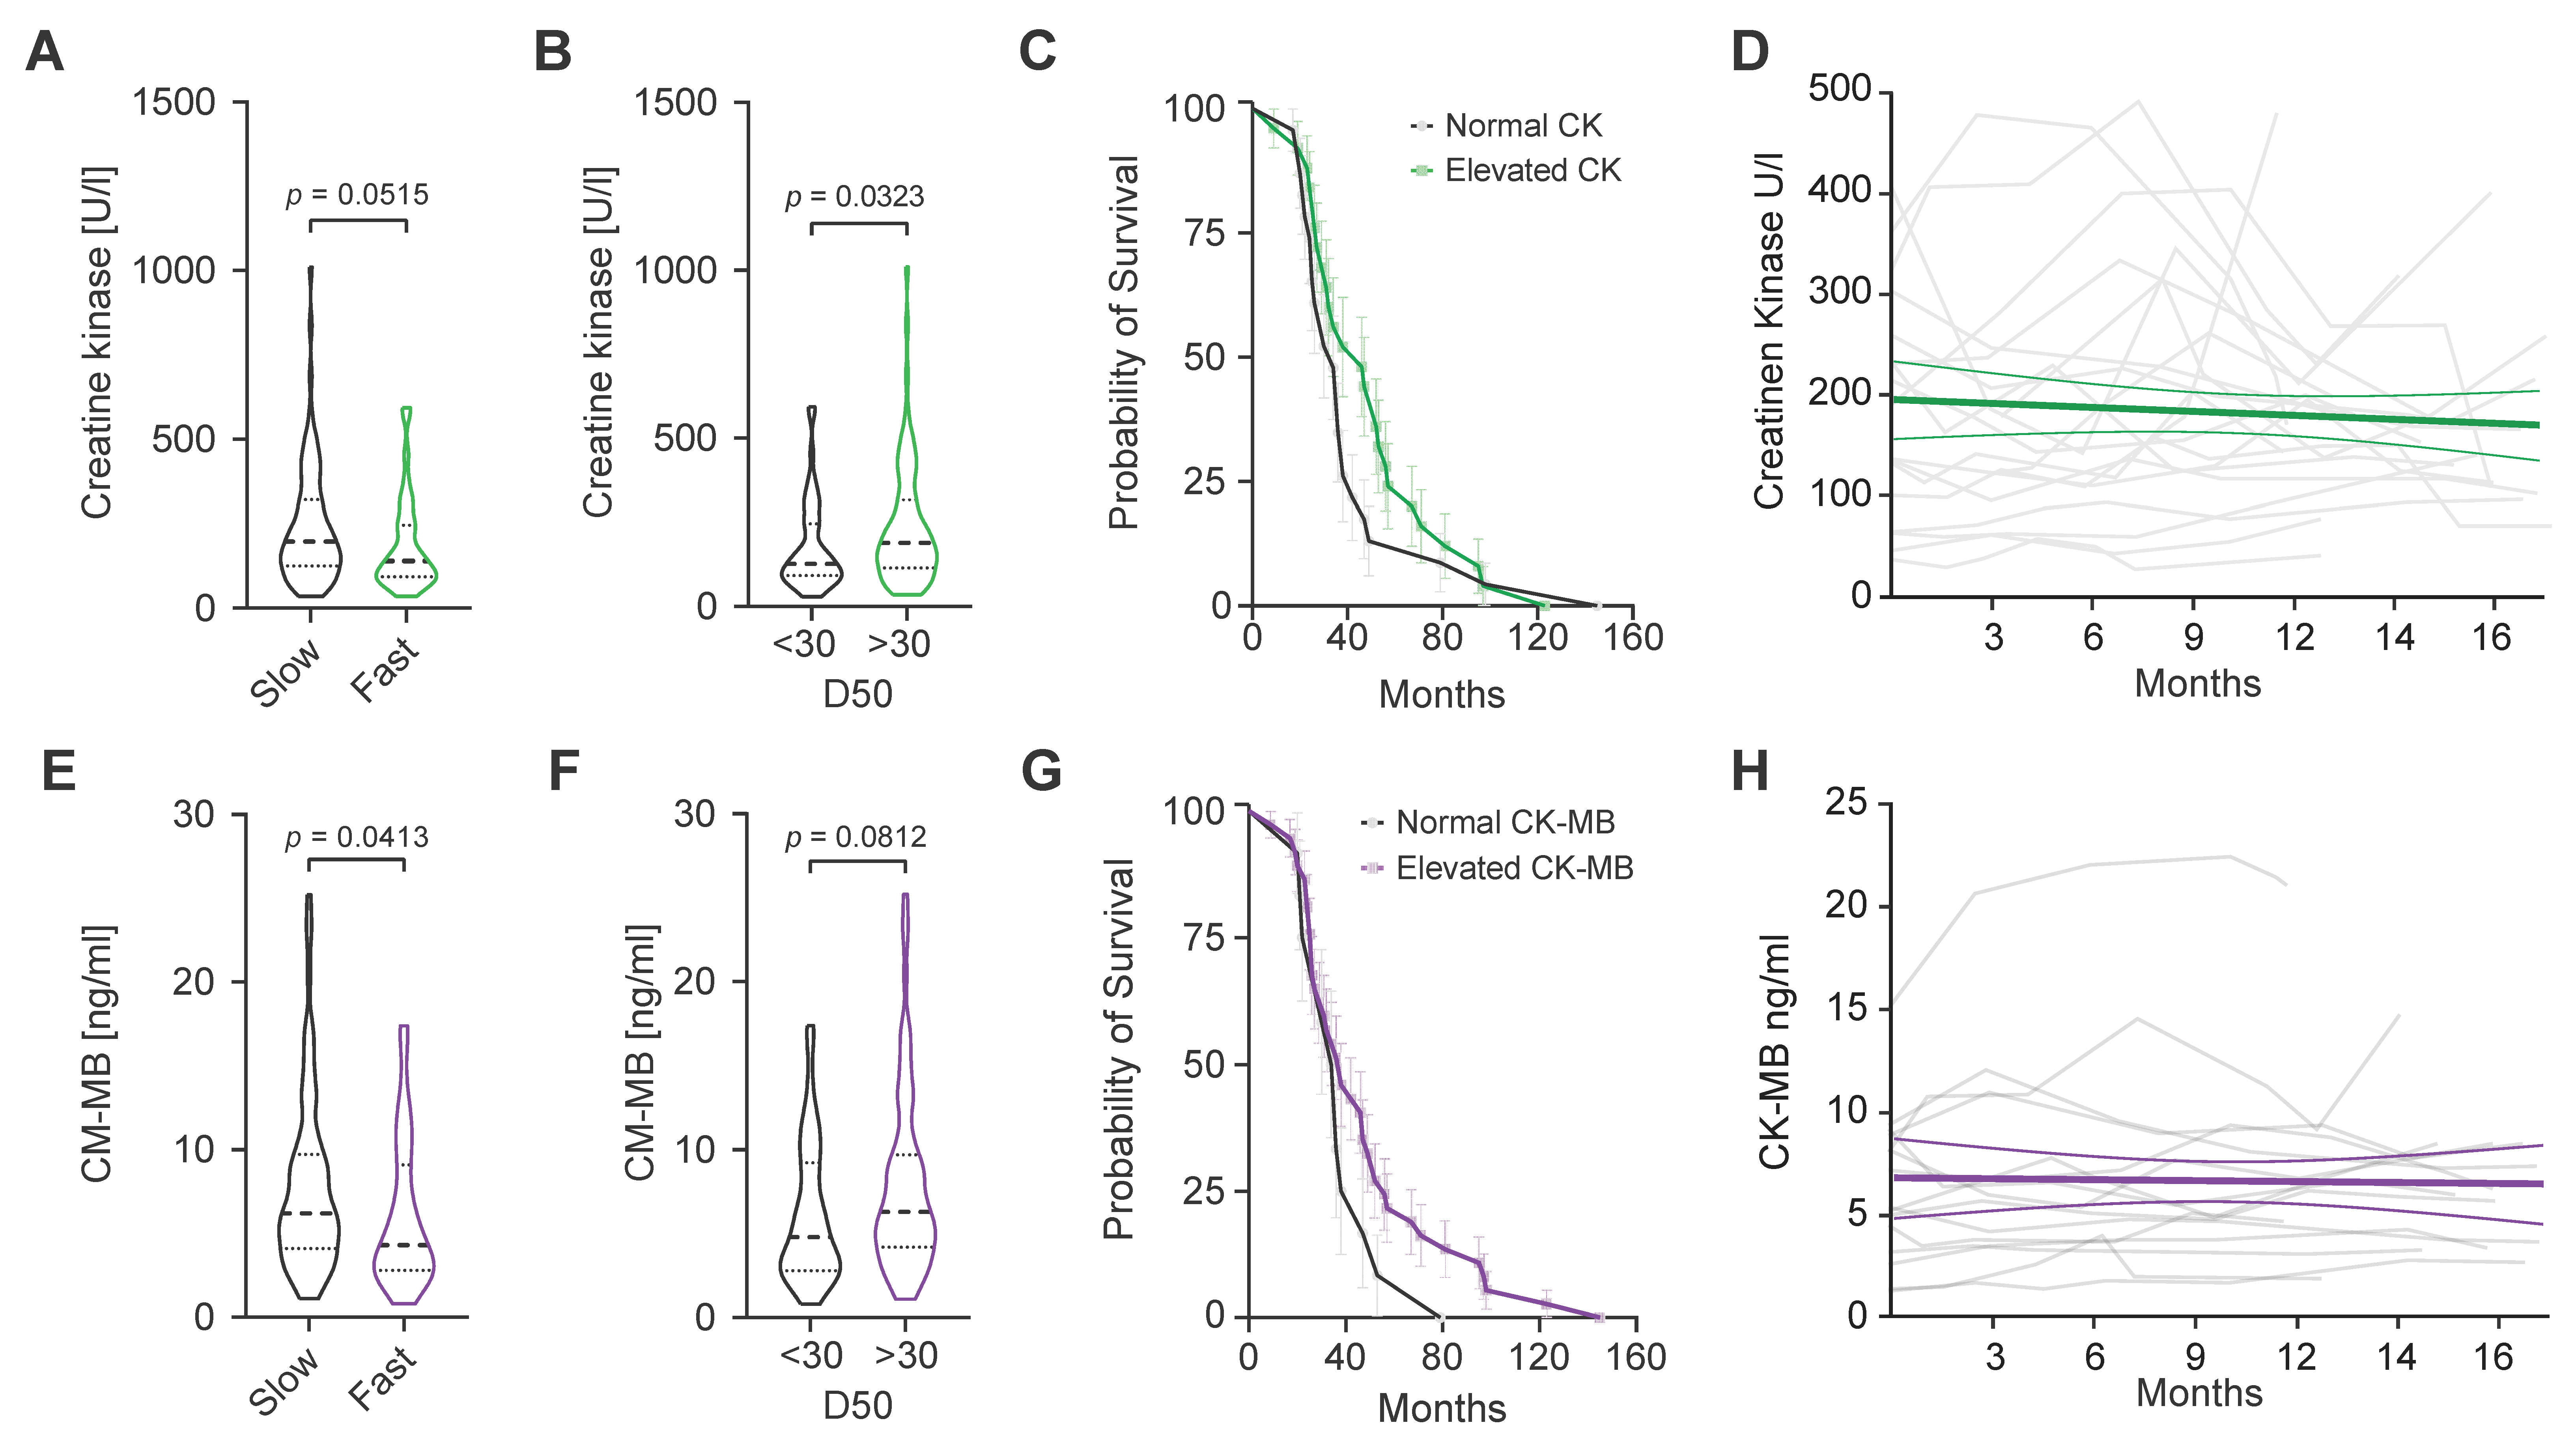
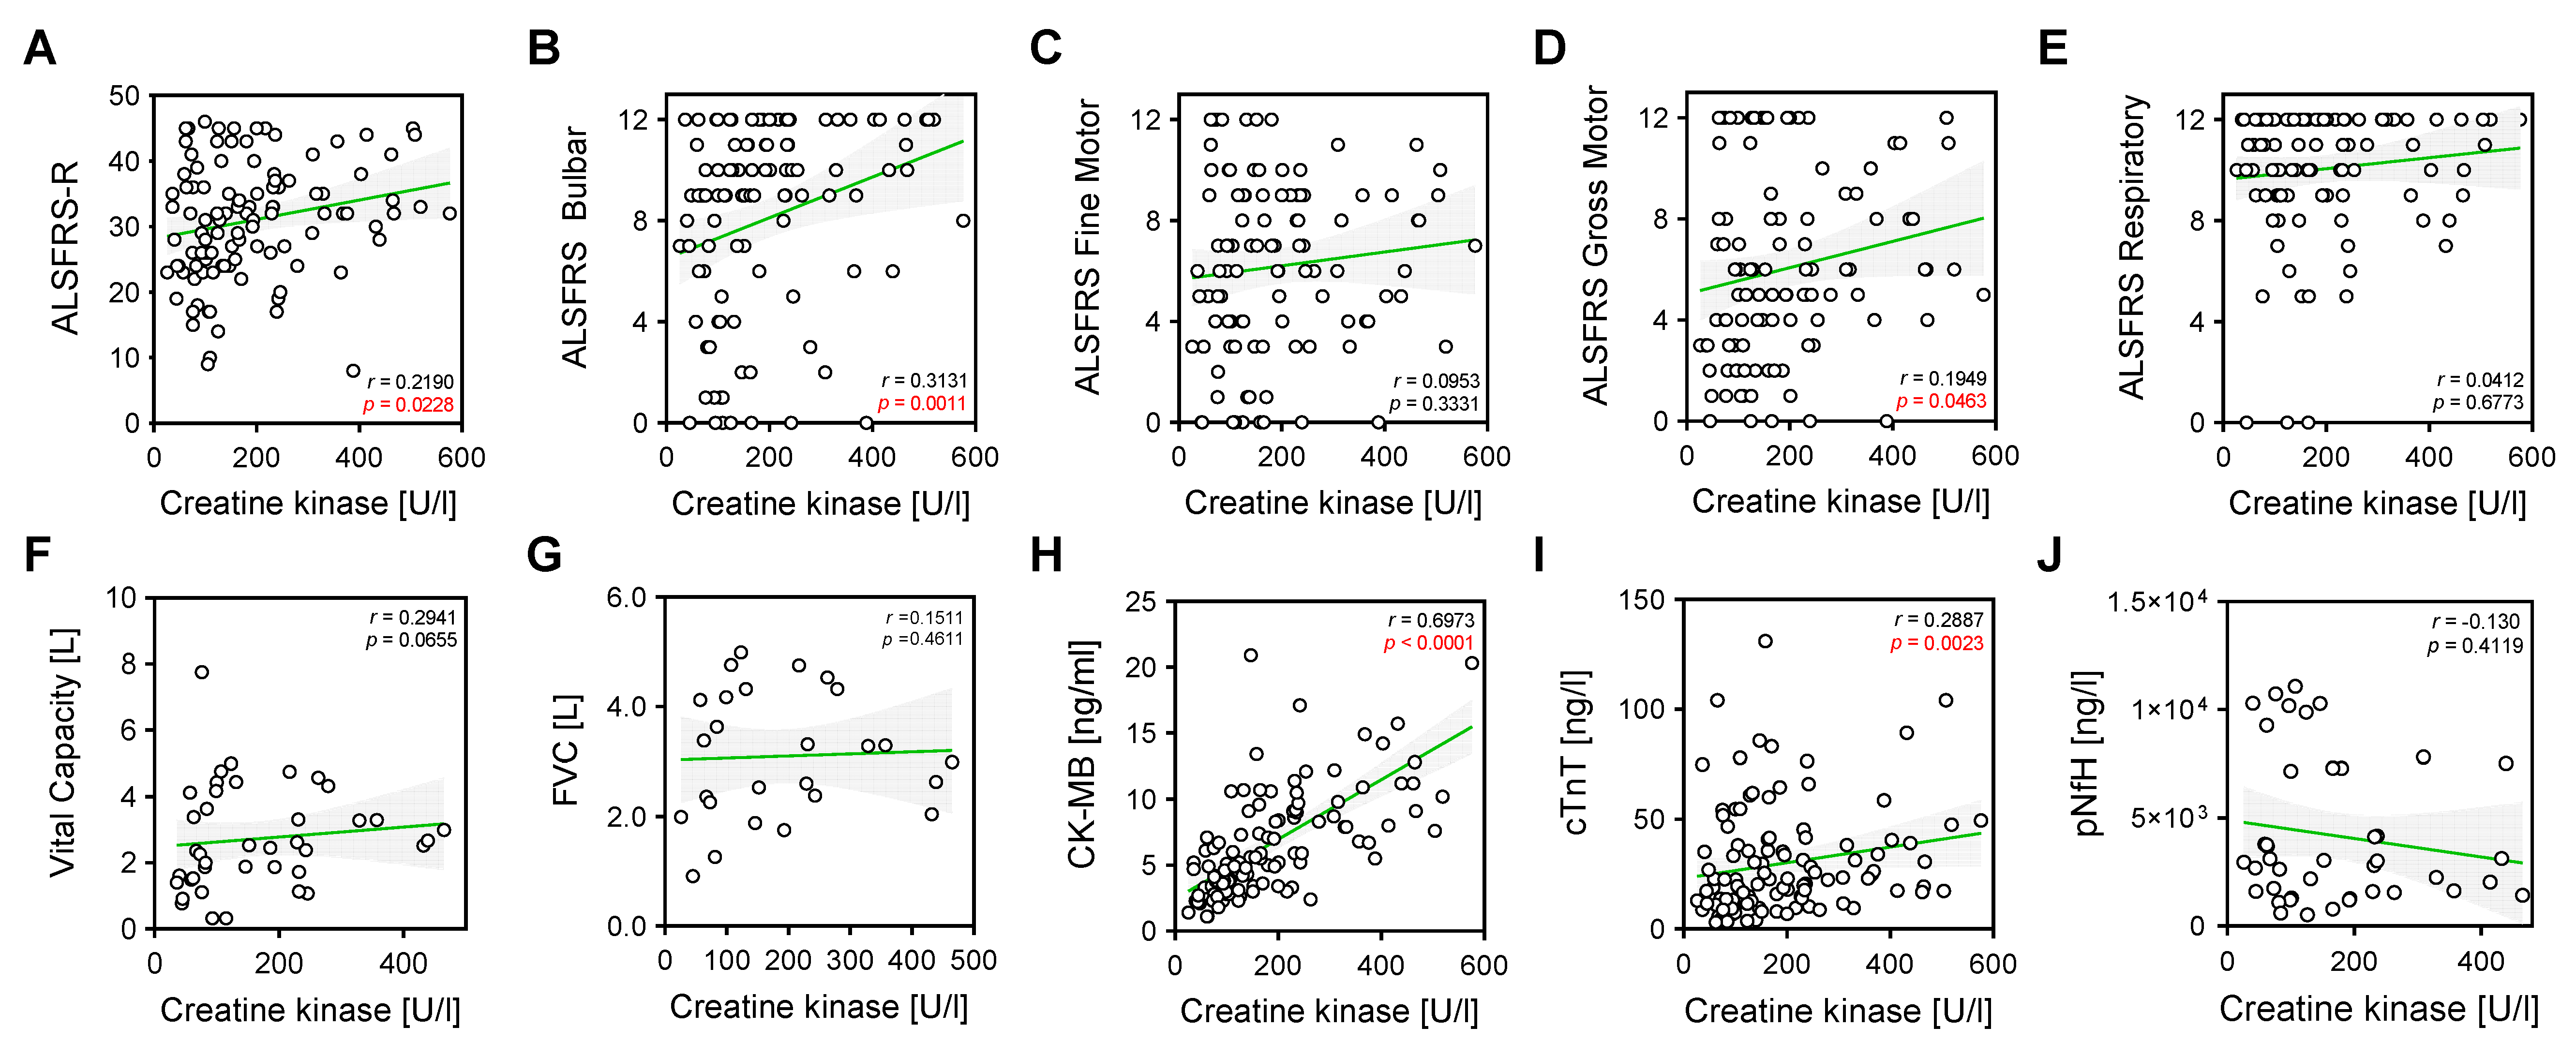
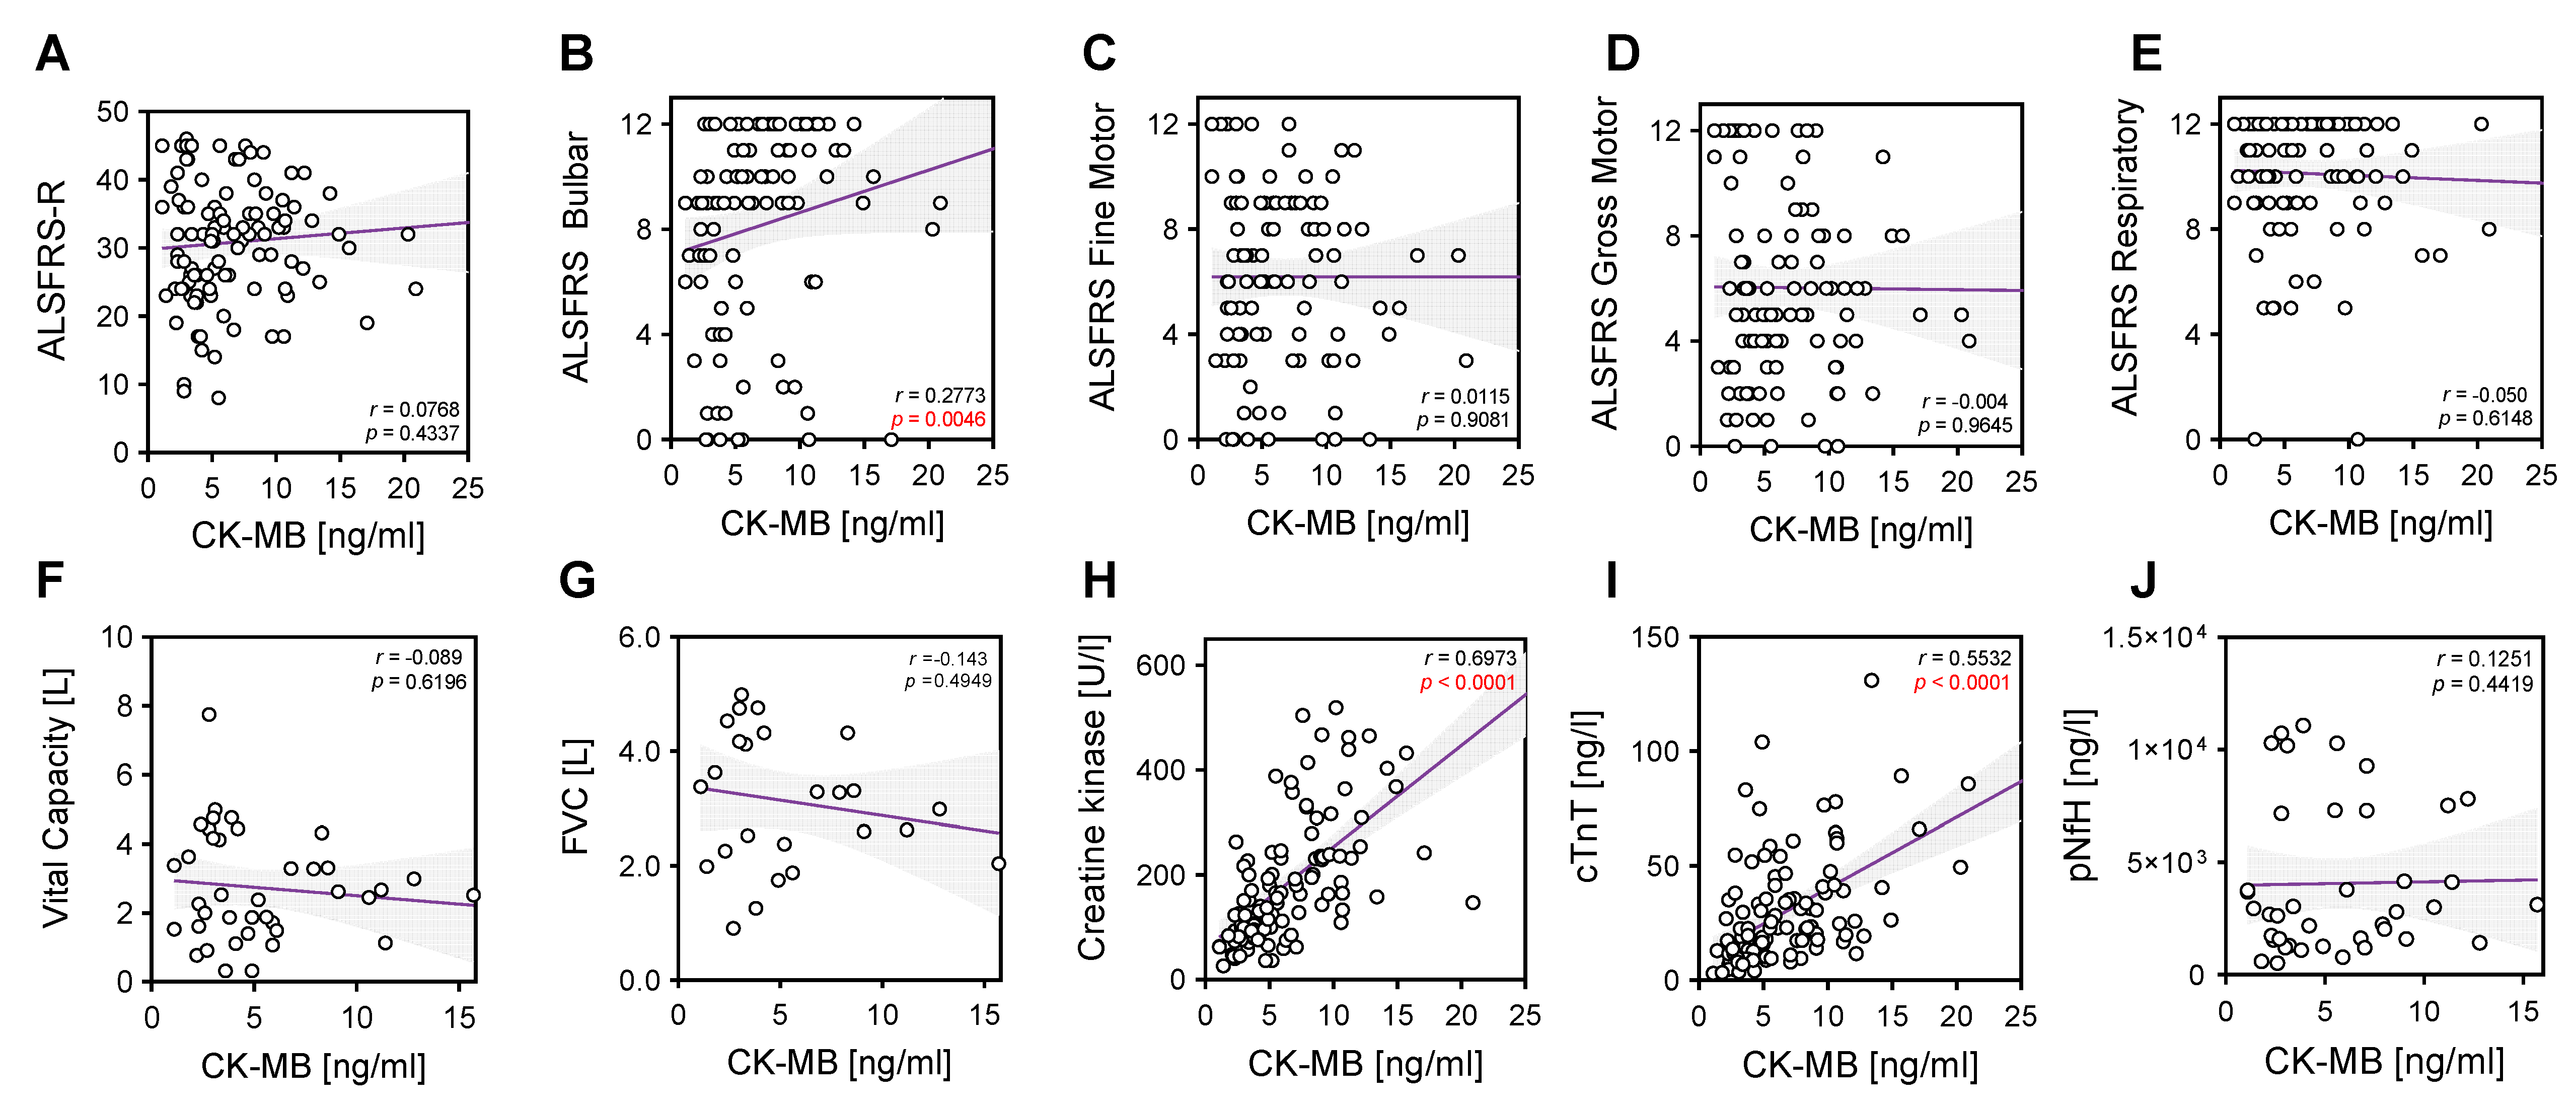
2. Results
3. Discussion
4. Materials and Methods
4.1. Patient Cohort
4.2. Laboratory Markers
4.3. Statistical Analysis
Author Contributions
Funding
Institutional Review Board Statement
Informed Consent Statement
Data Availability Statement
Acknowledgments
Conflicts of Interest
References
- Goutman, S.A.; Hardiman, O.; Al-Chalabi, A.; Chió, A.; Savelieff, M.G.; Kiernan, M.C.; Feldman, E.L. Recent Advances in the Diagnosis and Prognosis of Amyotrophic Lateral Sclerosis. Lancet Neurol. 2022, 21, 480–493. [Google Scholar] [CrossRef] [PubMed]
- Genge, A.; Chio, A. The Future of ALS Diagnosis and Staging: Where Do We Go from Here? Amyotroph. Lateral Scler. Front. Degener. 2023, 24, 165–174. [Google Scholar] [CrossRef] [PubMed]
- Wyss, M.; Kaddurah-Daouk, R. Creatine and Creatinine Metabolism. Physiol. Rev. 2000, 80, 1107–1213. [Google Scholar] [CrossRef] [PubMed]
- Gao, J.; Dharmadasa, T.; Malaspina, A.; Shaw, P.J.; Talbot, K.; Turner, M.R.; Thompson, A.G. Creatine Kinase and Prognosis in Amyotrophic Lateral Sclerosis: A Literature Review and Multi-Centre Cohort Analysis. J. Neurol. 2022, 269, 5395–5404. [Google Scholar] [CrossRef] [PubMed]
- Dawson, D.M.; Eppenberger, H.M.; Kaplan, N.O. Creatine Kinase: Evidence for a Dimeric Structure. Biochem. Biophys. Res. Commun. 1965, 21, 346–353. [Google Scholar] [CrossRef]
- Saenger, A.K.; Jaffe, A.S. Requiem for a Heavyweight: The Demise of Creatine Kinase-MB. Circulation 2008, 118, 2200–2206. [Google Scholar] [CrossRef]
- Prellwitz, W.; Neumeier, D. Creatine-Kinase and CK-MB Isoenzyme Activity in Serum of Patients after Surgical Operations, Polytrauma and Other Damage to Skeletal Muscle. Clin. Biochem. 1979, 12, 225. [Google Scholar] [CrossRef]
- Alvin, M.D.; Jaffe, A.S.; Ziegelstein, R.C.; Trost, J.C. Eliminating Creatine Kinase–Myocardial Band Testing in Suspected Acute Coronary Syndrome: A Value-Based Quality Improvement. JAMA Intern. Med. 2017, 177, 1508. [Google Scholar] [CrossRef]
- Castro-Gomez, S.; Radermacher, B.; Tacik, P.; Mirandola, S.R.; Heneka, M.T.; Weydt, P. Teaching an Old Dog New Tricks: Serum Troponin T as a Biomarker in Amyotrophic Lateral Sclerosis. Brain Commun. 2021, 3, fcab274. [Google Scholar] [CrossRef]
- Jockers-Wretou, E.; Grabert, K.; Müller, E.; Pfleiderer, G. Serum Creatine Kinase Isoenzyme Pattern in Nervous System Atrophies and Neuromuscular Disorders. Clin. Chim. Acta 1976, 73, 183–186. [Google Scholar] [CrossRef]
- Jockers-Wretou, E.; Vassilopoulos, D. Serum Creatine Kinase B Subunit Levels in Neurogenic Atrophies. J. Neurol. 1985, 232, 236–239. [Google Scholar] [CrossRef] [PubMed]
- Gibson, S.B.; Kasarskis, E.J.; Hu, N.; Pulst, S.-M.; Mendiondo, M.S.; Matthews, D.E.; Mitsumoto, H.; Tandan, R.; Simmons, Z.; Kryscio, R.J.; et al. Relationship of Creatine Kinase to Body Composition, Disease State, and Longevity in ALS. Amyotroph. Lateral Scler. Front. Degener. 2015, 16, 473–477. [Google Scholar] [CrossRef]
- Tai, H.; Cui, L.; Guan, Y.; Liu, M.; Li, X.; Shen, D.; Li, D.; Cui, B.; Fang, J.; Ding, Q.; et al. Correlation of Creatine Kinase Levels with Clinical Features and Survival in Amyotrophic Lateral Sclerosis. Front. Neurol. 2017, 8, 322. [Google Scholar] [CrossRef]
- Steinbach, R.; Batyrbekova, M.; Gaur, N.; Voss, A.; Stubendorff, B.; Mayer, T.E.; Gaser, C.; Witte, O.W.; Prell, T.; Grosskreutz, J. Applying the D50 Disease Progression Model to Gray and White Matter Pathology in Amyotrophic Lateral Sclerosis. Neuroimage Clin. 2020, 25, 102094. [Google Scholar] [CrossRef]
- Kläppe, U.; Chamoun, S.; Shen, Q.; Finn, A.; Evertsson, B.; Zetterberg, H.; Blennow, K.; Press, R.; Samuelsson, K.; Månberg, A.; et al. Cardiac Troponin T Is Elevated and Increases Longitudinally in ALS Patients. Amyotroph. Lateral Scler. Front. Degener. 2022, 23, 58–65. [Google Scholar] [CrossRef]
- Rittoo, D.; Jones, A.; Lecky, B.; Neithercut, D. Elevation of Cardiac Troponin T, but Not Cardiac Troponin I, in Patients with Neuromuscular Diseases: Implications for the Diagnosis of Myocardial Infarction. J. Am. Coll. Cardiol. 2014, 63, 2411–2420. [Google Scholar] [CrossRef]
- Casmiro, M.; Graziani, A. Serum Troponin T in Patients with Amyotrophic Lateral Sclerosis. Acta Neurol. Belg. 2019, 119, 285–288. [Google Scholar] [CrossRef]
- Rosenbohm, A.; Schmid, B.; Buckert, D.; Rottbauer, W.; Kassubek, J.; Ludolph, A.C.; Bernhardt, P. Cardiac Findings in Amyotrophic Lateral Sclerosis: A Magnetic Resonance Imaging Study. Front. Neurol. 2017, 8, 479. [Google Scholar] [CrossRef]
- Tzvetanova, E. Serum Creatine Kinase Isoenzymes in Progressive MuscularDystrophy. Enzyme 1978, 23, 238–245. [Google Scholar] [CrossRef]
- Carlson, B.M. The Biology of Long-Term Denervated Skeletal Muscle. Eur. J. Transl. Myol. 2014, 24, 3293. [Google Scholar] [CrossRef]
- Lindberg, C.; Klintberg, L.; Oldfors, A. Raised Troponin T in Inclusion Body Myositis Is Common and Serum Levels Are Persistent over Time. Neuromuscul. Disord. 2006, 16, 495–497. [Google Scholar] [CrossRef] [PubMed]
- Tsung, S.H.; Huang, T.Y.; Lin, J.I. Case Report CK-MB Isoenzyme in Patients with Polymyositis. Am. J. Med. Sci. 1982, 283, 174–177. [Google Scholar] [CrossRef] [PubMed]
- de Carvalho, M.; Dengler, R.; Eisen, A.; England, J.D.; Kaji, R.; Kimura, J.; Mills, K.; Mitsumoto, H.; Nodera, H.; Shefner, J.; et al. Electrodiagnostic Criteria for Diagnosis of ALS. Clin. Neurophysiol. 2008, 119, 497–503. [Google Scholar] [CrossRef] [PubMed]
- Brooks, B.R.; Miller, R.G.; Swash, M.; Munsat, T.L. World Federation of Neurology Research Group on Motor Neuron Diseases. El Escorial Revisited: Revised Criteria for the Diagnosis of Amyotrophic Lateral Sclerosis. Amyotroph. Lateral Scler. Other Mot. Neuron Disord. 2000, 1, 293–299. [Google Scholar] [CrossRef]
- Jack, C.R.; Bennett, D.A.; Blennow, K.; Carrillo, M.C.; Dunn, B.; Haeberlein, S.B.; Holtzman, D.M.; Jagust, W.; Jessen, F.; Karlawish, J.; et al. NIA-AA Research Framework: Toward a Biological Definition of Alzheimer’s Disease. Alzheimer’s Dement. 2018, 14, 535–562. [Google Scholar] [CrossRef] [PubMed]


| ALS | |||||||
|---|---|---|---|---|---|---|---|
| Spinal-Onset | Bulbar-Onset | PLS | BFS | HD | AD | p-Value | |
| Number | 102 | 28 | 8 | 7 | 20 | 29 | |
| Sex F:M a | 33:69 | 15:13 | 8:0 | 1:6 | 11:9 | 18:11 | 0.0001 |
| Age, Years b | 64.2 (31.8–87.5) | 66.7 (45.5–81.0) | 59.9 (46.9–72.5) | 41.5 (27.8–53.1) | 54.4 (24.1–69.1) | 77.23 (34.6–87.0) | <0.0001 |
| Duration, years | 1.8 (0.3–11.2) | 1.3 (0.3–5.1) | 5.3 (0.5–25.2) | 0.4 (0.0–10.7) | NA | NA | 0.0119 |
| BMI (kg/m2) b | 24.1 (16.5–39.9) | 23.4 (16.1–27.4) | 24.6 (18.7–36.9) | 23.5 (20.9–35.9) | 27.9 (20.2–35.4) | NA | 0.2724 |
| ALSFRS-R b | 34 (10–46) | 32 (8–45) | 34 (24–39) | 48 | NA | NA | <0.0001 |
| CK (U/L) b | 194 (35.0–1050.0) | 128 (35.0–593.0) | 68.5 (29.0–150.0) | 92.0 (74.0–199.0) | 142.5 (39.0–1082) | 99.0 (30.0–393.0) | <0.0001 |
| Females | 137 (36.0–1010.0) | 93 (35.0–150.0) | 68.5 (29.0–150.0) | 84.0 | 117 (39.0–1082.0) | 91.5 (38.0–228.0) | 0.0832 |
| Males | 234 (35.0–1050.0) | 154 (55.0–593.0) | NA | 93.5 (74.0–199.0) | 168 (64.0–231.0) | 135 (30.0–393.0) | 0.0030 |
| CK-MB (ng/mL) b | 6.40 (1.20–71.90) | 4.25 (0.80–17.1) | 1.45 (0.90–4.80) | 2.20 (0.80–4.40) | 2.60 (1.00–10.20) | 3.00 (0.90–7.30) | <0.0001 |
| Females | 5.10 (1.90–23.70) | 3.80 (0.80–17.10) | 1.45 (0.90–4.80) | 2.80 | 2.40 (1.00–10.20) | 2.60 (0.90–6.00) | 0.0007 |
| Males | 7.60 (1.20–71.90) | 5.00 (1.50–14.00) | NA | 2.10 (0.80–4.40) | 3.00 (1.40–5.20) | 3.20 (0.90–7.30) | <0.0001 |
| Creatinine (mg/dL) | 0.70 (0.20–1.87) | 0.73 (0.48–0.16) | 0.73 (0.60–1.20) | 0.83 (0.60–1.20) | 0.92 (0.60–1.08) | NA | 0.0298 |
| cTnT (ng/L) | 21.20 (3.0–300.0) | 12.95 (3.0–77.90) | 3.00 (3.00–9.30) | 3.10 (3.00–6.90) | 4.20 (3.00–13.90) | 10.70 (3.00–30.0) | <0.0001 |
| pNfH in CSF (pg/mL) b |
2219 (n = 50) (336–101725) | 1959 (n = 12) (592.3–4205) | 2541 (n = 2) (1400–3681) | 90 (n = 7) (62.5–387) | 246 (n = 3) (130.2–690.0) | NA | 0.0002 |
 |  |  |  |  | ||||||||||||
|---|---|---|---|---|---|---|---|---|---|---|---|---|---|---|---|---|
| ALS vs. Control | ALS vs. PLC + BFS | Spinal-Onset vs. Control | Spinal-Onset vs. PLS + BFS | |||||||||||||
| CK | CK-MB | cTnT | cTnT + CK-MB | CK | CK-MB | cTnT | cTnT + CK-MB | CK | CK-MB | cTnT | cTnT + CK-MB | CK | CK-MB | cTnT | cTnT + CK-MB | |
| AUC | 0.70 | 0.83 | 0.84 | 0.86 | 0.80 | 0.90 | 0.93 | 0.94 | 0.73 | 0.86 | 0.87 | 0.90 | 0.84 | 0.93 | 0.95 | 0.96 |
| SD | 0.04 | 0.03 | 0.03 | 0.026 | 0.05 | 0.03 | 0.02 | 0.02 | 0.04 | 0.03 | 0.03 | 0.03 | 0.04 | 0.03 | 0.02 | 0.02 |
| 95% IC | 0.62–0.78 | 0.77–0.89 | 0.79–0.90 | 0.81–0.91 | 0.71–0.89 | 0.84–0.97 | 0.89–0.98 | 0.90–0.98 | 0.65–0.81 | 0.80–0.92 | 0.82–0.92 | 0.86–0.94 | 0.75–0.93 | 0.87–0.99 | 0.93–0.99 | 0.93–0.99 |
| p-value | <0.0001 | <0.0001 | <0.0001 | <0.0001 | 0.0001 | <0.0001 | <0.0001 | <0.0001 | <0.0001 | <0.0001 | <0.0001 | <0.0001 | <0.0001 | <0.0001 | <0.0001 | <0.0001 |
Disclaimer/Publisher’s Note: The statements, opinions and data contained in all publications are solely those of the individual author(s) and contributor(s) and not of MDPI and/or the editor(s). MDPI and/or the editor(s) disclaim responsibility for any injury to people or property resulting from any ideas, methods, instructions or products referred to in the content. |
© 2023 by the authors. Licensee MDPI, Basel, Switzerland. This article is an open access article distributed under the terms and conditions of the Creative Commons Attribution (CC BY) license (https://creativecommons.org/licenses/by/4.0/).
Share and Cite
Kittipeerapat, N.; Fabian, R.; Bernsen, S.; Weydt, P.; Castro-Gomez, S. Creatine Kinase MB Isoenzyme Is a Complementary Biomarker in Amyotrophic Lateral Sclerosis. Int. J. Mol. Sci. 2023, 24, 11682. https://doi.org/10.3390/ijms241411682
Kittipeerapat N, Fabian R, Bernsen S, Weydt P, Castro-Gomez S. Creatine Kinase MB Isoenzyme Is a Complementary Biomarker in Amyotrophic Lateral Sclerosis. International Journal of Molecular Sciences. 2023; 24(14):11682. https://doi.org/10.3390/ijms241411682
Chicago/Turabian StyleKittipeerapat, Natsinee, Rachel Fabian, Sarah Bernsen, Patrick Weydt, and Sergio Castro-Gomez. 2023. "Creatine Kinase MB Isoenzyme Is a Complementary Biomarker in Amyotrophic Lateral Sclerosis" International Journal of Molecular Sciences 24, no. 14: 11682. https://doi.org/10.3390/ijms241411682
APA StyleKittipeerapat, N., Fabian, R., Bernsen, S., Weydt, P., & Castro-Gomez, S. (2023). Creatine Kinase MB Isoenzyme Is a Complementary Biomarker in Amyotrophic Lateral Sclerosis. International Journal of Molecular Sciences, 24(14), 11682. https://doi.org/10.3390/ijms241411682