
Transition Networks Unveil Disorder-to-Order Transformations in Aβ Caused by Glycosaminoglycans or Lipids


Abstract
1. Introduction
2. Results and Discussion
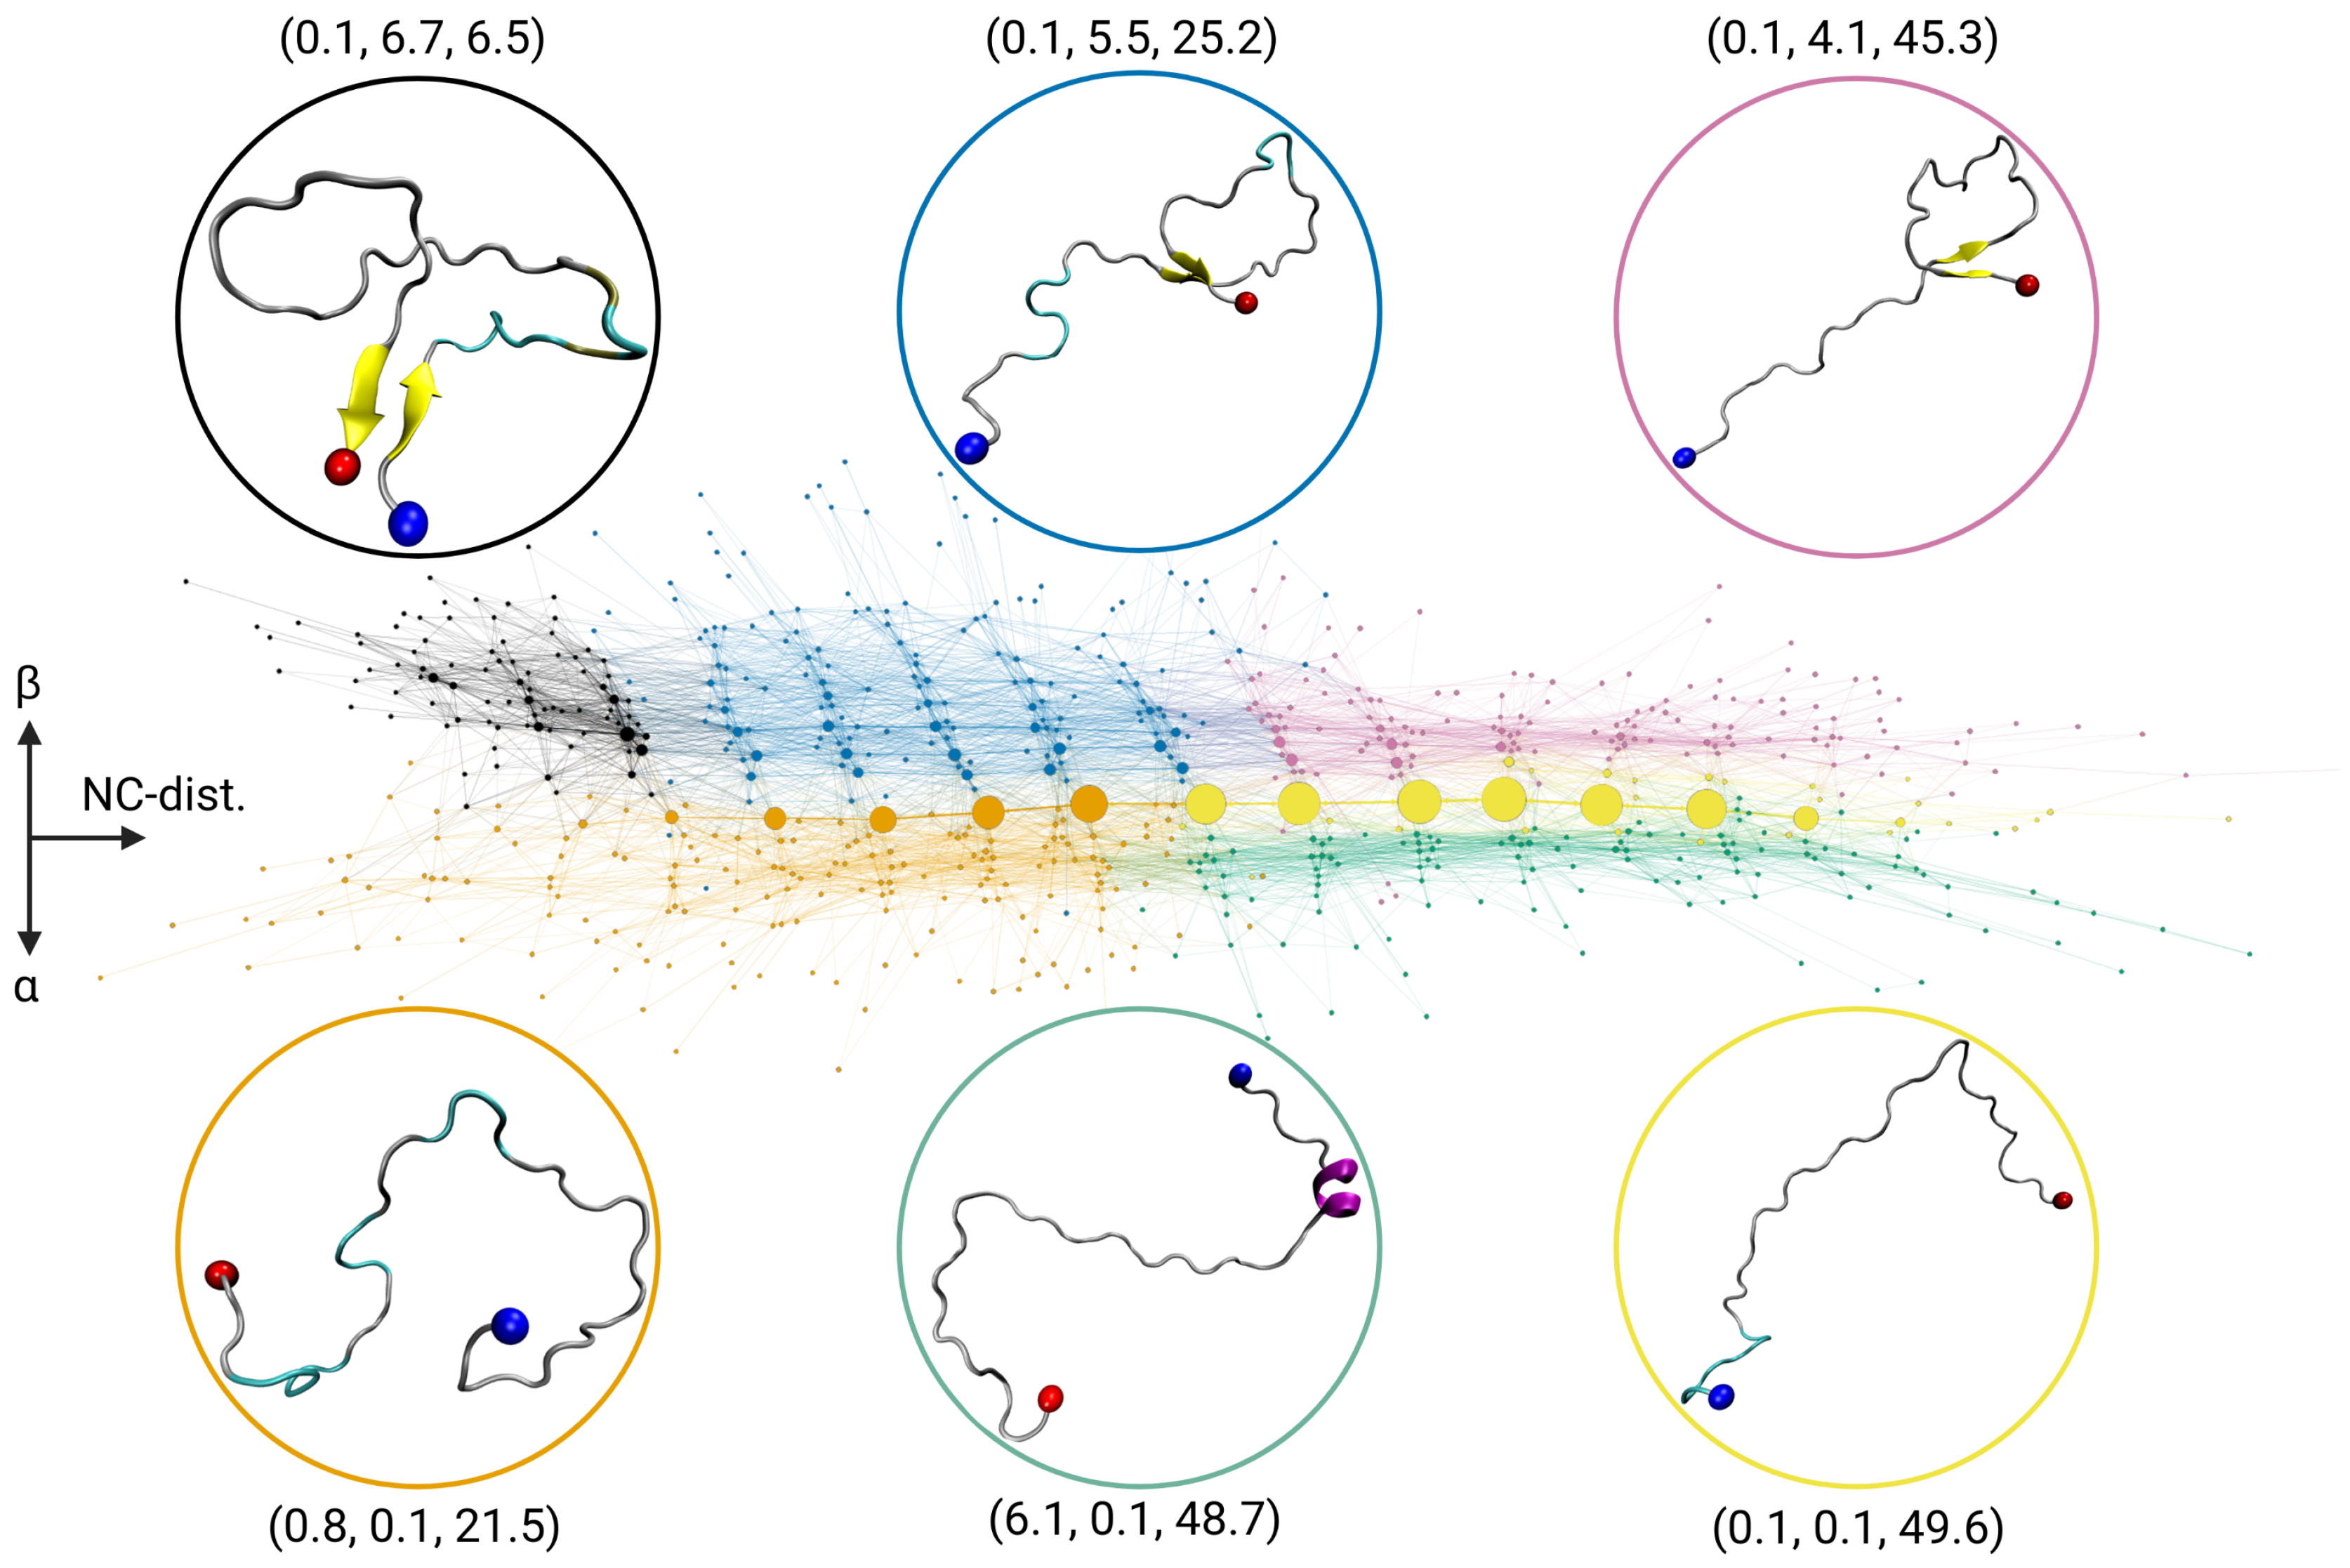
2.1. Transition Network of A in Solution
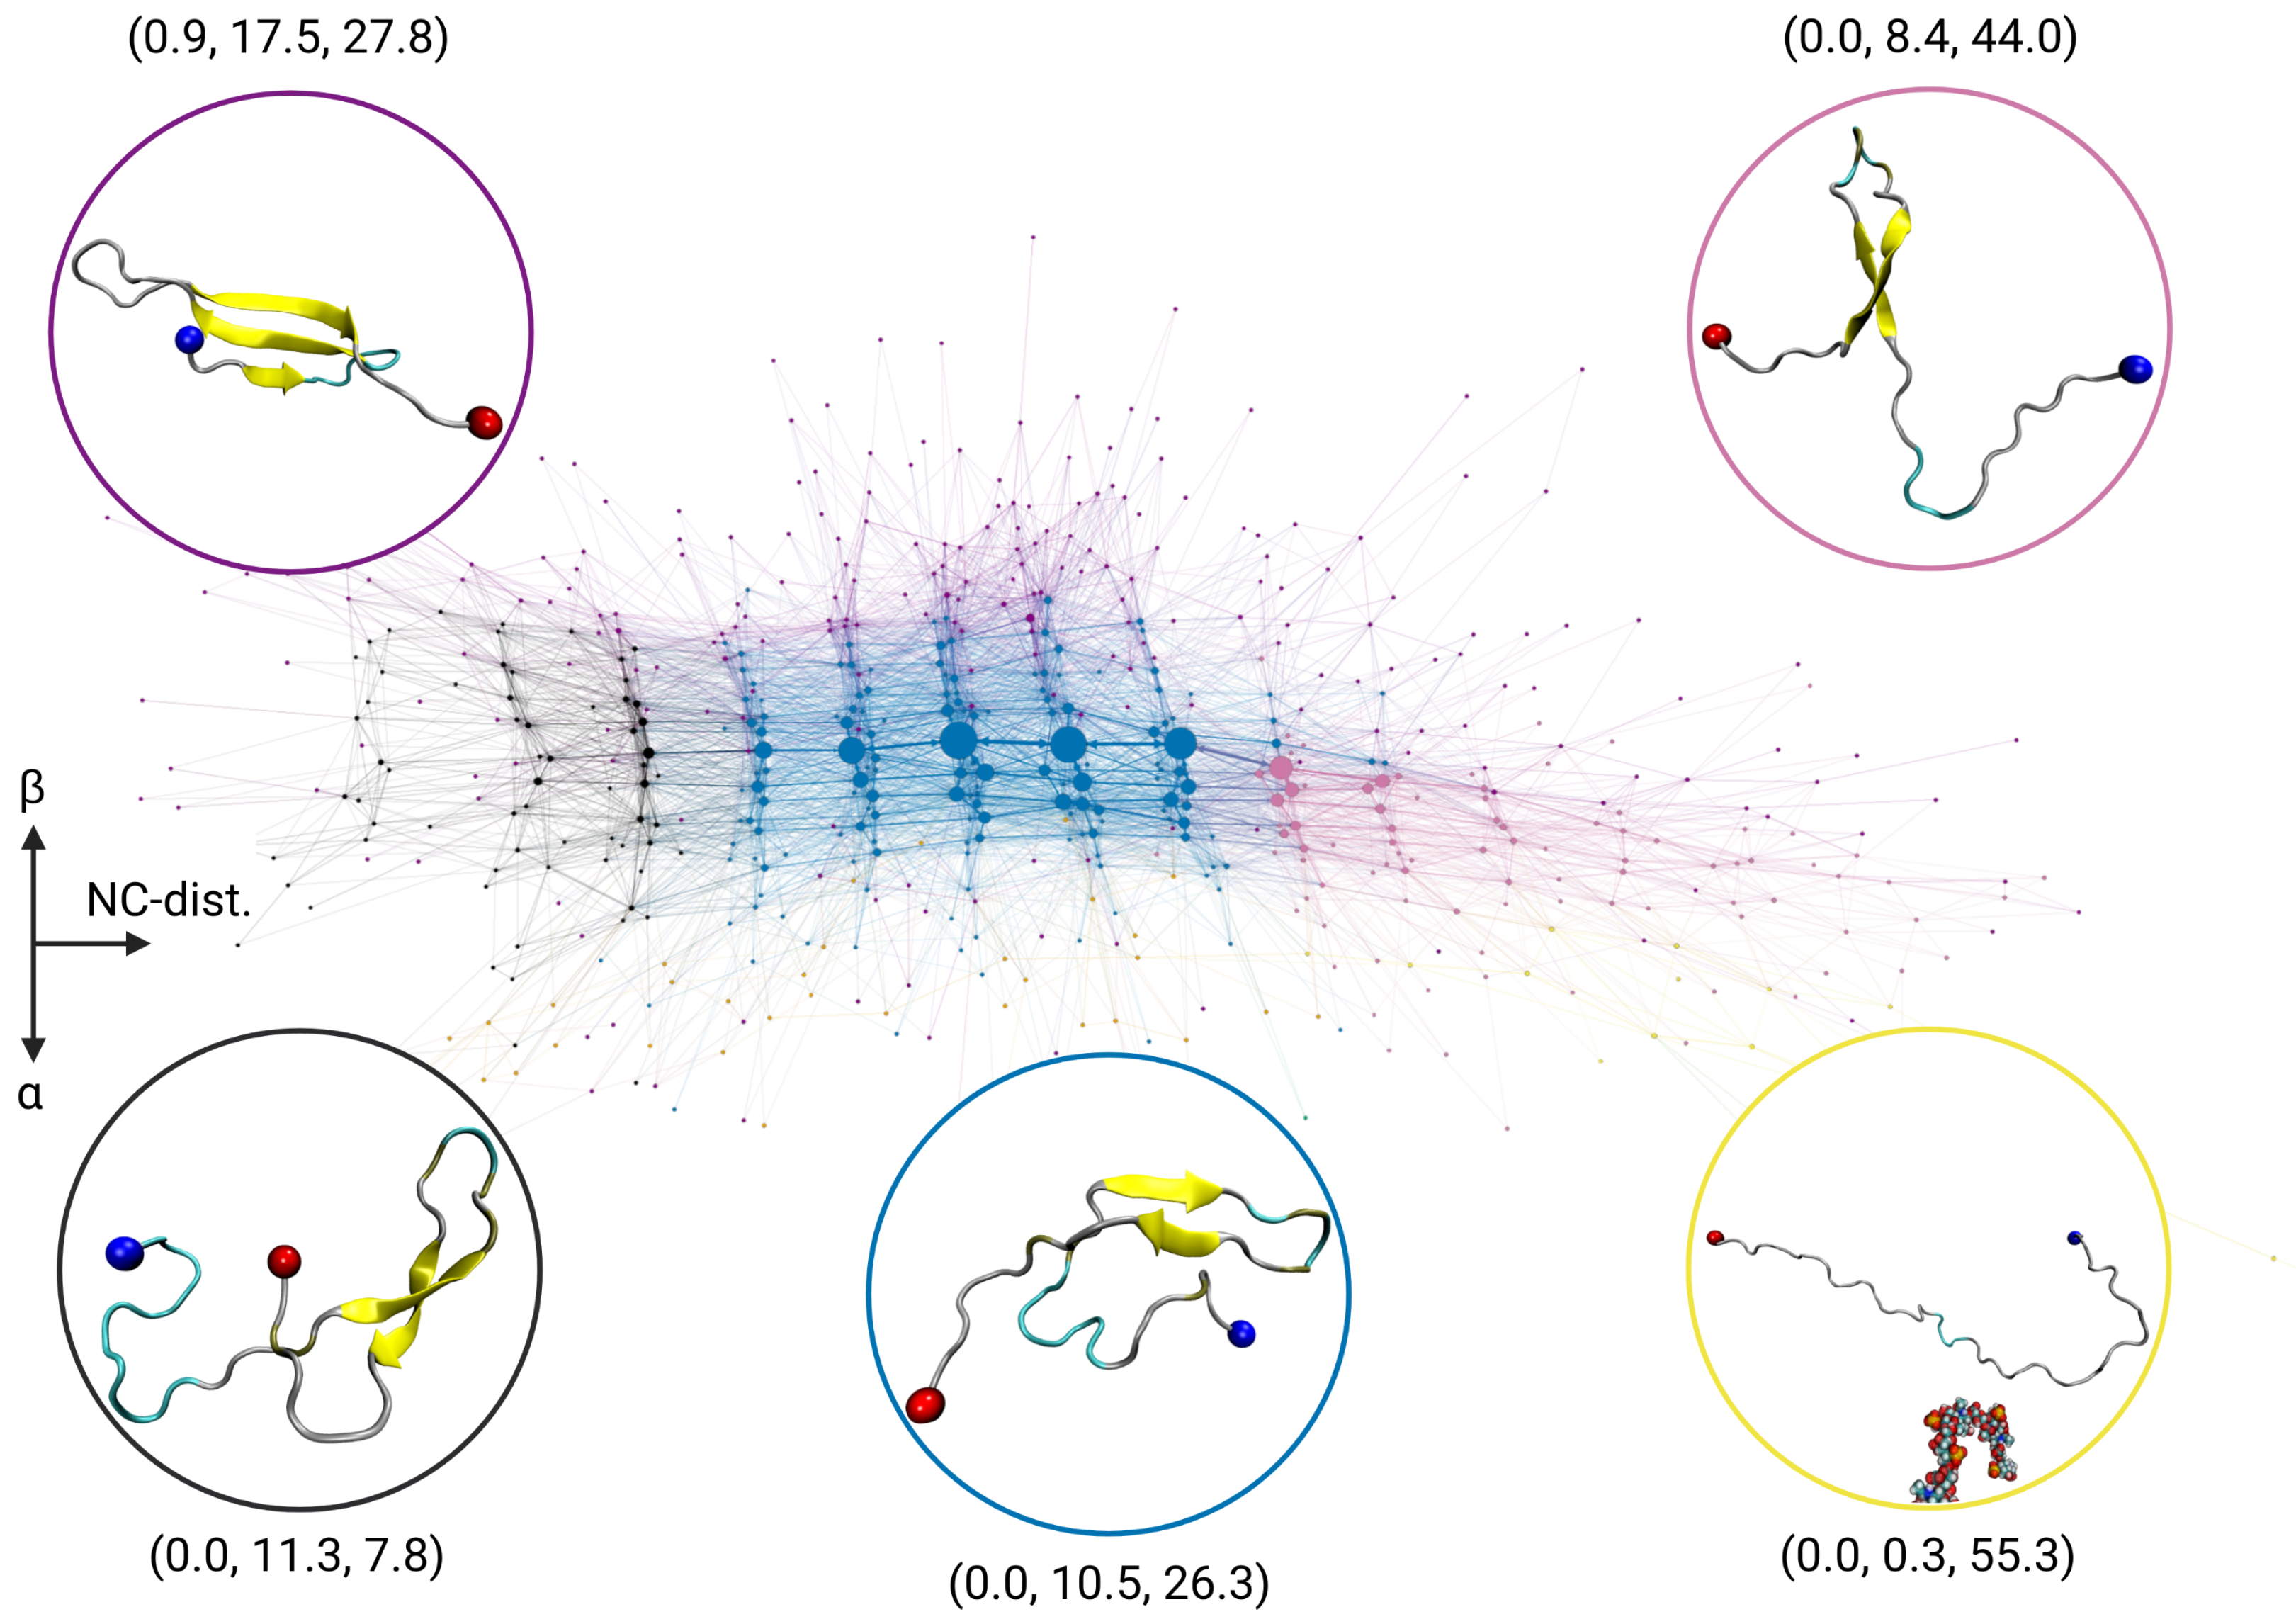
2.2. Transition Network of A in the Presence of a GAG Molecule
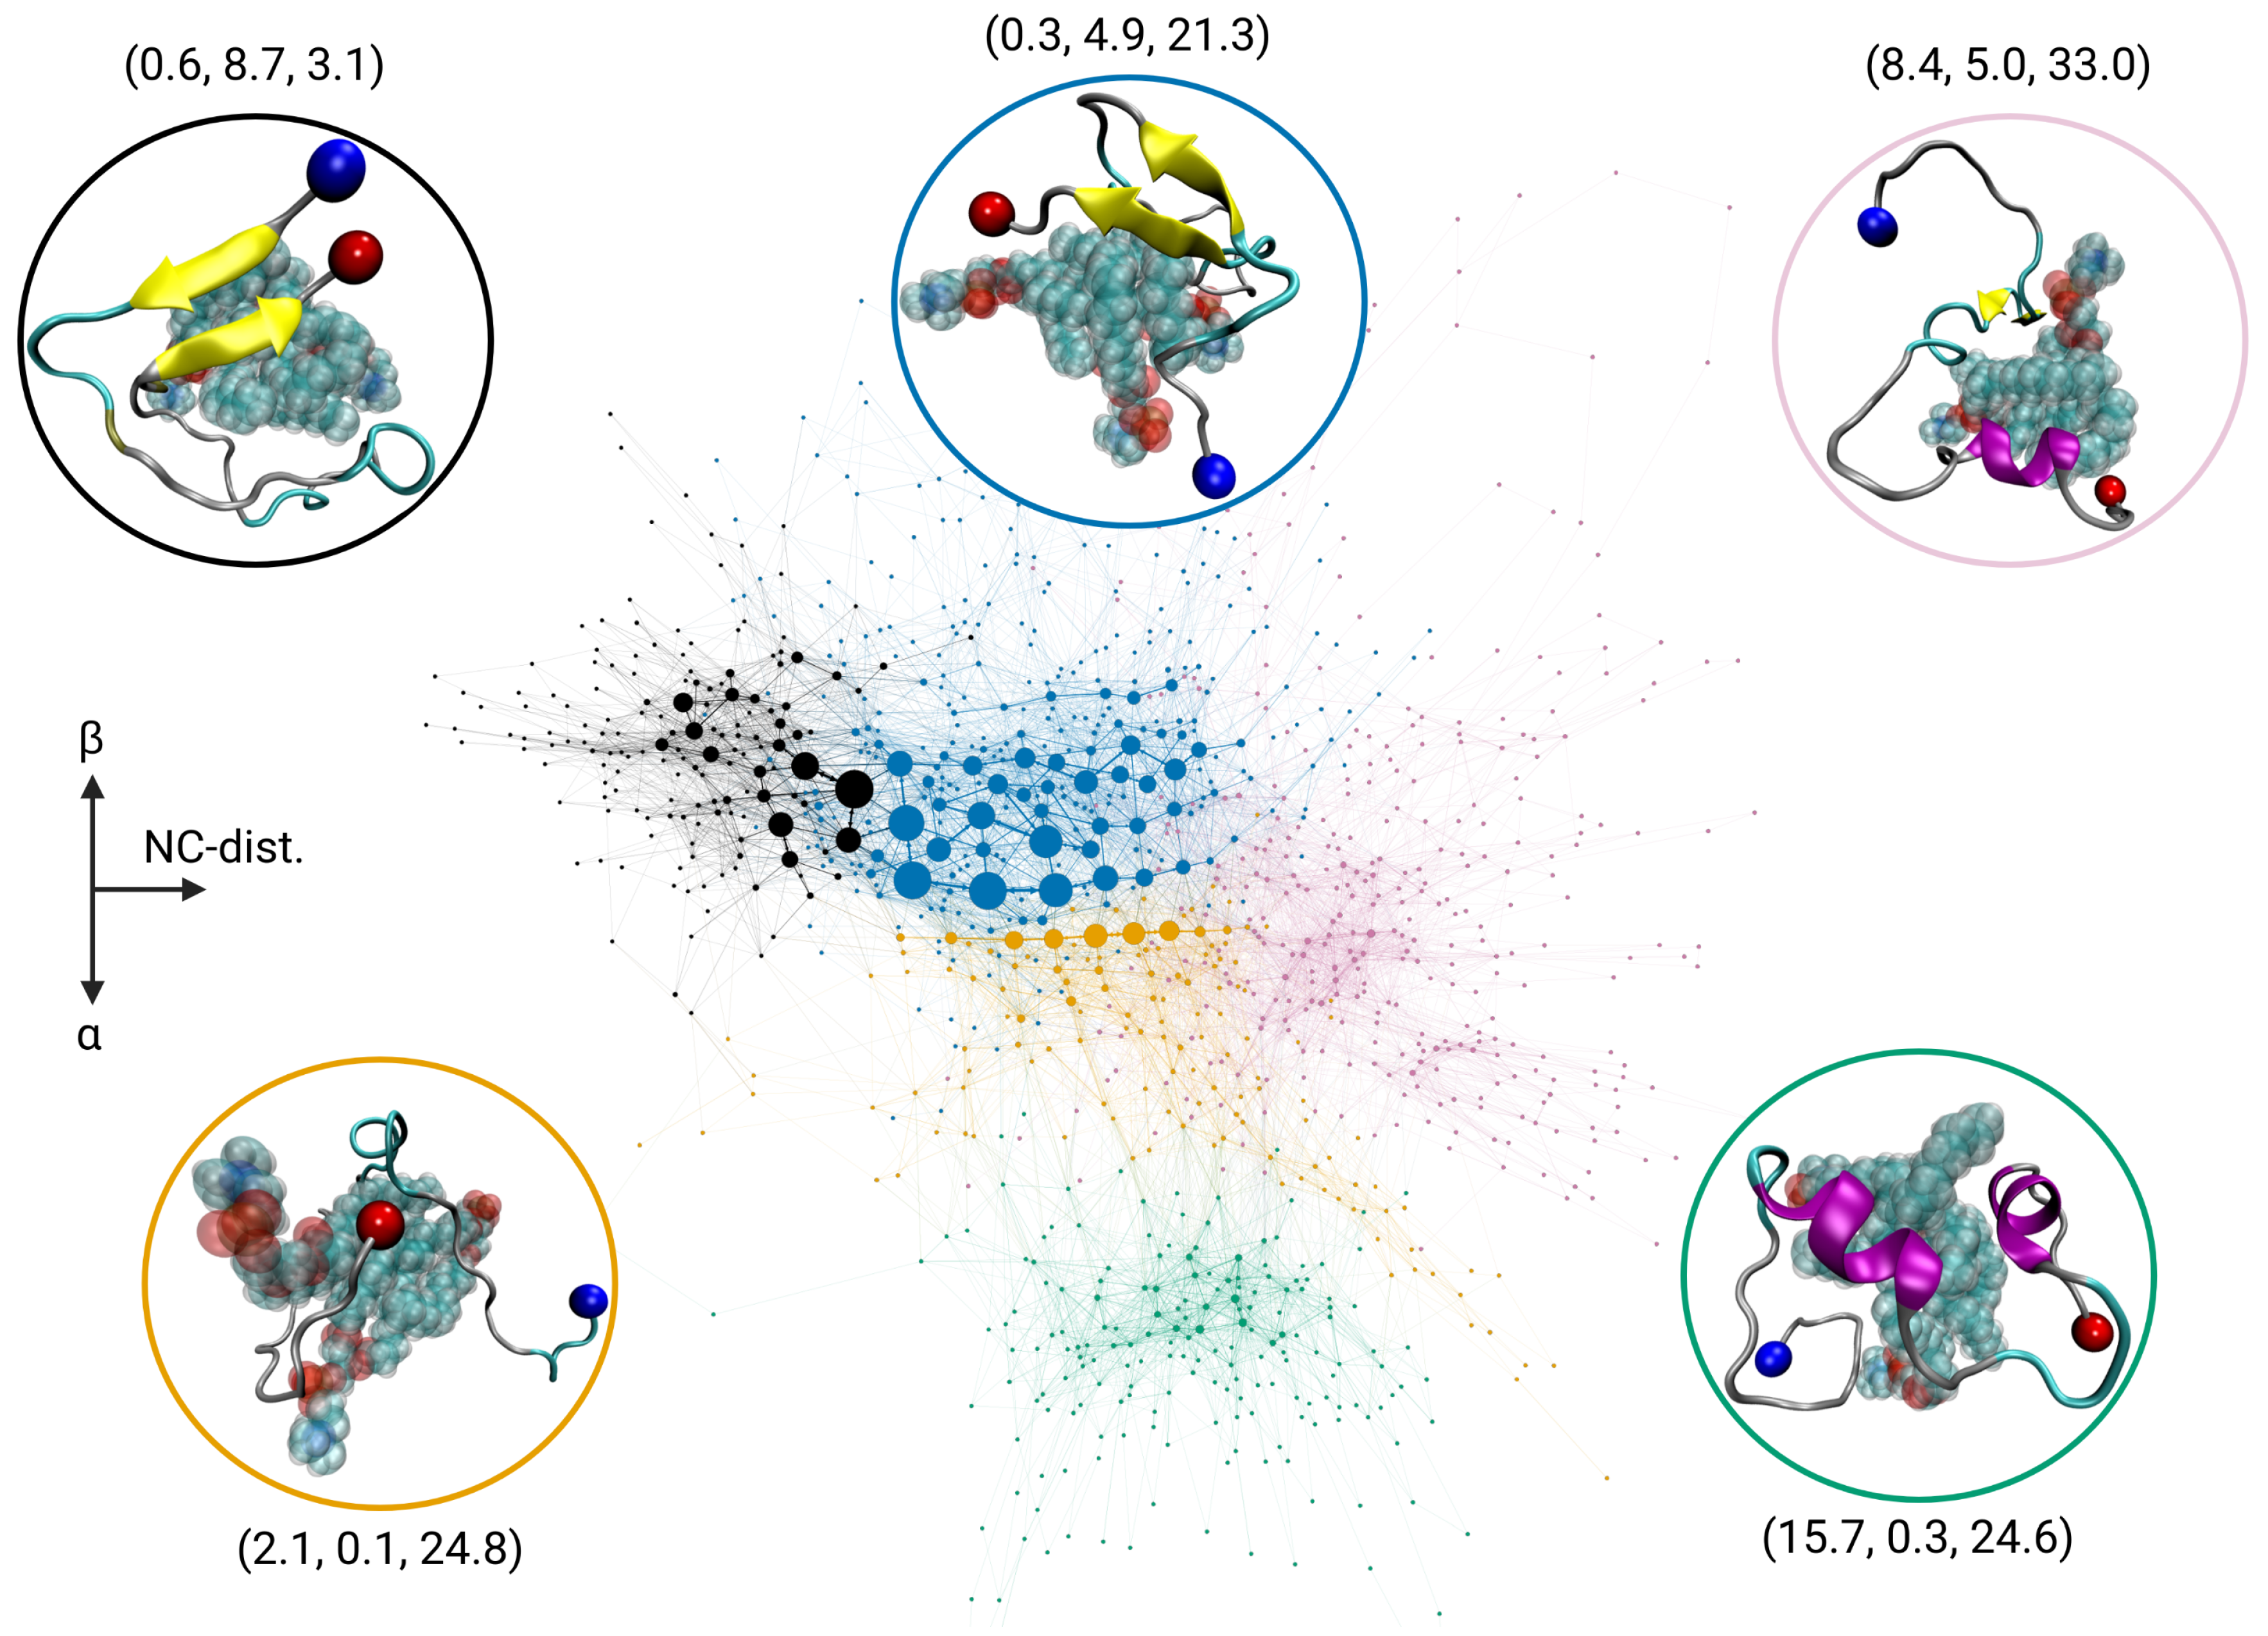
2.3. Transition Network of A Interacting with a POPC Cluster
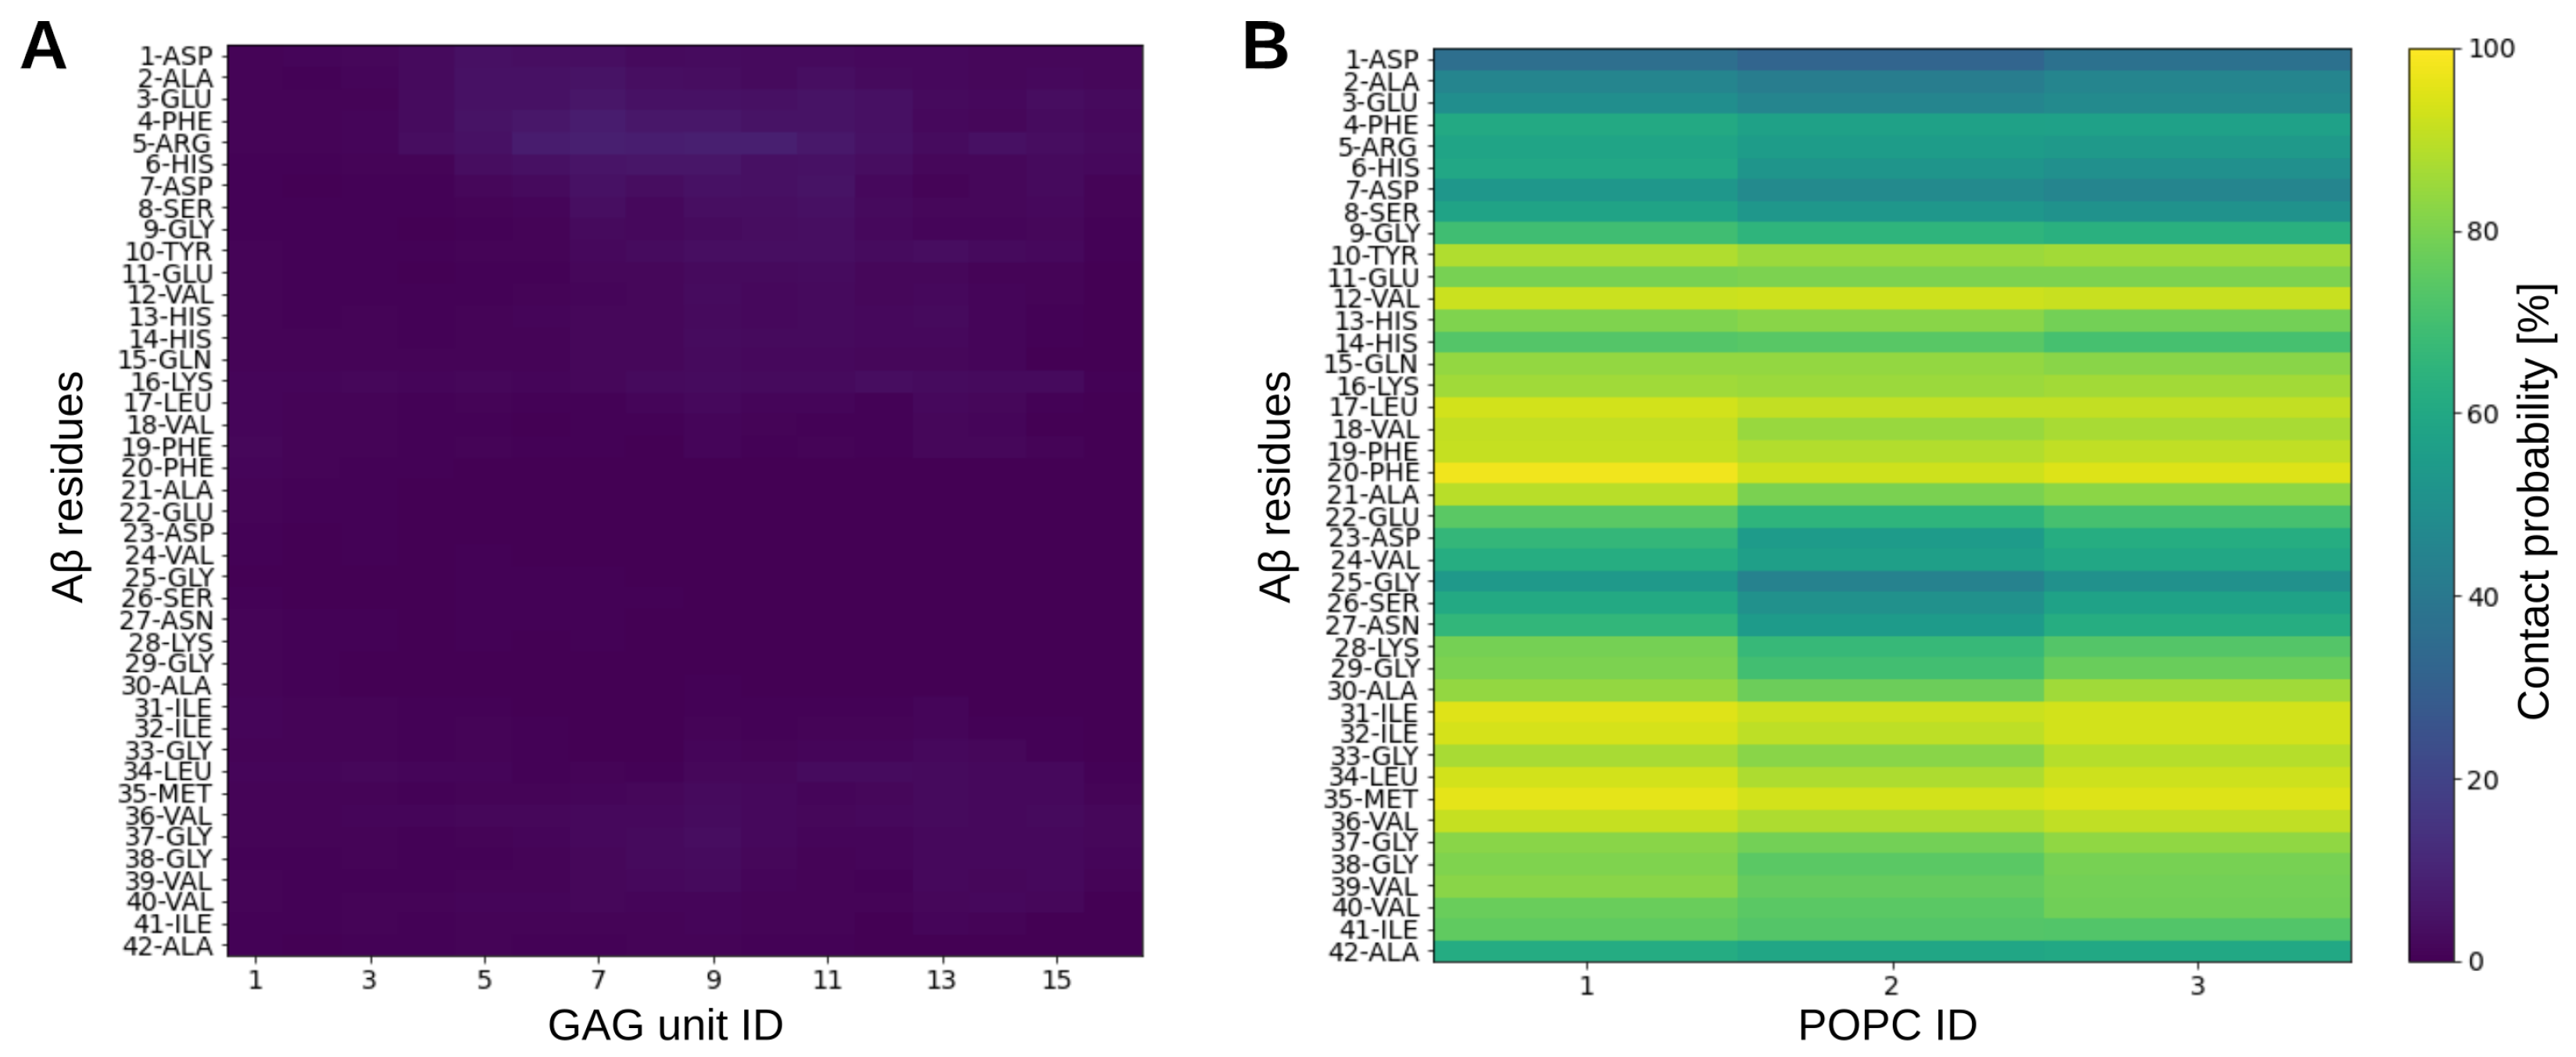
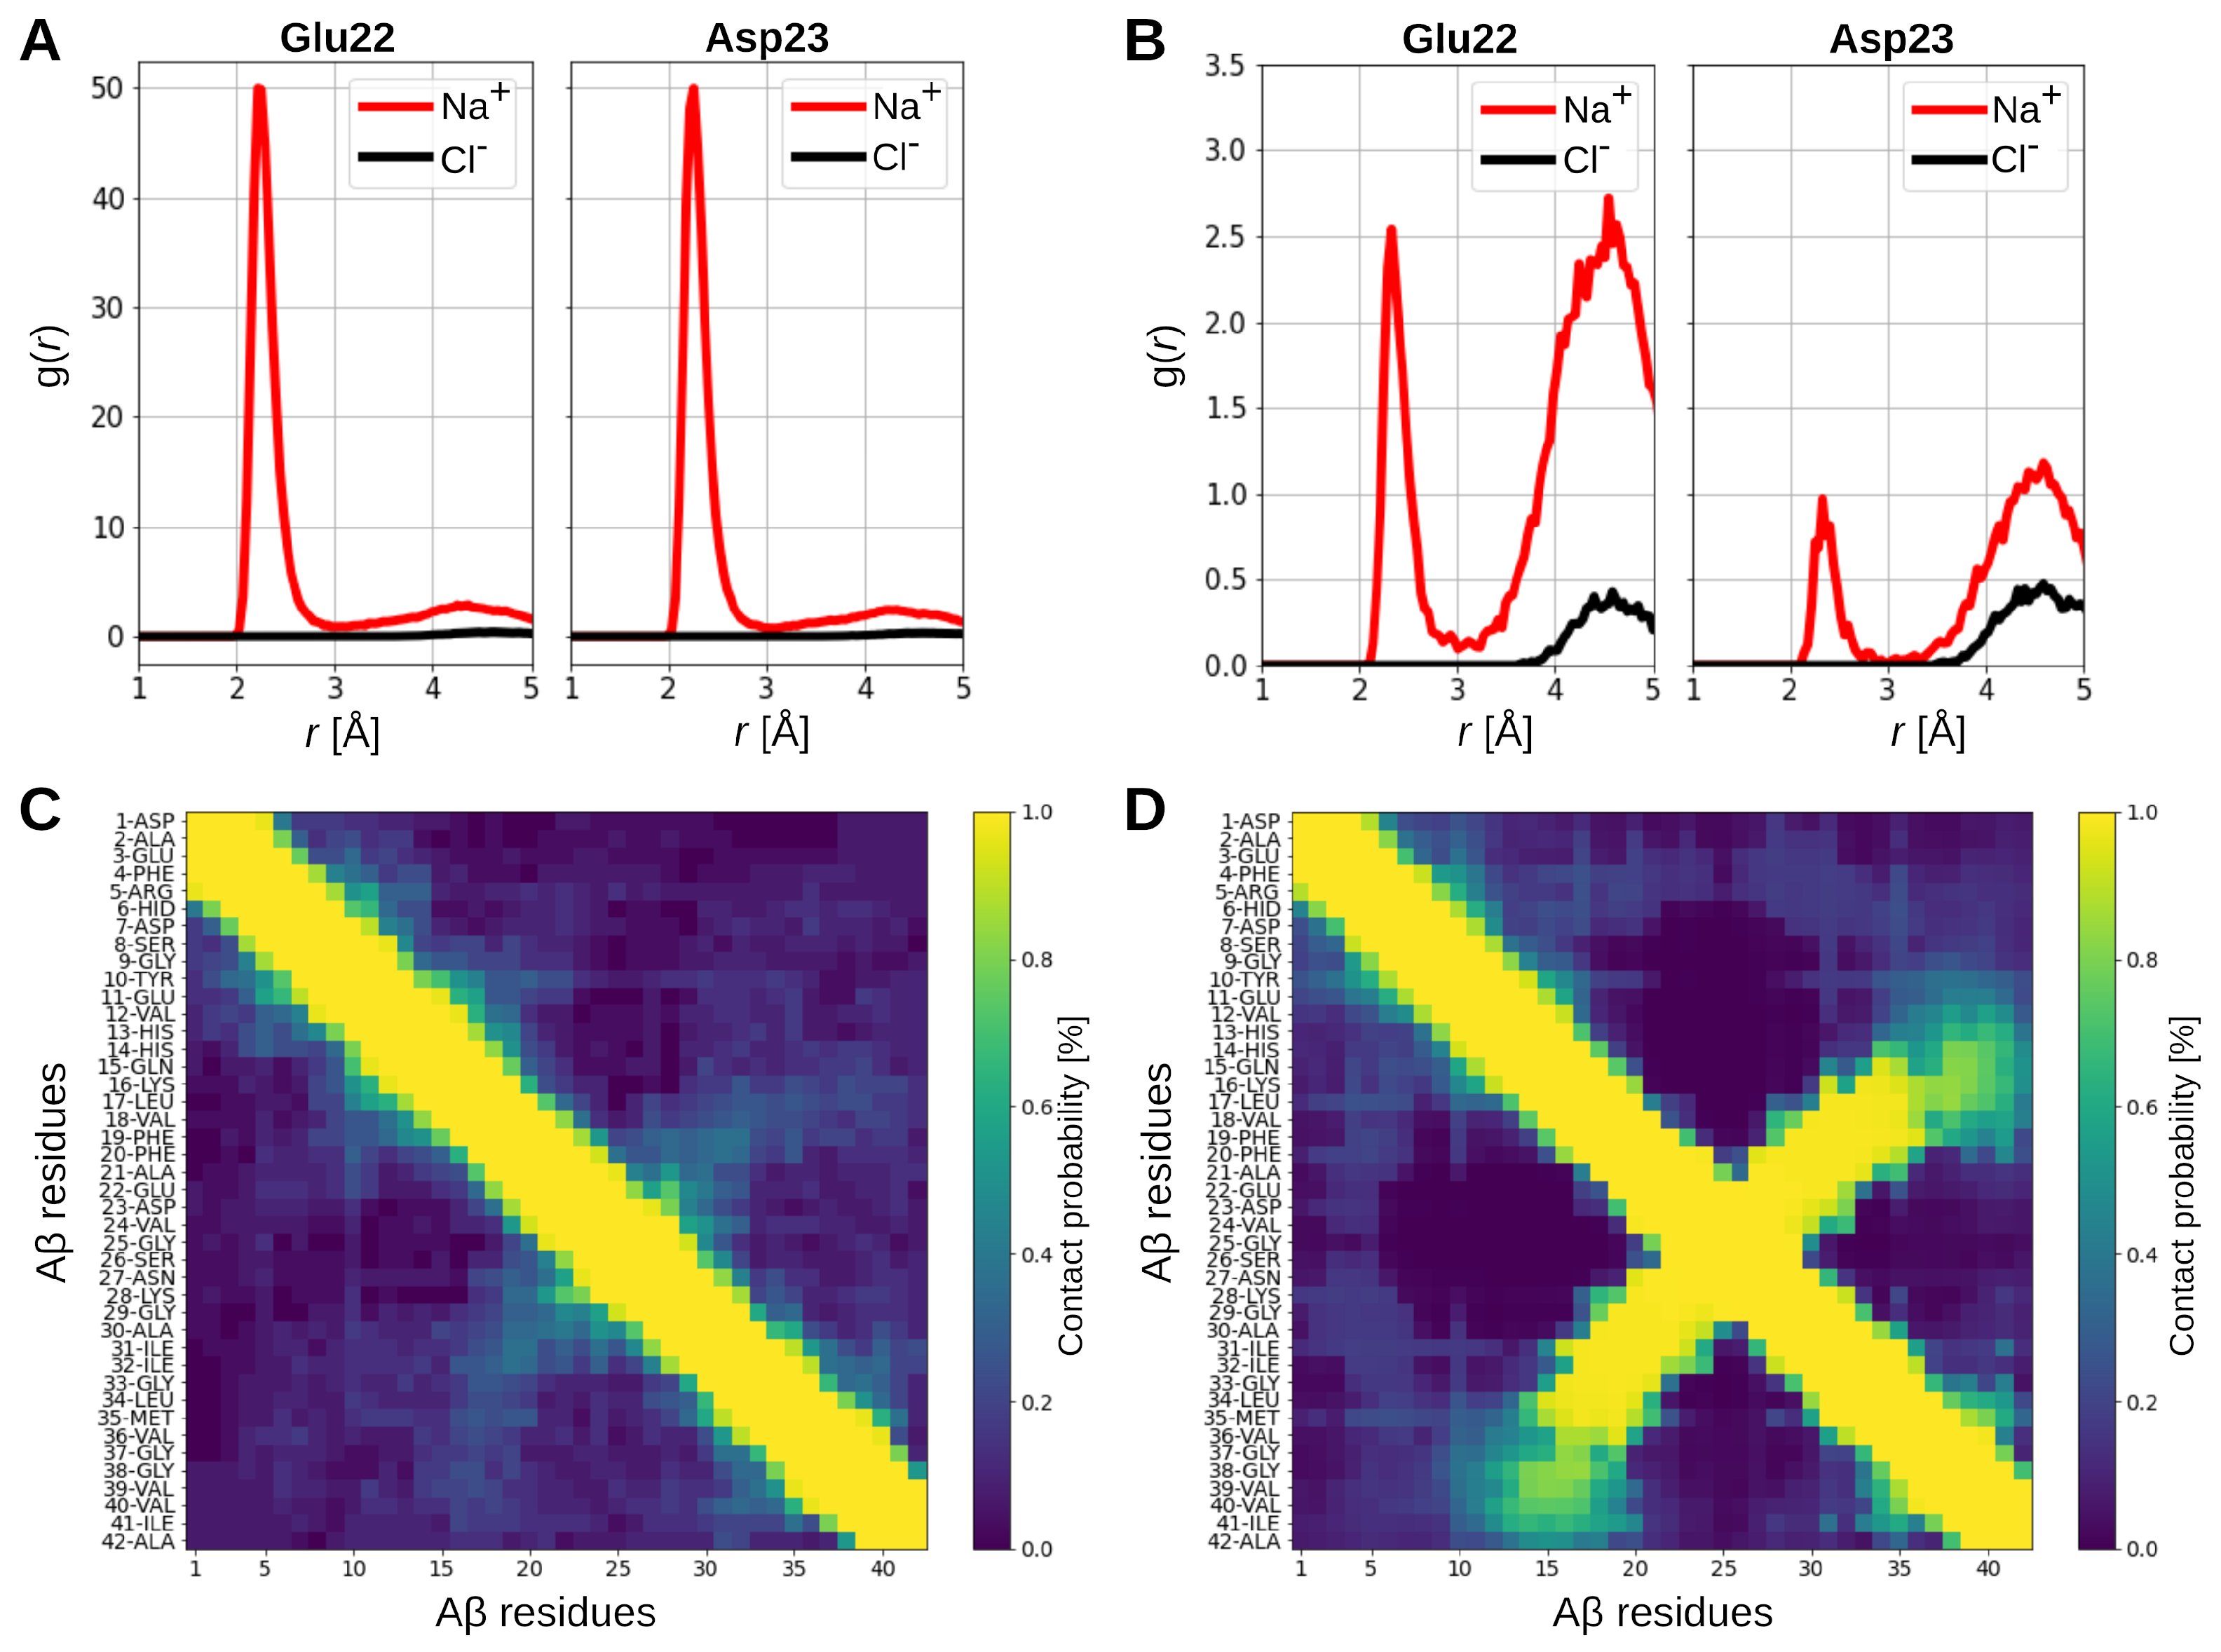
2.4. Interactions in the A-GAG System
2.5. Discussion
3. Materials and Methods
3.1. Molecular Dynamics Simulations
3.2. Transition Networks
3.3. Analysis of Water around the Solutes
4. Conclusions
Supplementary Materials
Author Contributions
Funding
Institutional Review Board Statement
Informed Consent Statement
Data Availability Statement
Acknowledgments
Conflicts of Interest
References
- Uversky, V.N.; Kulkarni, P. Intrinsically disordered proteins: Chronology of a discovery. Biophys. Chem. 2021, 279, 106694. [Google Scholar] [CrossRef]
- Perdigão, N.; Heinrich, J.; Stolte, C.; Sabir, K.; Buckley, M.; Tabor, B.; Signal, B.; Gloss, B.; Hammang, C.; Rost, B.; et al. Unexpected features of the dark proteome. Proc. Natl. Acad. Sci. USA 2015, 112, 15898–15903. [Google Scholar] [CrossRef] [PubMed]
- Hardy, J.A.; Higgins, G.A. Alzheimer’s Disease: The Amyloid Cascade Hypothesis. Science 1992, 256, 184–185. [Google Scholar] [CrossRef] [PubMed]
- Nguyen, P.H.; Ramamoorthy, A.; Sahoo, B.R.; Zheng, J.; Faller, P.; Straub, J.E.; Dominguez, L.; Shea, J.E.; Dokholyan, N.V.; De Simone, A.; et al. Amyloid Oligomers: A Joint Experimental/Computational Perspective on Alzheimer’s Disease, Parkinson’s Disease, Type II Diabetes, and Amyotrophic Lateral Sclerosis. Chem. Rev. 2021, 121, 2545–2647. [Google Scholar] [CrossRef]
- Fatafta, H.; Kav, B.; Bundschuh, B.F.; Loschwitz, J.; Strodel, B. Disorder-to-order transition of the amyloid-β peptide upon lipid binding. Biophys. Chem. 2022, 280, 106700. [Google Scholar] [CrossRef]
- Iannuzzi, C.; Irace, G.; Sirangelo, I. The Effect of Glycosaminoglycans (GAGs) on Amyloid Aggregation and Toxicity. Molecules 2015, 20, 2510–2528. [Google Scholar] [CrossRef]
- Snow, A.D.; Wight, T.N. Proteoglycans in the pathogenesis of Alzheimer’s disease and other amyloidoses. Neurobiol. Aging 1989, 10, 481–497. [Google Scholar] [CrossRef]
- Ancsin, J.B. Amyloidogenesis: Historical and modern observations point to heparan sulfate proteoglycans as a major culprit. Amyloid 2003, 10, 67–79. [Google Scholar] [CrossRef]
- Van Horssen, J.; Wesseling, P.; Van Den Heuvel, L.P.; De Waal, R.M.; Verbeek, M.M. Heparan sulphate proteoglycans in Alzheimer’s disease and amyloid-related disorders. Lancet Neurol. 2003, 2, 482–492. [Google Scholar] [CrossRef] [PubMed]
- Eliezer, D. Biophysical characterization of intrinsically disordered proteins. Curr. Opin. Struct. Biol. 2009, 19, 23–30. [Google Scholar] [CrossRef]
- Kragelund, B.B.; Skriver, K. Intrinsically Disordered Proteins: Methods and Protocols; Springer: New York, NY, USA, 2020. [Google Scholar]
- Löhr, T.; Kohlhoff, K.; Heller, G.; Camilloni, C.; Vendruscolo, M. A kinetic ensemble of the Alzheimer’s Aβ peptide. Nat. Comput. Sci. 2021, 1, 71–78. [Google Scholar] [CrossRef]
- Strodel, B. Energy Landscapes of Protein Aggregation and Conformation Switching in Intrinsically Disordered Proteins. J. Mol. Biol. 2021, 433, 167182. [Google Scholar] [CrossRef]
- Fatafta, H.; Samantray, S.; Sayyed-Ahmad, A.; Coskuner-Weber, O.; Strodel, B. Chapter Five—Molecular simulations of IDPs: From ensemble generation to IDP interactions leading to disorder-to-order transitions. In Dancing Protein Clouds: Intrinsically Disordered Proteins in the Norm and Pathology, Part C; Uversky, V.N., Ed.; Academic Press: Cambridge, MA, USA, 2021. [Google Scholar] [CrossRef]
- Paul, A.; Samantray, S.; Anteghini, M.; Khaled, M.; Strodel, B. Thermodynamics and kinetics of the amyloid-β peptide revealed by Markov state models based on MD data in agreement with experiment. Chem. Sci. 2021, 12, 6652–6669. [Google Scholar] [CrossRef]
- Chakraborty, D.; Straub, J.; Thirumalai, D. Energy landscapes of Aβ monomers are sculpted in accordance with Ostwald’s rule of stages. Sci. Adv. 2023, 9, eadd6921. [Google Scholar] [CrossRef]
- Rao, F.; Caflisch, A. The Protein Folding Network. J. Mol. Biol. 2004, 342, 299–306. [Google Scholar] [CrossRef]
- Barz, B.; Wales, D.J.; Strodel, B. A Kinetic Approach to the Sequence–Aggregation Relationship in Disease-Related Protein Assembly. J. Phys. Chem. B 2014, 118, 1003–1011. [Google Scholar] [CrossRef] [PubMed]
- Schäffler, M.; Khaled, M.; Strodel, B. ATRANET – Automated generation of transition networks for the structural characterization of intrinsically disordered proteins. Methods 2022, 206, 18–26. [Google Scholar] [CrossRef]
- Illig, A.M.; Strodel, B. Performance of Markov State Models and Transition Networks on Characterizing Amyloid Aggregation Pathways from MD Data. J. Chem. Theory Comput. 2020, 16, 7825–7839. [Google Scholar] [CrossRef]
- Roche, J.; Shen, Y.; Lee, J.H.; Ying, J.; Bax, A. Monomeric Aβ1–40 and β1–42 Peptides in Solution Adopt Very Similar Ramachandran Map Distributions That Closely Resemble Random Coil. Biochemistry 2016, 55, 762–775. [Google Scholar] [CrossRef] [PubMed]
- Joseph, P.; Sawant, K.; Iwahara, J.; Garofalo, R.; Desai, U.; Rajarathnam, K. Lysines and Arginines play non-redundant roles in mediating chemokine-glycosaminoglycan interactions. Sci. Rep. 2018, 8, 12289. [Google Scholar] [CrossRef] [PubMed]
- Samantray, S.; Olubiyi, O.O.; Strodel, B. The Influences of Sulphation, Salt Type, and Salt Concentration on the Structural Heterogeneity of Glycosaminoglycans. Int. J. Mol. Sci. 2021, 22, 11529. [Google Scholar] [CrossRef] [PubMed]
- Diaz-Nido, J.; Wandosell, F.; Avila, J. Glycosaminoglycans and β-amyloid, prion and tau peptides in neurodegenerative diseases. Peptides 2002, 23, 1323–1332. [Google Scholar] [CrossRef] [PubMed]
- Gruys, E.; Ultee, A.; Upragarin, N. Glycosaminoglycans are part of amyloid fibrils: Ultrastructural evidence in avian AA amyloid stained with cuprolinic blue and labeled with immunogold. Amyloid 2006, 13, 13–19. [Google Scholar] [CrossRef] [PubMed]
- Decker, Y.; Németh, E.; Schomburg, R.; Chemla, A.; Fülöp, L.; Menger, M.D.; Liu, Y.; Fassbender, K. Decreased pH in the aging brain and Alzheimer’s disease. Neurobiol. Aging 2021, 101, 40–49. [Google Scholar] [CrossRef]
- Olubiyi, O.O.; Strodel, B. Structures of the Amyloid β-Peptides Aβ1-40 and Aβ1–42 as Influenced by pH and a D-Peptide. J. Phys. Chem. B 2012, 116, 3280–3291. [Google Scholar] [CrossRef]
- Liao, Q.; Owen, M.C.; Bali, S.; Barz, B.; Strodel, B. Aβ under stress: The effects of acidosis, Cu2+-binding, and oxidation on amyloid β-peptide dimers. Chem. Commun. 2018, 54, 7766–7769. [Google Scholar] [CrossRef]
- Klement, K.; Wieligmann, K.; Meinhardt, J.; Hortschansky, P.; Richter, W.; Fändrich, M. Effect of Different Salt Ions on the Propensity of Aggregation and on the Structure of Alzheimer’s Aβ(1-40) Amyloid Fibrils. J. Mol. Biol. 2007, 373, 1321–1333. [Google Scholar] [CrossRef]
- Wang, H.; Wu, J.; Sternke, R.; Zheng, W.; Mörman, C.; Luo, J. Multivariate effects of pH, salt, and Zn ions on Aβ40 fibrillation. Commun. Chem. 2022, 5, 171. [Google Scholar] [CrossRef]
- Sanderson, J. The Association of Lipids with Amyloid Fibrils. J. Biol. Chem. 2022, 298, 102108. [Google Scholar] [CrossRef]
- Zhaliazka, K.; Matveyenka, M.; Kurouski, D. Lipids uniquely alter the secondary structure and toxicity of amyloid beta 1–42 aggregates. FEBS J. 2023, 290, 3203–3220. [Google Scholar] [CrossRef]
- Coles, M.; Bicknell, W.; Watson, A.A.; Fairlie, D.P.; Craik, D.J. Solution Structure of Amyloid β-Peptide(1–40) in a Water–Micelle Environment. Is the Membrane-Spanning Domain Where We Think It Is? Biochemistry 1998, 37, 11064–11077. [Google Scholar] [CrossRef] [PubMed]
- Shao, H.; Jao, S.; Ma, K.; Zagorski, M.G. Solution structures of micelle-bound amyloid beta-(1-40) and beta-(1-42) peptides of Alzheimer’s disease. J. Mol. Biol. 1999, 285, 755–773. [Google Scholar] [CrossRef]
- Jarvet, J.; Danielsson, J.; Damberg, P.; Oleszczuk, M.; Gräslund, A. Positioning of the Alzheimer Abeta(1-40) peptide in SDS micelles using NMR and paramagnetic probes. J. Biomol. NMR 2007, 39, 63–72. [Google Scholar] [CrossRef] [PubMed]
- La Rosa, C.; Scalisi, S.; Lolicato, F.; Pannuzzo, M.; Raudino, A. Lipid-assisted protein transport: A diffusion-reaction model supported by kinetic experiments and molecular dynamics simulations. J. Chem. Phys. 2016, 144, 184901. [Google Scholar] [CrossRef] [PubMed]
- Sciacca, M.F.; Lolicato, F.; Tempra, C.; Scollo, F.; Sahoo, B.R.; Watson, M.D.; García-Viñuales, S.; Milardi, D.; Raudino, A.; Lee, J.C.; et al. Lipid-Chaperone Hypothesis: A Common Molecular Mechanism of Membrane Disruption by Intrinsically Disordered Proteins. ACS Chem. Neurosci. 2020, 11, 4336–4350. [Google Scholar] [CrossRef]
- Abraham, M.J.; Murtola, T.; Schulz, R.; Páll, S.; Smith, J.C.; Hess, B.; Lindahl, E. GROMACS: High performance molecular simulations through multi-level parallelism from laptops to supercomputers. SoftwareX 2015, 1, 19–25. [Google Scholar] [CrossRef]
- Huang, J.; Rauscher, S.; Nawrocki, G.; Ting, R.; Feig, M.; de Groot, B.; Grubmüller, H.; MacKerell, A. CHARMM36m: An Improved Force Field for Folded and Intrinsically Disordered Proteins. Nat. Methods 2017, 14, 71–73. [Google Scholar] [CrossRef]
- Samantray, S.; Yin, F.; Kav, B.; Strodel, B. Different force fields give rise to different amyloid aggregation pathways in molecular dynamics simulations. J. Chem. Inf. Model. 2021, 60, 6462–6475. [Google Scholar] [CrossRef]
- Pastor, R.W.; MacKerell, A.D. Development of the CHARMM Force Field for Lipids. J. Phys. Chem. Lett. 2011, 2, 1526–1532. [Google Scholar] [CrossRef]
- Jo, S.; Song, K.C.; Desaire, H.; MacKerell, A.D.; Im, W. Glycan reader: Automated sugar identification and simulation preparation for carbohydrates and glycoproteins. J. Comput. Chem. 2011, 32, 3135–3141. [Google Scholar] [CrossRef]
- Park, S.J.; Lee, J.; Patel, D.S.; Ma, H.; Lee, H.S.; Jo, S.; Im, W. Glycan Reader is improved to recognize most sugar types and chemical modifications in the Protein Data Bank. Bioinformatics 2017, 33, 3051–3057. [Google Scholar] [CrossRef]
- Park, S.J.; Lee, J.; Qi, Y.; Kern, N.R.; Lee, H.S.; Jo, S.; Joung, I.; Joo, K.; Lee, J.; Im, W. CHARMM-GUI Glycan Modeler for modeling and simulation of carbohydrates and glycoconjugates. Glycobiology 2019, 29, 320–331. [Google Scholar] [CrossRef] [PubMed]
- Jo, S.; Kim, T.; Iyer, V.G.; Im, W. CHARMM-GUI: A web-based graphical user interface for CHARMM. J. Comput. Chem. 2008, 29, 1859–1865. [Google Scholar] [CrossRef]
- Samantray, S.; Strodel, B. The Effects of Different Glycosaminoglycans on the Structure and Aggregation of the Amyloid-β (16–22) Peptide. J. Phys. Chem. B 2021, 125, 5511–5525. [Google Scholar] [CrossRef]
- Jorgensen, W.L.; Chandrasekhar, J.; Madura, J.D.; Impey, R.W.; Klein, M.L. Comparison of simple potential functions for simulating liquid water. J. Chem. Phys. 1983, 79, 926–935. [Google Scholar] [CrossRef]
- Parrinello, M.; Rahman, A. Polymorphic Transitions in Single-Crystals—A New Molecular-Dynamics Method. Mol. Phys. 1981, 52, 7182–7190. [Google Scholar] [CrossRef]
- Nosé, S. Molecular-Dynamics Method for Simulations in the Canonical Ensemble. Mol. Phys. 1984, 52, 255–268. [Google Scholar] [CrossRef]
- Hoover, W.G. Canonical Dynamics—Equilibrium Phase-Space Distributions. Phys. Rev. A 1985, 31, 1695–1697. [Google Scholar] [CrossRef] [PubMed]
- Bussi, G.; Donadio, D.; Parrinello, M. Canonical sampling through velocity rescaling. J. Chem. Phys. 2007, 126, 014101. [Google Scholar] [CrossRef]
- Darden, T.; York, D.; Pedersen, L. Particle mesh Ewald: An N·log(N) method for Ewald sums in large systems. J. Chem. Phys. 1993, 98, 10089–10092. [Google Scholar] [CrossRef]
- Krause, D.; Thörnig, P. JURECA: Modular supercomputer at Jülich Supercomputing Centre. J. Large-Scale Res. Facil. JLSRF 2018, 4, A132. [Google Scholar] [CrossRef]
- Bastian, M.; Heymann, S.; Jacomy, M. Gephi: An Open Source Software for Exploring and Manipulating Networks. In Proceedings of the Third International AAAI Conference on Weblogs and Social Media, San Jose, CA, USA, 17–20 May 2009. [Google Scholar]
- Blondel, V.D.; Guillaume, J.L.; Lambiotte, R.; Lefebvre, E. Fast unfolding of communities in large networks. J. Stat. Mech. Theory Exp. 2008, 2008, P10008. [Google Scholar] [CrossRef]
- Chebaro, Y.; Ballard, A.J.; Chakraborty, D.; Wales, D.J. Intrinsically Disordered Energy Landscapes. Sci. Rep. 2015, 5, 10386. [Google Scholar] [CrossRef]
- Giovambattista, N.; Debenedetti, P.G.; Sciortino, F.; Stanley, H.E. Structural order in glassy water. Phys. Rev. E 2005, 71, 061505. [Google Scholar] [CrossRef] [PubMed]


| Molecule | T | Q | /[ps] | |
|---|---|---|---|---|
| A-only | 0.37 | 0.44 | 0.555 | 16.45 |
| A in A-GAG | 0.34 | 0.44 | 0.565 | 14.54 |
| GAG in A-GAG | 0.34 | 0.38 | 0.499 | 15.39 |
Disclaimer/Publisher’s Note: The statements, opinions and data contained in all publications are solely those of the individual author(s) and contributor(s) and not of MDPI and/or the editor(s). MDPI and/or the editor(s) disclaim responsibility for any injury to people or property resulting from any ideas, methods, instructions or products referred to in the content. |
© 2023 by the authors. Licensee MDPI, Basel, Switzerland. This article is an open access article distributed under the terms and conditions of the Creative Commons Attribution (CC BY) license (https://creativecommons.org/licenses/by/4.0/).
Share and Cite
Schäffler, M.; Samantray, S.; Strodel, B. Transition Networks Unveil Disorder-to-Order Transformations in Aβ Caused by Glycosaminoglycans or Lipids. Int. J. Mol. Sci. 2023, 24, 11238. https://doi.org/10.3390/ijms241411238
Schäffler M, Samantray S, Strodel B. Transition Networks Unveil Disorder-to-Order Transformations in Aβ Caused by Glycosaminoglycans or Lipids. International Journal of Molecular Sciences. 2023; 24(14):11238. https://doi.org/10.3390/ijms241411238
Chicago/Turabian StyleSchäffler, Moritz, Suman Samantray, and Birgit Strodel. 2023. "Transition Networks Unveil Disorder-to-Order Transformations in Aβ Caused by Glycosaminoglycans or Lipids" International Journal of Molecular Sciences 24, no. 14: 11238. https://doi.org/10.3390/ijms241411238
APA StyleSchäffler, M., Samantray, S., & Strodel, B. (2023). Transition Networks Unveil Disorder-to-Order Transformations in Aβ Caused by Glycosaminoglycans or Lipids. International Journal of Molecular Sciences, 24(14), 11238. https://doi.org/10.3390/ijms241411238