
ATO Increases ROS Production and Apoptosis of Cells by Enhancing Calpain-Mediated Degradation of the Cancer Survival Protein TG2


 , and
, and 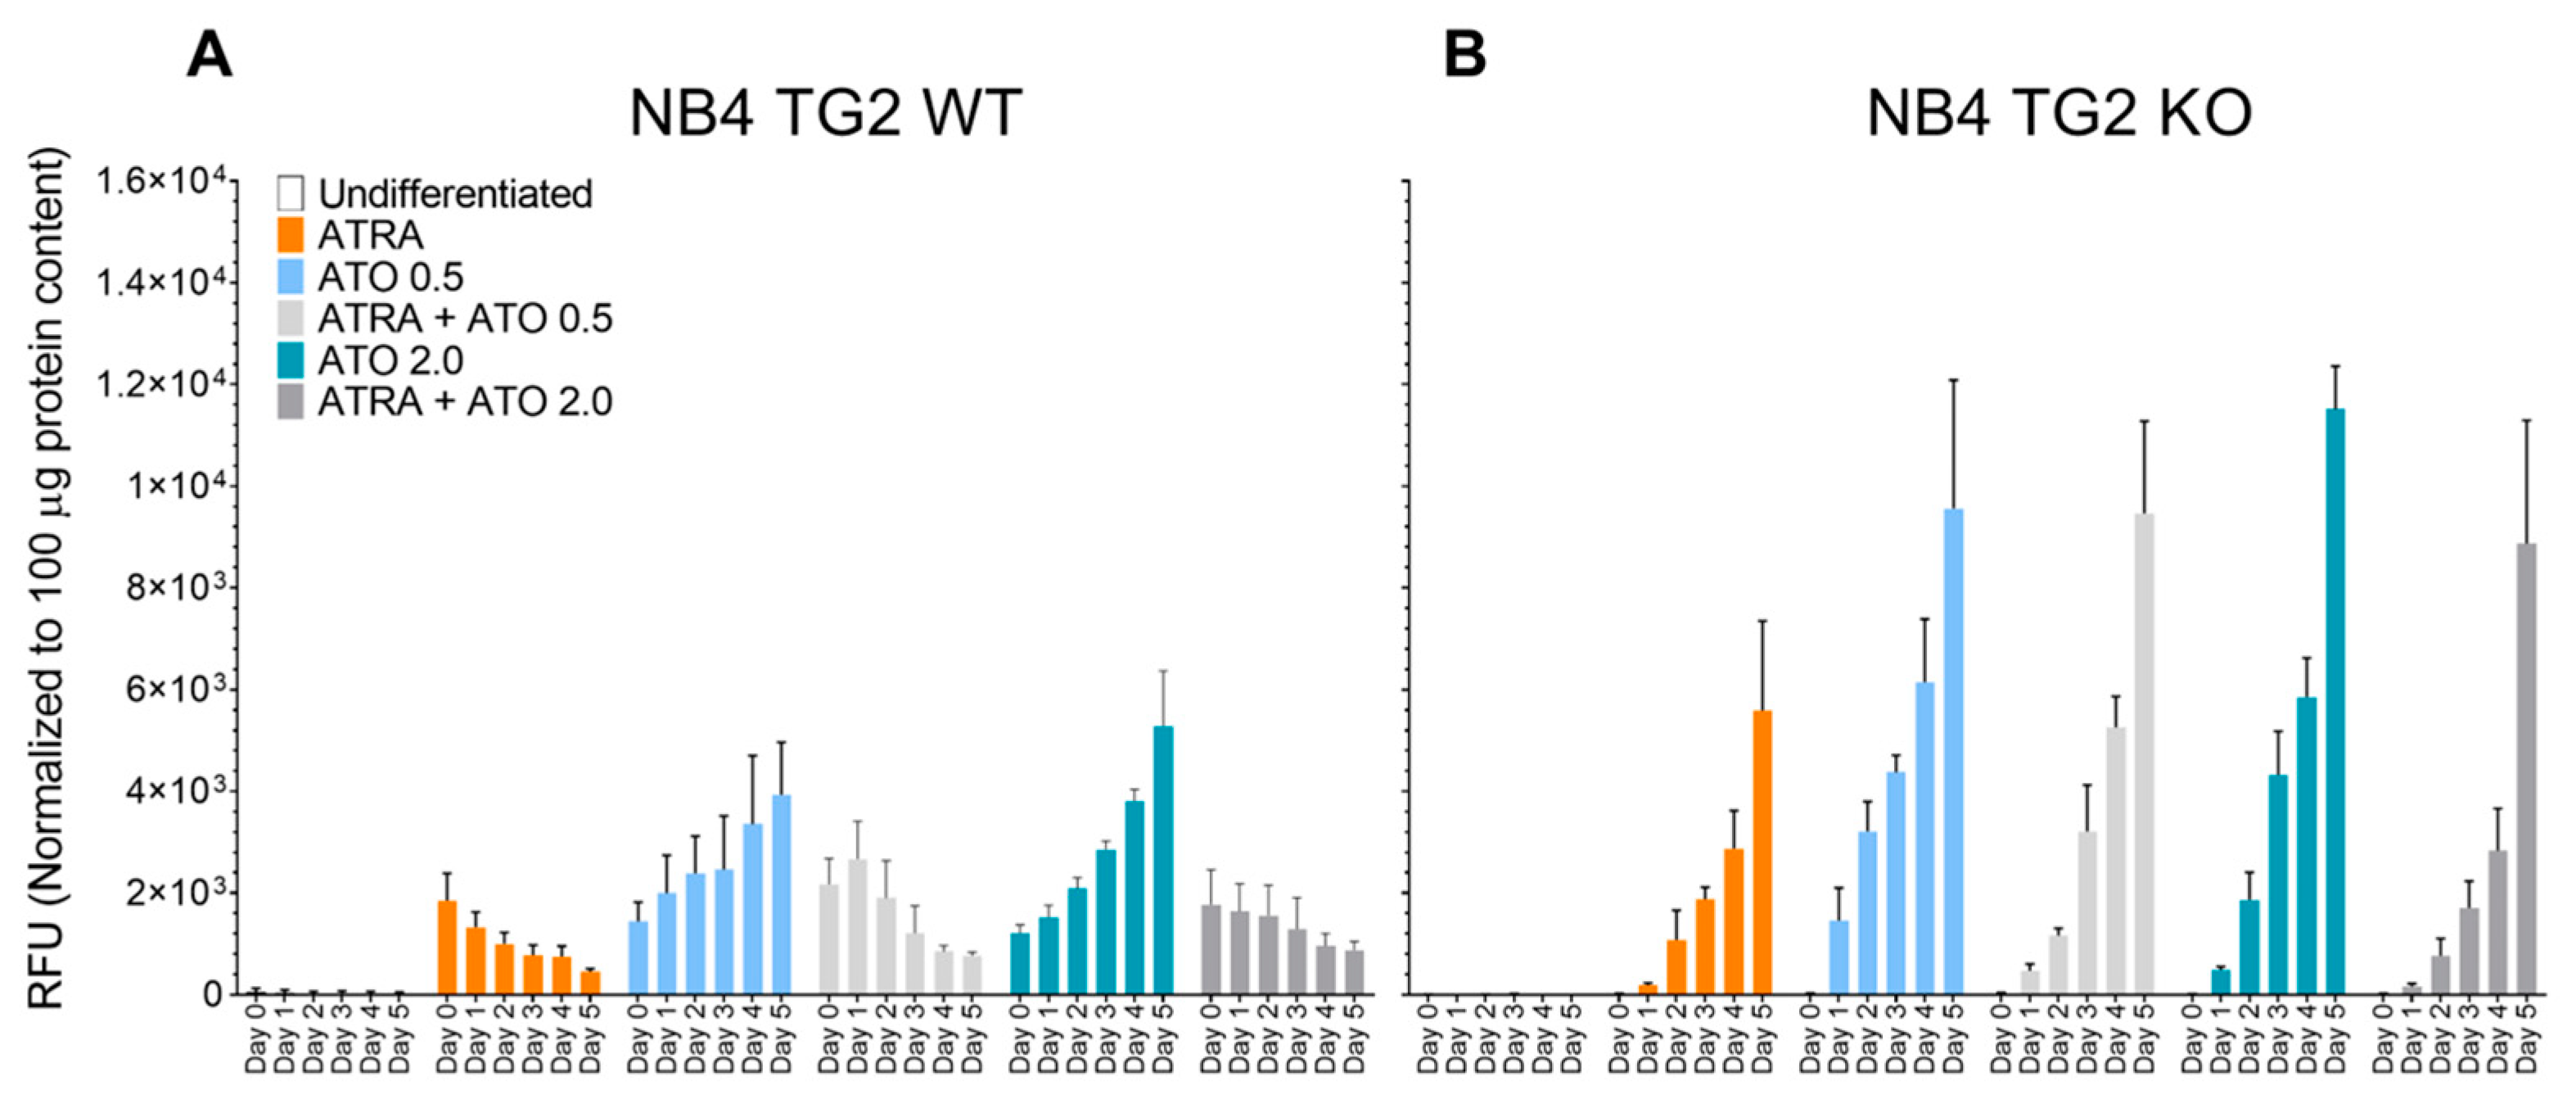
Abstract
1. Introduction
2. Results
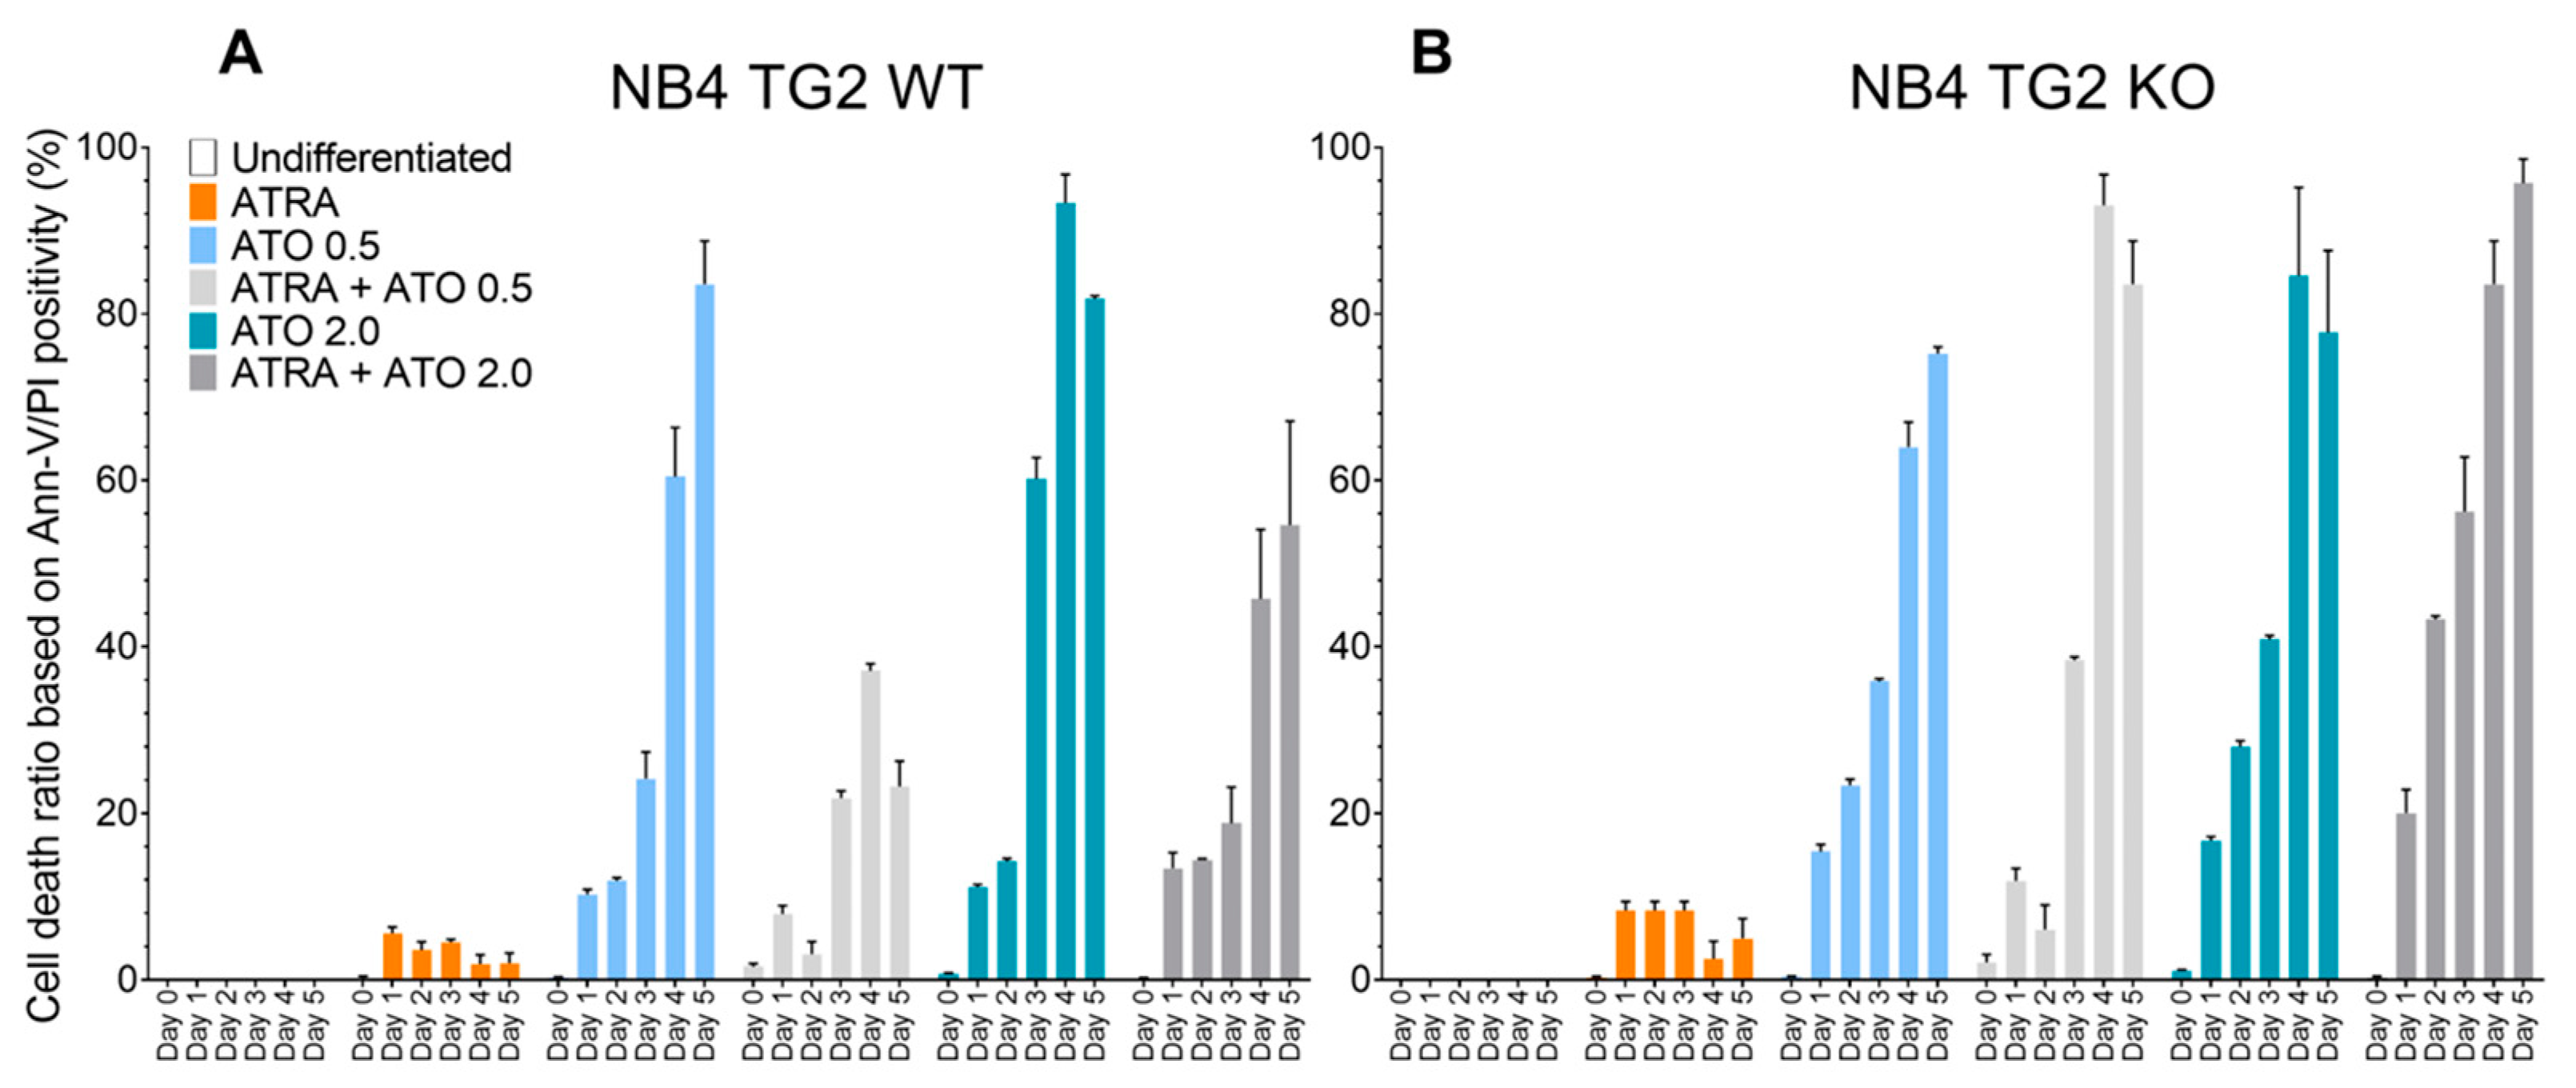
2.1. Transglutaminase 2 Impedes ROS Production to Attenuate ATO-Induced Cell Death in ATRA-Differentiated NB4 Cells
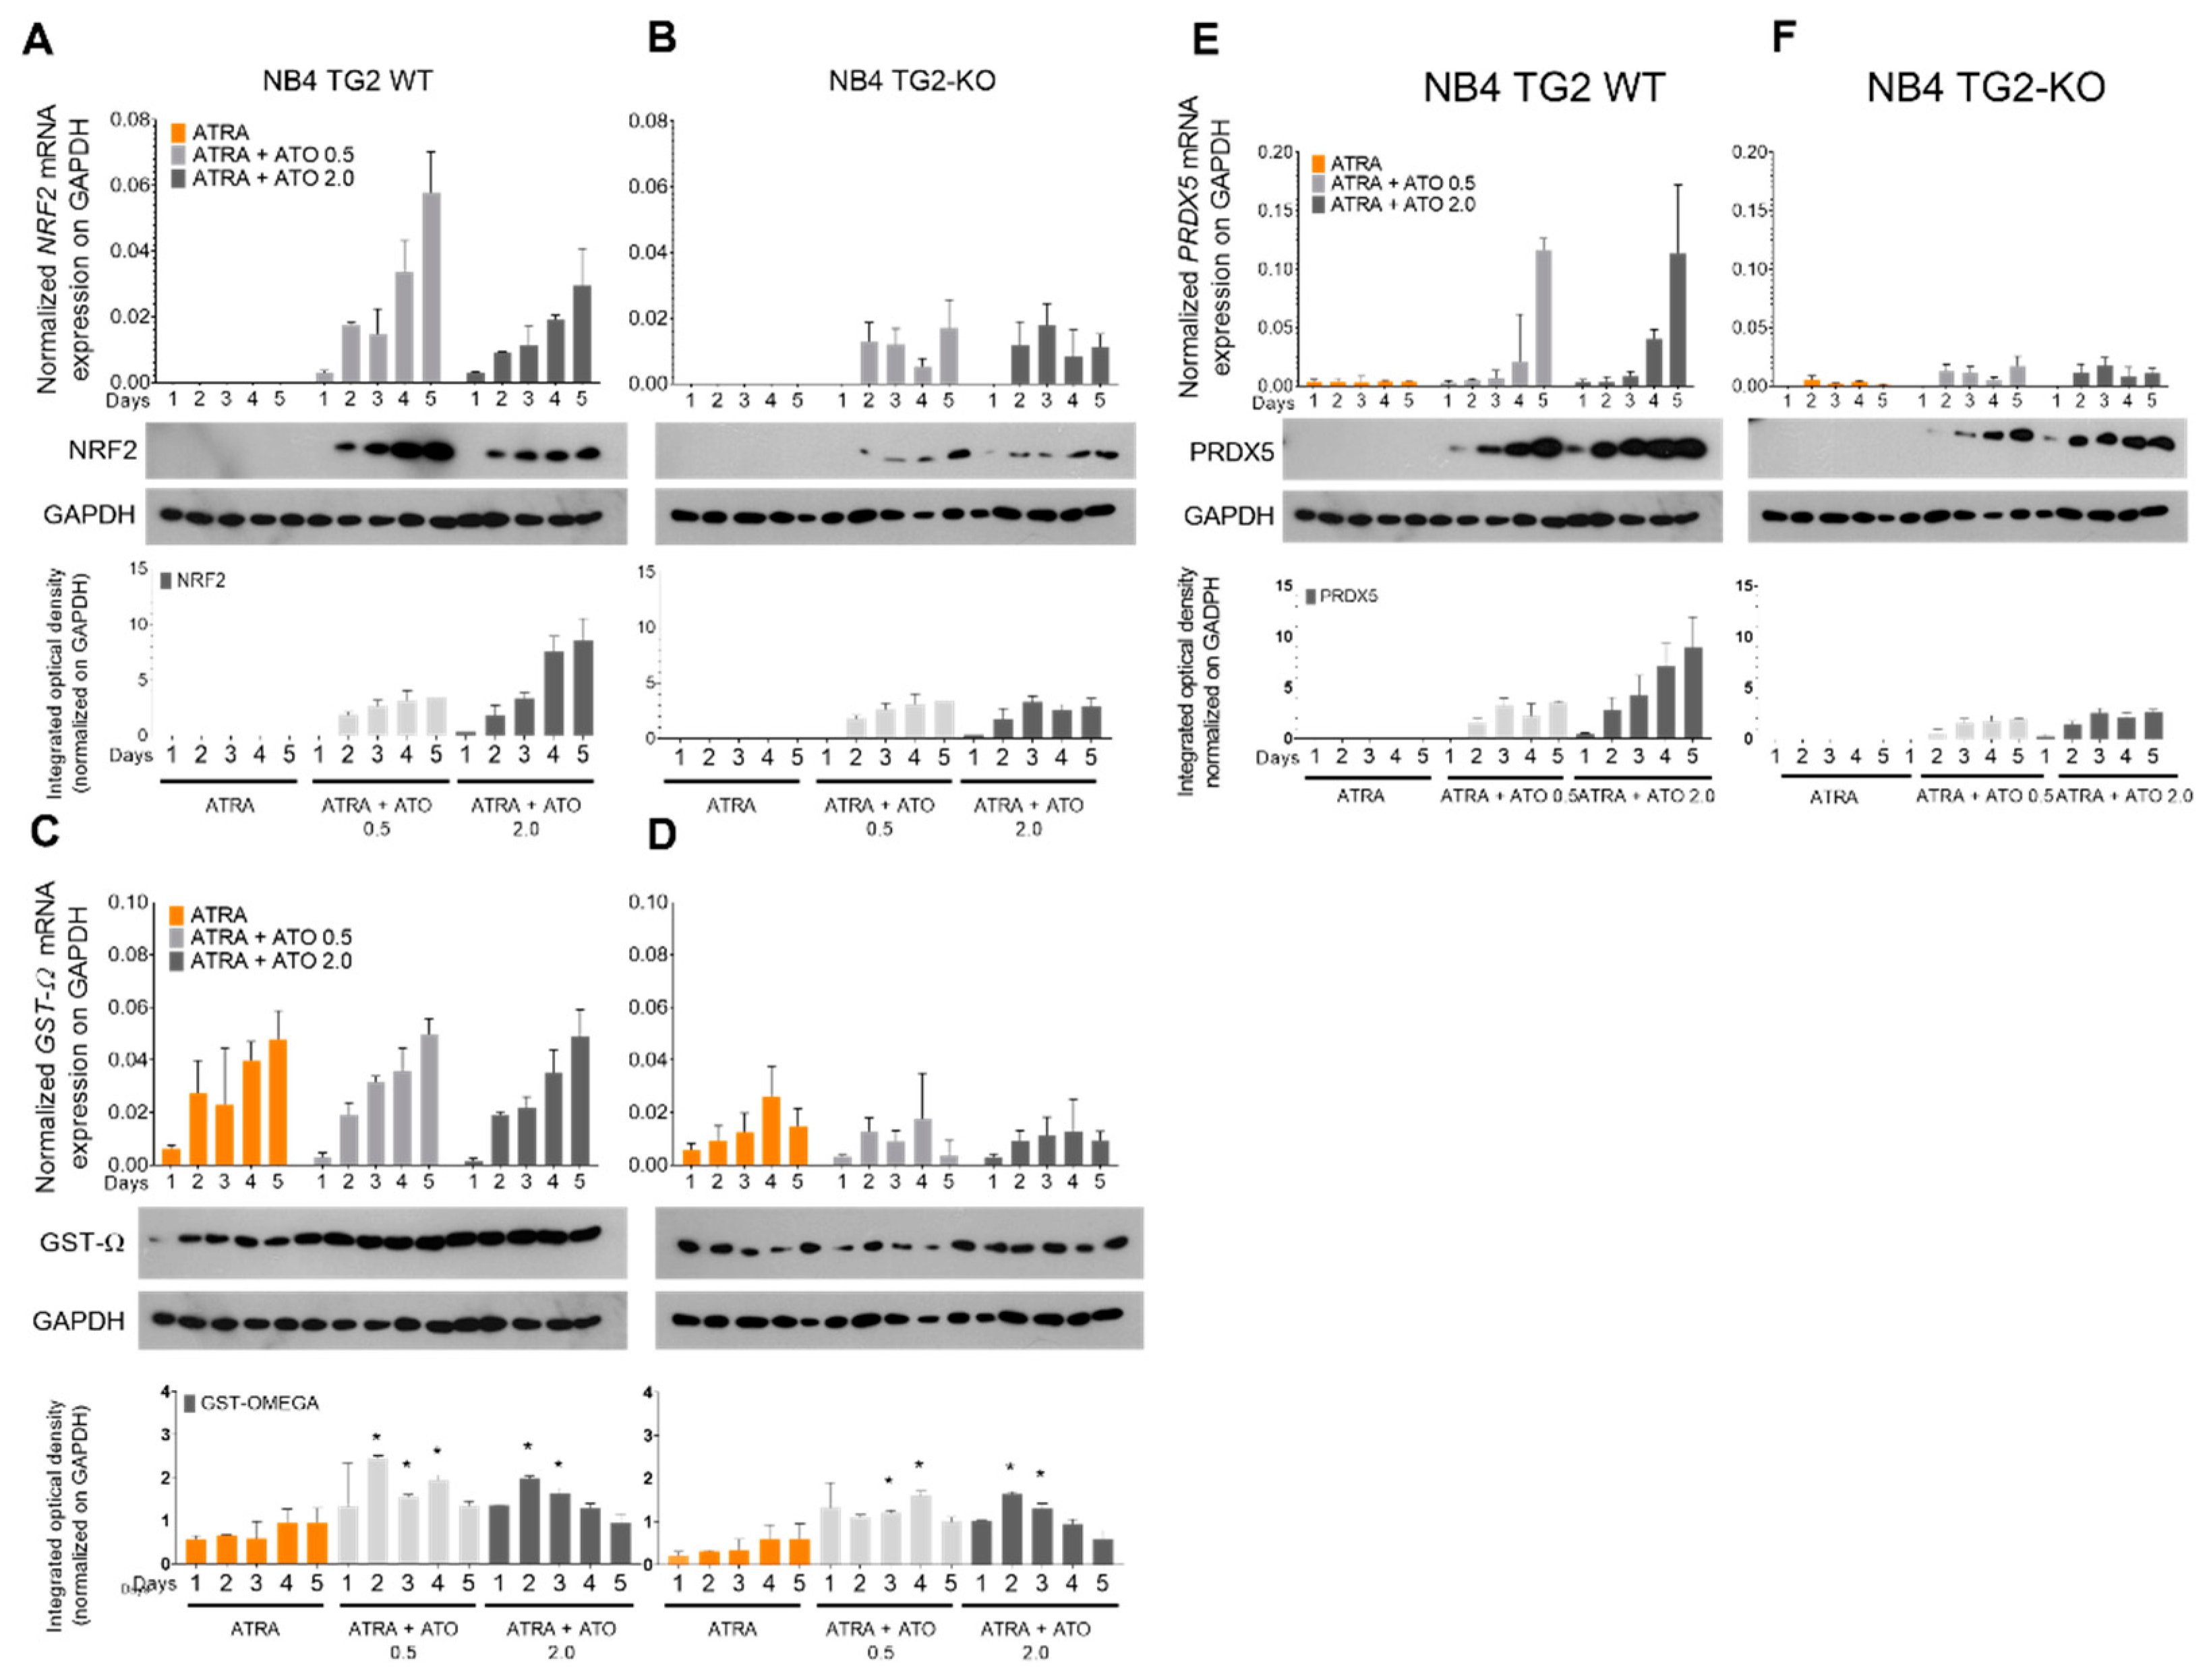
2.2. ROS-Induced Nuclear Factor Erythroid 2-Related Factor 2 (NRF2) Transcription Factor Mediates the Expression of Antioxidant Genes in a TG2-Dependent Manner
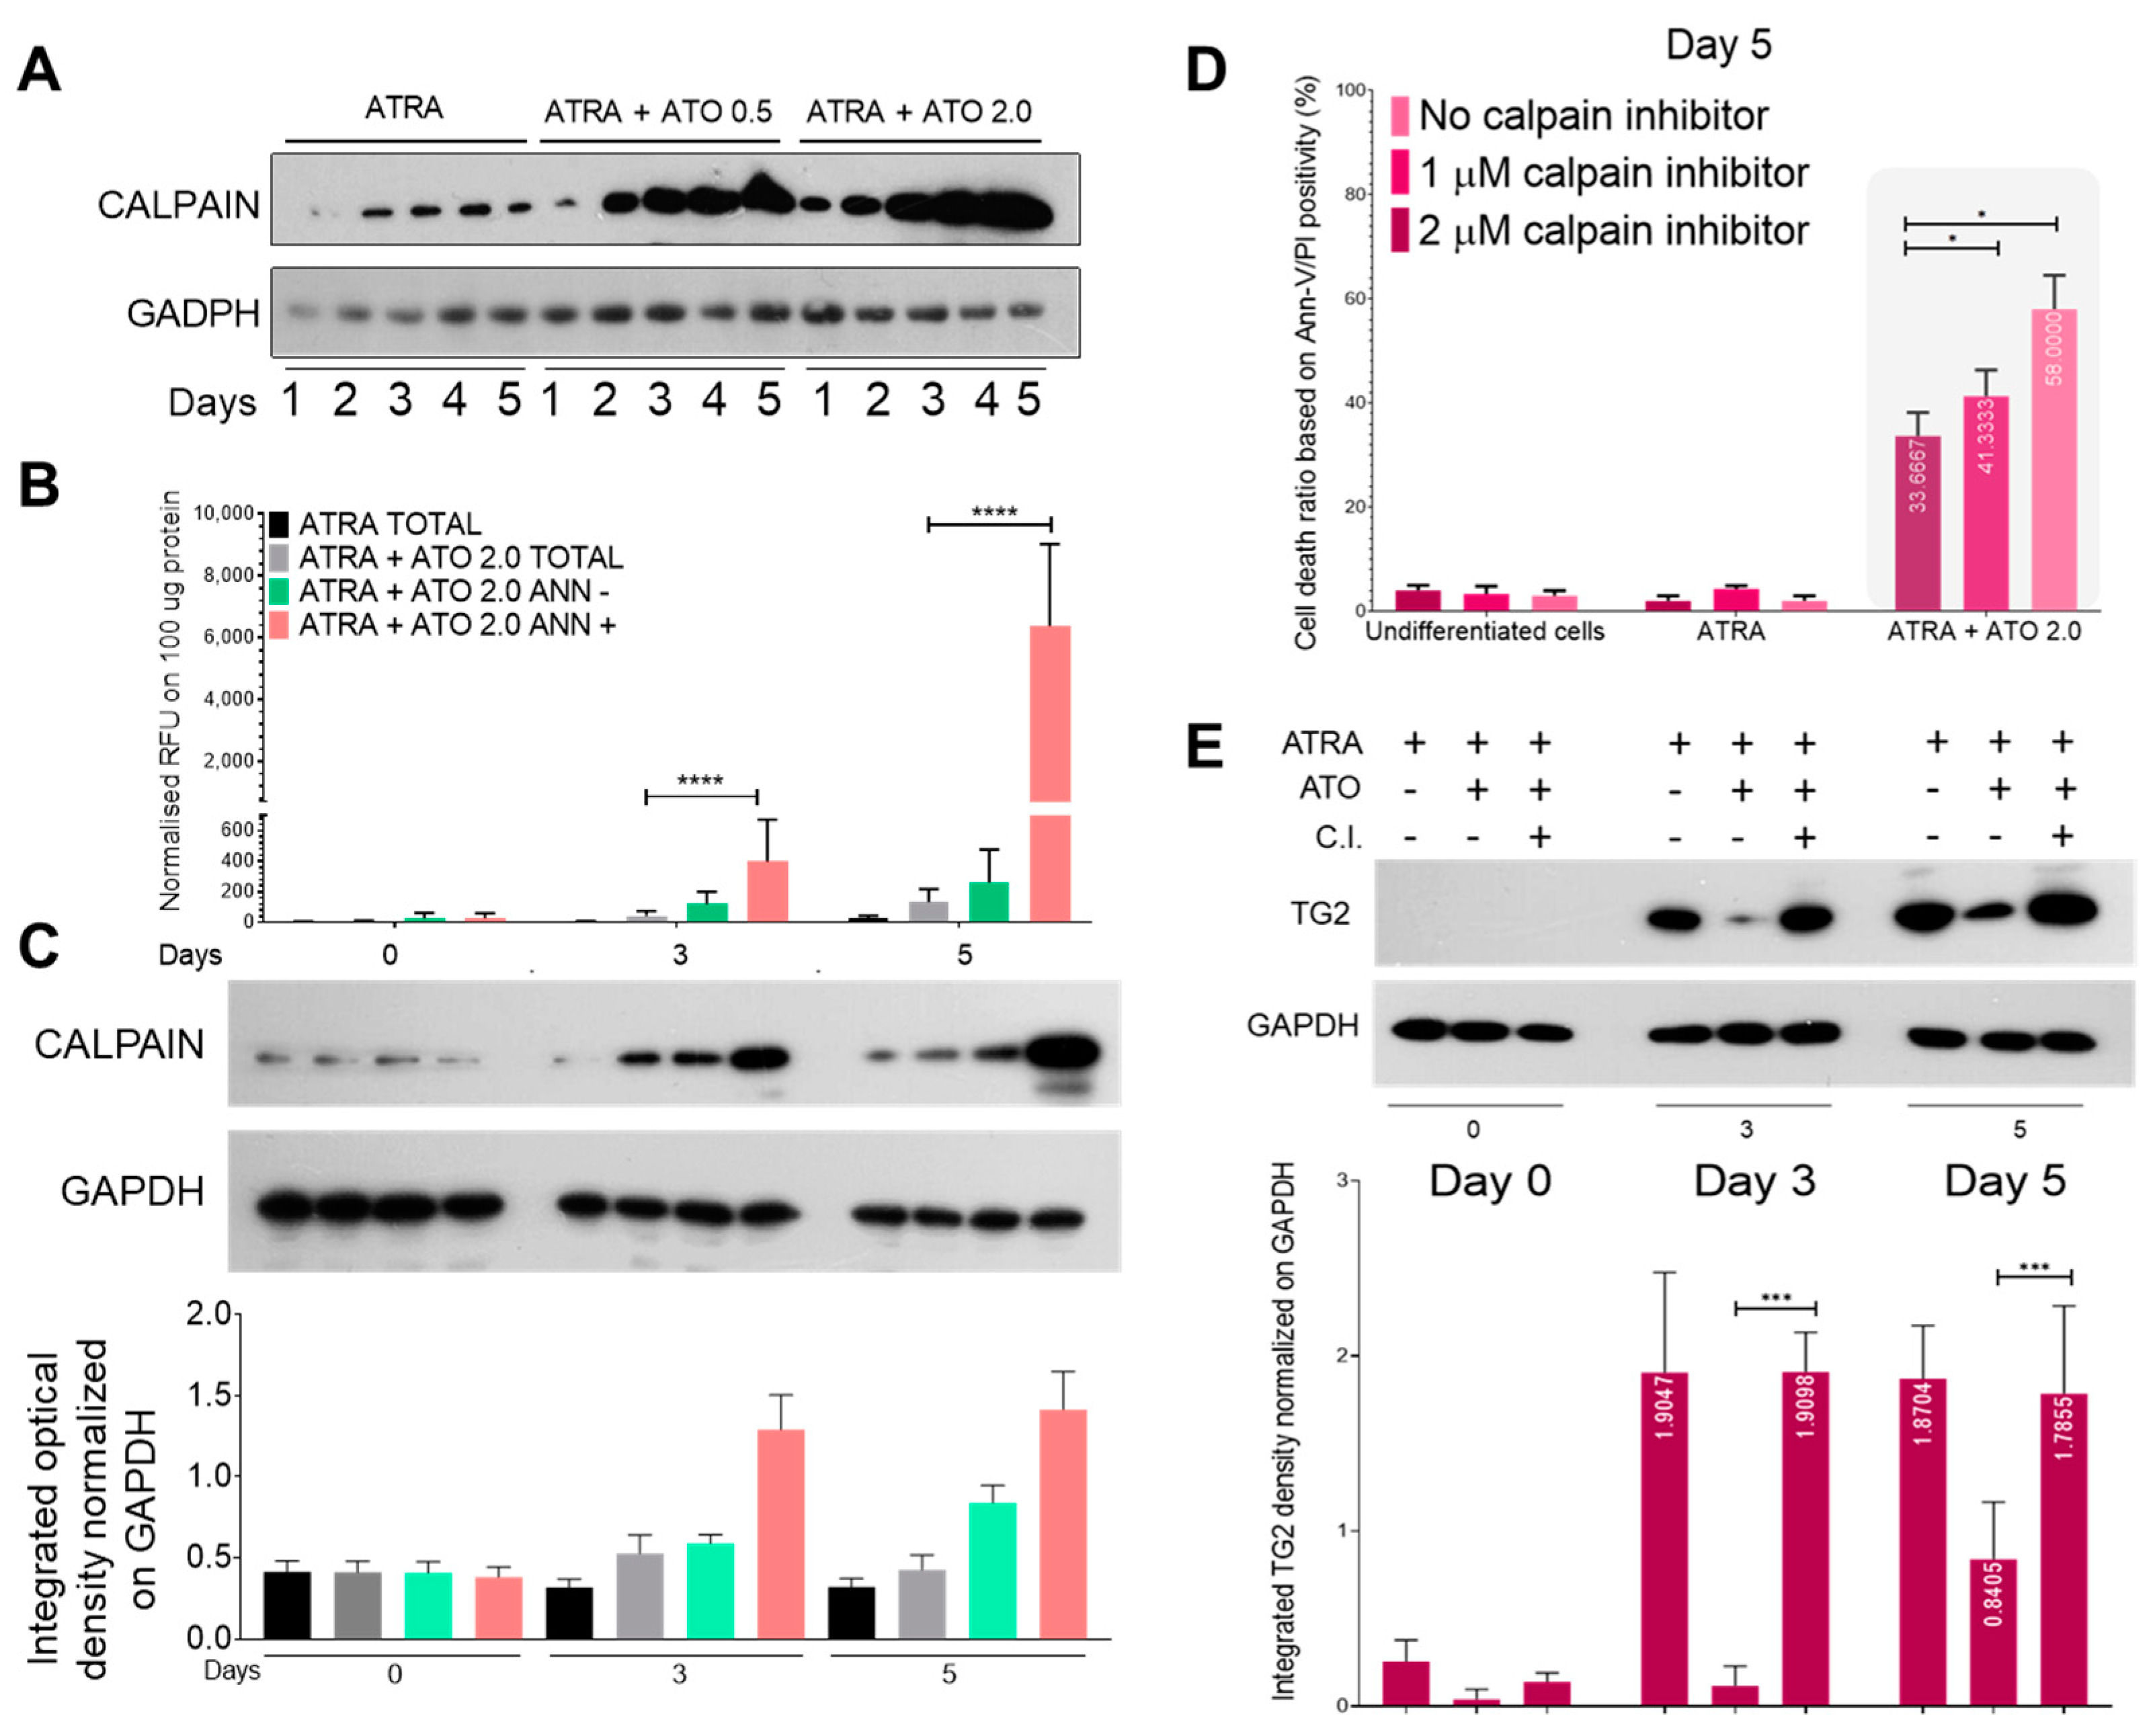
2.3. ROS Production Elicits Robust Calpain Expression and Activation, Resulting in the Increased Proteolysis of Transglutaminase 2
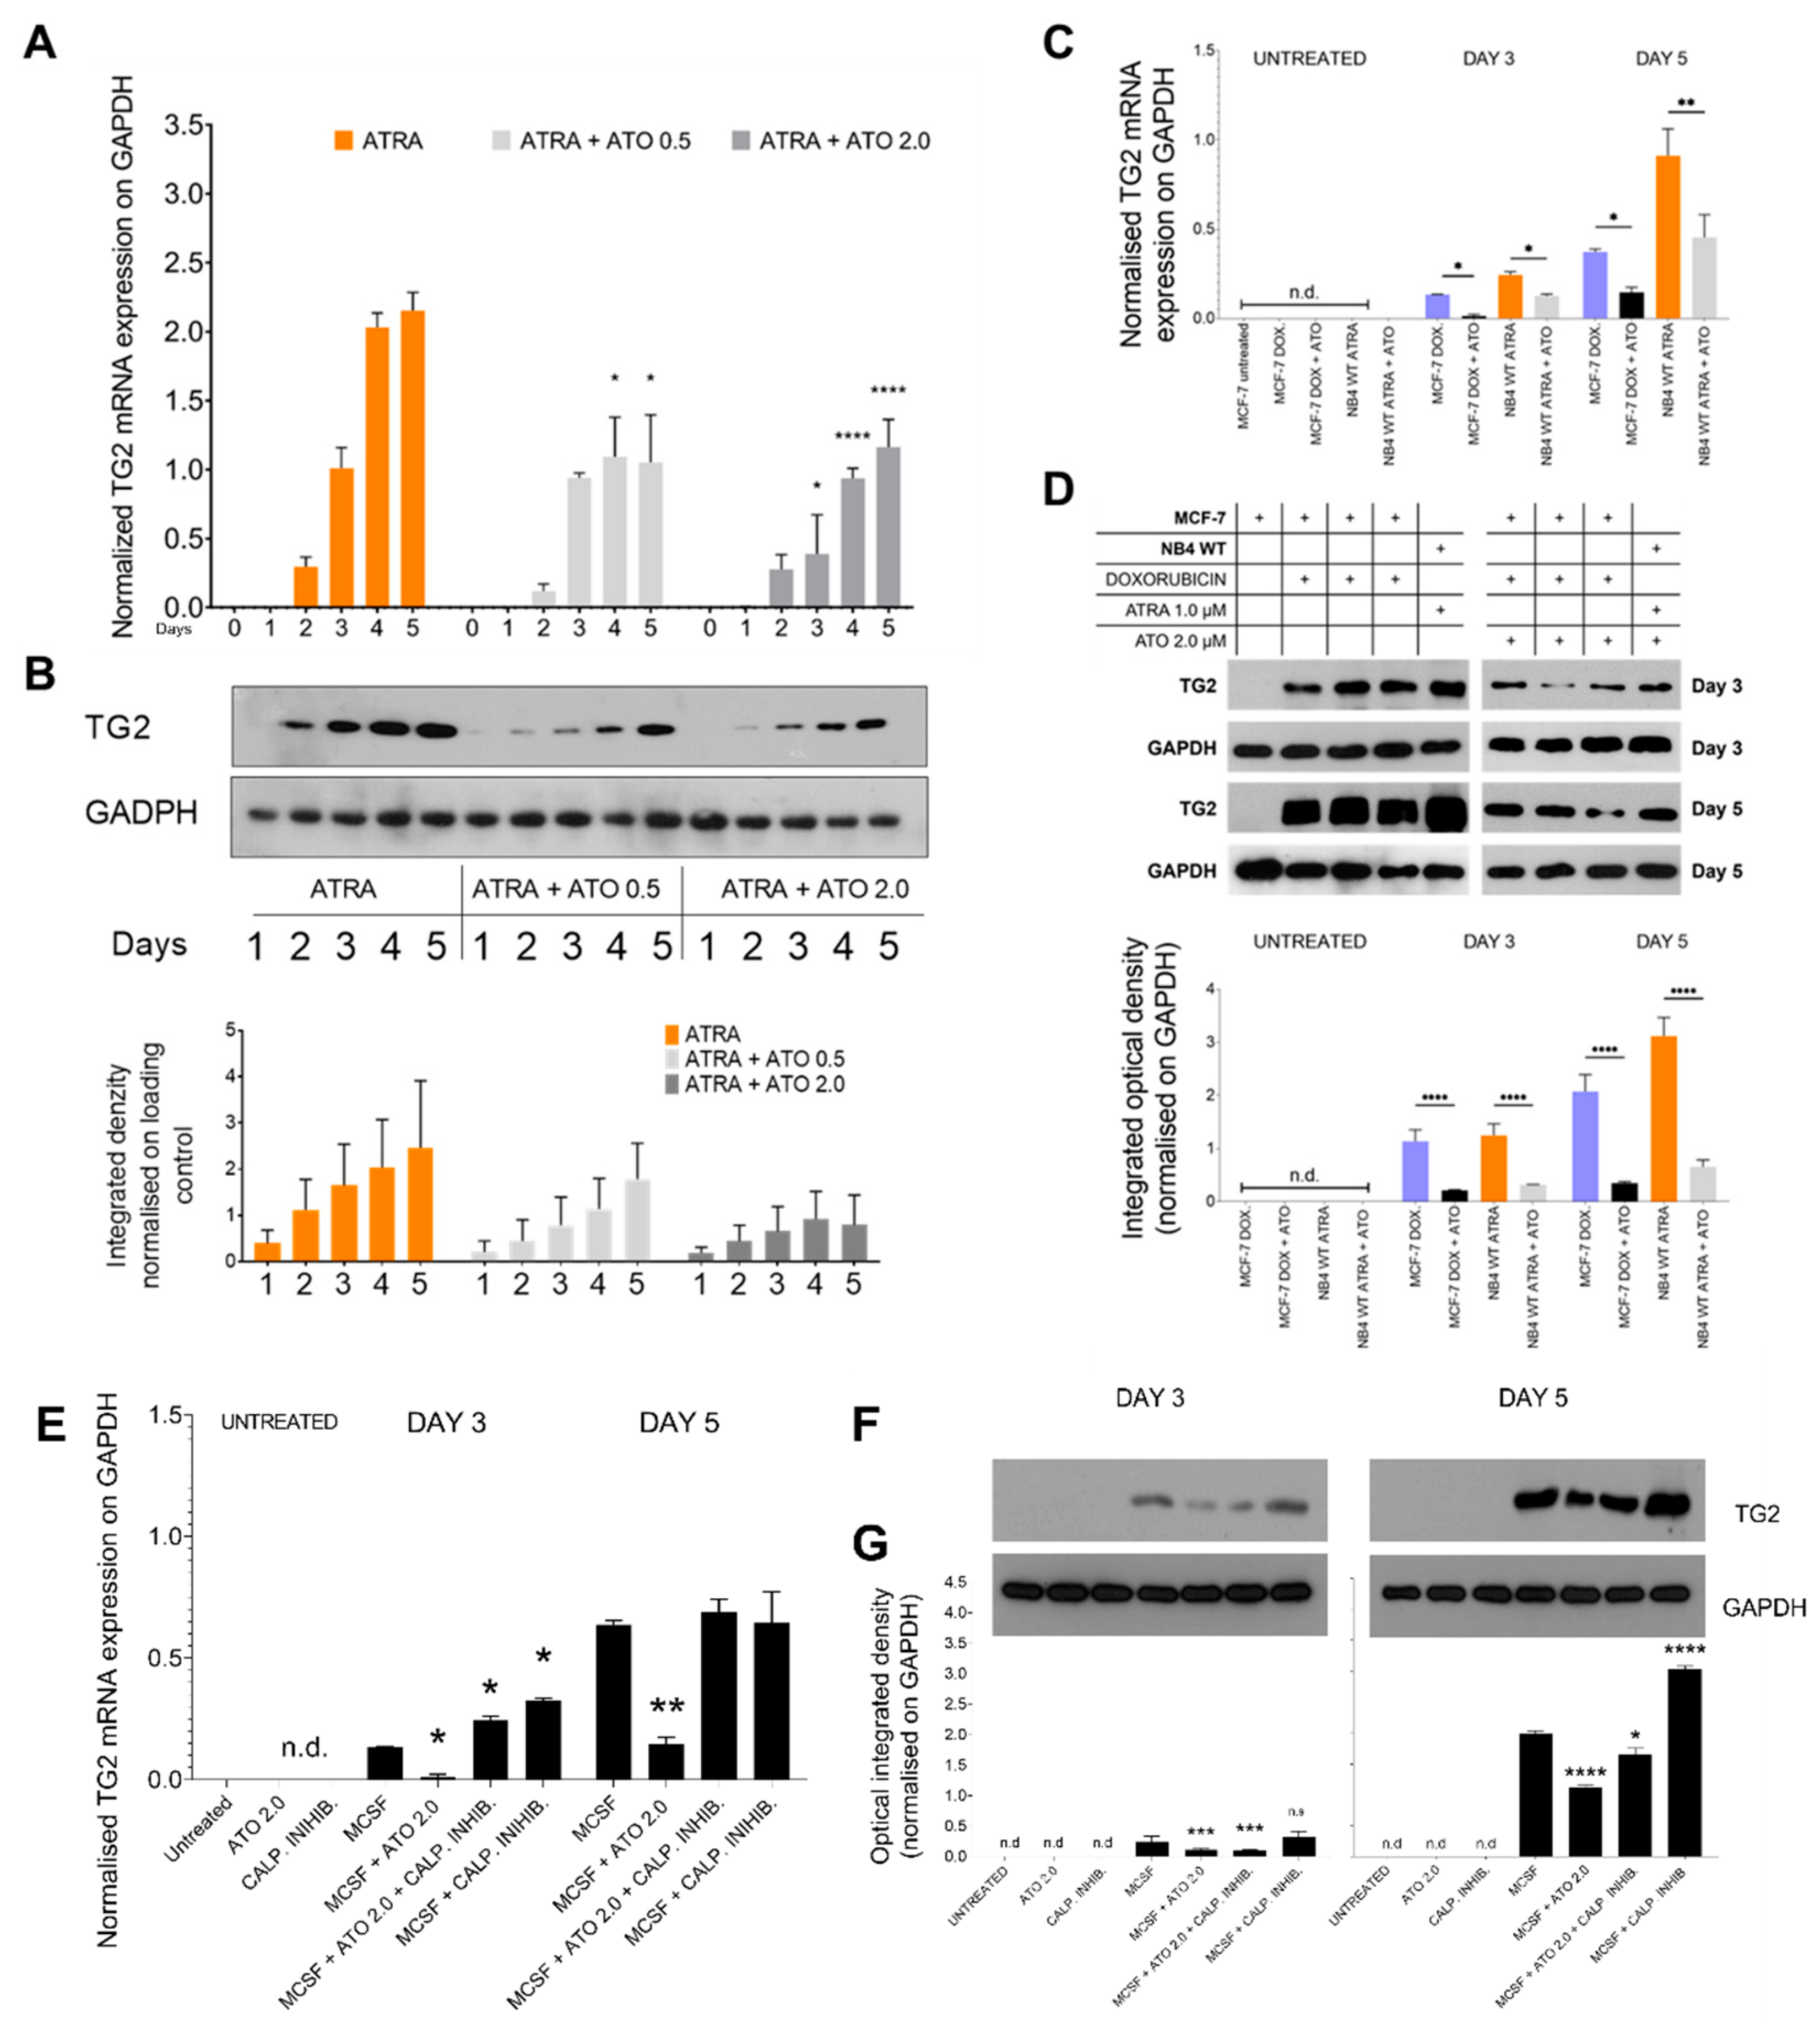
2.4. ATO Could Suppress Both Transglutaminase 2 mRNA and Protein Levels in NB4 WT, MCF-7 Cells, and in MCSF-Treated Monocytes
3. Discussion
4. Materials and Methods
4.1. Cell Culture and Treatment
4.2. Human Monocyte Isolation
4.3. Inhibition of Calpain
4.4. Endogenous Reactive Superoxide Production
4.5. Annexin-V Labelling and Live/Dead Cell Sorting
4.6. Fluorometric Measurement of Calpain Activity
4.7. Gene Expression Analyses Using Real-Time qPCR
4.8. SDS-PAGE and Western Blotting
4.9. Statistical Analysis
Supplementary Materials
Author Contributions
Funding
Institutional Review Board Statement
Informed Consent Statement
Data Availability Statement
Acknowledgments
Conflicts of Interest
References
- Fesus, L.; Piacentini, M. Transglutaminase 2: An enigmatic enzyme with diverse functions. Trends Biochem. Sci. 2002, 27, 534–539. [Google Scholar] [CrossRef]
- Jambrovics, K.; Botó, P.; Pap, A.; Sarang, Z.; Kolostyák, Z.; Czimmerer, Z.; Szatmari, I.; Fésüs, L.; Uray, I.P.; Balajthy, Z. Transglutaminase 2 associated with PI3K and PTEN in a membrane-bound signalosome platform blunts cell death. Cell Death Dis. 2023, 14, 217. [Google Scholar] [CrossRef]
- Tatsukawa, H.; Hitomi, K. Role of Transglutaminase 2 in Cell Death, Survival, and Fibrosis. Cells 2021, 10, 1842. [Google Scholar] [CrossRef]
- Park, K.-S.; Kim, H.-K.; Lee, J.-H.; Choi, Y.-B.; Park, S.-Y.; Yang, S.-H.; Kim, S.-Y.; Hong, K.-M. Transglutaminase 2 as a cisplatin resistance marker in non-small cell lung cancer. J. Cancer Res. Clin. Oncol. 2010, 136, 493–502. [Google Scholar] [CrossRef] [PubMed]
- Mehta, K.; Kumar, A.; Im Kim, H. Transglutaminase 2: A multi-tasking protein in the complex circuitry of inflammation and cancer. Biochem. Pharmacol. 2010, 80, 1921–1929. [Google Scholar] [CrossRef] [PubMed]
- Budillon, A.; Carbone, C.; Di Gennaro, E. Tissue transglutaminase: A new target to reverse cancer drug resistance. Amino Acids 2013, 44, 63–72. [Google Scholar] [CrossRef]
- Adhikary, G.; Grun, D.; Alexander, H.R.; Friedberg, J.S.; Xu, W.; Keillor, J.W.; Kandasamy, S.; Eckert, R.L. Transglutaminase is a mesothelioma cancer stem cell survival protein that is required for tumor formation. Oncotarget 2018, 9, 34495–34505. [Google Scholar] [CrossRef]
- Gao, J.; Wang, S.; Wan, H.; Lan, J.; Yan, Y.; Yin, D.; Zhou, W.; Hun, S.; He, Q. Prognostic Value of Transglutaminase 2 in Patients with Solid Tumors: A Meta-analysis. Genet Test Mol. Biomark. 2023, 27, 36–43. [Google Scholar] [CrossRef]
- Grignani, F.; Testa, U.; Rogaia, D.; Ferrucci, P.F.; Samoggia, P.; Pinto, A.; Aldinucci, D.; Gelmetti, V.; Fagioli, M.; Alcalay, M. Effects on differentiation by the promyelocytic leukemia PML/RARalpha protein depend on the fusion of the PML protein dimerization and RARalpha DNA binding domains. EMBO J. 1996, 15, 4949–4958. [Google Scholar] [CrossRef] [PubMed]
- Estey, E.; Garcia-Manero, G.; Ferrajoli, A.; Faderl, S.; Verstovsek, S.; Jones, D.; Kantarjian, H. Use of all-trans retinoic acid plus arsenic trioxide as an alternative to chemotherapy in untreated acute promyelocytic leukemia. Blood 2006, 107, 3469–3473. [Google Scholar] [CrossRef]
- Abaza, Y.; Kantarjian, H.; Garcia-Manero, G.; Estey, E.; Borthakur, G.; Jabbour, E.; Faderl, S.; O’Brien, S.; Wierda, W.; Pierce, S. Long-term outcome of acute promyelocytic leukemia treated with all-trans-retinoic acid, arsenic trioxide, and gemtuzumab. Blood 2017, 129, 1275–1283. [Google Scholar] [CrossRef] [PubMed]
- Balajthy, Z.; Csomós, K.; Vámosi, G.; Szántó, A.; Lanotte, M.; Fésüs, L. Tissue-transglutaminase contributes to neutrophil granulocyte differentiation and functions. Blood 2006, 108, 2045–2054. [Google Scholar] [CrossRef] [PubMed]
- Csomós, K.; Német, I.; Fésüs, L.; Balajthy, Z. Tissue transglutaminase contributes to the all-trans-retinoic acid–induced differentiation syndrome phenotype in the NB4 model of acute promyelocytic leukemia. Blood 2010, 116, 3933–3943. [Google Scholar] [CrossRef]
- Niu, C.; Yan, H.; Yu, T.; Sun, H.-P.; Liu, J.-X.; Li, X.-S.; Wu, W.; Zhang, F.-Q.; Chen, Y.; Zhou, L. Studies on treatment of acute promyelocytic leukemia with arsenic trioxide: Remission induction, follow-up, and molecular monitoring in 11 newly diagnosed and 47 relapsed acute promyelocytic leukemia patients. Blood J. Am. Soc. Hematol. 1999, 94, 3315–3324. [Google Scholar] [CrossRef]
- Wang, Z.-Y.; Chen, Z. Acute promyelocytic leukemia: From highly fatal to highly curable. Blood 2008, 111, 2505–2515. [Google Scholar] [CrossRef] [PubMed]
- Huynh, T.T.; Sultan, M.; Vidovic, D.; Dean, C.A.; Cruickshank, B.M.; Lee, K.; Loung, C.-Y.; Holloway, R.W.; Hoskin, D.W.; Waisman, D.M. Retinoic acid and arsenic trioxide induce lasting differentiation and demethylation of target genes in APL cells. Sci. Rep. 2019, 9, 9414. [Google Scholar] [CrossRef] [PubMed]
- Chen, S.-J.; Zhou, G.-B.; Zhang, X.-W.; Mao, J.-H.; de Thé, H.; Chen, Z. From an old remedy to a magic bullet: Molecular mechanisms underlying the therapeutic effects of arsenic in fighting leukemia. Blood J. Am. Soc. Hematol. 2011, 117, 6425–6437. [Google Scholar] [CrossRef]
- Chen, F.; Zhang, Y.; Varambally, S.; Creighton, C.J. Molecular correlates of metastasis by systematic pan-cancer analysis across The Cancer Genome Atlas. Mol. Cancer Res. 2019, 17, 476–487. [Google Scholar] [CrossRef]
- Dos Santos, G.A.; Kats, L.; Pandolfi, P.P. Synergy against PML-RARa: Targeting transcription, proteolysis, differentiation, and self-renewal in acute promyelocytic leukemia. J. Exp. Med. 2013, 210, 2793–2802. [Google Scholar] [CrossRef]
- Jomova, K.; Jenisova, Z.; Feszterova, M.; Baros, S.; Liska, J.; Hudecova, D.; Rhodes, C.; Valko, M. Arsenic: Toxicity, oxidative stress and human disease. J. Appl. Toxicol. 2011, 31, 95–107. [Google Scholar] [CrossRef]
- Sumi, D.; Shinkai, Y.; Kumagai, Y. Signal transduction pathways and transcription factors triggered by arsenic trioxide in leukemia cells. Toxicol. Appl. Pharmacol. 2010, 244, 385–392. [Google Scholar] [CrossRef]
- He, F.; Ru, X.; Wen, T. NRF2, a transcription factor for stress response and beyond. Int. J. Mol. Sci. 2020, 21, 4777. [Google Scholar] [CrossRef] [PubMed]
- Chen, X.; Cao, X.; Xiao, W.; Li, B.; Xue, Q. PRDX5 as a novel binding partner in Nrf2-mediated NSCLC progression under oxidative stress. Aging 2020, 12, 122–137. [Google Scholar] [CrossRef] [PubMed]
- Karlsson, J.; Pietras, A.; Beckman, S.; Pettersson, H.M.; Larsson, C.; Påhlman, S. Arsenic trioxide-induced neuroblastoma cell death is accompanied by proteolytic activation of nuclear Bax. Oncogene 2007, 26, 6150–6159. [Google Scholar] [CrossRef] [PubMed]
- De Thé, H.; Pandolfi, P.P.; Chen, Z. Acute promyelocytic leukemia: A paradigm for oncoprotein-targeted cure. Cancer Cell 2017, 32, 552–560. [Google Scholar] [CrossRef] [PubMed]
- Ades, L.; Raffoux, E.; Fenaux, P.; Dombret, H. Treatment of adult acute promyelocytic leukaemia. Oncologie 2008, 10, 290–294. [Google Scholar] [CrossRef]
- Wang, H.-Y.; Gong, S.; Li, G.-H.; Yao, Y.-Z.; Zheng, Y.-S.; Lu, X.-H.; Wei, S.-H.; Qin, W.-W.; Liu, H.-B.; Wang, M.-C. An effective and chemotherapy-free strategy of all-trans retinoic acid and arsenic trioxide for acute promyelocytic leukemia in all risk groups (APL15 trial). Blood Cancer J. 2022, 12, 158. [Google Scholar] [CrossRef]
- Transcriptional Regulation by Nrf2. Antioxid. Redox Signal. 2018, 29, 1727–1745. [CrossRef]
- Oh, K.; Ko, E.; Kim, H.S.; Park, A.K.; Moon, H.-G.; Noh, D.-Y.; Lee, D.-S. Transglutaminase 2 facilitates the distant hematogenous metastasis of breast cancer by modulating interleukin-6 in cancer cells. Breast Cancer Res. 2011, 13, R96. [Google Scholar] [CrossRef]
- Kumar, A.; Xu, J.; Brady, S.; Gao, H.; Yu, D.; Reuben, J.; Mehta, K. Tissue transglutaminase promotes drug resistance and invasion by inducing mesenchymal transition in mammary epithelial cells. PLoS ONE 2010, 5, e13390. [Google Scholar] [CrossRef]
- Gupta, S.; Garg, S.; Kumar, V.; Chaturvedi, A.; Misra, S.; Akhtar, N.; Rajan, S.; Kaur, J.; Lakshmanan, M.; Jain, K. Study of tumor transglutaminase 2 expression in gallbladder cancer–Is it a novel predictor of survival? Ann. Hepato-Biliary-Pancreat. Surg. 2020, 24, 460–468. [Google Scholar] [CrossRef] [PubMed]
- Eckert, R.L. Transglutaminase 2 takes center stage as a cancer cell survival factor and therapy target. Mol. Carcinog. 2019, 58, 837–853. [Google Scholar] [CrossRef] [PubMed]


Disclaimer/Publisher’s Note: The statements, opinions and data contained in all publications are solely those of the individual author(s) and contributor(s) and not of MDPI and/or the editor(s). MDPI and/or the editor(s) disclaim responsibility for any injury to people or property resulting from any ideas, methods, instructions or products referred to in the content. |
© 2023 by the authors. Licensee MDPI, Basel, Switzerland. This article is an open access article distributed under the terms and conditions of the Creative Commons Attribution (CC BY) license (https://creativecommons.org/licenses/by/4.0/).
Share and Cite
Jambrovics, K.; Póliska, S.; Scholtz, B.; Uray, I.P.; Balajthy, Z. ATO Increases ROS Production and Apoptosis of Cells by Enhancing Calpain-Mediated Degradation of the Cancer Survival Protein TG2. Int. J. Mol. Sci. 2023, 24, 10938. https://doi.org/10.3390/ijms241310938
Jambrovics K, Póliska S, Scholtz B, Uray IP, Balajthy Z. ATO Increases ROS Production and Apoptosis of Cells by Enhancing Calpain-Mediated Degradation of the Cancer Survival Protein TG2. International Journal of Molecular Sciences. 2023; 24(13):10938. https://doi.org/10.3390/ijms241310938
Chicago/Turabian StyleJambrovics, Károly, Szilárd Póliska, Beáta Scholtz, Iván P. Uray, and Zoltán Balajthy. 2023. "ATO Increases ROS Production and Apoptosis of Cells by Enhancing Calpain-Mediated Degradation of the Cancer Survival Protein TG2" International Journal of Molecular Sciences 24, no. 13: 10938. https://doi.org/10.3390/ijms241310938
APA StyleJambrovics, K., Póliska, S., Scholtz, B., Uray, I. P., & Balajthy, Z. (2023). ATO Increases ROS Production and Apoptosis of Cells by Enhancing Calpain-Mediated Degradation of the Cancer Survival Protein TG2. International Journal of Molecular Sciences, 24(13), 10938. https://doi.org/10.3390/ijms241310938