Abstract
F-type ATP synthases play a key role in oxidative and photophosphorylation processes generating adenosine triphosphate (ATP) for most biochemical reactions in living organisms. In contrast to the mitochondrial FOF1-ATP synthases, those of chloroplasts are known to be mostly monomers with approx. 15% fraction of oligomers interacting presumably non-specifically in a thylakoid membrane. To shed light on the nature of this difference we studied interactions of the chloroplast ATP synthases using small-angle X-ray scattering (SAXS) method. Here, we report evidence of I-shaped dimerization of solubilized FOF1-ATP synthases from spinach chloroplasts at different ionic strengths. The structural data were obtained by SAXS and demonstrated dimerization in response to ionic strength. The best model describing SAXS data was two ATP-synthases connected through F1/F1′ parts, presumably via their δ-subunits, forming “I” shape dimers. Such I-shaped dimers might possibly connect the neighboring lamellae in thylakoid stacks assuming that the FOF1 monomers comprising such dimers are embedded in parallel opposing stacked thylakoid membrane areas. If this type of dimerization exists in nature, it might be one of the pathways of inhibition of chloroplast FOF1-ATP synthase for preventing ATP hydrolysis in the dark, when ionic strength in plant chloroplasts is rising. Together with a redox switch inserted into a γ-subunit of chloroplast FOF1 and lateral oligomerization, an I-shaped dimerization might comprise a subtle regulatory process of ATP synthesis and stabilize the structure of thylakoid stacks in chloroplasts.
1. Introduction
The ATP synthase has been the object of intensive studies for at least half a century. This interest is defined by the fact that the enzyme provides cells with adenosine triphosphate (ATP), which is the key molecule for almost all biochemical reactions in living organisms, being the major source of energy for use and storage at the cellular level. F-type ATP synthases were found in the mitochondria of eukaryotes, bacterial cellular membranes, and chloroplasts. ATP synthase couples transmembrane ion transport, established by mechanical rotation of a c-ring in a membrane (FO) region, with conformational changes in ATP catalytic centers at α/β interfaces (F1 region).
Mitochondrial ATP synthases (mtFOF1) are embedded in mitochondrial inner membranes and were found to form dimers of four different types (V-shape dimers of types I, II, and IV, and U-shape dimers of type III). These dimers differ in the angle between monomers of mtFOF1, which is responsible for the topology of mitochondrial cristae (special folds in the mitochondrial inner membrane) [1]. In contrast, in bacteria, ATP synthases (bFOF1) are known to be monomers [2]. ATP synthases in thylakoid membranes (cFOF1) were shown to be primarily monomeric with approx. 12% fraction of dimers and 3% of higher oligomers [3]. According to what is known, the contacts between two cFOF1 monomers are highly likely non-specific, and such dimerization might inhibit ATP synthases, preventing ATP hydrolysis in the absence of photosynthesis [4,5,6].
A dimerization of cFOF1 might be induced by changes in ionic strength in plant chloroplast during the light/dark cycles. The internal volume of a chloroplast is separated from the cytoplasm by a lipid membrane, which, together with the pumps and channels, makes it possible to create and maintain a difference between ion concentration inside and outside the chloroplast. This ion gradient can vary significantly from species to species, and between some organisms, it can reach more than ten-fold [7]. It is known that under light, various ions are redistributed in plants. The phenomenon of light-induced uptake of hydrogen ions by isolated chloroplasts is well studied. It is accompanied by the redistribution of other ions, such as Na, K, Cl, and Mg, implying that the ionic strength of the solution contained in plant chloroplasts can change 1.5 times during the day [8,9].
SAXS is an excellent structural method to study biological macromolecules in solutions, i.e., it allows one to perform the studies under a variety of conditions, including different ionic strengths. For example, recent studies show the possibility to obtain structural information about the supramolecular organization of membrane protein complexes from the experimental small-angle scattering (SAS) data, in particular, to determine the relative positions of monomers comprising an oligomer [10]. Accurate SAS data treatment for membrane proteins requires considering compounds surrounding the membrane part of the protein due to its significant influence on the I(Q) SAXS profile even for protein complexes with a large water-soluble part as was shown in the literature [11].
In our work, we observed the in vitro dimerization of cFOF1 in response to increasing ionic strength. The structural data were obtained by SAXS measurements of solubilized and purified samples of cFOF1 from spinach chloroplasts at different NaCl concentrations. SAXS data analysis resulted in a model of an I-shaped dimer of cFOF1, which is a mixture with monomeric cFOF1, providing the best fit of the experimental data. I-shaped co-linear F1/F1 interfaced cFOF1 dimers are formed by F1/F1 contacts, presumably via δ/δ subunit interaction, so that the FO parts of the monomers are on the opposite sides of the dimer. We used a macromolecular docking to refine our model and improved the quality of the fit of SAXS data for each NaCl concentration thereby generating a high-resolution model of these dimers.
We present here a new model of a dimer of F-ATP synthases from spinach chloroplasts, which results in a specific F1/F1 interaction, presumably via δ-subunits, which connect a peripheral stalk (bb′) of ATP-synthase with the F1 catalytic head (α3β3), thus stabilizing it during rotation of the central stalk (γε) of the enzyme. We speculate that changes in ionic strength in plant chloroplasts during the day (light/dark cycles) might trigger the formation of cFOF1 oligomers in chloroplasts and, in particular, I-shaped cFOF1 dimers. We hypothesize that chloroplast ATP synthases might also form oligomers in order to inhibit ATP hydrolysis in the dark, and I-shaped dimers might possibly connect parallel opposing stacked thylakoid membrane areas and stabilize thylakoid stacks in chloroplasts.
The here reported model of the cFOF1 I-shaped dimer is unexpected and raises questions about whether such a type of dimerization exists in nature. First, such dimers should be inserted in two membranes at a specific distance from each other. Second, it should change the rate of ATP synthesis due to the steric hindrance of δ-subunits.
2. Results
2.1. Purification of the Monomeric FOF1 ATP-Synthase from Thylakoid Membranes
Isolation and purification of cFOF1 from spinach chloroplasts (Figure 1a) were conducted as described [12,13,14], and the final step of purification utilized treatment with the detergent 4-trans-(4-trans-Propylcyclohexyl)-cyclohexyl α-maltoside (t-PCCαM) followed by the anion exchange chromatography (AEX) against the NaCl concentration gradient (50–1000 mM) (Figure 1d). The AEX chromatogram showed a peak at ~300 mM NaCl (Figure 1e), which corresponds to the whole cFOF1 protein complex according to SDS-PAGE (Figure 1c). Blue-Native PAGE was also used to check the completeness and assembly of cFOF1 (Figure S1).
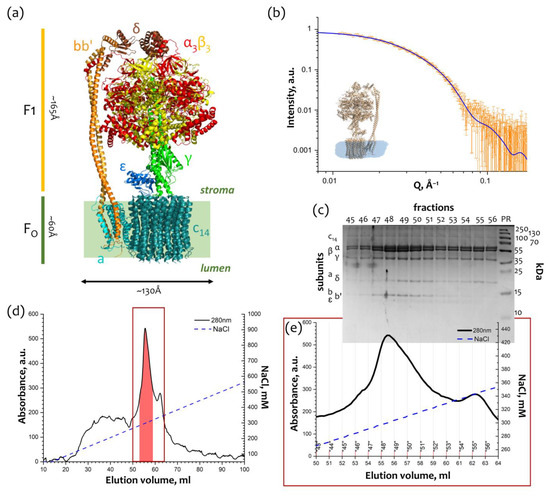
Figure 1.
Purification and characterization of cFOF1: (a) Overall view of ATP synthase from spinach chloroplasts. FO part consists of abb′c14 subunits, F1 part consists of α3β3γεδ subunits and bb′ subunits form a peripheral stalk. The structure of ATP synthase from spinach chloroplasts (PDB ID: 6FKF [15]) was used for representation; (b) Characterization of the peak fractions of cFOF1 after anion exchange chromatography (AEX) by SAXS, experimental I(Q) 1D-profile showed as hollow grey stars, a model of cFOF1 (PDB ID: 6FKF) with a detergent belt was used for approximation of experimental data with χ2 = 1.15 (blue line); (c) Characterization of the AEX peak fractions of cFOF1 by SDS PAGE, colored with Coomassie; (d) Anion exchange chromatography (AEX) of cFOF1 from spinach chloroplasts, highlighted fractions were merged and taken for structural studies, the region shown with a red box is described in details in Panel (e); (e) AEX peak fractions of cFOF1. Panels (a,c–e) were adapted from [12] with modifications.
The peak fractions of cFOF1 were measured by SAXS and showed a good consistency (χ2 = 1.15) with the monomeric model of chloroplast ATP-synthase (PDB ID: 6FKF [15]) with a detergent belt built from the experimental SAXS data by MEMPROT program [16] (Figure 1b). Taking into account a detergent belt allows for improving the χ2 from 1.35 to 1.15 (Figure S3).
2.2. SAS Studies of cFOF1 Dimerization at Different NaCl Concentrations
We investigated the samples of purified cFOF1 by small-angle neutron scattering (SANS) in 100% H2O and 93% D2O buffers with 300 mM NaCl (for details see the section Small-angle scattering measurements in Materials and Methods). Obtained values of the maximum size (Dmax) and a radius of gyration (Rg) were significantly more for the cFOF1 in the D2O buffer in comparison with the H2O one so that it could not be explained only by a contrast variation technique (Figure S2). This effect might have pointed towards an increase of an average oligomeric state in the sample, i.e., oligomerization polydispersity [11]. We hypothesized that a change in ionic strength could have led to the oligomerization of cFOF1. In order to verify this hypothesis, we measured samples of purified cFOF1 at a range of NaCl concentrations by small-angle X-ray scattering (SAXS) (Figure 2a).
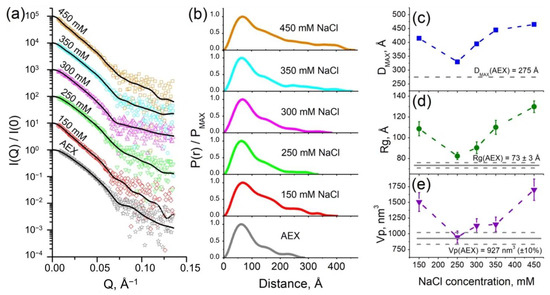
Figure 2.
SAXS characterization of cFOF1: (a) Experimental I(Q) 1D-profiles for AEX-purified and dialyzed against the same buffer with different NaCl concentrations samples of cFOF1, experimental data are shown as dots, regularized fits are shown as black lines. For clarity, SAXS data for 150, 250, 300, 350, and 450 mM NaCl were multiplied by 10, 102, 103, 104, and 105, respectively; (b) Normalized pair-distance distribution function P(r) for cFOF1 at different NaCl concentrations; (c) Maximum size of the object (Dmax) for samples of cFOF1 at different NaCl concentrations; (d) Radius of gyration (Rg) for samples of cFOF1 at different NaCl concentrations obtained from P(r); (e) Porod volume (Vp) for samples of cFOF1 at different NaCl concentrations. Gray lines show the values of Dmax, Rg, Vp for an AEX-purified sample of cFOF1 without dialysis. The values used for plots in panels (c–e) are given in Table S1.
It is worth mentioning that all samples of cFOF1 were first purified at the same conditions and after AEX the buffer contained 30 mM HEPES (pH 8.0), 2 mM MgCl2, 250–300 mM NaCl, 0.04% (w/v), tPCC-α-M (4-trans-(4-trans-Propylcyclohexyl)-cyclohexyl α-maltoside). Then, the samples were dialyzed against the same buffer with different NaCl concentrations (150, 250, 300, 350, 450 mM) and after dialysis, they were measured by SAXS.
Pair-distance distribution function P(r) for samples of cFOF1 at different NaCl concentrations (Figure 2b) showed the dependence of the maximum size of the object Dmax (Figure 2c), radius of gyration Rg (Figure 2d), and Porod volume Vp (Figure 2e) on ionic strength, reaching the maxima at 150 and 450 mM NaCl and the minimum at 250–300 mM NaCl. It implies the increase of oligomerization fraction in the samples with both a decrease and an increase in ionic strength. Interestingly, the values Dmax and Rg showed the lowest values in the samples after AEX, which then increase after dialysis against 250 and 300 mM NaCl (almost the same concentration of NaCl). It might indicate that the real NaCl concentration in the samples after AEX is slightly less than 300 mM NaCl due to estimation errors due to the mixing of the AEX peak fractions and other technical details of the chromatography. In addition, the real minimum of the values Dmax and Rg might be between 250 and 300 mM NaCl.
The highest values of the fraction of cFOF1 dimers were observed for the lowest and the highest NaCl concentrations from investigated range (150 and 450 mM NaCl, respectively). The distance between two monomers of cFOF1 in the dimer can be estimated as follows:
where Rgmono and Rgmix are radii of gyration for monomeric ATP-synthase and average for monomer-dimer mixure, correspondingly, α is a volume fraction of dimers estimated as α = Vpmix/Vpmono − 1 (for a detailed description see Text Document S1). Equation (1) is based on the Guinier approximation, which is well-described in the literature [17]. The Porod volume Vp of the particle can be calculated using the Porod invariant Q [18]. Considering Vp errors as 10% and Rg errors (see Table S1) we estimate Dm-m equals to 183 ± 30 Å and 225 ± 24 Å for 150 mM and 450 mM NaCl, respectively.
The discrepancy of the values Dm-m might indicate different dimerization mechanisms at low and high ionic strength. Nevertheless, such values of Dm-m (similar to the size of cFOF1) imply that the contacts between two monomers of cFOF1 are at the most distant parts of these protein complexes. Thus, only two types of contacts are possible: FO/FO (presumably via c-ring) or F1/F1 (presumably via δ-subunit).
2.3. Models of an I-Shaped cFOF1 Dimer
Taking into account the fact that the oligomerization increases at lower and higher ionic strength and the possible types of contacts derived from the Dm-m value, we built two models of cFOF1 which satisfy these conditions. In the first case, we built a model comprising a mixture of a monomeric cFOF1 and dimers with FO/FO contacts, presumably via c-ring (Figure 3a). In the second case, a model comprises a mixture of a monomeric cFOF1 and dimers with F1/F1 contacts, presumably via δ-subunit (Figure 3b).
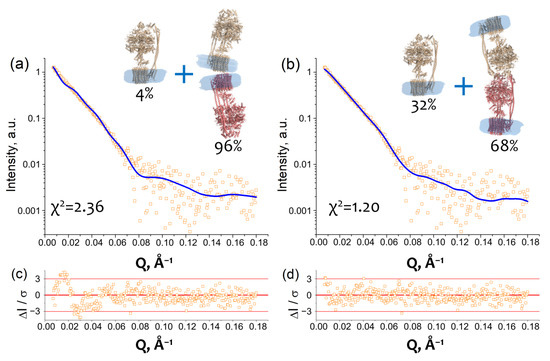
Figure 3.
Dimerization of cFOF1 from Spinacia oleracea at 450 mM NaCl shown by SAXS: (a) Experimental I(Q) 1D-profile for cFOF1 at 450 mM NaCl (orange squares) and an approximation (blue line, χ2 = 2.36) by using a model of a mixture of cFOF1 monomers and dimers formed by FO-FO contacts (see Macromolecular docking section in Materials and Methods); (b) Experimental I(Q) 1D-profile for cFOF1 at 450 mM NaCl (the same as in panel (a), orange squares) and an approximation (blue line, χ2 = 1.20) by using a model of a mixture of cFOF1 monomers and dimers formed by F1-F1 contacts (see Macromolecular docking section in Materials and Methods); (c) Relative residues of the fit shown in panel (a); (d) Relative residues of the fit shown in panel (b). The models of monomeric and dimeric cFOF1, shown in panels (a,b), contain detergent belts obtained from the experimental SAXS data and built by the program MEMPROT. Volume fractions of monomers and dimers of cFOF1, used in the models for approximation, are shown.
The models of monomeric and dimeric cFOF1 contain detergent belts obtained from the experimental SAXS data and built by a program MEMPROT for the monomeric AEX fraction (see Figure 1b). The models of cFOF1 dimers were constructed using the HDOCK protein–protein docking webserver [19]. Two types of restraints have been used, providing FO/FO or F1/F1 contacts, as described in the Macromolecular docking section in Materials and Methods.
An approximation of SAXS data with these models resulted in χ2 = 2.36 in the case of FO/FO dimers and χ2 = 1.20 for F1/F1 dimers with a fraction of dimeric cFOF1 96 ± 3% and 68 ± 2% for FO/FO and F1/F1 dimers, respectively (Figure 3a,b). The approximation by the model containing F1/F1 dimers showed better χ2 value and relative residues ΔI/σ at small Q, which are within 3 (Figure 3d), in contrast to the approximation by the model containing FO/FO dimers (Figure 3c). Therefore, the model comprising a mixture of a monomeric cFOF1 and dimers with F1/F1 contacts, presumably via δ-subunit, showed the best fit of the SAXS data.
In the case of the cFOF1 dimers with FO/FO contacts, Dm-m values for the top 10 HDOCK predictions (see Macromolecular docking section in Materials and Methods for details) were in the range of 174–201 Å. The only model (Figure 3a), which has Dm-m ≥ 201 Å (a lower limit of the range 225 ± 24 Å) (Equation (1)), resulted in χ2 = 2.36 and a fraction of dimers ~96% for fitting of SAXS data for purified cFOF1 samples at 450 mM NaCl.
In the case of the cFOF1 dimers with F1/F1 contacts, Dm-m values for the top 10 HDOCK predictions (see Macromolecular docking section in Materials and Methods for the details) were in the range of Dm-m 150–210 Å. All of these models, including one shown in Figure 3b (Model 4 in Figure S4), in addition to contacts between δ-subunits, demonstrated contacts between other subunits, including α-, β-, b- and b′-subunit. Five out of ten models have Dm-m ≥ 201 Å and demonstrated χ2 values in the range of 1.16–1.20 (see details in Figure S4) for fitting SAXS data for purified cFOF1 samples at 450 mM NaCl. Figure 3b shows one of these five models which corresponds to the best HDOCK confidence score (Figure S4). An additional validation of parameters of macromolecular interfaces estimated using the PDBePISA webserver [20] allowed us to asses this model as reasonable both in terms of HDOCK confidence score values and PDBePISA metric (see Figure S4 for the details).
2.4. A Possible Physiological Role of I-Shaped cFOF1 Dimers
Concerning physiological relevance, we hypothesize that an I-shaped type of dimerization might stabilize the stacks of thylakoid membrane areas by the possible connection of neighboring lamellae. It is known that a large number of ATP-synthases is located in stroma lamellae and grana membranes [3,21] (Figure 4a). The high density of molecules in these membranes leads to the formation of contacts between them and lateral dimerization (Figure 4b). At the same time, the distance between neighboring stroma lamellae is about 30 nm, which approximately fits the I-shaped cFOF1 dimer (Figure 4c,d,g). It might also indicate a possibility of another type of dimerization via the F1 part of cFOF1, which is schematically shown in Figure 4e,f, and might have already been observed in the literature (Figure 4g).
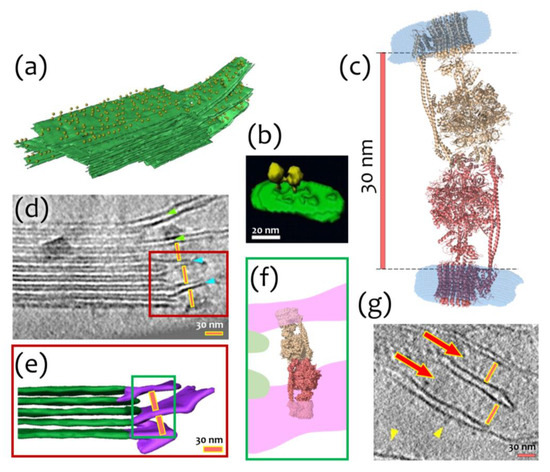
Figure 4.
Possible biological interpretation of observed cFOF1 I-shaped dimer: (a) Segmented subvolume of a thylakoid stack with connected stroma lamellae, cFOF1 are shown as yellow 12-nm spheres, cFOF1 is randomly distributed over stromal lamellae; (b) Surface rendering of a lateral cFOF1 dimer in isolated pea thylakoid membranes; (c) A model of an I-shaped dimer with F1/F1 interaction interface, presumably via δ-subunit, the distance between membrane FO parts of different cFOF1 monomers is about 30 nm; (d) Electron Tomography of Vitreous Spinach Chloroplast Sections, stacked grana and unstacked stroma thylakoid membranes are shown, the distance between neighboring stroma lamellae approximately fits the size of the I-shaped cFOF1 dimer, the stroma thylakoids, which are continuous with a grana thylakoid is shown with green arrowheads, the stroma thylakoids merged with two adjacent grana thylakoids—blue arrowheads, the region shown with a red box is described in details in Panel (e); (e) Surface representation of connections between grana (green) and stroma (purple) thylakoids, the distance between neighboring stroma lamellae is about 30 nm, the region shown with a green box is described in details in Panel (f); (f) Schematic representation of an I-shaped cFOF1 dimer in between of two neighboring stroma lamellae; (g) A part of a tomographic slice showing neighboring stroma lamellae, the distance between them approximately fits the size of an I-shaped ATP-synthase dimer, Pink lines are 30 nm size and demonstrate the possible fit of an I-shaped cFOF1 dimer between the neighbor lamellae. Presumably, ATP synthases shown with red arrows might be these I-shaped dimers. Yellow arrowheads show separate cFOF1. Panels (a,b,d,e,g) were adapted from [3] with modifications.
3. Discussion
Studies of chloroplast ATP synthases already showed evidence of dimerization of cFOF1 from plant chloroplasts [3,4,5,6]. This dimerization is believed to be non-specific and is shown to be lateral, which means that two monomers of cFOF1 are interacting in one membrane. There is also evidence of cFOF1 dimers for single-cell green algae [4,5], however, the authors report only Blue Native PAGE and the following SDS PAGE, therefore no structural data have been reported and the exact type of this interaction remains unclear.
Using SAXS studies of purified samples of cFOF1 from spinach chloroplasts we showed that the degree of oligomerization increases in response to changes in the NaCl concentration, both a decrease and an increase from the concentration between 250 and 300 mM NaCl where the dimeric fraction is minimal. We expected to obtain a model of lateral interaction similar to that reported in the literature [3], but this model did not satisfy the distance between the two cFOF1 monomers (~200 Å) experimentally obtained by the SAXS technique. Thus, we came to a model with co-linear F1/F1 interfaced cFOF1 dimers, so that the FO parts of the monomers are on the opposite sides of the dimer, having an I-shape if visualizing a detergent belt at the membrane FO part of each monomer. Surprisingly, the model with FO/FO′ interaction did not fit well with the experimental SAXS data (χ2 = 2.3), although it satisfied the distance between the two cFOF1 monomers, in contrast to the model with F1/F1′ interaction.
Commonly, I(Q) SAXS profiles of membrane proteins solubilized in detergent, including large protein complexes, have a local maximum at 0.1–0.2 Å−1 [10,11]. This local maximum typically reflects the influence of a detergent belt on the I(Q) data and the presence of this maximum indicates the necessity of considering the detergent belt in the model of the protein complex for an accurate fit. However, our experiments showed another behavior of the I(Q) SAXS profile (see Figure 1d). Interestingly, SAXS data obtained for another type of ATP-synthase (A-type) (SASBDB ID: SASDKK4) [22] also showed the absence of a local maximum I(Q). Therefore, such behavior of the SAXS I(Q) profiles can be observed in the case of membrane protein complexes with a detergent belt, e.g., F- and A-type ATP-synthases.
We showed the first structural evidence of the I-shaped type of dimerization of chloroplast F-ATP synthases from plants. Our model suggests F1/F1′ contacts between the cFOF1 monomers as it is shown by SAXS data approximation (χ2 = 1.24) and it satisfies the value of the distance between the centers of masses of monomers (Equation (1)), which is about 200 Å. This means that the contacts between monomers of cFOF1 should be at the edge of the F1 part to satisfy the conditions of a comparatively large distance which is about the size of the whole protein complex cFOF1. Taking these facts together we hypothesize that the F1/F1′ contacts between cFOF1 monomers presumably might be via the δ-subunit, which is at the top of the catalytic head (α3β3) of the enzyme.
In order to check the possibility of the F1/F1 interaction we performed a macromolecular docking using the HDOCK protein–protein docking webserver [19]. Considering the δ-subunit as a key subunit for cFOF1 dimer formation (see Macromolecular docking section in Materials and Methods for the details) we obtained models of a dimer, which, in addition to contacts between δ-subunit, showed contacts between other subunits, including α-, β-, b- and b′-subunit. The resulting models can be assessed as reasonable both in terms of HDOCK confidence score values and parameters of macromolecular interfaces estimated using the PDBePISA webserver [20] (see Figure S4).
To understand which region(s) of a δ-subunit can potentially play a role in the I-shaped dimer formation, we evaluated the intrinsic disorder propensity of this protein, since disordered regions are known to often contribute to the protein-protein interactions, being capable of undergoing binding-induced folding [23,24,25,26]. Furthermore, even when a crystal structure of a protein of interest is solved, one often can find noticeable levels of intrinsic disorder, since a very significant fraction of proteins in PDB contains regions with missing electron density, which are potentially intrinsically disordered [27,28]. As we already indicated earlier [1], based on the analysis of the reported crystal structure of cFOF1 from the spinach chloroplasts (see PDB ID: 6FKF), each subunit of this protein contains regions of missing electron density, including the chain δ with residues 1–70 and 250–257. This indicates that very significant parts of each cFOF1 subunit are expected to be disordered even within the assembled complex [1]. The idea of the presence of significant levels of disorder in the cFOF1 δ-subunit is further supported by Figure 5a showing a model 3D-structure generated for the full-length δ-subunit by AlphaFold [29,30], which is the most accurate AI-based platform for the protein structure prediction [31] and Figure 5b representing the disorder profile of this protein generated based on the outputs of six commonly used disorder predictors from the PONDR family, such as PONDR® VLXT [32], PONDR® VL3 [33], PONDR® VLS2 [34], and PONDR® FIT [35], as well as IUPred2 (Short) and IUPred2 (Long) [36]. Figure 5 clearly shows that the long N-terminal region of the cFOF1 δ-subunit is expected to be highly disordered. Utilization of the flDPnn webserver that predicts disorder, disorder-based functions, and disordered linkers [37], revealed that residues 1–3, 22–26, and 59–66 of the cFOF1 δ-subunit might be involved in the disorder-dependent protein-protein interactions.
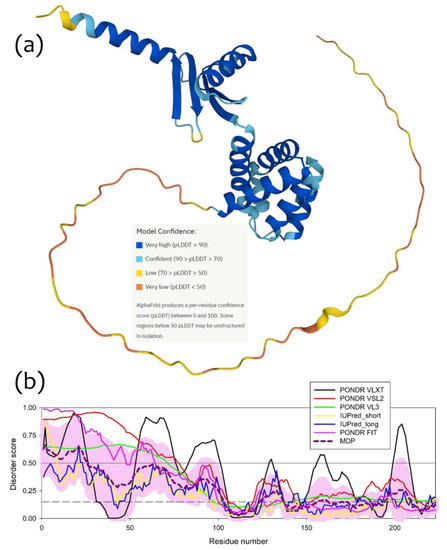
Figure 5.
Structure and disorder in the cFOF1 δ-subunit: (a) 3D structure of the cFOF1 δ-subunit generated by AlphaFold2; (b) Per-residue intrinsic disorder predisposition of the cFOF1 δ-subunit from the spinach chloroplasts. The intrinsic disorder profile was generated using the outputs of the Rapid Intrinsic Disorder Analysis Online (RIDAO) platform [38] that aggregates the results from a number of well-known disorder predictors, such as PONDR® VLXT, PONDR® VL3, PONDR® VLS2, PONDR® FIT, and IUPred2 (Short) and IUPred2 (Long) and also produces the mean disorder profile (MDP) and corresponding error distribution (pink shadow). The outputs of the evaluation of the per-residue disorder propensity by these tools are represented as real numbers between 1 (ideal prediction of disorder) and 0 (ideal prediction of order). A threshold of 0.5 is used to identify disordered residues and regions in query proteins. Residues with the disorder scores (DS) DS < 0.15 are considered as ordered, residues with 0.15 ≤ DS < 0.25 are taken as flexible, whereas residues with 0.25 ≤ DS < 0.5 are considered as moderately disordered.
We should notice that it is a great challenge to show directly the I-shaped structural organization of cFOF1 because of weak non-specific interactions between the cFOF1 monomers. For example, a recent study demonstrated a cryo-EM structure of the monomer of ATP synthase from spinach chloroplasts reconstituted into lipid nanodiscs [15]. However, the procedure of grid preparation could expose the sample to harsh conditions, which might break the F1/F1′ contacts.
Another way of obtaining high-resolution structural information is protein crystallography. However, the crystallization of ATP synthase, as well as large membrane protein complexes, is the key challenge in structural biology nowadays [1]. A crystallization by using lipids in meso phases (in meso method), e.g., lipid cubic phases (LCP), provides the crystals of membrane proteins in close to native conditions [39]. However, due to limitations of the diameters of LCP water channels the size of a water-exposed part of the protein complex is limited. Potentially perspective can be in bicelles crystallization [40,41], which was successfully applied for several membrane proteins with a large water-soluble part [42,43,44]. However, at the moment of this writing, there are no reported successful cases of in bicelles crystallization of an ATP synthase.
ATP synthase crystallization by using the vapor diffusion (VD) method, which allows for avoiding the protein size limitations, has another problem connected with the stabilization of membrane proteins in solution and fast kinetics of crystallization processes. Thus, crystal structures of almost full ATP synthase complexes were obtained only in six cases during the whole period of ATP synthase studies [45,46,47,48,49,50], which indicates a great challenge in obtaining crystals of ATP synthase. It is worth pointing out that even if a crystal of cFOF1 is grown it can also rearrange contacts between cFOF1 monomers.
In order to observe I-shaped dimerization we used the SAXS method, which allowed us to obtain structural information about cFOF1 monomers and their supramolecular arrangement in close to native conditions. SAXS does not require crystals or low temperatures, although, in the case of a mixture of monomers and oligomers, SAXS data should be carefully analyzed [11,51].
We acknowledge that the presence of I-shaped dimers of chloroplast ATP-synthases is a hypothesis, which, ideally, should be directly checked, but one should be very careful about samples preparation and accurately control the ionic strength of the solution (e.g., for electron microscopy studies). Our structural data obtained by SAXS, though SAXS is an indirect method, point towards the possible presence of such dimers in purified samples of the cFOF1, which integrity was proven by BN-PAGE.
In literature, there are debates about the possible physiological roles of dimers and higher oligomers of cFOF1 [3,52]. Some papers show evidence of the presence of dimers of cFOF1 in microorganisms [4,5,53]. Other papers claimed that these dimers might be only aggregates without specific structural arrangement or functional role [3,52]. Commonly, inhibition of ATP hydrolysis in chloroplasts occurs via a redox switch inserted into a γ-subunit of cFOF1 [15], however, it is not excluded that there might be another way of ATP synthesis/hydrolysis regulation.
The formation of I-shaped dimers might establish an indirect interaction between lamellae (especially close to grana) and help to stabilize thylakoid stacks. Such dimers might be observed in more or less native conditions by cryo-electron tomography (Figure 4) and even the distance between neighboring lamellae, in principle, allows such interaction. However, reported structural studies of chloroplasts were made during the light phase [3,54], leaving a possibility to find native I-shaped dimers of cFOF1 in similar experiments at dark. When studying the mesoscale of thylakoids [3], I-shaped interactions could be indistinguishable from monomeric ATP synthases next to each other on adjacent lamellae. Of course, our hypothesis requires direct experimental verification, where the focus of the research will be directed specifically to the study of the protein supramolecular organization of lamellae and the search for mechanisms for their possible stabilization, as well as cryo-EM experiments with a focus on dimers or pairs of chloroplast ATP synthases.
Our study is intended to draw attention to a possible new type of ATP synthase dimerization, which has not been described previously, because regardless of the nature of such an interaction, we obtained experimental evidence of its presence (SAXS data), and given the fact that the ionic strength is comparable in order of magnitude in vitro and in vivo, especially given the fluctuations in ionic strength in plant chloroplasts during the light/dark cycles [8,9], we hypothesize that I-shaped dimerization may be reflected in native conditions and play a biological role, such as stabilizing thylakoid stacks or regulating ATP synthesis/hydrolysis in plants.
4. Materials and Methods
4.1. cFOF1 Isolation and Purification
The protein complex cFOF1 was isolated and purified from spinach chloroplasts as described [12,13] with minor modifications. Briefly, thylakoid membranes were solubilized in a buffer containing 60 mM n-Octyl-β-D-glucopyranoside and 25 mM Sodium Cholate v/v = 1/1, centrifuged at 200,000× g for 1 h and a pellet was discarded. Then the solution underwent ammonium sulfate (AS) precipitation in the range of 1.2–1.8 M of AS. The precipitate at 1.8 M AS was either resuspended in a buffer containing ~2 mM tPCC-α-M, centrifuged at 45,000× g and a pellet was discarded, a solution after 0.45 μm filtering was uploaded onto a column with POROS™ 20 HQ Strong Anion Exchange Resin and anion exchange chromatography was performed in a gradient of NaCl (50–1000 mM) in a buffer: 30 mM HEPES (pH 8.0), 2 mM MgCl2, 0.04% (w/v) tPCC-α-M; or alternatively precipitate at 1.8 M AS was resuspended in a buffer containing 16 mM N-dodecyl β-D-maltoside (DDM), centrifuged in a sucrose gradient (15–50% w/v) at 200,000× g for 16 h, and the fraction between 29 and 36% (w/v) of sucrose was desalted and underwent red-120 dye-ligand chromatography. Both methods provided ATP synthase applicable for further structural studies.
4.2. Blue Native Polyacrylamide Gel Electrophoresis
BN-PAGE was performed as described [55,56]. Briefly, the samples of cFOF1 were analyzed in linear gradient polyacrylamide gel (from 4 to 14% (w/v) BN-PAGE, the separation gel was overlayed with a 3% (w/v) sample gel). An electrophoresis apparatus (SE 400, Cytiva, Marlborough, MA, USA) was used with a cathode buffer containing 0.002% Coomassie brilliant blue G-250 (Bio-Rad, Hercules, CA, USA), phoresis duration was 16 h. All native electrophoresis runs were performed at 100 V and at 4 °C. Hight molecular weight markers (HMW, #17044501, Cytiva, Marlborough, MA, USA) were used with the 10 μL load on a line.
4.3. Small-Angle Scattering Measurements
SANS experiments were performed on the YuMO spectrometer (IBR-2, Dubna, Russia) [57] with a two-detector system [58,59]. For SANS measurements, two samples of cFOF1 were prepared. The first sample was obtained by anion-exchange chromatography (AEX). The second sample was obtained by dialysis of AEX-purified protein in 93% D2O-buffer with 300 mM NaCl, 30 mM HEPES (pH ~8.0 [60]), 2 mM MgCl2, 0.04% (w/v) tPCC-α-M. 93% is the final concentration of D2O in a sample solution of purified cFOF1 because of the comparable volumes of the sample and the dialysis buffer. Nevertheless, 93% of D2O was enough for obtaining a satisfactory incoherent background for SANS data treatment. Each sample (V = 400 μL) was poured into a Helma quartz cuvette (path length 1 mm) and placed in the temperature-controlled sample chamber [59] for further SANS measurements. The total exposure time for each sample was 80 min.
SAXS measurements were performed on the instrument Rigaku MicroMax-007 HF (MIPT, Dolgoprudny, Russia), which was used and described previously [41,61]. SAXS data were obtained for six samples of ATP synthase. The first sample with a protein concentration of ~5 mg/mL was obtained by purification using anion-exchange chromatography (see Figure 1d). Other five samples were obtained by overnight dialysis in buffers containing 30 mM HEPES, 2 mM MgCl2, 0.04% (w/v) tPCC-α-M, and different NaCl concentrations: 150, 250, 300, 350, and 450 mM. Each sample (V = 30 μL) was poured into a glass capillary, which was sealed by gas burner or wax and placed into a vacuum chamber at a distance of 2.0 m from a multiwire gas-filled detector Rigaku ASM DTR Triton 200. All measurements were performed at room temperature. The thermal stability of cFOF1 at room temperature was checked by Dynamic Scanning Fluorimetry (see Section 4.6). See Table S1 for other details of SAXS measurements and data treatment.
4.4. Small-Angle Scattering Data Treatment
In the case of SAXS data, first, SAXSGui v. 2.15.01 software was used to convert 2D images of scattering intensity vs. transmitted momentum in reciprocal space Q = 4π sin(θ)/λ (where λ = 1.5405 Å (Kα of Cu), 2θ-a scattering angle) to 1D-profiles I(Q) by using a radial integration. For Q-calibration, a powder of silver behenate (AgBh) was used (Q = 0.1076 Å−1, d = 58.38 Å) [62]. In the case of SANS data, raw data were converted to one-dimensional data set I(Q) with a program SAS (version 5.1.5) [63]. Then, in both cases, a regularized model fit of I(Q) 1D-profiles was used for the calculation of a pair-distance distribution function P(R) by a program GNOM from the ATSAS v. 2.8.5 program package [64,65]. Visualizing of high-resolution models of cFOF1 dimers was performed by PyMOL v. 1.9 software [66]. MEMPROT v. 2.2 software [16] was used to fit an experimental SAXS data for AEX-purified cFOF1 using a high-resolution model of cFOF1 from spinach chloroplasts (PDB ID: 6FKF) with a pseudo-atomic model of the detergent belt surrounding its transmembrane part. For proper orienting of the cFOF1 model before running MEMPROT v. 2.2 (place the center of the transmembrane part at the origin (zero) and set the normal vector to the membrane plane along the z-axis) we used a PPM web server v. 2.0 [67]. A program OLIGOMER [68] from ATSAS v. 2.8.5 was used to fit experimental SAXS data from a two-component mixture of monomers and dimers of cFOF1 and to obtain the volume fractions of each component in the mixture. A program CRYSOL v.2.0 [69] (command line mode) from ATSAS v. 2.8.5 was used for evaluating the solution scattering from macromolecules in order to fit experimental SAXS data and/or prepare a set of form-factors for the subsequent run of the OLIGOMER program from ATSAS v. 2.8.5. See Table S1 for other details of SAXS measurements and data treatment.
4.5. Macromolecular Docking
For validation of possible F1/F1 interaction of cFOF1 monomers, we performed a macromolecular docking using HDOCK protein–protein docking webserver [70]. Considering the δ-subunit as a key subunit for dimer formation observed by SAXS, we used the following residue distance restraints: 1–257:d 1–257:d 50. Here, the letter “d” corresponds to the δ-subunit chain, “1–257” are numbers that cover all residues presented in δ-subunit, and the number “50” corresponds to the condition that residues 1–257 of a chain “d” on the receptor and on the ligand will be within 50 Å. Screening of the distance value in the range of 10–150 with a step = 10 shows the same docking results. The top 10 obtained HDOCK models, in addition to contacts between δ-subunit, demonstrated contacts between other subunits, including α, β, b, and b′, and showed the values of the HDOCK confidence score in the range 0.39–0.52 (Figure S4). Accordingly, to the description of HDOCK, it is considered that two molecules would be possible to bind when the confidence score is between 0.5 and 0.7. However, taking into account the comment of the authors: “the confidence score here should be used carefully due to its empirical nature”, the lower value of 0.5 is empirical and models with scores slightly below 0.5 can also be considered as possible and reasonable. Additionally, we checked the parameters of macromolecular dimerization interfaces using the PDBePISA webserver [20]. Results are shown in Figure S4.
In order to check the possibility of FO/FO interaction we also performed a macromolecular docking using an HDOCK webserver. Considering the c-subunit as a key subunit for dimer formation observed by SAXS, we used the residue distance restraints corresponding to 10 Å distance between residue 3 in c-subunits on the receptor and on the ligand (3:g 3:q 10). The only model that satisfies the condition Dm−m ≥ 201 Å (Equation (1)), has a high value of the HDOCK confidence score = 0.78 (Docking Score = −212.65), which corresponds to a high probability of the formation of such a contact. However, dimerization via FO/FO interaction was not confirmed using SAXS data.
4.6. Dynamic Scanning Fluorimetry
We used Prometheus Panta from NanoTemper Technologies (München, Germany) to check the thermostability of the protein complex cFOF1. Experiments were carried out in standard capillaries Prometheus NT.48 (Cat. # PR-C002). A temperature scan was conducted with a 4 °C/min slope for a temperature range of 15–75 °C, an excitation LED power was 70%. Thermal stability parameters (Tonset, Tm) were calculated by Panta Analysis software v. 1.2 (NanoTemper Technologies, München, Germany). Folding state transition was monitored by the ratio of fluorescence intensity at 330 nm and 350 nm as a function of temperature, where Tonset (onset temperature of thermal unfolding) was 51.6 °C and Tm (inflection temperature of thermal unfolding) was 66.9 °C (Figure S5). Thus, at 20 °C the stability of the protein was not disrupted.
Supplementary Materials
The following supporting information can be downloaded at: https://www.mdpi.com/article/10.3390/ijms241310720/s1.
Author Contributions
Conceptualization, A.V.V., Y.L.R., N.A.D. and V.I.; methodology, A.V.V., Y.L.R. and A.I.K.; software, E.V.Z., S.D.O., S.D.I. and A.V.M.; validation, S.D.O. and A.V.M.; formal analysis, Y.L.R., S.D.O., A.V.M. and V.N.U.; investigation, A.V.V., Y.L.R., M.Y.N., S.D.O., D.P.V., V.V.S., D.D.K., Y.S.S., Y.A.Z., E.A.D., A.Y.S., M.S.G., V.N.U. and I.S.O.; resources, A.V.V.; data curation, A.V.V., Y.L.R., E.V.Z. and V.N.U.; writing—original draft preparation, A.V.V. and Y.L.R.; writing—review and editing, A.V.V., Y.L.R., A.I.K., V.N.U., N.A.D. and V.I.; visualization, A.V.V., Y.L.R., E.V.Z., S.D.O., V.V.S., V.N.U. and A.V.M.; supervision, A.V.V., N.A.D., A.I.K. and V.I.; project administration, A.V.V.; funding acquisition, A.V.V., S.D.O., Y.L.R. and A.V.V. contributed equally and either has the right to list himself first in bibliographic documents. All authors have read and agreed to the published version of the manuscript.
Funding
Protein purification, SAXS measurements, and SAXS data analysis were performed with the support from the Russian Science Foundation (RSF) Project 22-74-00044. Yu.L.R. acknowledges the support from the Ministry of Science and Higher Education of the Russian Federation (agreement 075-03-2023-106, project FSMG-2021-0002). Small-angle neutron scattering studies were supported by the Ministry of Science and Higher Education of the Russian Federation (Grant No. 075-15-2021-1354).
Institutional Review Board Statement
Not applicable.
Informed Consent Statement
Not applicable.
Data Availability Statement
SAXS data of cFOF1 at different NaCl concentrations are deposited in SASBDB with the IDs: SASDRR8, SASDRS8, SASDRT8, SASDRU8, SASDRV8, SASDRW8.
Acknowledgments
We acknowledge the Frank Laboratory of Neutron Physics, Joint Institute for Nuclear Research, Dubna, Russia, for granting access to the small-angle neutron scattering spectrometer YuMO (IBR-2).
Conflicts of Interest
The authors declare no conflict of interest.
References
- Vlasov, A.V.; Osipov, S.D.; Bondarev, N.A.; Uversky, V.N.; Borshchevskiy, V.I.; Yanyushin, M.F.; Manukhov, I.V.; Rogachev, A.V.; Vlasova, A.D.; Ilyinsky, N.S.; et al. ATP synthase FOF1 structure, function, and structure-based drug design. Cell. Mol. Life Sci. 2022, 79, 179. [Google Scholar] [CrossRef]
- Kühlbrandt, W. Structure and Mechanisms of F-Type ATP Synthases. Annu. Rev. Biochem. 2019, 88, 515–549. [Google Scholar] [CrossRef]
- Daum, B.; Nicastro, D.; Austin, J.; McIntosh, J.R.; Kühlbrandt, W. Arrangement of Photosystem II and ATP Synthase in Chloroplast Membranes of Spinach and Pea. Plant Cell 2010, 22, 1299–1312. [Google Scholar] [CrossRef]
- Rexroth, S.; zu Tittingdorf, J.M.M.; Schwaßmann, H.J.; Krause, F.; Seelert, H.; Dencher, N.A. Dimeric H+-ATP synthase in the chloroplast of Chlamydomonas reinhardtii. Biochim. Biophys. Acta Bioenerg. 2004, 1658, 202–211. [Google Scholar] [CrossRef] [PubMed]
- Schwaßmann, H.J.; Rexroth, S.; Seelert, H.; Dencher, N.A. Metabolism controls dimerization of the chloroplast FoF1ATP synthase in Chlamydomonas reinhardtii. FEBS Lett. 2007, 581, 1391–1396. [Google Scholar] [CrossRef] [PubMed]
- Seelert, H.; Dencher, N.A. ATP synthase superassemblies in animals and plants: Two or more are better. Biochim. Biophys. Acta Bioenerg. 2011, 1807, 1185–1197. [Google Scholar] [CrossRef] [PubMed]
- Robinson, S.P.; Downton, W.J.S. Potassium, sodium, and chloride content of isolated intact chloroplasts in relation to ionic compartmentation in leaves. Arch. Biochem. Biophys. 1984, 228, 197–206. [Google Scholar] [CrossRef]
- Chow, W.; Wagner, A.; Hope, A. Light-dependent Redistribution of Ions in Isolated Spinach Chloroplasts. Funct. Plant Biol. 1976, 3, 853–861. [Google Scholar] [CrossRef]
- Nobel, P.S. Light-induced changes in the ionic content of chloroplasts in Pisum sativum. Biochim. Biophys. Acta (BBA) Bioenerg. 1969, 172, 134–143. [Google Scholar] [CrossRef]
- Ryzhykau, Y.L.; Orekhov, P.S.; Rulev, M.I.; Vlasov, A.V.; Melnikov, I.A.; Volkov, D.A.; Nikolaev, M.Y.; Zabelskii, D.V.; Murugova, T.N.; Chupin, V.V.; et al. Molecular model of a sensor of two-component signaling system. Sci. Rep. 2021, 11, 10774. [Google Scholar] [CrossRef]
- Ryzhykau, Y.L.; Vlasov, A.V.; Orekhov, P.S.; Rulev, M.I.; Rogachev, A.V.; Vlasova, A.D.; Kazantsev, A.S.; Verteletskiy, D.P.; Skoi, V.V.; Brennich, M.E.; et al. Ambiguities in and completeness of SAS data analysis of membrane proteins: The case of the sensory rhodopsin II–transducer complex. Acta Crystallogr. Sect. D Struct. Biol. 2021, 77, 1386–1400. [Google Scholar] [CrossRef] [PubMed]
- Vlasov, A.V. New Structural Insights in Chloroplast F1FO-ATP Synthases; RWTH Aachen University: Aachen, Germany, 2021. [Google Scholar]
- Vlasov, A.V.; Kovalev, K.V.; Marx, S.-H.; Round, E.S.; Gushchin, I.Y.; Polovinkin, V.A.; Tsoy, N.M.; Okhrimenko, I.S.; Borshchevskiy, V.I.; Büldt, G.D.; et al. Unusual features of the c-ring of F1FO ATP synthases. Sci. Rep. 2019, 9, 18547. [Google Scholar] [CrossRef] [PubMed]
- Balakrishna, A.M.; Seelert, H.; Marx, S.-H.; Dencher, N.A.; Grüber, G. Crystallographic structure of the turbine C-ring from spinach chloroplast F-ATP synthase. Biosci. Rep. 2014, 34, e00102. [Google Scholar] [CrossRef] [PubMed]
- Hahn, A.; Vonck, J.; Mills, D.J.; Meier, T.; Kühlbrandt, W. Structure, mechanism, and regulation of the chloroplast ATP synthase. Science 2018, 360, eaat4318. [Google Scholar] [CrossRef]
- Pérez, J.; Koutsioubas, A. Memprot: A program to model the detergent corona around a membrane protein based on SEC–SAXS data. Acta Crystallogr. D Biol. Crystallogr. 2015, 71, 86–93. [Google Scholar] [CrossRef]
- Feigin, L.A.; Svergun, D.I. Structure Analysis by Small-Angle X-ray and Neutron Scattering; George, W.T., Ed.; Spring: Berlin/Heidelberg, Germany, 1987; ISBN 978-1-4757-6624-0. [Google Scholar]
- Glatter, O.; Kratky, O. General Theory. Small-Angle X-ray Scatt. 1982, 36, 17–51. [Google Scholar]
- Yan, Y.; Tao, H.; He, J.; Huang, S.-Y. The HDOCK server for integrated protein–protein docking. Nat. Protoc. 2020, 15, 1829–1852. [Google Scholar] [CrossRef]
- Krissinel, E.; Henrick, K. Inference of Macromolecular Assemblies from Crystalline State. J. Mol. Biol. 2007, 372, 774–797. [Google Scholar] [CrossRef]
- Minges, A.; Groth, G. Structure and supramolecular architecture of chloroplast ATP synthase. Adv. Bot. Res. 2020, 96, 27–74. [Google Scholar] [CrossRef]
- Molodenskiy, D.S.; Svergun, D.I.; Mertens, H.D.T. MPBuilder: A PyMOL Plugin for Building and Refinement of Solubilized Membrane Proteins Against Small Angle X-ray Scattering Data. J. Mol. Biol. 2021, 433, 166888. [Google Scholar] [CrossRef]
- Disfani, F.M.; Hsu, W.-L.; Mizianty, M.J.; Oldfield, C.J.; Xue, B.; Dunker, A.K.; Uversky, V.N.; Kurgan, L. MoRFpred, a computational tool for sequence-based prediction and characterization of short disorder-to-order transitioning binding regions in proteins. Bioinformatics 2012, 28, i75–i83. [Google Scholar] [CrossRef]
- Cheng, Y.; Oldfield, C.J.; Meng, J.; Romero, P.; Uversky, V.N.; Dunker, A.K. Mining α-Helix-Forming Molecular Recognition Features with Cross Species Sequence Alignments. Biochemistry 2007, 46, 13468–13477. [Google Scholar] [CrossRef] [PubMed]
- Oldfield, C.J.; Cheng, Y.; Cortese, M.S.; Romero, P.; Uversky, V.N.; Dunker, A.K. Coupled Folding and Binding with α-Helix-Forming Molecular Recognition Elements. Biochemistry 2005, 44, 12454–12470. [Google Scholar] [CrossRef] [PubMed]
- Garner, E.; Romero, P.; Dunker, A.; Brown, C.; Obradovic, Z. Predicting Binding Regions within Disordered Proteins. Genome Inf. Ser. Workshop Genome Inf. 1999, 10, 41–50. [Google Scholar]
- DeForte, S.; Uversky, V.N. Resolving the ambiguity: Making sense of intrinsic disorder when PDB structures disagree. Protein Sci. 2016, 25, 676–688. [Google Scholar] [CrossRef] [PubMed]
- Le Gall, T.; Romero, P.R.; Cortese, M.; Uversky, V.N.; Dunker, A.K. Intrinsic Disorder in the Protein Data Bank. J. Biomol. Struct. Dyn. 2007, 24, 325–341. [Google Scholar] [CrossRef]
- Varadi, M.; Anyango, S.; Deshpande, M.; Nair, S.; Natassia, C.; Yordanova, G.; Yuan, D.; Stroe, O.; Wood, G.; Laydon, A.; et al. AlphaFold Protein Structure Database: Massively expanding the structural coverage of protein-sequence space with high-accuracy models. Nucleic Acids Res. 2022, 50, D439–D444. [Google Scholar] [CrossRef]
- Jumper, J.; Evans, R.; Pritzel, A.; Green, T.; Figurnov, M.; Ronneberger, O.; Tunyasuvunakool, K.; Bates, R.; Žídek, A.; Potapenko, A.; et al. Highly accurate protein structure prediction with AlphaFold. Nature 2021, 596, 583–589. [Google Scholar] [CrossRef]
- Kryshtafovych, A.; Schwede, T.; Topf, M.; Fidelis, K.; Moult, J. Critical assessment of methods of protein structure prediction (CASP)—Round XIV. Proteins 2021, 89, 1607–1617. [Google Scholar] [CrossRef]
- Romero, P.; Obradovic, Z.; Li, X.; Garner, E.C.; Brown, C.J.; Dunker, A.K. Sequence Complexity of Disordered Protein. Proteins 2001, 42, 38–48. [Google Scholar] [CrossRef]
- Peng, K.; Radivojac, P.; Vucetic, S.; Dunker, A.K.; Obradovic, Z. Length-dependent prediction of protein intrinsic disorder. BMC Bioinform. 2006, 7, 208. [Google Scholar] [CrossRef]
- Peng, K.; Vucetic, S.; Radivojac, P.; Brown, C.J.; Dunker, A.K.; Obradovic, Z. Optimizing long intrinsic disorder predictors with protein evolutionary information. J. Bioinform. Comput. Biol. 2005, 3, 35–60. [Google Scholar] [CrossRef]
- Xue, B.; Dunbrack, R.L.; Williams, R.W.; Dunker, A.K.; Uversky, V.N. PONDR-FIT: A meta-predictor of intrinsically disordered amino acids. Biochim. Biophys. Acta 2010, 1804, 996–1010. [Google Scholar] [CrossRef]
- Mészáros, B.; Erdős, G.; Dosztányi, Z. IUPred2A: Context-dependent prediction of protein disorder as a function of redox state and protein binding. Nucleic Acids Res. 2018, 46, W329–W337. [Google Scholar] [CrossRef]
- Hu, G.; Katuwawala, A.; Wang, K.; Wu, Z.; Ghadermarzi, S.; Gao, J.; Kurgan, L. flDPnn: Accurate intrinsic disorder prediction with putative propensities of disorder functions. Nat. Commun. 2021, 12, 4438. [Google Scholar] [CrossRef]
- Dayhoff, G.W.; Uversky, V.N. Rapid prediction and analysis of protein intrinsic disorder. Protein Sci. 2022, 31, e4496. [Google Scholar] [CrossRef] [PubMed]
- Caffrey, M.; Cherezov, V. Crystallizing membrane proteins using lipidic mesophases. Nat. Protoc. 2009, 4, 706–731. [Google Scholar] [CrossRef] [PubMed]
- Faham, S.; Bowie, J.U. Bicelle crystallization: A new method for crystallizing membrane proteins yields a monomeric bacteriorhodopsin structure. J. Mol. Biol. 2002, 316, 1–6. [Google Scholar] [CrossRef] [PubMed]
- Murugova, T.N.; Ivankov, O.I.; Ryzhykau, Y.L.; Soloviov, D.V.; Kovalev, K.V.; Skachkova, D.V.; Round, A.; Baeken, C.; Ishchenko, A.V.; Volkov, O.A.; et al. Mechanisms of membrane protein crystallization in ‘bicelles’. Sci. Rep. 2022, 12, 11109. [Google Scholar] [CrossRef]
- Morgan, J.L.W.; McNamara, J.T.; Zimmer, J. Mechanism of activation of bacterial cellulose synthase by cyclic di-GMP. Nat. Struct. Mol. Biol. 2014, 21, 489–496. [Google Scholar] [CrossRef]
- Noinaj, N.; Kuszak, A.J.; Gumbart, J.C.; Lukacik, P.; Chang, H.; Easley, N.C.; Lithgow, T.; Buchanan, S.K. Structural insight into the biogenesis of β-barrel membrane proteins. Nature 2013, 501, 385–390. [Google Scholar] [CrossRef] [PubMed]
- Lin, D.Y.-W.; Huang, S.; Chen, J. Crystal structures of a polypeptide processing and secretion transporter. Nature 2015, 523, 425–430. [Google Scholar] [CrossRef]
- Stock, D.; Leslie, A.G.W.; Walker, J.E. Molecular Architecture of the Rotary Motor in ATP Synthase. Science 1999, 286, 1700–1705. [Google Scholar] [CrossRef] [PubMed]
- Dautant, A.; Velours, J.; Giraud, M.-F. Crystal Structure of the Mg·ADP-inhibited State of the Yeast F1c10-ATP Synthase. J. Biol. Chem. 2010, 285, 29502–29510. [Google Scholar] [CrossRef]
- Watt, I.N.; Montgomery, M.G.; Runswick, M.J.; Leslie, A.G.W.; Walker, J.E. Bioenergetic cost of making an adenosine triphosphate molecule in animal mitochondria. Proc. Natl. Acad. Sci. USA 2010, 107, 16823–16827. [Google Scholar] [CrossRef] [PubMed]
- Giraud, M.-F.; Paumard, P.; Sanchez, C.; Brèthes, D.; Velours, J.; Dautant, A. Rotor architecture in the yeast and bovine F1-c-ring complexes of F-ATP synthase. J. Struct. Biol. 2012, 177, 490–497. [Google Scholar] [CrossRef] [PubMed]
- Morales-Rios, E.; Montgomery, M.G.; Leslie, A.G.W.; Walker, J.E. Structure of ATP synthase from Paracoccus denitrificans determined by X-ray crystallography at 4.0 Å resolution. Proc. Natl. Acad. Sci. USA 2015, 112, 13231–13236. [Google Scholar] [CrossRef]
- Hahn, A.; Parey, K.; Bublitz, M.; Mills, D.J.; Zickermann, V.; Vonck, J.; Kühlbrandt, W.; Meier, T. Structure of a Complete ATP Synthase Dimer Reveals the Molecular Basis of Inner Mitochondrial Membrane Morphology. Mol. Cell 2016, 63, 445–456. [Google Scholar] [CrossRef]
- Zabelskii, D.V.; Vlasov, A.V.; Ryzhykau, Y.L.; Murugova, T.N.; Brennich, M.; Soloviov, D.V.; Ivankov, O.I.; Borshchevskiy, V.I.; Mishin, A.V.; Rogachev, A.V.; et al. Ambiguities and completeness of SAS data analysis: Investigations of apoferritin by SAXS/SANS EID and SEC-SAXS methods. J. Phys. Conf. Ser. 2018, 994, 012017. [Google Scholar] [CrossRef]
- Böttcher, B.; Gräber, P. The structure of the H+-ATP synthase from chloroplasts and its subcomplexes as revealed by electron microscopy. Biochim. Biophys. Acta Bioenerg. 2000, 1458, 404–416. [Google Scholar] [CrossRef]
- Vlasov, A.V.; Kovalev, Y.S.; Utrobin, P.K.; Ryzhykau, Y.L.; Frolov, F.V.; Zinovev, E.V.; Rogachev, A.V.; Kuklin, A.I.; Gordeliy, V.I. Photo-Voltage of Highly-Oriented Bacteriorhodopsin in Purple Membranes: Possibilities for Bio Solar Cells. Optoelectron. Adv. Mater. Rapid Commun. 2017, 11, 65–67. [Google Scholar]
- Engel, B.D.; Schaffer, M.; Cuellar, L.K.; Villa, E.; Plitzko, J.M.; Baumeister, W. Native architecture of the Chlamydomonas chloroplast revealed by in situ cryo-electron tomography. eLife 2015, 4, e04889. [Google Scholar] [CrossRef] [PubMed]
- Schägger, H.; von Jagow, G. Blue native electrophoresis for isolation of membrane protein complexes in enzymatically active form. Anal. Biochem. 1991, 199, 223–231. [Google Scholar] [CrossRef] [PubMed]
- Džinić, T.; Hartwig, S.; Lehr, S.; Dencher, N.A. Oxygen and differentiation status modulate the effect of X-ray irradiation on physiology and mitochondrial proteome of human neuroblastoma cells. Arch. Physiol. Biochem. 2016, 122, 257–265. [Google Scholar] [CrossRef] [PubMed]
- Kuklin, A.I.; Ivankov, O.I.; Rogachev, A.V.; Soloviov, D.V.; Islamov, A.K.; Skoi, V.V.; Kovalev, Y.S.; Vlasov, A.V.; Ryzhykau, Y.L.; Soloviev, A.G.; et al. Small-Angle Neutron Scattering at the Pulsed Reactor IBR-2: Current Status and Prospects. Crystallogr. Rep. 2021, 66, 231–241. [Google Scholar] [CrossRef]
- Kuklin, A.I.; Islamov, A.K.; Gordeliy, V.I. Scientific Reviews: Two-Detector System for Small-Angle Neutron Scattering Instrument. Neutron News 2005, 16, 16–18. [Google Scholar] [CrossRef]
- Kuklin, A.I.; Soloviov, D.V.; Rogachev, A.V.; Utrobin, P.K.; Kovalev, Y.S.; Balasoiu, M.; Ivankov, O.I.; Sirotin, A.P.; Murugova, T.N.; Petukhova, T.B.; et al. New opportunities provided by modernized small-angle neutron scattering two-detector system instrument (YuMO). J. Phys. Conf. Ser. 2011, 291, 012013. [Google Scholar] [CrossRef]
- Covington, A.K.; Paabo, M.; Robinson, R.A.; Bates, R.G. Use of the glass electrode in deuterium oxide and the relation between the standardized pD (paD) scale and the operational pH in heavy water. Anal. Chem. 1968, 40, 700–706. [Google Scholar] [CrossRef]
- Tsoraev, G.V.; Protasova, E.A.; Klimanova, E.A.; Ryzhykau, Y.L.; Kuklin, A.I.; Semenov, Y.S.; Ge, B.; Li, W.; Qin, S.; Friedrich, T.; et al. Anti-Stokes fluorescence excitation reveals conformational mobility of the C-phycocyanin chromophores. Struct. Dyn. 2022, 9, 054701. [Google Scholar] [CrossRef]
- Nyam-Osor, M.; Soloviov, D.; Kovalev, Y.S.; Zhigunov, A.; Rogachev, A.V.; Ivankov, O.I.; Erhan, R.V.; Kuklin, A.I. Silver behenate and silver stearate powders for calibration of SAS instruments. J. Phys. Conf. Ser. 2012, 351, 012024. [Google Scholar] [CrossRef]
- Soloviev, A.G.; Solovjeva, T.M.; Ivankov, O.I.; Soloviov, D.; Rogachev, A.V.; Kuklin, A.I. SAS program for two-detector system: Seamless curve from both detectors. J. Phys. Conf. Ser. 2017, 848, 012020. [Google Scholar] [CrossRef]
- Manalastas-Cantos, K.; Konarev, P.V.; Hajizadeh, N.R.; Kikhney, A.G.; Petoukhov, M.V.; Molodenskiy, D.S.; Panjkovich, A.; Mertens, H.D.T.; Gruzinov, A.; Borges, C.; et al. ATSAS 3.0: Expanded functionality and new tools for small-angle scattering data analysis. J. Appl. Crystallogr. 2021, 54, 343–355. [Google Scholar] [CrossRef]
- Franke, D.; Petoukhov, M.V.; Konarev, P.V.; Panjkovich, A.; Tuukkanen, A.; Mertens, H.D.T.; Kikhney, A.G.; Hajizadeh, N.R.; Franklin, J.M.; Jeffries, C.M.; et al. ATSAS 2.8: A comprehensive data analysis suite for small-angle scattering from macromolecular solutions. J. Appl. Crystallogr. 2017, 50, 1212–1225. [Google Scholar] [CrossRef] [PubMed]
- DeLano, W.L. Pymol: An Open-Source Molecular Graphics Tool. CCP4 Newsl. Protein Crystallogr. 2002, 40, 82–92. [Google Scholar]
- Lomize, M.A.; Pogozheva, I.D.; Joo, H.; Mosberg, H.I.; Lomize, A.L. OPM database and PPM web server: Resources for positioning of proteins in membranes. Nucleic Acids Res. 2012, 40, D370–D376. [Google Scholar] [CrossRef] [PubMed]
- Konarev, P.V.; Volkov, V.V.; Sokolova, A.V.; Koch, M.H.J.; Svergun, D.I. PRIMUS: A Windows PC-based system for small-angle scattering data analysis. J. Appl. Crystallogr. 2003, 36, 1277–1282. [Google Scholar] [CrossRef]
- Svergun, D.I. Determination of the regularization parameter in indirect-transform methods using perceptual criteria. J. Appl. Crystallogr. 1992, 25, 495–503. [Google Scholar] [CrossRef]
- Ferrè, F.; Clote, P. DiANNA: A web server for disulfide connectivity prediction. Nucleic Acids Res. 2005, 33, W230–W232. [Google Scholar] [CrossRef] [PubMed]
Disclaimer/Publisher’s Note: The statements, opinions and data contained in all publications are solely those of the individual author(s) and contributor(s) and not of MDPI and/or the editor(s). MDPI and/or the editor(s) disclaim responsibility for any injury to people or property resulting from any ideas, methods, instructions or products referred to in the content. |
© 2023 by the authors. Licensee MDPI, Basel, Switzerland. This article is an open access article distributed under the terms and conditions of the Creative Commons Attribution (CC BY) license (https://creativecommons.org/licenses/by/4.0/).