
Comparative Proteomic Analysis of Toxoplasma gondii RH Wild-Type and Four SRS29B (SAG1) Knock-Out Clones Reveals Significant Differences between Individual Strains


 , , and
Abstract
1. Introduction
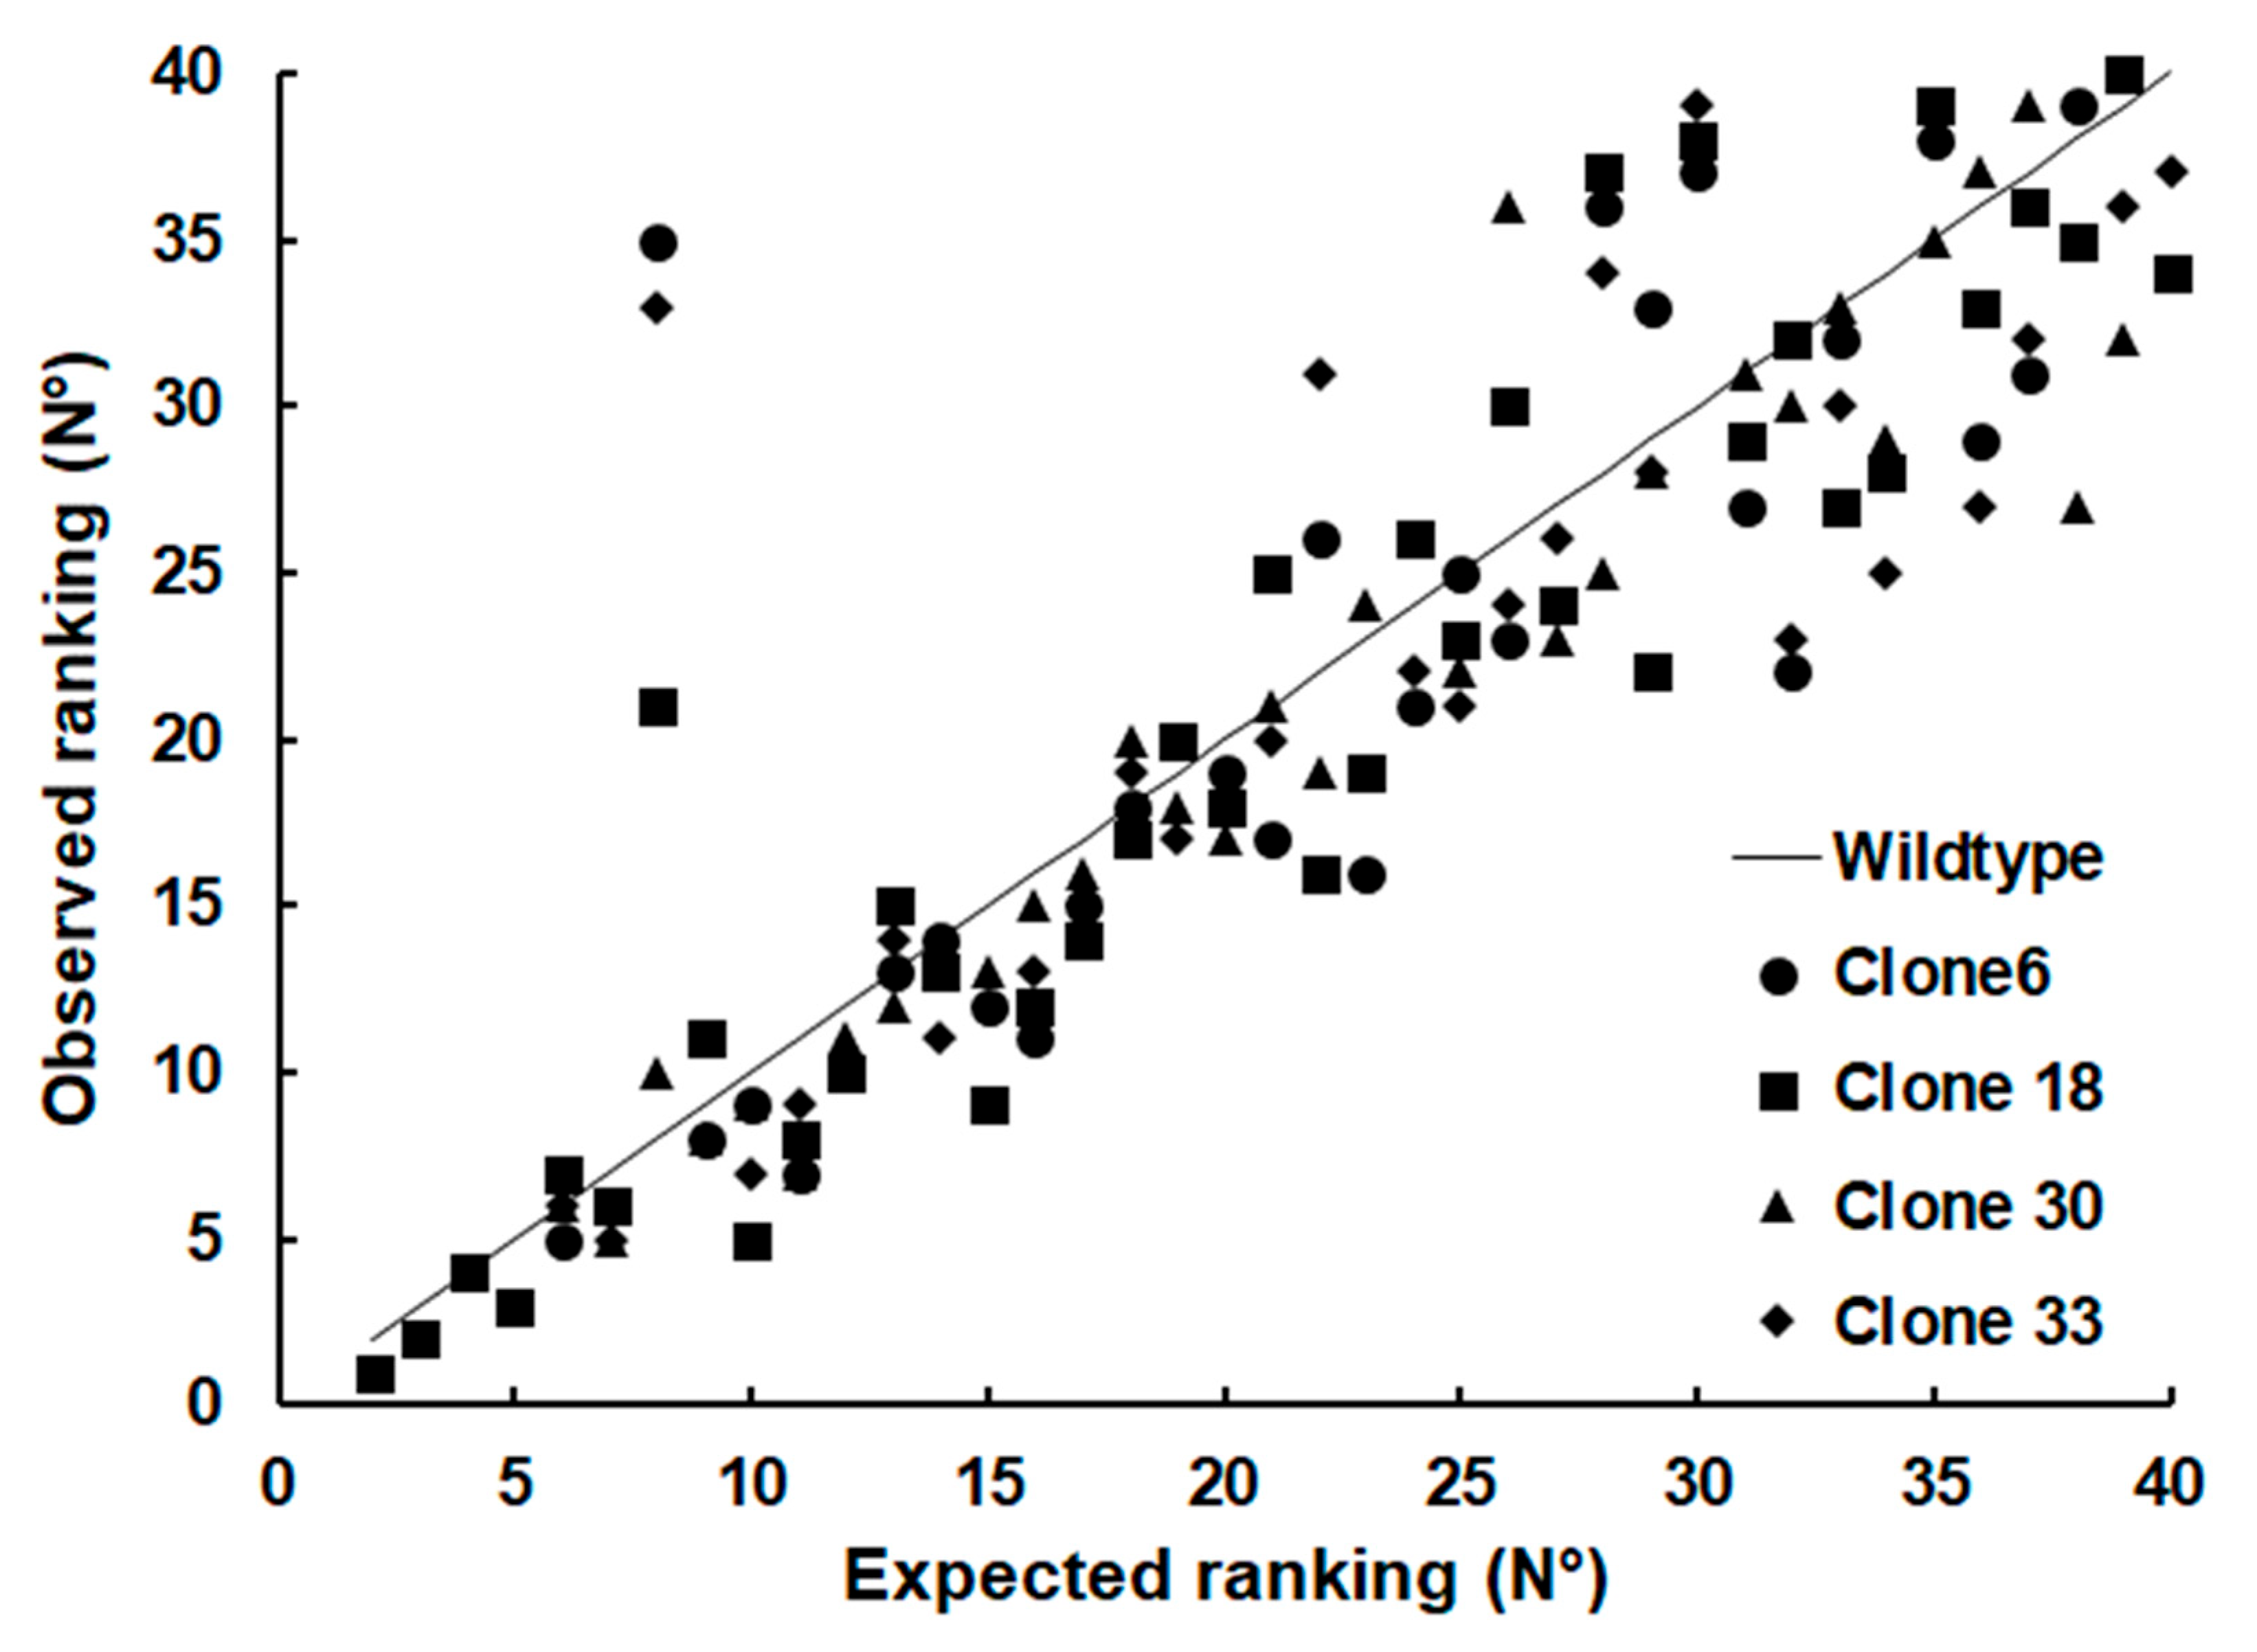
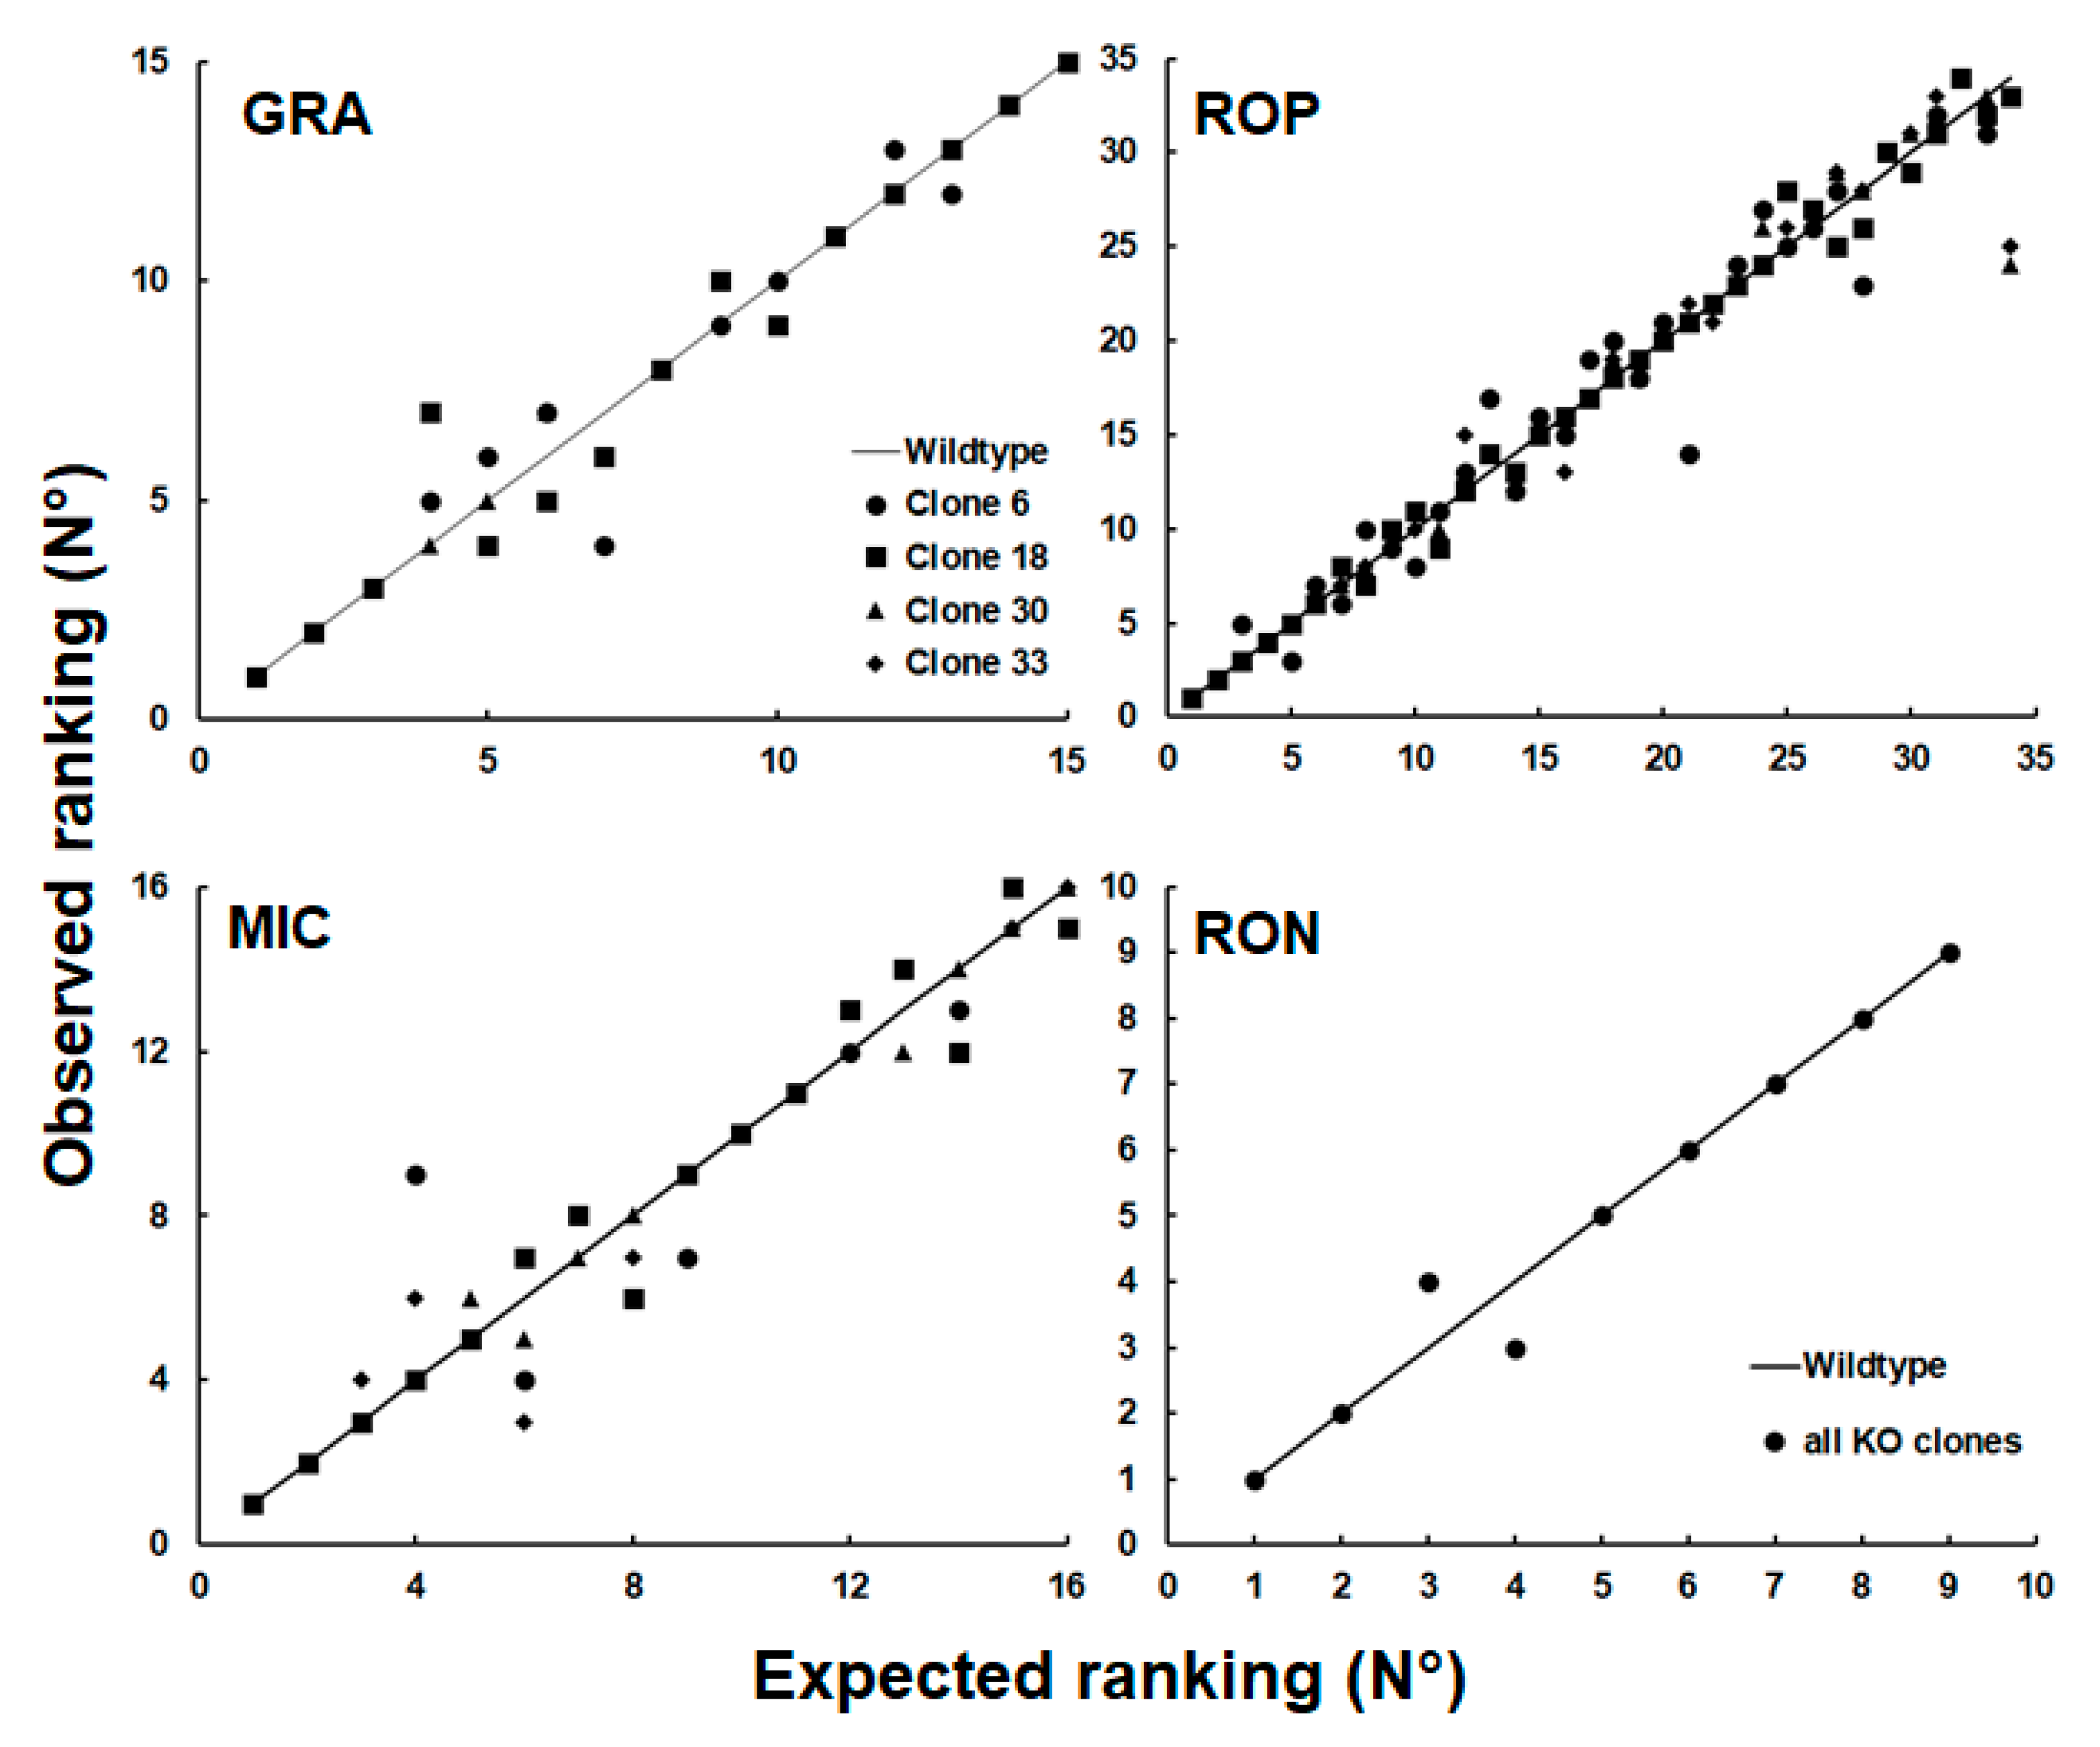
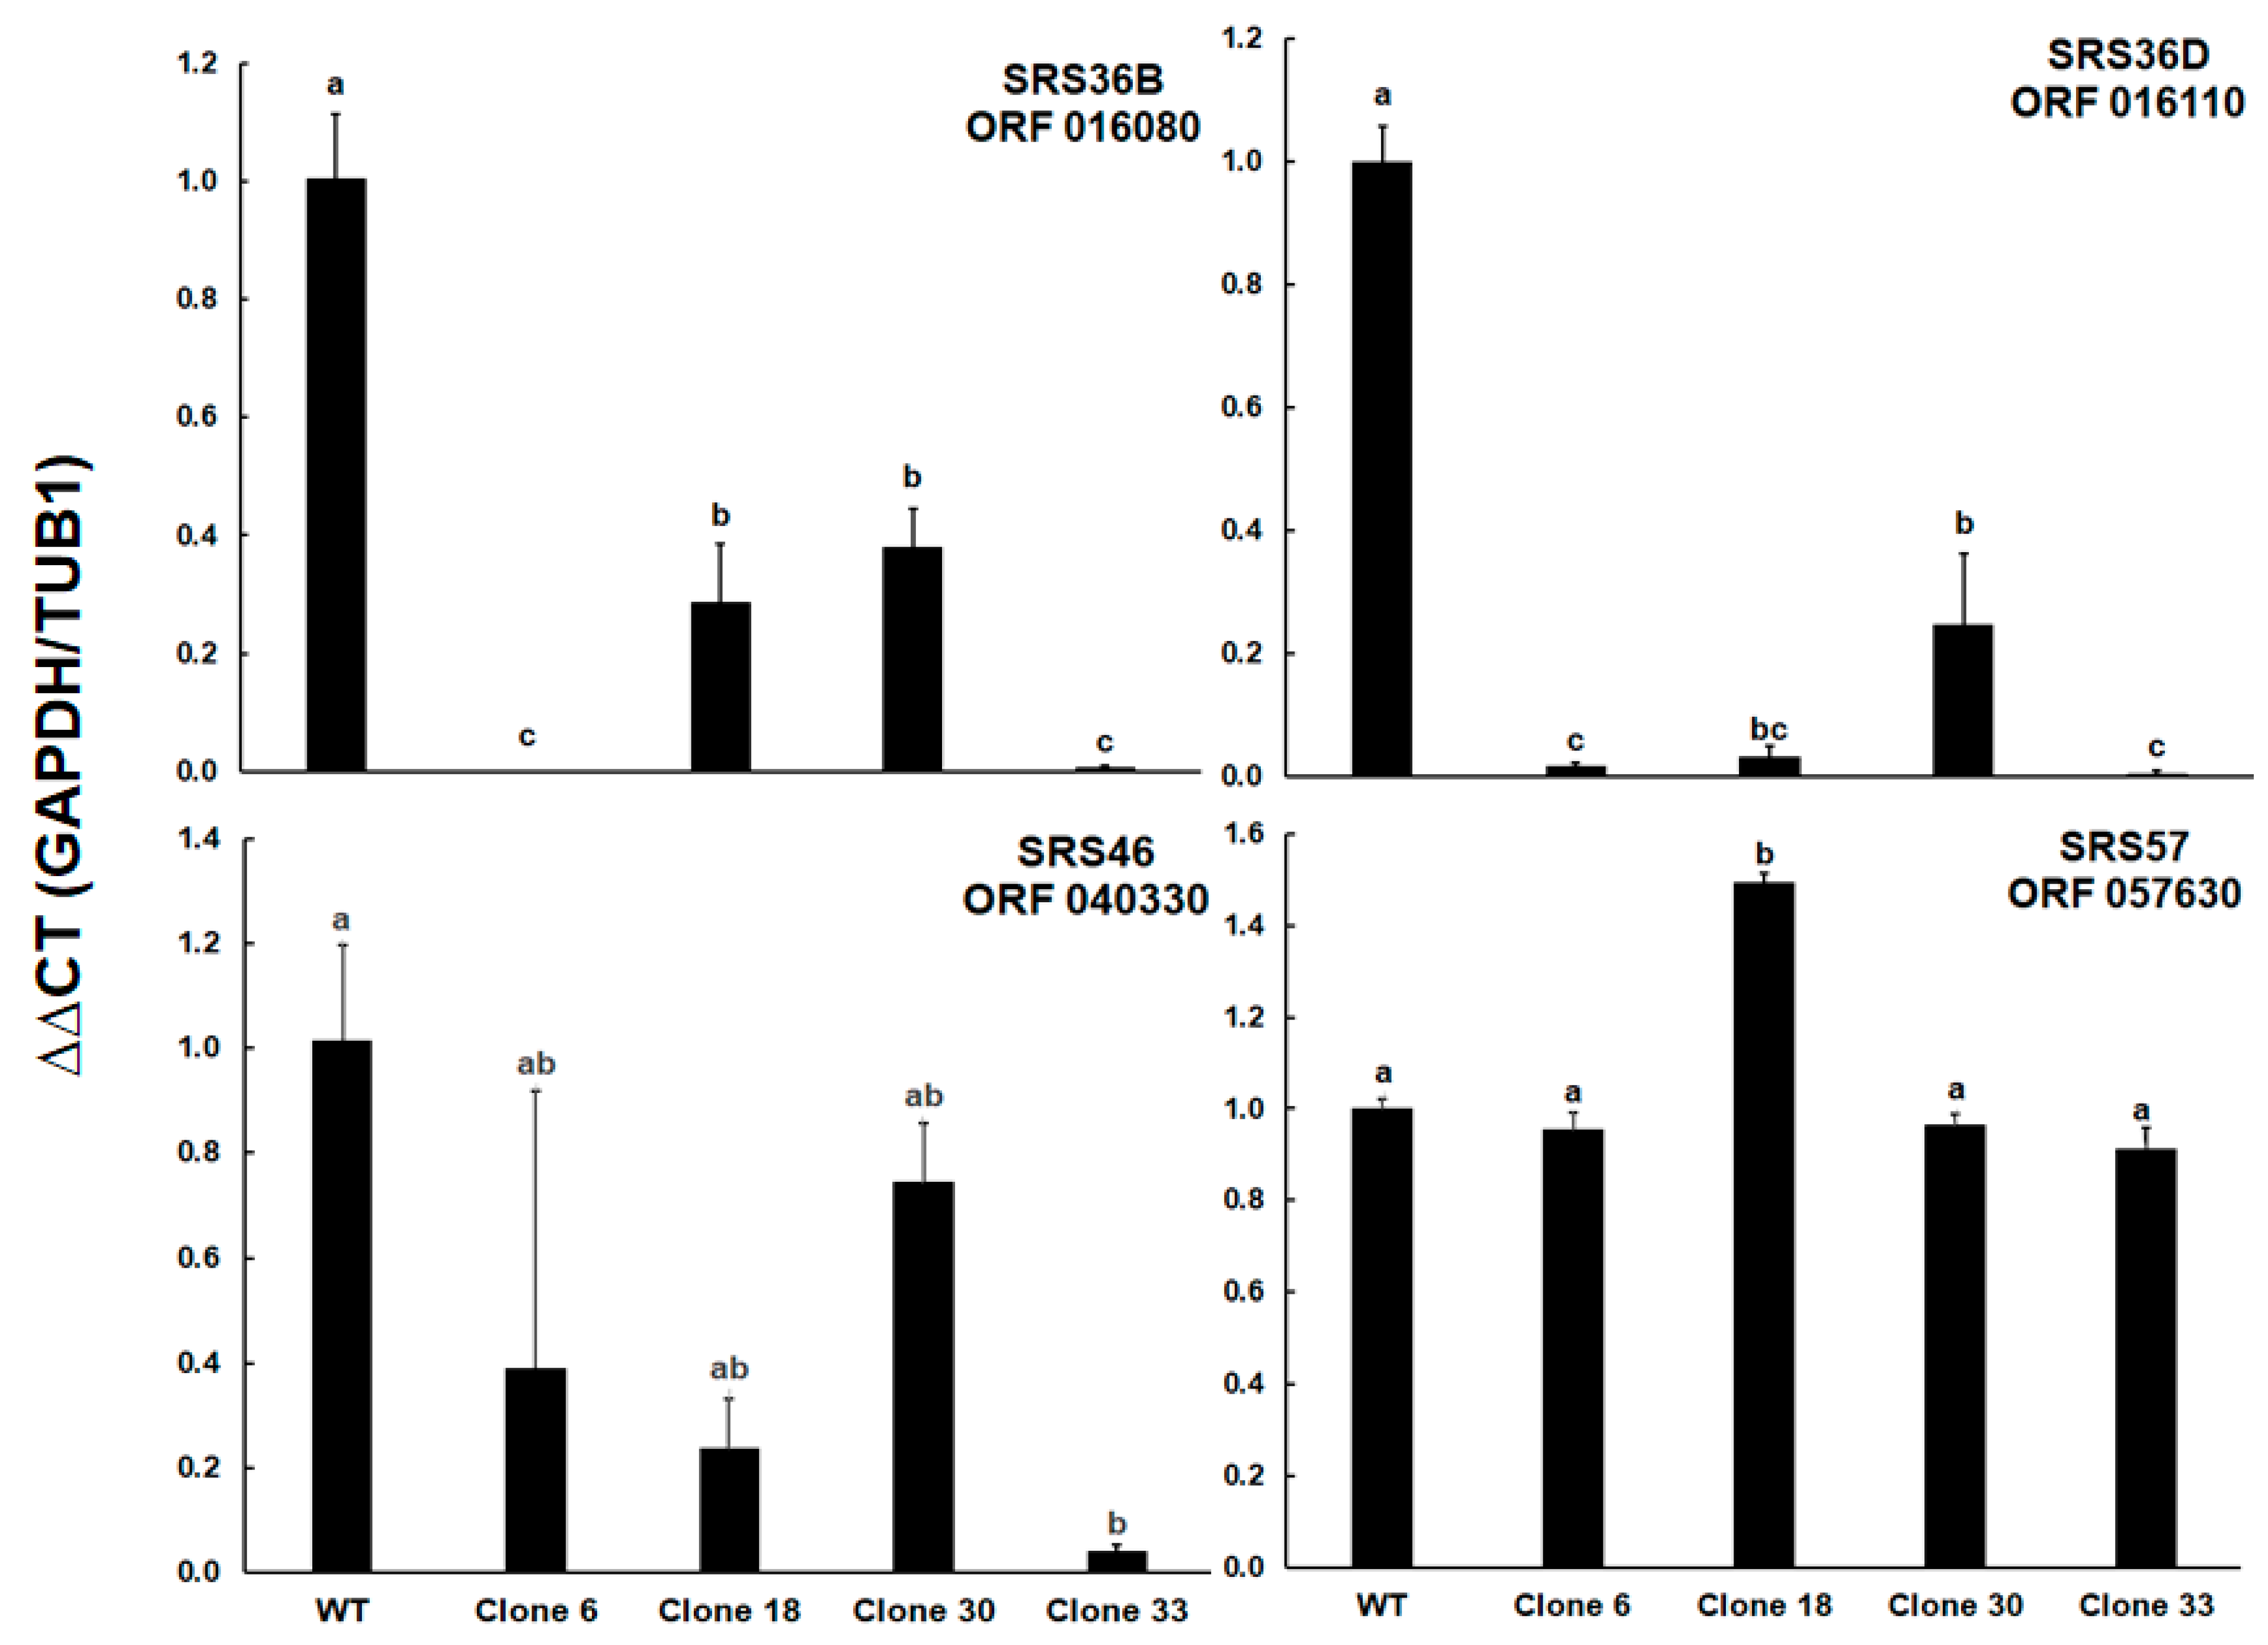
2. Results
3. Discussion
4. Materials and Methods
4.1. Chemicals
4.2. Host Cell Culture, Maintenance, and Purification of Tachyzoites
4.3. Proteomics
4.4. Quantification of Transcripts by Multiplex TaqMan—qPCR
4.5. Statistics
Supplementary Materials
Author Contributions
Funding
Institutional Review Board Statement
Informed Consent Statement
Data Availability Statement
Conflicts of Interest
References
- Dubey, J.P. Toxoplasmosis of Animals and Humans, 2nd ed.; CRC Press: Boca Raton, FL, USA, 2010; p. xvii. 313p. [Google Scholar]
- Dubey, J.P. Outbreaks of clinical toxoplasmosis in humans: Five decades of personal experience, perspectives and lessons learned. Parasit. Vectors 2021, 14, 263. [Google Scholar] [CrossRef] [PubMed]
- Howe, D.K.; Sibley, L.D. Toxoplasma gondii comprises three clonal lineages: Correlation of parasite genotype with human disease. J. Infect. Dis. 1995, 172, 1561–1566. [Google Scholar] [CrossRef] [PubMed]
- Darde, M.L. Toxoplasma gondii, “new” genotypes and virulence. Parasite 2008, 15, 366–371. [Google Scholar] [CrossRef] [PubMed]
- Kim, K.; Weiss, L.M. Toxoplasma gondii: The model apicomplexan. Int. J. Parasitol. 2004, 34, 423–432. [Google Scholar] [CrossRef] [PubMed]
- Sidik, S.M.; Hackett, C.G.; Tran, F.; Westwood, N.J.; Lourido, S. Efficient genome engineering of Toxoplasma gondii using CRISPR/Cas9. PLoS ONE 2014, 9, e100450. [Google Scholar] [CrossRef]
- Sidik, S.M.; Huet, D.; Ganesan, S.M.; Huynh, M.H.; Wang, T.; Nasamu, A.S.; Thiru, P.; Saeij, J.P.; Carruthers, V.B.; Niles, J.C.; et al. A Genome-wide CRISPR screen in Toxoplasma Identifies essential apicomplexan genes. Cell 2016, 166, 1423–1435.e12. [Google Scholar] [CrossRef]
- Heller, M.; Braga, S.; Müller, N.; Müller, J. Transfection with plasmid causing stable expression of a foreign gene affects general proteome pattern in Giardia lamblia trophozoites. Front. Cell. Infect. Microbiol. 2020, 10, 602756. [Google Scholar] [CrossRef]
- Templeton, T.J. Whole-genome natural histories of apicomplexan surface proteins. Trends Parasitol. 2007, 23, 205–212. [Google Scholar] [CrossRef]
- Lekutis, C.; Ferguson, D.J.; Grigg, M.E.; Camps, M.; Boothroyd, J.C. Surface antigens of Toxoplasma gondii: Variations on a theme. Int. J. Parasitol. 2001, 31, 1285–1292. [Google Scholar] [CrossRef]
- Tomavo, S. The major surface proteins of Toxoplasma gondii: Structures and functions. Curr. Top. Microbiol. Immunol. 1996, 219, 45–54. [Google Scholar] [CrossRef]
- Boothroyd, J.C.; Hehl, A.; Knoll, L.J.; Manger, I.D. The surface of Toxoplasma: More and less. Int. J. Parasitol. 1998, 28, 3–9. [Google Scholar] [CrossRef]
- Jung, C.; Lee, C.Y.; Grigg, M.E. The SRS superfamily of Toxoplasma surface proteins. Int. J. Parasitol. 2004, 34, 285–296. [Google Scholar] [CrossRef]
- Wasmuth, J.D.; Pszenny, V.; Haile, S.; Jansen, E.M.; Gast, A.T.; Sher, A.; Boyle, J.P.; Boulanger, M.J.; Parkinson, J.; Grigg, M.E. Integrated bioinformatic and targeted deletion analyses of the SRS gene superfamily identify SRS29C as a negative regulator of Toxoplasma virulence. MBio 2012, 3, e00321-12. [Google Scholar] [CrossRef]
- Kasper, L.H. Isolation and characterization of a monoclonal anti-P30 antibody resistant mutant of Toxoplasma gondii. Parasite Immunol. 1987, 9, 433–445. [Google Scholar] [CrossRef]
- Hänggeli, K.P.A.; Hemphill, A.; Müller, N.; Schimanski, B.; Olias, P.; Müller, J.; Boubaker, G. Single- and duplex TaqMan-quantitative PCR for determining the copy numbers of integrated selection markers during site-specific mutagenesis in Toxoplasma gondii by CRISPR-Cas9. PLoS ONE 2022, 17, e0271011. [Google Scholar] [CrossRef]
- Kim, S.K.; Karasov, A.; Boothroyd, J.C. Bradyzoite-specific surface antigen SRS9 plays a role in maintaining Toxoplasma gondii persistence in the brain and in host control of parasite replication in the intestine. Infect. Immun. 2007, 75, 1626–1634. [Google Scholar] [CrossRef]
- Dzierszinski, F.; Mortuaire, M.; Cesbron-Delauw, M.F.; Tomavo, S. Targeted disruption of the glycosylphosphatidylinositol-anchored surface antigen SAG3 gene in Toxoplasma gondii decreases host cell adhesion and drastically reduces virulence in mice. Mol. Microbiol. 2000, 37, 574–582. [Google Scholar] [CrossRef]
- Frenal, K.; Soldati-Favre, D. Plasticity and redundancy in proteins important for Toxoplasma invasion. PLoS Pathog. 2015, 11, e1005069. [Google Scholar] [CrossRef]
- Possenti, A.; Di Cristina, M.; Nicastro, C.; Lunghi, M.; Messina, V.; Piro, F.; Tramontana, L.; Cherchi, S.; Falchi, M.; Bertuccini, L.; et al. Functional characterization of the thrombospondin-related paralogous proteins rhoptry discharge factors 1 and 2 unveils phenotypic plasticity in Toxoplasma gondii rhoptry exocytosis. Front. Microbiol. 2022, 13, 899243. [Google Scholar] [CrossRef]
- Theisen, T.C.; Boothroyd, J.C. Transcriptional signatures of clonally derived Toxoplasma tachyzoites reveal novel insights into the expression of a family of surface proteins. PLoS ONE 2022, 17, e0262374. [Google Scholar] [CrossRef]
- Prucca, C.G.; Rivero, F.D.; Luján, H.D. Regulation of antigenic variation in Giardia lamblia. Annu. Rev. Microbiol. 2011, 65, 611–630. [Google Scholar] [CrossRef] [PubMed]
- Müller, J.; Braga, S.; Uldry, A.C.; Heller, M.; Müller, N. Comparative proteomics of three Giardia lamblia strains: Investigation of antigenic variation in the post-genomic era. Parasitology 2020, 147, 1008–1018. [Google Scholar] [CrossRef] [PubMed]
- Müller, J.; Braga, S.; Heller, M.; Müller, N. Resistance formation to nitro drugs in Giardia lamblia: No common markers identified by comparative proteomics. Int. J. Parasitol. Drugs Drug. Resist. 2019, 9, 112–119. [Google Scholar] [CrossRef] [PubMed]
- Pays, E.; Vanhamme, L.; Perez-Morga, D. Antigenic variation in Trypanosoma brucei: Facts, challenges and mysteries. Curr. Opin. Microbiol. 2004, 7, 369–374. [Google Scholar] [CrossRef]
- Stockdale, C.; Swiderski, M.R.; Barry, J.D.; McCulloch, R. Antigenic variation in Trypanosoma brucei: Joining the DOTs. PLoS Biol. 2008, 6, e185. [Google Scholar] [CrossRef]
- Jublot, D.; Cavailles, P.; Kamche, S.; Francisco, D.; Fontinha, D.; Prudencio, M.; Guichou, J.F.; Labesse, G.; Sereno, D.; Loeuillet, C. A histone deacetylase (HDAC) inhibitor with pleiotropic in vitro anti-Toxoplasma and anti-Plasmodium activities controls acute and chronic Toxoplasma infection in mice. Int. J. Mol. Sci. 2022, 23, 3254. [Google Scholar] [CrossRef]
- Sullivan, W.J., Jr.; Hakimi, M.A. Histone mediated gene activation in Toxoplasma gondii. Mol. Biochem. Parasitol. 2006, 148, 109–116. [Google Scholar] [CrossRef]
- Nardelli, S.C.; Che, F.Y.; Silmon de Monerri, N.C.; Xiao, H.; Nieves, E.; Madrid-Aliste, C.; Angel, S.O.; Sullivan, W.J., Jr.; Angeletti, R.H.; Kim, K.; et al. The histone code of Toxoplasma gondii comprises conserved and unique posttranslational modifications. MBio 2013, 4, e00922-13. [Google Scholar] [CrossRef]
- Li, B. DNA double-strand breaks and telomeres play important roles in Trypanosoma brucei antigenic variation. Eukaryot. Cell. 2015, 14, 196–205. [Google Scholar] [CrossRef]
- Li, B.; Zhao, Y. Regulation of antigenic variation by Trypanosoma brucei telomere proteins depends on their unique DNA binding activities. Pathogens 2021, 10, 967. [Google Scholar] [CrossRef]
- Eraly, S.A. Striking differences between knockout and wild-type mice in global gene expression variability. PLoS ONE 2014, 9, e97734. [Google Scholar] [CrossRef]
- Slavov, N. Learning from natural variation across the proteomes of single cells. PLoS Biol. 2022, 20, e3001512. [Google Scholar] [CrossRef]
- Westermann, L.; Li, Y.; Gocmen, B.; Niedermoser, M.; Rhein, K.; Jahn, J.; Cascante, I.; Scholer, F.; Moser, N.; Neubauer, B.; et al. Wildtype heterogeneity contributes to clonal variability in genome edited cells. Sci. Rep. 2022, 12, 18211. [Google Scholar] [CrossRef]
- Winzer, P.; Müller, J.; Aguado-Martinez, A.; Rahman, M.; Balmer, V.; Manser, V.; Ortega-Mora, L.M.; Ojo, K.K.; Fan, E.; Maly, D.J.; et al. In vitro and in vivo effects of the bumped kinase inhibitor 1294 in the related cyst-forming apicomplexans Toxoplasma gondii and Neospora caninum. Antimicrob. Agents Chemother. 2015, 59, 6361–6374. [Google Scholar] [CrossRef]
- Cox, J.; Mann, M. MaxQuant enables high peptide identification rates, individualized p.p.b.-range mass accuracies and proteome-wide protein quantification. Nat. Biotechnol. 2008, 26, 1367–1372. [Google Scholar] [CrossRef]
- Vandesompele, J.; De Preter, K.; Pattyn, F.; Poppe, B.; Van Roy, N.; De Paepe, A.; Speleman, F. Accurate normalization of real-time quantitative RT-PCR data by geometric averaging of multiple internal control genes. Genome Biol. 2002, 3, research0034. [Google Scholar] [CrossRef]
- Hellemans, J.; Mortier, G.; De Paepe, A.; Speleman, F.; Vandesompele, J. qBase relative quantification framework and software for management and automated analysis of real-time quantitative PCR data. Genome Biol. 2007, 8, R19. [Google Scholar] [CrossRef]
- Müller, J.; Schlange, C.; Heller, M.; Uldry, A.C.; Braga-Lagache, S.; Haynes, R.K.; Hemphill, A. Proteomic characterization of Toxoplasma gondii ME49 derived strains resistant to the artemisinin derivatives artemiside and artemisone implies potential mode of action independent of ROS formation. Int. J. Parasitol. Drugs Drug. Resist. 2022, 21, 1–12. [Google Scholar] [CrossRef]
- R_Core_Team. R: A Language and Environment for Statistical Computing, version 1.1.456; RStudio, Inc.: Vienna, Austria, 2012. [Google Scholar]


| GN | Annotation | WT/C6 | WT/C18 | WT/C30 | WT/C33 |
|---|---|---|---|---|---|
| TGRH88_003360 | Unspecified product (putative transmembrane protein) | down | down | ||
| TGRH88_006930 | SAG-related sequence srs16C | up | |||
| TGRH88_012840 | Unspecified product (putative transmembrane protein) | up | |||
| TGRH88_016110 | SAG-related sequence srs36D | up | up | up | |
| TGRH88_017250 | Unspecified product | up | up | up | |
| TGRH88_021190 | cAMP-dependent protein kinase | down | |||
| TGRH88_029080 | Gamma-glutamyl hydrolase | up | |||
| TGRH88_029100 | Unspecified product | down | |||
| TGRH88_036500 | Multi-pass transmembrane protein | down | down | ||
| TGRH88_042260 | Unspecified product (putative transmembrane protein) | up | up | ||
| TGRH88_043760 | Putative translation elongation and release factors (GTPase) | down | down | ||
| TGRH88_046380 | Histone lysine methyltransferase set1 | down | down | ||
| TGRH88_055240 | Putative myosin heavy chain | up | |||
| TGRH88_062920 | Bifunctional dihydrofolate reductase—thymidylate synthase | down | down | ||
| TGRH88_073870 | MaoC family domain-containing protein | up | |||
| TGRH88_077450 | SAG-related sequence srs29B | up | up | up | up |
| GN | Annotation | C6/C18 | C6/C30 | C6/C33 | C18/C30 | C18/C33 | C30/C33 |
|---|---|---|---|---|---|---|---|
| TGRH88_004120 | PRELI family protein | up | |||||
| TGRH88_006930 | SAG-related sequence srs16C | up | up | ||||
| TGRH88_008350 | Unspecified product (putative iron-sulfur cluster assembly accessory protein) | down | down | ||||
| TGRH88_009830 | SAG-related sequence srs19F | down | |||||
| TGRH88_012840 | Unspecified product (Putative transmembrane protein) | down | down | ||||
| TGRH88_014370 | Cathepsin cpc1 | down | up | ||||
| TGRH88_016110 | SAG-related sequence srs36D | down | down | down | up | ||
| TGRH88_016870 | Unspecified product | up | up | ||||
| TGRH88_017250 | Unspecified product | down | down | ||||
| TGRH88_021190 | cAMP-dependent protein kinase | up | up | up | |||
| TGRH88_046380 | Histone lysine methyltransferase set1 | down | down | ||||
| TGRH88_076630 | Unspecified product | down |
| Gene ID (ToxoDB) | Gene Name | Forward Primer (5′-3′) | Reverse Primer (5′-3′) | Taqman-Hydrolysis Probe |
|---|---|---|---|---|
| TGRH88_014440 | Glyceraldehyde-3-phosphate dehydro-genase GAPDH1 | TGGAGGTTTTGGCGAT | ATGGCAGTTGGCTCCTT | HEX-TACCCCGGC-GAAGTCAGC-BHQ |
| TGRH88_016080 | SAG-related sequence SRS36B (SAG 5D) | TCAGAGGTCACCCGAGT | TCGTGGTGTCCTGGTTAC | FAM-CACCATCCAG-GTGATCCAGCC-BHQ |
| TGRH88_016110 | SAG-related sequence SRS36D (SAG 5C) | TGTATGGCAAGCGACAA | TGTGCACACCTCAGTTAGTG | FAM-ACGGGCAG-AGTGACAGCGCA-BHQ |
| TGRH88_040330 | SAG-related sequence SRS46 | TGCAGACGTACCGACAGT | TCTGCGTCGACGAGTG | FAM-TCTTCGCTG-CGGCAAAAACTT-BHQ |
| TGRH88_055140 | Alpha tubulin TUBA1 | GACGCCTTCAACACCTTC | TTGTTCGCAGCATCCT | Cy5-TTACCGCCA-CCTGTTCCACCC-BHQ |
| TGRH88_057630 | SAG-related sequence SRS57 (SAG 3) | TGCGATCTTGGGAAC | TCAGGGTGCTCTTTGTTC | FAM-TGTTCGTCG-CCGCAGGGA-BHQ |
Disclaimer/Publisher’s Note: The statements, opinions and data contained in all publications are solely those of the individual author(s) and contributor(s) and not of MDPI and/or the editor(s). MDPI and/or the editor(s) disclaim responsibility for any injury to people or property resulting from any ideas, methods, instructions or products referred to in the content. |
© 2023 by the authors. Licensee MDPI, Basel, Switzerland. This article is an open access article distributed under the terms and conditions of the Creative Commons Attribution (CC BY) license (https://creativecommons.org/licenses/by/4.0/).
Share and Cite
Hänggeli, K.P.A.; Hemphill, A.; Müller, N.; Heller, M.; Uldry, A.-C.; Braga-Lagache, S.; Müller, J.; Boubaker, G. Comparative Proteomic Analysis of Toxoplasma gondii RH Wild-Type and Four SRS29B (SAG1) Knock-Out Clones Reveals Significant Differences between Individual Strains. Int. J. Mol. Sci. 2023, 24, 10454. https://doi.org/10.3390/ijms241310454
Hänggeli KPA, Hemphill A, Müller N, Heller M, Uldry A-C, Braga-Lagache S, Müller J, Boubaker G. Comparative Proteomic Analysis of Toxoplasma gondii RH Wild-Type and Four SRS29B (SAG1) Knock-Out Clones Reveals Significant Differences between Individual Strains. International Journal of Molecular Sciences. 2023; 24(13):10454. https://doi.org/10.3390/ijms241310454
Chicago/Turabian StyleHänggeli, Kai Pascal Alexander, Andrew Hemphill, Norbert Müller, Manfred Heller, Anne-Christine Uldry, Sophie Braga-Lagache, Joachim Müller, and Ghalia Boubaker. 2023. "Comparative Proteomic Analysis of Toxoplasma gondii RH Wild-Type and Four SRS29B (SAG1) Knock-Out Clones Reveals Significant Differences between Individual Strains" International Journal of Molecular Sciences 24, no. 13: 10454. https://doi.org/10.3390/ijms241310454
APA StyleHänggeli, K. P. A., Hemphill, A., Müller, N., Heller, M., Uldry, A.-C., Braga-Lagache, S., Müller, J., & Boubaker, G. (2023). Comparative Proteomic Analysis of Toxoplasma gondii RH Wild-Type and Four SRS29B (SAG1) Knock-Out Clones Reveals Significant Differences between Individual Strains. International Journal of Molecular Sciences, 24(13), 10454. https://doi.org/10.3390/ijms241310454