1. Introduction
The constant accumulation of local myocardial damage cannot be compensated for by the regenerative potential of the heart tissue [
1], which leads to high mortality from cardiovascular diseases. Transplants made from cultured cardiac cells are believed to play an important role in regenerative medicine of the heart [
2,
3,
4], particularly in repairing the cardiac conduction system [
5,
6]. The easiest and simplest way to introduce healthy cells into the damaged area is to inject solitary cells in the form of cell suspension [
7]. Unfortunately, after numerous studies, this method appeared to be much less efficient than expected [
4,
8]. The injection of stem cells does not guarantee that they will differentiate into right cardiomyocytes, and the injection of cultured cardiac cells does not guarantee their survival and functional merging with the host tissue. In the latter case, the main problem is that solitary cardiomyocytes lose their structure and become very fragile and unexcitable. As known from cell culture [
9], the cell adhesion and recovery of cardiomyocytes’ structure and excitability take several hours, during which the cells should rest and not be subjected to any mechanical stress. The latter condition is difficult to fulfill in living cardiac tissue. The way to overcome fragility problems is to deal with cells on a scaffold, allowing them to maintain their structure. However, common cultured cell patches [
10] are hardly appropriate for such a simple method of delivery as injection and require surgical intervention.
Thus, there are two common ways of delivering cells to the host heart tissue: the injection of dispersed solitary cells and the integration of cells as part of tissue-engineered constructs. The most significant difference between these two transplantation methods is host–graft electrophysiological coupling [
11]. Gerbin et al. demonstrated host–graft electrophysiological coupling with dispersed cells, but not tissue-engineered constructs, confirmed with optical mapping experiments [
12]. Dispersed cells can directly come into contact with excitable host tissues [
12]. Therefore, dispersed cells easily become a substrate of arrhythmia due to the prolonged and stochastic formation of electromechanical coupling. For example, the injection of suspended iPSC-CMs into allogenic heart tissue (non-human primate, histocompatible primate-induced pluripotent stem cells) results in acts of prolonged ventricular tachycardia [
8,
13,
14]. In contrast, the engraftment of iPSC-CM patches did not lead to the formation of stable electrophysiological coupling between the rat heart and the graft [
12,
15,
16]. The peak presence of arrhythmias after cell injection is usually observed in the first two days after transplantation [
8,
10,
13], which is close to the above estimate of the time required for the formation of gap junction (GJ) coupling [
9]. Furthermore, dispersed cells can leave the injection site and have a low survival rate [
7], whereas a significant proportion of the cells do not graft into the host tissue [
17]. The latter is due to the fact that the continuous presence of adhesion sites is necessary for the normal functioning of iPSC-CM, and in its absence, the viability and functionality of the cardiomyocyte are limited [
18]. On the contrary, tissue-engineered constructs demonstrate improved survival and cell viability after transplantation, but the shape and size of the graft impose restrictions on the method of delivery to the host tissue and challenge electrophysiological coupling [
15,
16]. In addition to the approaches mentioned, there is an intermediate option in the form of using hydrogels to hold the delivered cells. However, similarly, the cells surrounded by the gel cannot fully integrate into the electromechanical syncytium of the host heart tissue and between each other [
19,
20]. As a result, there is controversy as to when the presence of a scaffold is required for cell survival but makes cell delivery invasive and prevents electromechanical coupling. In addition, the complete absence of a scaffold or any substrate makes electro-mechanical coupling chaotic because of the restoration of cell excitability and prolonged formation of GJ, accompanied by engraftment arrhythmias.
We propose a method employing the advantages of a polymer nanofiber scaffold with the feasibility of cell delivery. For this purpose, the supporting cell “scaffold” represents a number of isolated fragments of polymer nanofibers capable of carrying solitary cells. As a material for polymeric nanofibers, we used poly-L-lactide (PLLA), a biocompatible and biodegradable polymer widely used for medical purposes: the resulting fibers turned out to be thinner than native fibroin fibers [
21], and human fibronectin (HFN) was used to optimize the adhesive properties of the fiber surface [
18]. It should be noted that making the optimal choice of polymer composition is a complex and global task [
22]. An approach to a polymer nanofiber as a sufficient cell substrate has been previously demonstrated in vitro. Polymer fiber fragments of subcellular sizes coated with HFN are a satisfactory substrate for the cultivation of both neonatal rat ventricular cardiomyocytes (NRVMs) and induced pluripotent stem cell-derived cardiomyocytes (iPSC-CMs) [
18,
21], with the latter having the greatest potential for clinical use [
4]. Cell adhesion to a single fiber leads to the appearance of a remarkable “sheath” structure, enveloping fiber, thus substantially increasing the contact zone and eventually forcing the cell to attach to itself [
21]. Thus, the scaffold moves “inside” the cell (topologically remaining outside of the cell membrane, which is curved in such a way as to create an invagination to envelop the fiber with the cell). The main consequence of this cell–fiber interaction is the restoration of excitability and mechanical contractions [
21] in a solitary cell that were lost during enzymatic methods of cell isolation [
9,
18]. As a result, the cell injection solution, instead of a suspension of solitary cardiomyocytes, represents a suspension of cells on compact carriers. Here, we directly tested the ability of novel nanofiber polymer scaffolds to mechanically bind transplanted cardiomyocytes (NRVMs) and the host tissue, as well as to become a sufficient substrate for cell adhesion, thereby replacing cell culture isolation with the isolation of fragmented polymer fibers. This allows cells to be delivered without enzymatic disaggregation. The latter allows cells to restore excitability and contractility until the moment of transplantation, which initiates and accelerates the process of electrophysiological merging with the recipient tissue.
The current study aimed to address two principal gaps in knowledge. First, the proposed molecular machine design is an attempt to resolve the mentioned tensions between scaffold-based cell delivery approaches and noninvasive single-cell injection without scaffold. The interaction of cells and proposed scaffolds differs from previous approaches in that the necessary polymer mass (nanofiber) is wrapped by the cell. When the diameter of such a mobile scaffold is minimized, the graft also acquires the main strength inherent in conventional solitary cells—direct contact with the host tissue. The combination of the simultaneous presence of the scaffold while eliminating its usual shortcomings is the achievement of the proposed approach. The fundamental feasibility of such a delivery method opens up a new way to circumvent the traditional problems of cardiac tissue cell therapy. The second question to be addressed is: What will be the scenario of electromechanical coupling? The presence of a mobile microscaffold makes the cell excitable by the time of first contact with the tissue, in contrast to the solitary cell [
18]. Recent studies have actualized the ephatic mechanism of electromechanical coupling (without GJ formation), both during excitation conduction through the tissue [
23] and in the context of host–graft interactions [
13]. An ephatic coupling (EPC) becomes possible at the moment when both elements are excitable [
11]. Previously, we suggested that the wrapped fiber microcarrier could become a catalyst for the rapid emergence of EPC prior to the formation of GJs [
18]. In this work, we set out to observe directly whether the occurrence of EPC in vivo is possible. For this purpose, we created the conditions for observing electromechanical synchronization immediately after the moment of cell delivery (rather than at a daily interval, as in other studies involving optical mapping [
8,
10]). Achieving host–graft electromechanical synchronization before GJ formation may be the key to eliminating acute engraftment arrhythmias.
3. Discussion
The inability of transplanted myocardial cells to establish a reliable electrical connection with the recipient heart represents one of the main problems in the development of a successful procedure for cardiac muscle regeneration and repair. The manifestation of this problem depends on the method of delivery of cultured cells. The injection of a cell suspension could lead to prolonged ventricular tachycardia during engraftment [
8,
13], and the attachment of cultured tissue flaps is associated with ventricular tachycardia and delayed excitation waves. This is because gap junctions in the flaps provide less conduction velocity than in the heart [
10,
16]. Another form of the cell’s synchronization problem is ectopic stimulation of the heart during spontaneous graft activity [
13]. The systematization of undesirable side effects from cell engraftment has led to the emergence of a separate term—engraftment arrhythmia. To the best of our knowledge, no single mechanism underlying engraftment arrhythmia has been identified, but the occurrence of such arrhythmias is most noticeable in the first days after cell injection [
8,
10,
13,
14]. Despite numerous reports on the significant functional improvement of contractility due to cell engraftment [
15], underdeveloped intercellular contacts and potential engraftment arrhythmia reduce the feasibility of cell therapy. The development of new procedures for cardiac tissue regeneration based on the microcarriers proposed in this work should optimize the initial stage of graft–host interaction (in the first hours after contact), improving their synchronization and will be a promising target for future studies with longer follow-up of the positive and negative effects of transplantation.
The synchronization of cell excitation requires that the cells be electrically or mechanically coupled. In this work, we did not completely exclude the possibility of mechanical connection as a way to stimulate cells. Electrical coupling between cardiac cells is thought to be possible through the formation of gap junctions [
24,
25]. However, an alternative explanation claims that gap junction formation between excitable cells is not obligatory for electrical coupling [
26]. Our experiments do not support or discourage any of the points of view above; we are proving the fact that in excitable cells with microcarriers, physical contact with the recipient heart produces calcium releases synchronized with host–tissue excitation, even after a short period (30 min) after transplantation. Given that the organized spread of excitation in the cardiac tissue is a prerequisite for the organized contraction of the heart, this finding might be important for regenerative medicine as evidence that microcarrier-grown and -delivered cardiomyocytes can functionally fuse with the host tissue immediately after contact. Summarizing under the discussion of excitation transfer from the heart to the graft, we can conclude that within this work, we do not explain the underlying mechanism of such rapid cell–tissue synchronization, but we assume that this mechanism must be of a physical (mechanostimulation or EPC) rather than biochemical nature (GJs). This assumption follows from the fact that the synthesis of connexin proteins and their organization into gap junctions in such a time interval seems impossible. High-resolution microscopy (e.g., scanning probe nanotomography [
21,
27]) and optical mapping of the action potential of both cell grafts and the recipient heart are required to explain the physical transfer of excitation. To the best of our knowledge, this early stage of host–graft interactions (30 min) has not been investigated in vivo for excitation transmission (e.g., with optical mapping). However, existing in vivo studies do not confirm or reject the possibility of synchronization of graft and host cells in such a short time [
8,
10]. An in vitro study [
11] of the electrophysiological host–graft interaction showed the possibility of ephatic synchronization two days after the first contact (not excluding the faster formation of EPC). However, the mentioned study is limited by oversimplification of the spatial organization of the contact spot between the host and the graft—the contact area was limited by the excessive spreading of cells cultured in monolayers, which complicates the formation of an EPC [
26]. The formation of an EPC over the same two days was shown in a more realistic in vitro experiment [
18] with an increased contact zone due to the transfer of cells on fibroin microcarriers over the monolayer. In the present experiments, we were able to conduct an in vivo simulation of this process and clarify the time frame required for cell synchronization. We have shown that the use of microcarriers and the preliminary restoration of cell excitability can be a sufficient condition for the occurrence of synchronization in the first 30 min.
Regardless of the specific mechanism of excitation transmission, cell coupling requires the presence of contact between cell membranes. In the case of a suspension of cultured cells, the only way to form such a contact spot is through adhesion and spreading, the initiation of which takes on the order of 1 h [
9,
11]. This fact is used, for example, on the basis of the pre-plating method for purifying cardiomyocyte populations of both NRVMs and iPSC-CMs—pre-plating within 1 h leads to the adhesion of fibroblasts or byproducts of differentiation, respectively, but is insufficient for the adhesion of cardiomyocytes. The same time frame of contact formation between cardiomyocytes was predicted by computer simulations [
28]. Repetition of experiments from
Section 2.1 with solitary cells without microcarriers apparently resulted in cells not attaching to the heart surface and leaving the seeding site: as in the pre-plating procedure, 30 min is not enough time to even initiate adhesion of a solitary cardiomyocyte. This fact is general and not related to the specific design of the experiment: to confirm this, we examined the attachment of single cells under conditions that are most favorable for cell adhesion. Such conditions are transplantation (seeding) of cells on the surface of a conductive monolayer of cardiomyocytes (immovable and flat, unlike the surface of the heart).
Figure S2 shows that seeded cells (highlighted with LumiTracket Mito dye) are not able to restore excitability and synchronize with excitation of the monolayer 30 min after seeding. To be sure, we checked that the formation of coupling occurs, but only 90 min after cell seeding (
Figure S2, lower panels and Supplementary Video S4). Thus, the electrical coupling of cells and recipient tissues in 30 min is possible only when using a microcarrier.
The application of microcarriers has opened a new scenario of contact spot formation: fiber coating with the HFN protein leads to the capture of microcarriers by cardiac cells. As a result, the mutual location of the graft and host tissue becomes fixed. At the same time, the cytoskeleton of the graft is already preliminarily flattened and elongated along the fiber. Confocal microscopy of the graft on the surface of the cell monolayer gives us the idea that the cell cytoskeleton retains plasticity and mobility after the moment of contact. Thus, it is possible to apply biodegradable polymers in the composition of the microcarrier, whose degradation will not affect the mechanical stability of the grafts while accelerating their initial attachment. It is worth noting that there is a strategy to use porous microcarriers (instead of fiber ones) suitable for injection [
29]. Cardiomyocytes can grow into the pores of such microcarriers. However, the porosity of the polymer [
30] in the context of myocardial cell replacement therapy can lead to local tissue anisotropy (for example, elongation of cells along tortuous pores towards the center of the microcarrier or a larger substrate [
31]), which is unnatural for the aligned structure of the contractile elements of the heart. In silico studies show that the presence of local anisotropy is a trigger for the formation and maintenance of arrhythmogenic spiral reentry waves [
32]. The use of optical tags in the microcarrier composition allowed us to prove the fixation of the graft in the rat heart in vivo for a long time. The estimate of the formation time of ephatic cell coupling obtained in the presented study will be useful for in silico modeling [
13] of cardiac cell engraftment. The implementation of in silico studies will speed up and reduce the cost [
33] of further development of new therapeutic approaches for cell therapy of cardiac injuries.
Although the important role of EPC in the synchronous work of the heart is increasingly noted in fundamental studies [
13,
23,
25], it is important to note that the presence of a weak unpredictable transmission mechanism can have a negative effect in the form of increased arrhythmogenicity. The role of stochastic EPC in the formation of EA has been studied in silico [
13] and deserves great attention in further studies of cell transplantation on microcarriers. In this paper, we develop the idea [
18] that microcarriers give control over the stochastic EPC process, and the formation of an ephatic coupling is at least predictable and may precede the formation of a more reliable coupling mechanism. The study of the EA mechanisms requires the delivery of a larger number of cells capable of overcoming the sink–source mismatch to create an ectopic source of the heart excitation. In this study, the number and density of seeding are regulated by the fact that it is necessary to avoid electrical coupling of NRVMs with each other until the moment of transplantation. Otherwise, the transplanted cell will have two potentially competing sources of excitation—the surface of the heart (this mechanism is being studied in this work) and excitation of the attached cell. The second factor can be mediated by both spontaneous activity and transmission of excitation from the heart. This situation leads to a false-positive interpretation: if there is a chain of several transplanted NRVMs on the heart’s surface (which formed coupling before transplantation), then the presence of at least one sync cell will lead to excitation of the entire chain, but this does not mean that each of them is capable of receive excitation from the heart and be interpreted as a sync cell.
To estimate the critical (maximum) cell density allowing identification of sync and async cells, we increased the cell density by a factor of 1.5,
Figure S1A. The activation map shows the transmission of excitation in all cells, respectively, the critical planting density is exceeded. This leads to the conclusion that the cell density used in
Section 2.1 (
Figure S1B) is close to critical, so increasing the density or number of cells in this work will be contrary to its original goal—to study the coupling of transplanted cells with the recipient heart. However, the proposed method of cell delivery itself does not impose restrictions on the density or number of delivered cells: in
Figure S1B, the dotted line shows areas with a high (subcritical) density of excitable cells on the surface of the heart.
There are three negative factors that reduce the effectiveness of graft transplantation: ischemia, due to the absence of vasculature within the injected cell clumps and their delivery into an ischemic environment; anoikis, due to the need to detach these anchorage-dependent cells from their substrate for injection; and inflammation-related factors, such as free radicals, cytokines, and natural killer cells [
7]. In the case of iPSC-CMs or other immature cell types, the need for cell maturation after transplantation has also been highlighted [
34,
35]. The use of microcarriers solves the problem with anoikis. The effect of ischemia in this work was leveled by adhesion to the heart surface (epicardium) washed with perfusate (Tyrode’s solution), but microcarriers do not exclude the possibility of target delivery of substances that reduce the effect. Such substances could theoretically be incorporated into the microcarrier and released as the polymer biodegrades, optimizing cell delivery to the myocardium. Finally, inflammation-related factors are leveled in this work due to the absence of recipient animal blood in the perfusate composition. Summarizing the above, our proposed method of cell delivery can act as an initial configuration for the flexible creation of new methods of cell transplantation for specific cardiac healing tasks with a high rate of cell–tissue synchronization, improved mechanical fixation and noninvasive optical control, and the absence of anoikis of delivered cells.
Limitations: The described study is limited to the transplantation of cells into a healthy rat heart and studying the early stage of cell synchronization. Therefore, based on the results obtained, we could not state whether the new delivery method would have a significant impact on the final result of transplantation (complete engraftment with the formation of all GJ within a few weeks [
9]) when compared with existing methods of delivery (especially when delivering a large number of cells comparable to tissue-engineered patches). However, we hypothesize that the availability of rapid cell synchronization will optimize and accelerate the formation of coupling and may reduce the proportion of engraftment arrhythmias [
8], which is the main side effect of cardiac cell therapy [
1].
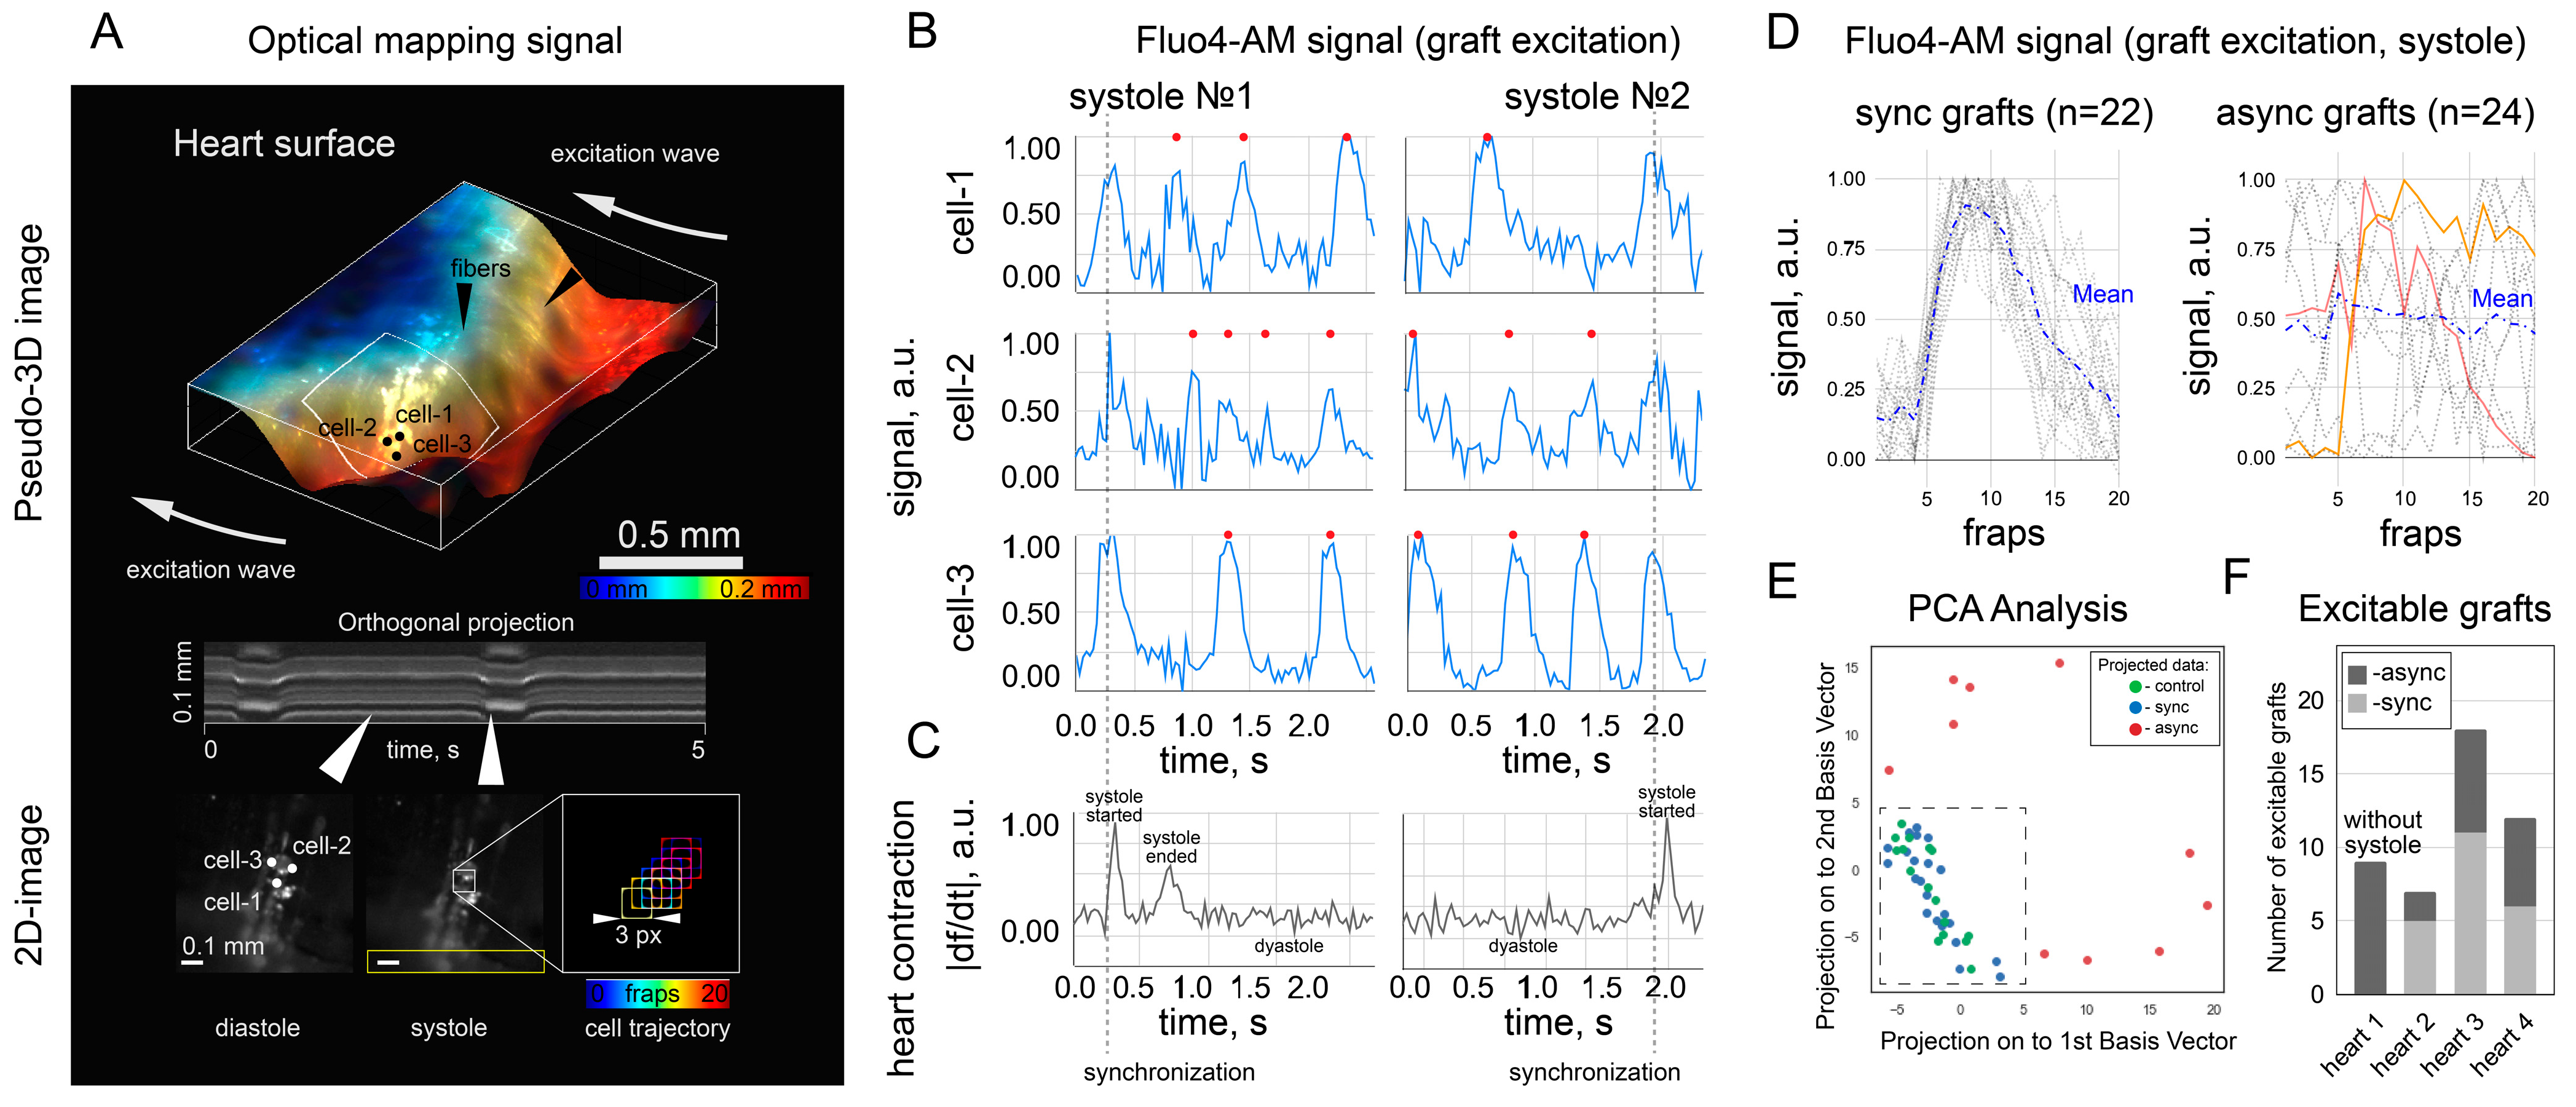
Fluo4-AM was used only in transplanted cells to avoid overlapping fluorescence signals from the host and graft and to exclude the false-positive detection of “sync” cells. In principle, these signals are distinguishable with a confocal microscope or higher spatial resolution mapping [
18]. In the context of this work, we believe that the spontaneous activity of single grafts is not capable of leading to ectopic excitation of the heart due to sink–source mismatch. The counting of “sync” and “async” clusters was rather a demonstration that both scenarios were observed. The capabilities of the optical setup did not allow mapping and characterizing all the transplanted cells because of the low spatial resolution. It was also hampered by mechanical contractions of the heart, which moved the cells from one focal plane to another, thus also affecting the signal intensity in individual pixels. The calcium traces shown in
Figure 3B were obtained in a single focal plane on a section of the heart with minimal displacement during systole, and the fluorescence intensity was measured in a frame (3 pixels × 3 pixels) that moved with the cell during systole. Fluo4-AM dye is not approved by the Food and Drug Administration for clinical or medical use. However, calcium activity can be visualized with viruses that produce fluorescent labels [
8] or with FDA-approved water-soluble dyes. In our case, Fluo4-AM was chosen because of its high signal-to-noise ratio, fast staining protocol, and safety in cell culture, even with repeated use [
36]. One of the FDA-approved dyes is BODIPY [
37]. In this work, we used its analogue BDP with an extended lifetime [
38], but its toxicity has been studied to a lesser extent. Finally, the LumiTracker Mito showed a stable signal for two weeks, which indicated the stability of the cell mitochondria in the presence of this dye. In practical applications, this dye can be replaced by the FDA-approved analogues [
39] or viruses mentioned above [
8].
The experiment with an isolated heart was planned to exclude possible artifacts due to external stimulation of the heart with an electric field. Mostly, the spontaneous activity of the heart, recovered after 30 min in a cardioplegic solution, was recorded. The use of a cardioplegia solution may explain why the heart rate in the recordings with “sync” clusters was insignificantly higher (0.72 Hz against 0.56 Hz, p > 0.05). The insufficient washing of the solution can simultaneously explain both the reduced heart rate and the reduced excitability of the grafts.
When analyzing in vivo fluorescence, we were limited to qualitative analysis of fluorescence (i.e., the presence or absence of appreciable fluorescence at the injection site). Quantitative analysis is complicated by two factors (despite the supposed stability of fluorophores). First, we did not fix the posture of the rats during anesthesia. As a result, the same rat appeared in different postures on different images (1 day, 3 days after injection, etc.). Hence, the excitatory light reached the heart in different ways, which affected the absolute value of the signal. Second, we recorded fluorescence with an EMCCD camera in video mode, causing the camera temperature to change during recording and distort the absolute values of the signal. In further work, it would be necessary to improve the methodology of signal registration so that a quantitative assessment of the signal becomes available. In the MPC-sample group, a part of the rats died during surgery, and the percentage of dead rats was 8.5%. We did not perform an autopsy to determine the exact cause of death. As the separate injection of microcarriers and cells did not lead to death in rats, we could only assume that death was not related to the composition of the injection. We did not test the rats for cardiovascular diseases prior to injection, so the case of death during surgery may be related to anesthesia. The rats did not show signs of life after the standard dose of anesthesia, which is possible, for example, in the presence of heart failure before surgery.
Two other limitations are related to in vivo fluorescence. First, we did not account for possible autofluorescence of cardiac molecules (such as two-photon excitation by NADH, NADHp, and possibly FAD), but the control recordings showed no detectable heart fluorescence in the absence of dye. The decreased intensity in the hearts of the MP-sample group may be due to unavoidable photobleaching and dye washout. The rate of photobleaching of the LumiTracker Mito Red CMXR dye used in the C-samples and MPC-samples groups may differ. When imaging cells (C-samples and MPC-samples), dyeing can be replaced by viruses, leading to dye production inside the cell, which will reduce the effect of photobleaching but may lead to unpredictable changes in brightness [
17] associated with cell proliferation.
4. Materials and Methods
4.1. Polymer Carriers for the Isolation and Transplantation of Single Cardiomyocytes
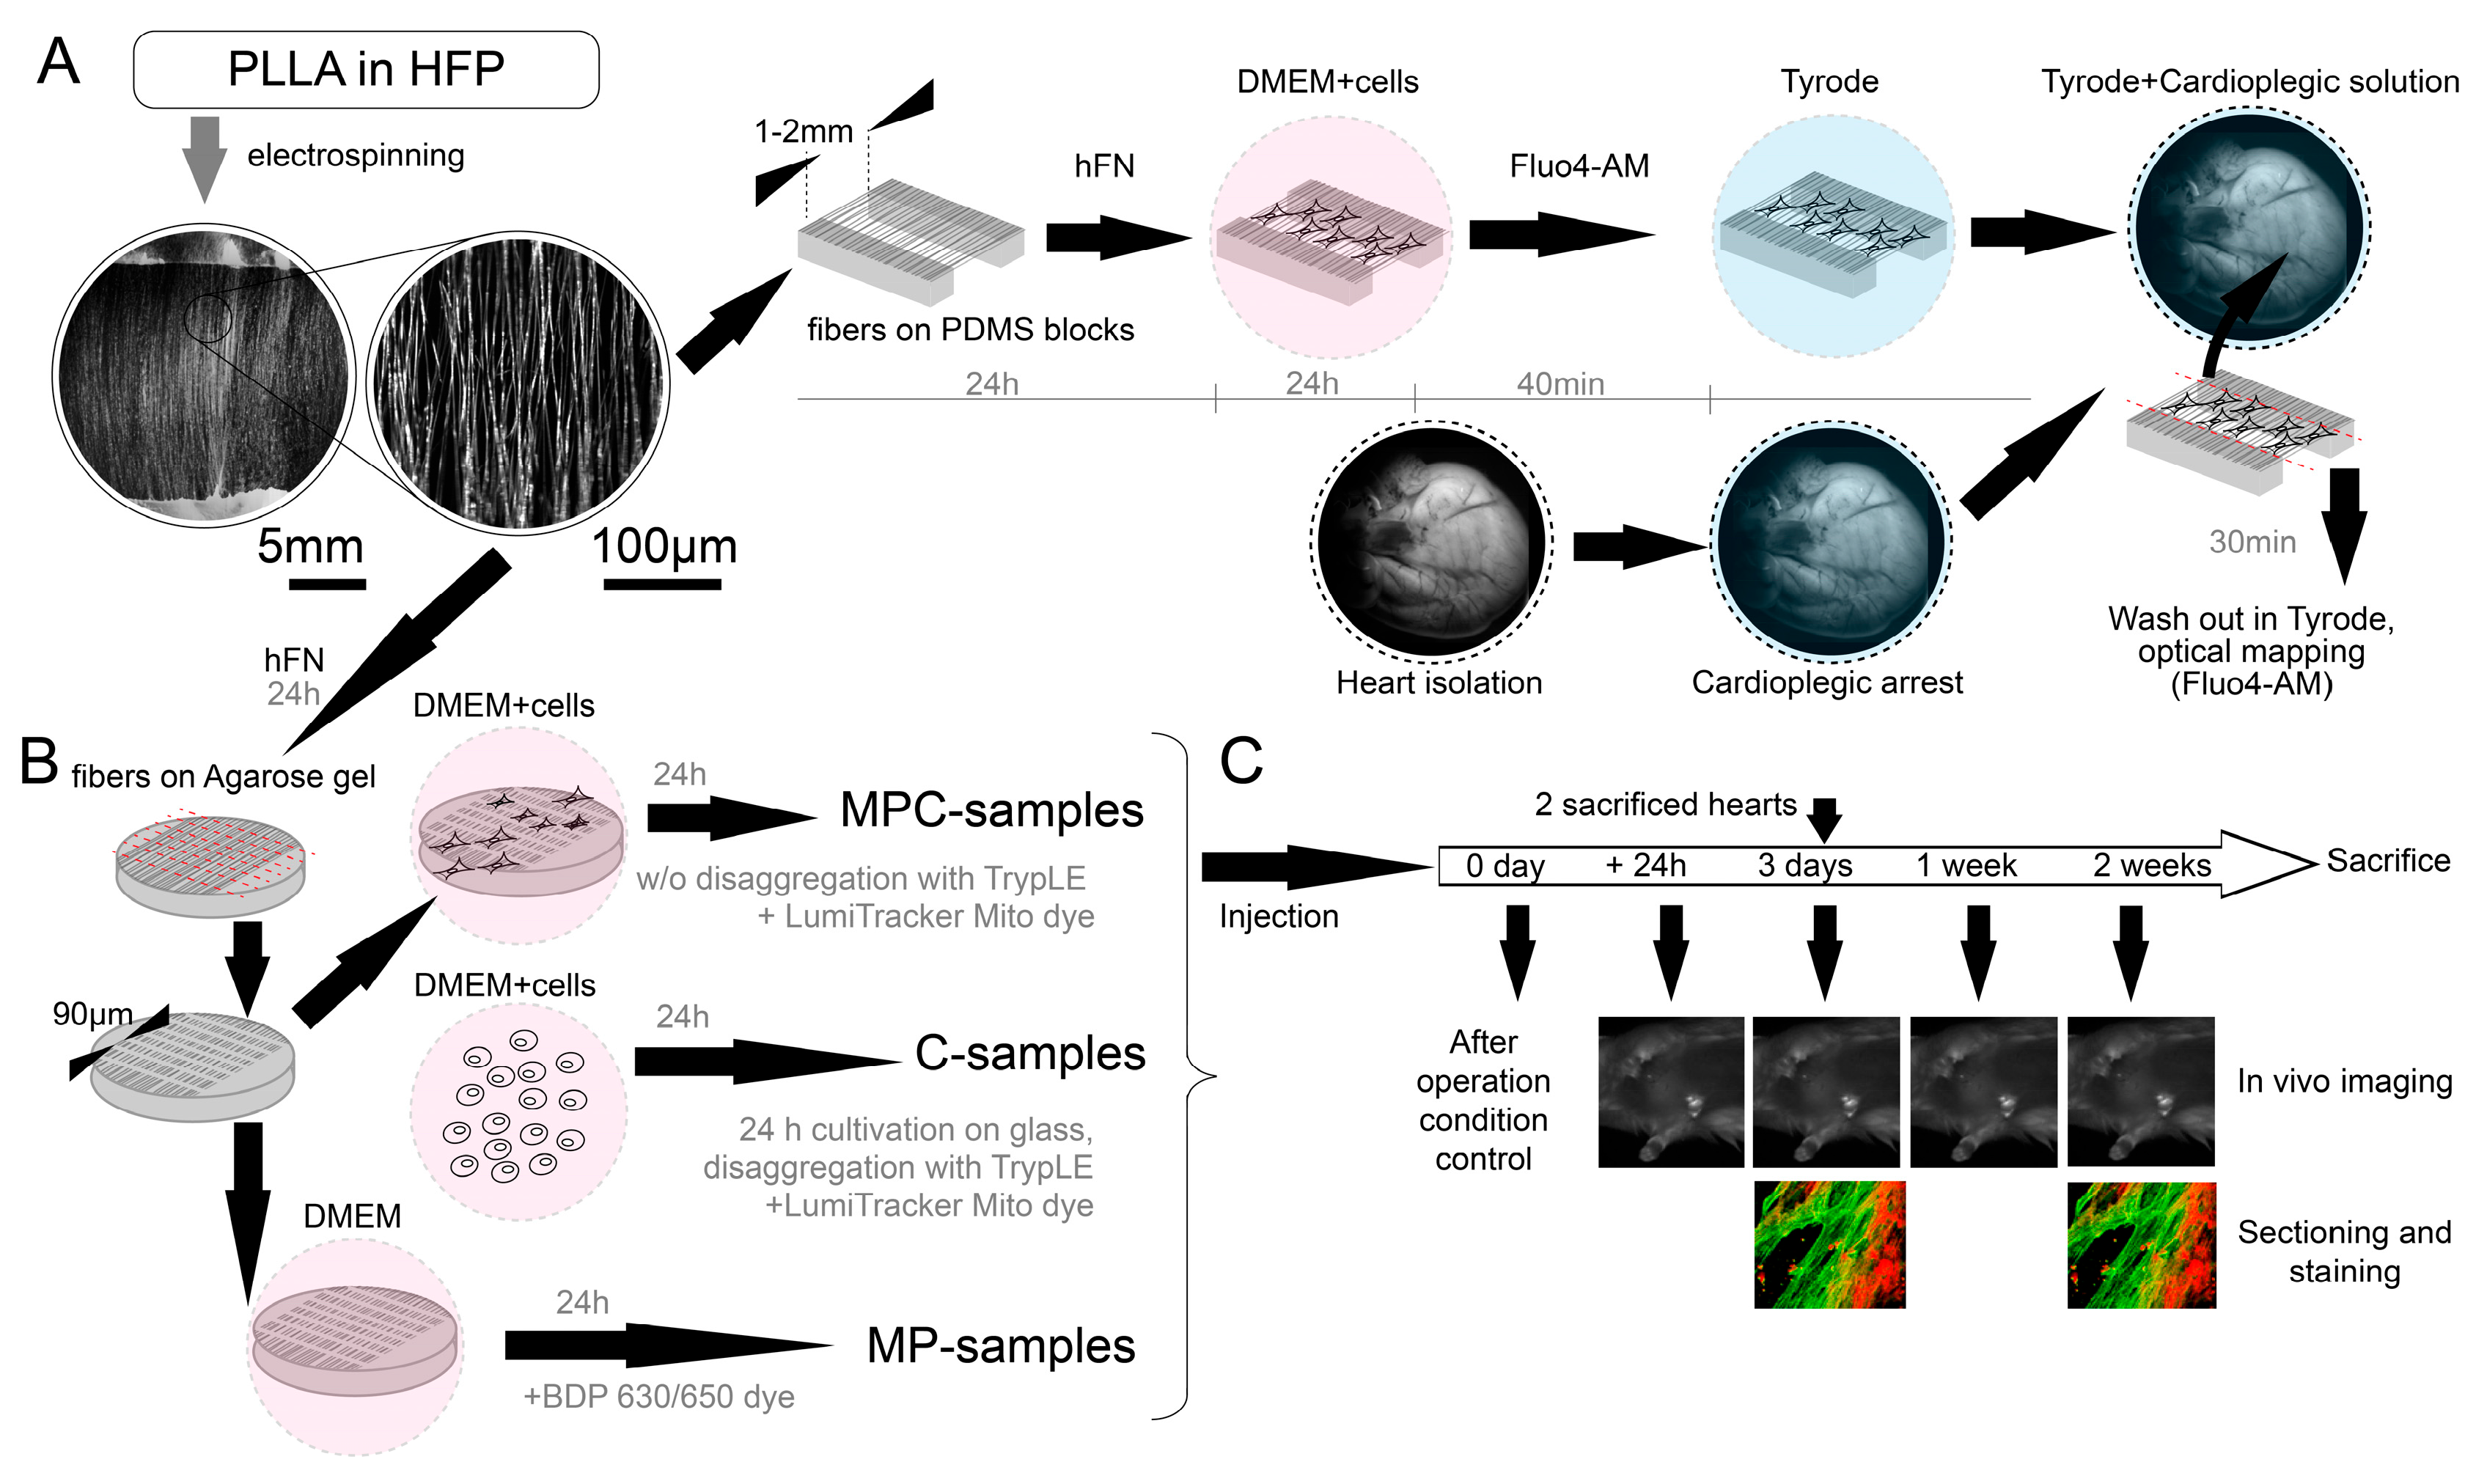
The nanoscaffold fabrication protocol was based on two different methods (
Figure 6). The first method (used in
Section 2.2) involved the use of agarose, as previously described [
18]. Cover slips with a diameter of 15 mm were covered with a 2% agarose (Paneco, Moscow, Russia, Cat# OB0100.050r) solution in water. After solidification, the gel was dried at 70 °C to form a solid agarose film. Aligned electrospun nanofibers on parallel electrodes were located on the film surface. In the electrospinning process, a mixture of 2.5% poly-L-lactid acid PLLA (M
w ≈ 700 000, Polysciences Inc., Warrington, PA, USA, Cat# 21,512) and 10% collagen in a 10:1 ratio in hexafluoroisopropanol solvent (HFP, SigmaAldrich Co., Cleveland, OH, USA, Cat# 105,228) was used (
Figure 6A). PLLA solution was electrospun using Nanon-01 electrospinning setup (Mecc Co., Fukuoka, Japan). The solution was loaded into the 3 mL syringe and ejected through the 22 gauge blunt tip needle at a flow rate of 0.5–1 mL/h towards the sample collector (aluminum foil with cut 2 cm wide). The voltage applied between the syringe tip and the grounded collector was in the range from 7 to 10 kV and the distance from needle tip to the collector was 10 cm. PDMS (SYLGARD
® 184, SigmaAldrich Co., Cleveland, OH, USA, Cat# 761,028) substrate blocks were attached to the drum collector. The electrospinning procedure was carried out for 5 min. The specimens were coated with a solution of HFN (0.16 mg/mL, Gibco, Billings, MT, USA, Cat# 33,016,015) by 24 h incubation at 37 °C to produce a cell adhesive matrix. Next, to prevent fiber detachment during the cell seeding process, we coated them with sucrose water solution (1 g/mL) by spin coating (Instras PDC-2 spin coater (Instras Scientific LLC, Ridgefield Park, NJ, USA), 500–700 rpm, 10 s). Afterward, the immobilized fibers on an agarose film were cut perpendicular to their main direction on a computer-controlled XY table in 90µm increments (Carl Zeiss LSM 710, Carl Zeiss AG, Oberkochen, Germany). The glass with sucrose gel and fragmented fibers was then placed in a Petri dish (35 mm) with agarose coating of the bottom and walls (15 mg per 10 mL of 1× PBS, prepared and dried one day before adding the suspension). Then, 1 mL of cell suspension (concentration of 5 × 10
5 cells per ml) was added to the dish, and further cell sedimentation took 24 h (
Figure 6B). The approximate concentration of kernels per unit area was 500–600 microcarriers per mm
2. Four samples on agarose gel were used to estimate adhesion efficiency with ImageJ program. In each sample, an area of 0.25 mm
2 was subjected to analysis: the number of fiber fragments with cells adhered on them was divided into the number of all fiber fragments located in the studied area of 0.25 mm
2.
For the second method (used in
Section 2.1), the algorithm for electrospinning fibers was the same. The spinning of the fibers was on foil rosettes so that the fibers were suspended from the edges of the rosettes. The fibers in this state were then transferred to thin PDMS bars so that the fibers were suspended from these bars. PDMS bars were glued to glass. Then, the fibers were treated with alcohol (70% ethanol) to reduce the charge and the solution with fibronectin for subsequent seeding of cells on them. Only after seeding were the fibers cut using a micromanipulator and a blade for samples with suspended fibers. The difference from the first method is that a section/space with suspended fibers between PDMS blocks (5 mm long, 3 mm wide, the distance between them is about 1–2 mm) is used as a non-adhesive element for cells instead of agarose gel. The resulting structure of PDMS blocks, fibers, and cells adhered to them was peeled off the glass with tweezers and leaned against the surface of the heart—at this moment, the edges of the fibers were cut off from the PDMS blocks, thereby leaving only fibers with cells on the surface of the heart (
Figure 6A).
In this study, we used the existing two-day isolation protocol from Worthington-Biochem for neonatal rat cardiomyocyte isolation (
http://www.worthingtonbiochem.com/NCIS/default.html (accessed on 5 May 2023)). In brief, hearts were extracted from rat pups (
Rattus norvegicus, Sprague Dawley breed), aged 1–4 days, and immediately placed in Ca
2+- and Mg
2+-free Hank’s Balanced Solution (Gibco, Billings, MT, USA, Cat# 14,180,046) on ice. Only the tissue of the ventricles was isolated—with approximately 50–60% of the initial heart mass being cut off—which included the sinoatrial node, the atria, and the atrioventricular node. The isolated ventricles were minced into small pieces and then left at 4 °C overnight for trypsinization (Trypsin-EDTA 0.25%, Gibco, Billings, MT, USA, Cat# 25,200,056). On the second day, the cells were placed into a collagenase solution (Collagenase type II, 2.25 μg/mL, Gibco, Billings, MT, USA, Cat# 17,101,015) and stirred for 1 h at 37 °C. Next, the suspension of the cells was placed into a T75 flask for 1 h for pre-plating. The cells were then counted with Trypan blue (Gibco, Billings, MT, USA, Cat# 15,250,061), and the concentration of the cells was adjusted to 10
6 cells/mL.
The isolated cells from the suspension (containing ~70–80% cardiomyocytes) were seeded at a concentration of approximately 2.5 × 10⁵ cells/cm2 onto coverslips covered with fibronectin (0.16 mg/mL, Gibco, Billings, MT, USA, Cat# 33,016,015) for further (in next 24 h) disaggregation with TrypLE Express (1×, Gibco, Billings, MT, USA, Cat# 12,605,010) to a unicellular state with making cell suspensions. Some of the isolated cells were seeded on microcarrier samples: with agarose and on suspended fibers. All the samples were cultivated in Dulbecco’s Modified Eagle Medium (DMEM, SigmaAldrich Co., Cleveland, OH, USA, Cat# D6429) with 10% fetal bovine serum (FBS, SigmaAldrich Co., Cleveland, OH, USA, Cat# F4135) for the first 24 h, and then the media was changed to DMEM with 5% FBS. After 3–5 days of cultivation, the samples were examined using an optical mapping approach. Thereafter, basic experiments were conducted.
For making cell suspensions for injections (C-samples), cardiomyocytes were disaggregated using TrypLE Express (1×, Gibco, Billings, MT, USA, Cat# 12,605,010) to a unicellular state. The resulting cell suspension was marked with a fluorescent tracker LumiTracker Mito Red CMXRos, 575 nm/600 nm (Lumiprobe, Moscow, Russia, Cat# 2251) for approximately 30 min (C-samples and MPC-samples). To make microcarriers, we tracked fibers without cells using boron-dipyrromethene 630/650 amine (Lumiprobe, Moscow, Russia, Cat# 254C0) in MP-samples.
For perfused heart experiments, only the trackers required for optical mapping were used for all transplanted samples (Fluo4-AM dye, Life Technologies, Carlsbad, CA, USA, Cat# F14201) (
Figure 6A).
4.2. Data Processing and Statistical Analysis
Statistical significance of differences between groups was determined using a one-way ANOVA, followed by Fisher’s least significant difference test for group comparison; the differences were considered significant at p < 0.01 or statistically insignificant if p > 0.05.
4.3. Perfusion Heart Experimental Protocol
The protocol for isolating the heart and cannulating the aorta began with anesthetizing a lab rat and sacrificing it with a spinal fracture. Next, the heart was carefully removed through the following steps: (1) an incision was made from the xiphoid process to the lateral ends of the edges of the ribs and (2) through the ribs along the left and right anterior axillary lines to provide a cot thoracotomy, and (3) the chest was deviated upward. These steps provided full access to the heart. Sections of the vena cava and aorta completed the procedure for extracting the heart, after which the organ was washed with Tyrode’s salt solution (Sigma-Aldrich Co., Cleveland, OH, USA, Cat# T2145) with heparin and transferred to a Petri dish with the same solution for further manipulations.
The process of attaching the heart to a cannula (a needle with a soft polymer sheath) through the aorta was performed with several turns of surgical thread. From the moment the heart was removed from the body until the start of perfusion, no more than 10 min passed through the cannula.
The perfusion of the heart was carried out using a special installation, according to Langendorf. The setup consisted of two main parts: a perfusion circuit and a recording optical system based on a high-speed imaging setup (Olympus MVX-10 Macro-View fluorescent microscope (Olympus Co., Tokyo, Japan) equipped with a high-speed Andor iXon-3 Camera 897-U (Andor Technology Ltd., Belfast, UK)). The perfusion circuit was prepared for constant circulation (Masterflex L/S Digital Drive, 600 rpm; 115/230 VAC, Masterflex L/S Easy-Load® II Pump Head, SS Rotor; 2-Channel (Cole-Parmer Instrument Company, Vernon Hills, IL, USA)) of a fixed volume of fluid, maintaining the temperature of the perfusate throughout the system (Cole-Parmer Polystat Standard 6.5 L Heated Bath, 150 C, 115 V AC/60 Hz (Cole-Parmer Instrument Company, Vernon Hills, IL, USA)), including the heart chamber, and oxygenating the solution (Cole-Parmer Bubble trap, Water Jacketed Reservoir, Oxygenating Bubbler (Cole-Parmer Instrument Company, Vernon Hills, IL, USA)). The total volume of fluid circulating in the unit was optimized using a compact PDMS polymer heart chamber. The minimum volume that allowed the heart to be perfused with an oxygenated heated solution was reduced to 200 mL. The long-term preservation of the heart was carried out using a special cardioplegic solution, Normacor (CardioSystemPharma JSC, Khimki, Russia). The total cardioplegia time for the hearts was less than 1.5 h. Cardioplegic arrest was performed with Normacor and oxygenated Tyrode’s solution in a 1:4 proportion. For washing the heart after cardioplegia, an oxygenated Tyrode’s solution was used.
4.4. Optical Mapping Protocols
For cell culture, optical mapping with Fluo4-AM was performed in Tyrode’s salt solution (pH 7.25 to 7.4) according to the protocol described in [
9,
40]. The signal was recorded with a 512 × 512 pixels resolution and a sampling frequency of 34 frames per second (Olympus MVX-10 Macro-View fluorescent microscope (Olympus Co., Tokyo, Japan) equipped with high-speed Andor iXon-3 EMCCD Camera (Andor Technology Ltd., Belfast, UK)). The duration and amplitude of the electrode stimulus depended on the tissue culture excitation threshold: from 1 ms to 20 ms duration and from 1 V to 6 V. The stimulation period was 1000 ms, unless otherwise noted (60 ppm).
For the heart: In general, the mapping protocol for the whole heart was similar to the protocol for cells. We recorded the activity of cells stained with Fluo4 and transferred on fibers to the surface of the heart. We also watched the contractile activity of the heart and recorded it on video (512 × 512 pixels, 34 fps). At the same time, we looked at the spontaneous activity of the heart, as well as the activity of the heart, stimulated by applying an electrode to the apex of the heart (1 Hz). Data processing was fulfilled using the ImageJ program and the associated plugins (
http://rsbweb.nih.gov/ij/ (accessed on 5 May 2023)). The calcium traces shown in
Figure 3B were obtained in a single focal plane on a section of the heart with minimal displacement during systole, and the fluorescence intensity was measured in a frame (3 × 3 pixels) that moved with the cell during systole (with ImageJ program). The initial location of the frame was chosen manually during diastole, and its location at further time points (in systole) was corrected according to the brightest pixel in the selected frame: the frame was shifted so that the coordinate of the brightest pixel in the 3 × 3 pixel array remained unchanged. To calculate |df/dt|, the difference between adjacent frames in the video was used, normalized to the maximum change between adjacent frames in the video (
Figure 3C). ImageJ plugin (time lapse color-coder) was used to build pseudo-3D images and activation maps. Principal component analysis was performed in Python 3, and the original code could be found in the data repository.
4.5. Laboratory Animals and Ethical Approval
All procedures were carried out in compliance with the National Institutes of Health Guide for the Care and Use of Laboratory Animals and were approved by the Institutional Animal Care and Use Committee of M. F. Vladimirsky Moscow Regional Clinical Research Institute (protocol No. 4, 4 March 2021) and by the Moscow Institute of Physics and Technology Life Science Center Provisional Animal Care and Research Procedures Committee (Protocol No. A2-2012-09-02).
A total of 44 rats participated in the experiments: 4 for perfusion and 40 for operations. The success rate of all operations was more than 97%; only one rat died during the operation. All rats were anesthetized using the RWD R500 Small Animal Anesthesia Machine using oxygen and isoflurane. No rats were anesthetized more than once a day. In total, there were three groups of rats that underwent surgery, in accordance with the injections administered to them: 10 rats for C-samples, 15 rats for MP-samples, and 15 rats for MPC-samples.
The experimental protocol for checking animals after the introduction of the suspension occurred within two weeks from the moment of operation. A day after the injection, in vivo imaging was performed. On the third day after the operation, the first animal sacrifice was made, and samples were taken for sectioning and microscopy analysis. In vivo mapping was also carried out on the third day, one week and two weeks after the injection. All rat hearts were examined by fluorescence microscopy and sectioning after two weeks.
4.6. Intramyocardial Injection
Access to the heart was carried out through a left thoracotomy. The solution was injected with an insulin syringe containing 2 mL of the sample. Three types of samples were injected: cell suspension (C-samples, about 50,000 cells in 1 mL), microcarriers with protein (MP-samples, contains about 50,000 microcarriers in 1 mL), and microcarriers with cells seeded on them (MPC-samples, about 50,000 microcarriers and estimated 25,000 adhered cells for ~50% seeding efficiency in 1 mL). After injection of the solution into the myocardium, the wound was sutured in layers. Air aspiration from the pleural cavity was mandatory (
Figure 6B,C).
4.7. In Vivo Imaging
In vivo imaging was performed with a LumoTrace FLUO bioimaging system [
41,
42] (LumoTrace
® FluoEM, Abisense LLC, Sochi, Russia), as follows: rats were anesthetized according to the experiment timeline (
Figure 6C) after injection of one of the sample’s types and imaged with fluorescence excitation for fiber-marked samples at λ
ex = 630 nm and a 655 nm/40 nm filter or λ
ex = 575 nm and for cell-marked samples in a 600 nm/40 nm filter.
4.8. Immunofluorescent Staining and Sectioning
After the experiments, all hearts were fixed with paraformaldehyde and sectioned. Cross-sections of the hearts with a width of 30–60 μm were prepared on a cryotome (Thermo Shandon Cryotome FE, Thermo Fisher Scientific, Waltham, MA, USA).
Immunofluorescent staining was performed as follows. Samples were fixed for 10 min in 4% paraformaldehyde (Sigma-Aldrich, Cleveland, OH, USA, 158127), permeabilized for 10 min in 0.4% Triton-X100. Cells were further incubated for 30 min in blocking buffer (1% bovine serum albumin in phosphate-buffered saline, PBS), overnight at 4 °C with primary antibodies and for 1 h at room temperature with secondary antibodies. Cells were washed twice for 15 min in PBS. Nuclei were stained with DAPI (Vector Laboratories, Inc., Brockville, ON, Canada). Samples were analyzed and processed on a Zeiss LSM 710 confocal microscope with Zen black 3.0 software (Carl Zeiss AG, Oberkochen, Germany). Primary antibodies (working dilutions—1:100): sarcomeric α-actinin mouse (Abcam, Cambridge, UK, Cat# ab9465). Secondary antibodies (Thermo Fisher Scientific, Waltham, MA, USA, working dilution—1:400)—Alexa Fluor 568 goat anti-mouse IgG (HþL) highly cross adsorbed (A11031). Three-dimensional imaging of cell monolayers (
Figure 4B) was performed for 3 different samples.


 ,
, 


