1. Introduction
Renal cell carcinoma (RCC) is the most common type of kidney cancer (90%), and clear cell RCC (ccRCC) has the highest prevalence rate (70%) in adults. Studies have demonstrated that the 5-year survival rate for kidney cancer is approximately 75%, whereas the survival rate for metastatic cancer has sharply declined to only 12% [
1]. Patients with RCC are generally resistant to chemotherapy, with only a small percentage of patients responsive to cytokine treatment [
2]. Nephrectomy is the common and effective treatment for such patients, although the prognosis of RCC is mainly related to the clinical tumor stage. Targeted therapy includes sorafenib tosylate (Nexava) and temsirolimus (Torisel), which are oral inhibitors of multiple kinases (e.g., VEGFs and PDGF and mammalian target of rapamycin (mTOR), respectively). However, the efficacy of such targeted therapy is insufficient in patients with metastatic RCC. Thus, new therapeutic targets for antimetastasis must be urgently identified.
Simvastatin is clinically used to treat patients with hyperlipidemia and hypercholesterolemia. It works by lowering blood lipid levels and blocking the synthesis of cholesterol through the inhibition of hydroxyl-methyl-glutaryl-coenzyme A (HMG-CoA) reductase, a key enzyme in cholesterol synthesis. In ccRCC, simvastatin exerts apoptotic and antimetastatic effects on cancer cells by inhibiting the AKT/mTOR, ERK, and JAK2/STAT3 pathways [
3]. Wang et al. [
4] demonstrated that simvastatin potentially delays cancer cell progression by initiating apoptosis and inducing cell cycle arrest in the G0/G1 phase. However, in patients who receive a diagnosis in potential metastasis stages, the apoptosis and cell cycle arrest effects of a drug might not be effective. Numerous studies have reported that statins can attenuate breast cancer cell metastasis [
5]. Nevertheless, research on the antimetastasis effect of simvastatin in ccRCC is limited.
ccRCC is a kidney tumor that originates from renal epithelium cells. It usually presents as a solid, fat-like cyst, and these cancer cells have a clear cytoplasm and relatively small nuclei. Studies have determined that the clear cytoplasm is mainly composed of lipids and glycogen [
6]. Sterol responsive element binding factor (SREBF), a downstream transcription factor of the mTOR pathway, modulates the expression of metabolic related genes, including those for acetyl-CoA carboxylase (ACC), fatty acid synthase (FASN), and stearoyl-CoA desaturase (SCD). The accumulated lipids have a protective effect on ccRCC. Thus, investigating the contributions of metabolic abnormalities to ccRCC progression and whether the abnormalities can be reversed can provide insights to develop new therapeutic strategies.
The activation of Rho GTPases (e.g., RhoA) regulates cytoskeletal rearrangement, cell contraction, cell migration, and focal adhesion. RhoA is upregulated in various human cancers such as ovarian, gastric, and testicular cancers [
7,
8,
9]. RhoA upregulation stimulates cell cycle progression and migration in mouse models [
6,
7]. Rho-associated protein kinase (ROCK), a downstream target of RhoA, modulates cytoskeleton and cell morphology and is critical for endothelial cell function in normal and pathologic states. Inhibition of ROCK has been demonstrated to significantly block VEGF-mediated endothelial cell differentiation and activation in cancer studies [
8,
9]. RCC is a highly vascularized neoplasm; thus, antiangiogenesis through ROCK inhibition might attenuate RCC progression. In this study, we characterized the molecular mechanisms underlying the anti-ccRCC effects of simvastatin on cell viability, lipid metabolism, and cell metastasis and identified the proteins involved in autophagy, apoptosis, lipid synthesis, and cytoskeletal regulation.
3. Discussion
Effective long-term treatments for advanced and metastatic ccRCC are lacking because the reduction of cell multiplication is not efficient in attenuating tumor progression and metastasis. Therefore, in addition to the tumoricidal effect, this study also investigated the anti-ccRCC effects of simvastatin on lipid metabolism and cell invasion.
Statins (e.g., simvastatin and lovastatin) are clinically used as lipid-lowering medications. Accumulating evidence indicates that statins can inhibit tumor growth and induce apoptosis in various tumor cell lines [
11,
12]. Statin use in targeted therapy is associated with an increased survival rate among patients with metastatic RCC [
13] and a reduced risk of progression and overall mortality after surgery for localized RCC [
14]. However, cohort studies have reported conflicting results regarding the therapeutic effectiveness of statins in RCC [
15]. A recent systematic review and meta-analysis demonstrated that statins significantly improved cancer-specific and overall survival among patients with kidney cancer [
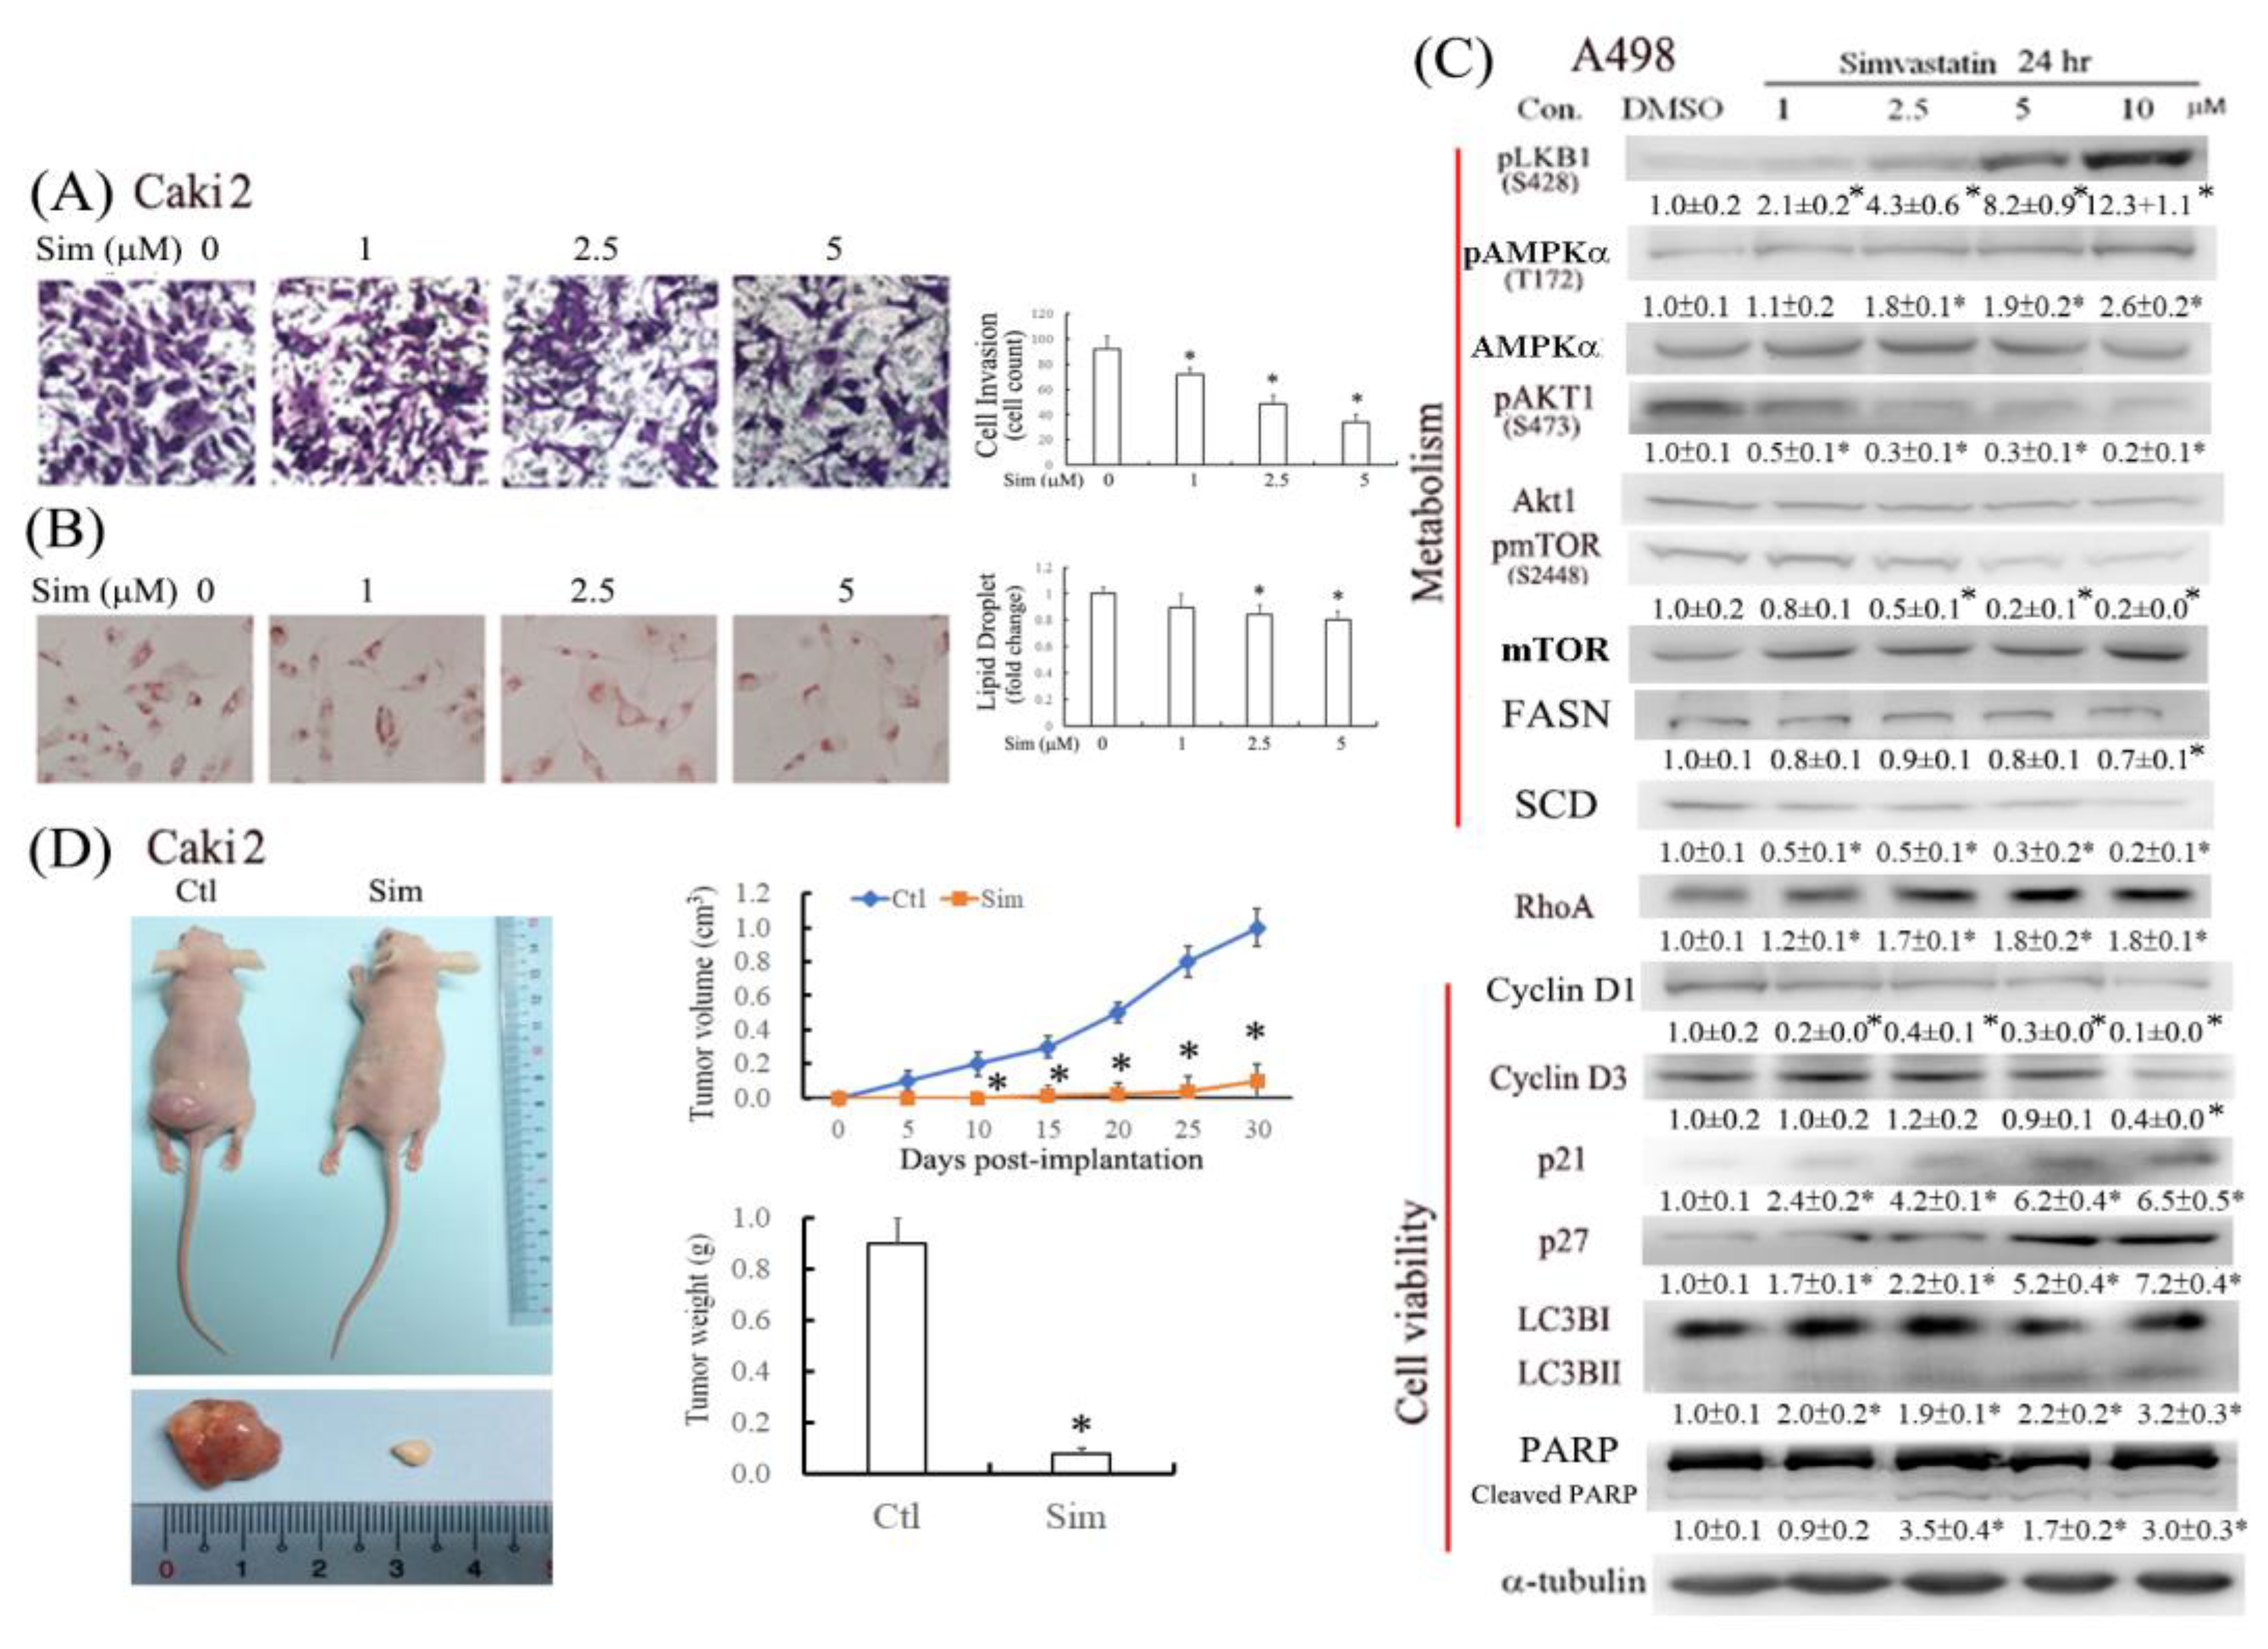
16]. The reduced RhoA activity and lipid accumulation might further increase the antitumor effects of simvastatin by suppressing cell metastasis and therapeutic resistance. The results of this study demonstrated that simvastatin caused cell cycle arrest in the G0/G1 phase, at least in part, by increasing p21/27 and reducing cyclin D1/D3 expression (
Figure 2E). In addition to decreasing cell proliferation, simvastatin induced autophagy and cell apoptosis (
Figure 2 and
Figure 3). Autophagy may be initiated by cell stress, which would eventually lead to cell death. Notably, we observed that simvastatin significantly induced LKB1 and AMPKα activation through phosphorylation and reduced AKT phosphorylation. The activation of pLKB1/pAMPKα contributes to pmTOR inhibition, autophagy induction, and reduced cell migration. Notably, the alterations of key proteins involved in the aforementioned events, including p21/p27, cyclin D1/D3, pLKB1/pAMPKα, and SCD/FASN, could be reversed by mevalonate supplementation, indicating that simvastatin acts by inhibiting the mevalonate pathway. Thus, simvastatin treatment exerts its antitumor effects through cell cycle arrest and its antimigration and tumoricidal effects on ccRCC cells through the inhibition of the mevalonate pathway.
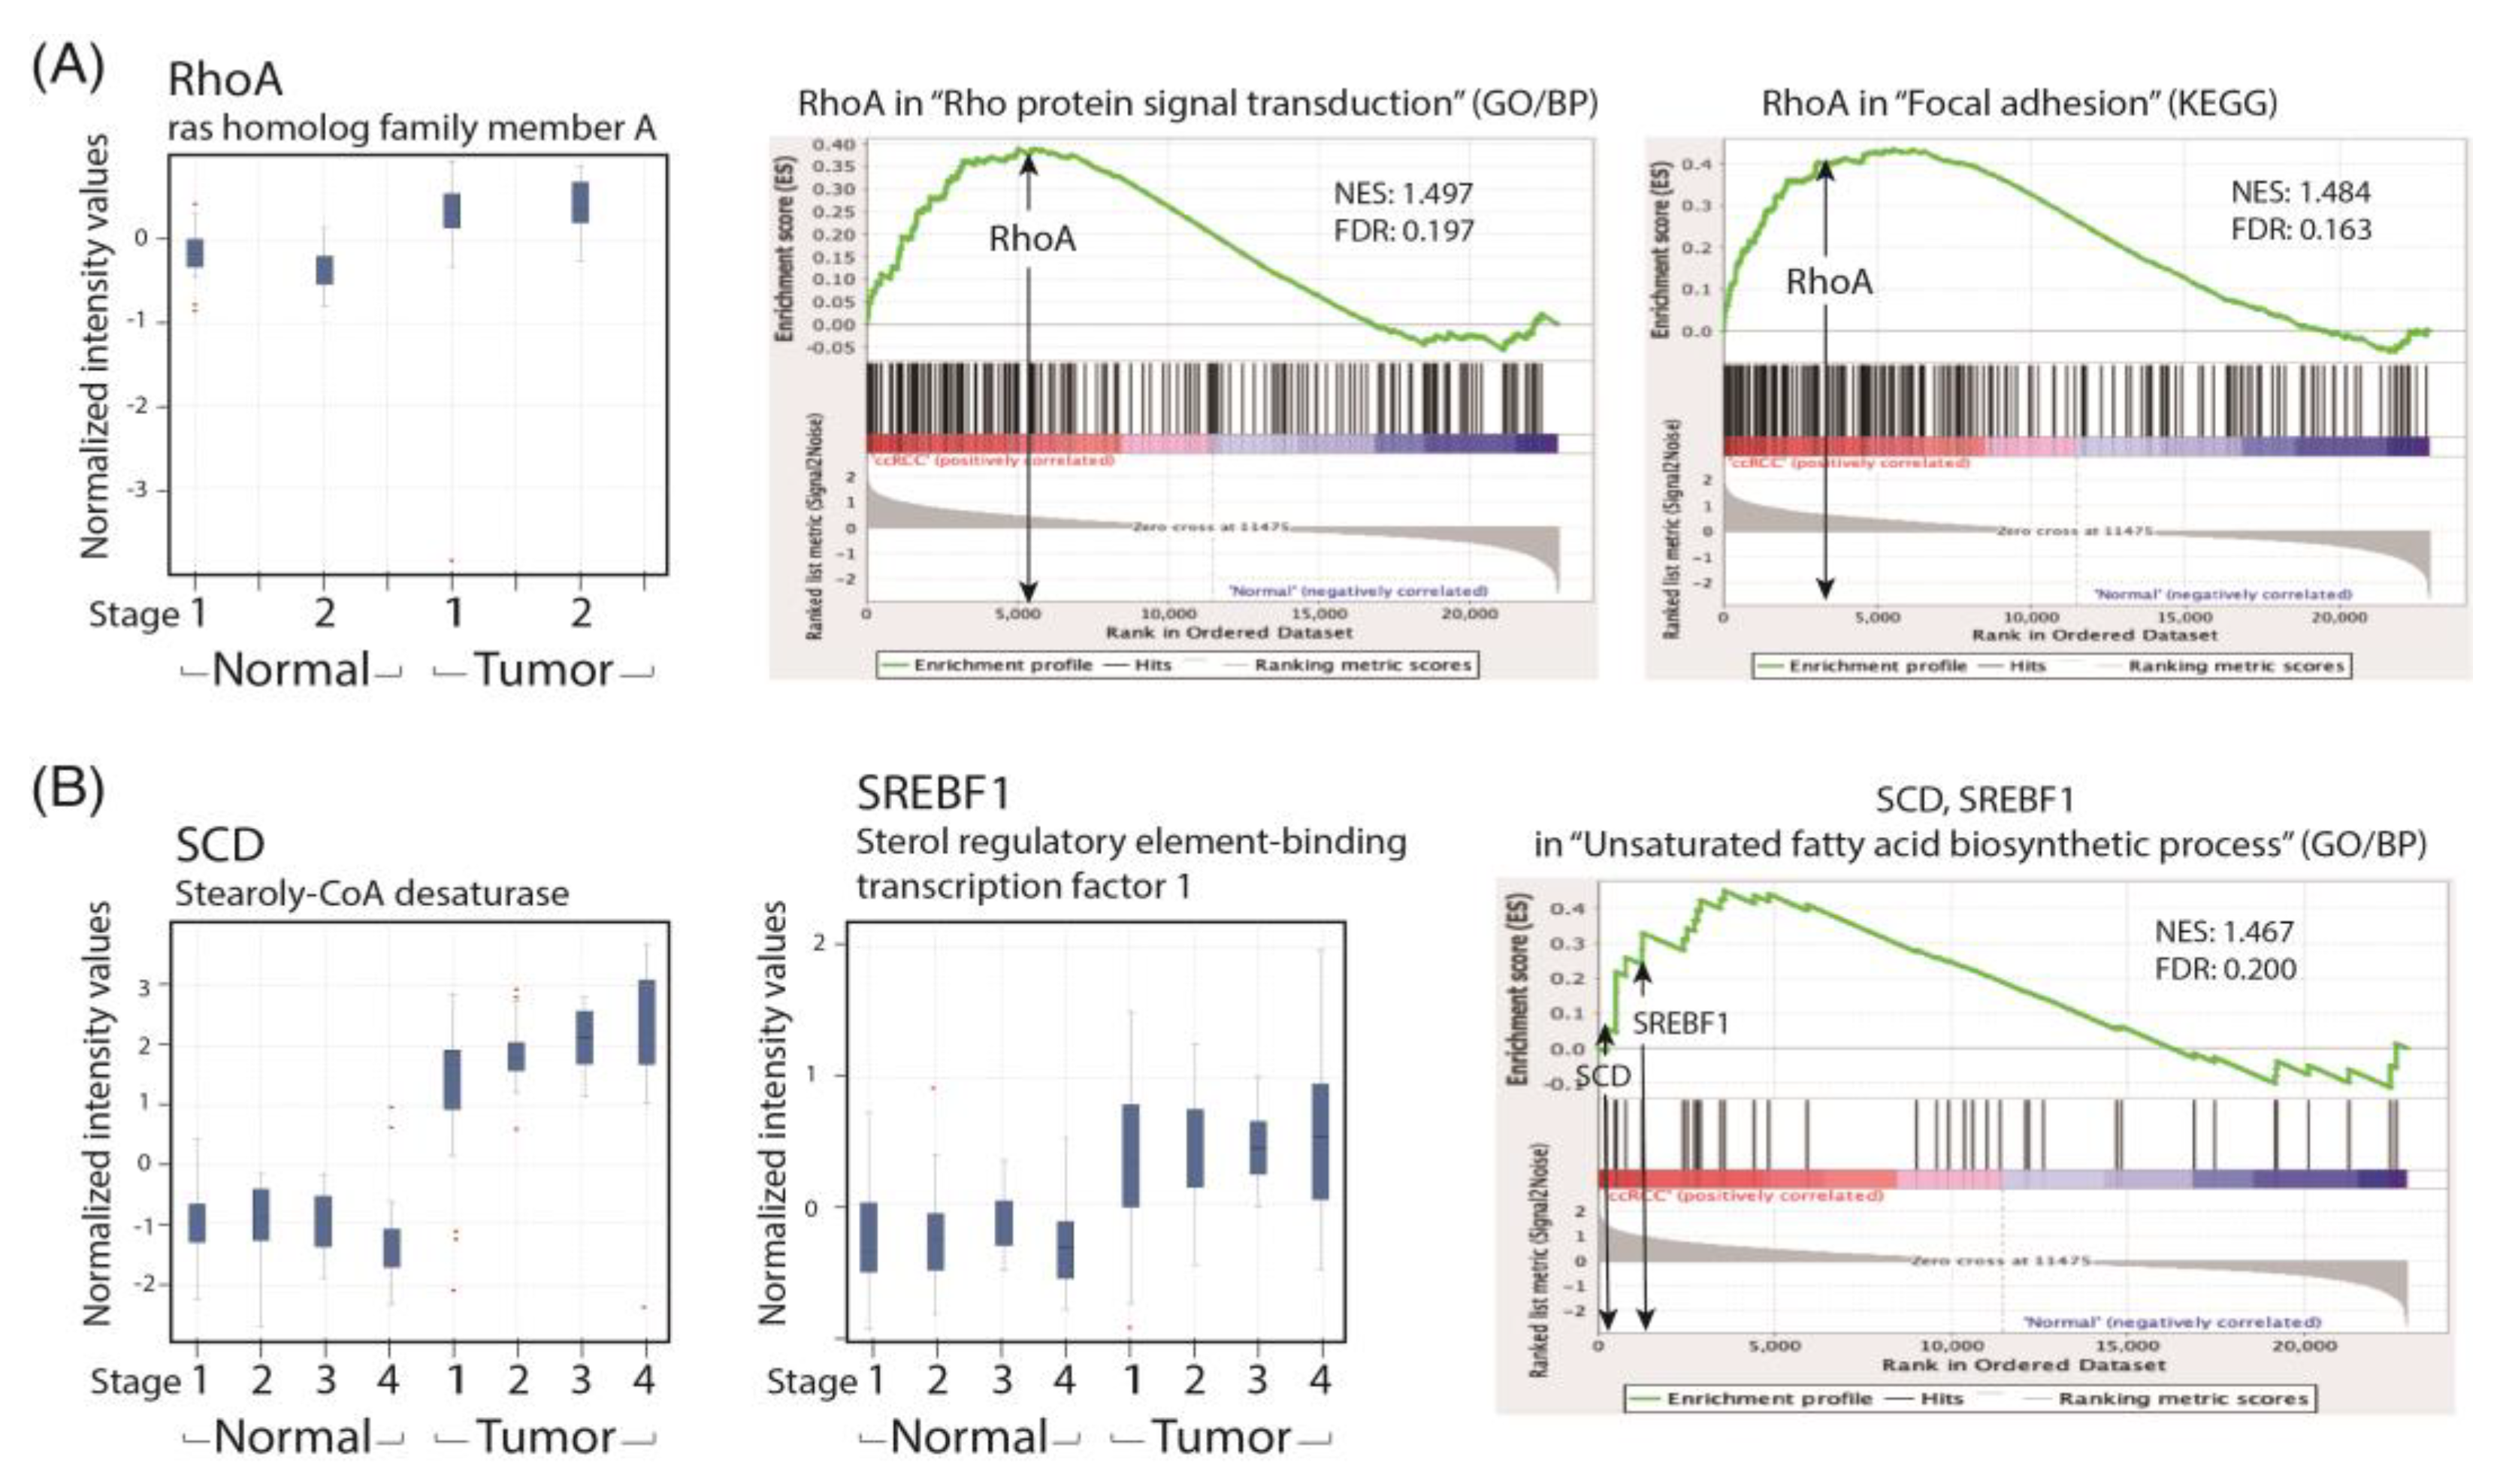
To recapitulate our findings in patients with ccRCC, we performed a GSEA analysis of the human ccRCC GSE53757 data set for the lipid metabolism and cell migration/RhoA pathway and compared the related gene expression profiles with that of the paired normal renal tissues in a GeneSpring analysis. We found that the expression levels of SREBF1 and SCD were significantly increased in patients with ccRCC across the four TNM stages. Lipid accumulation has been reported to protect cancer cells from chemotherapy through ROS scavenging; therefore, a reduction in lipid accumulation can increase treatment efficacy. We demonstrated that simvastatin could reduce lipid deposition in ccRCC cells by correcting metabolic abnormalities. We hypothesize that the activation of the LKB1/AMPKα pathway is essential to reducing lipid deposition in simvastatin-treated ccRCC cells. However, the underlying mechanism is currently under investigation in the laboratory.
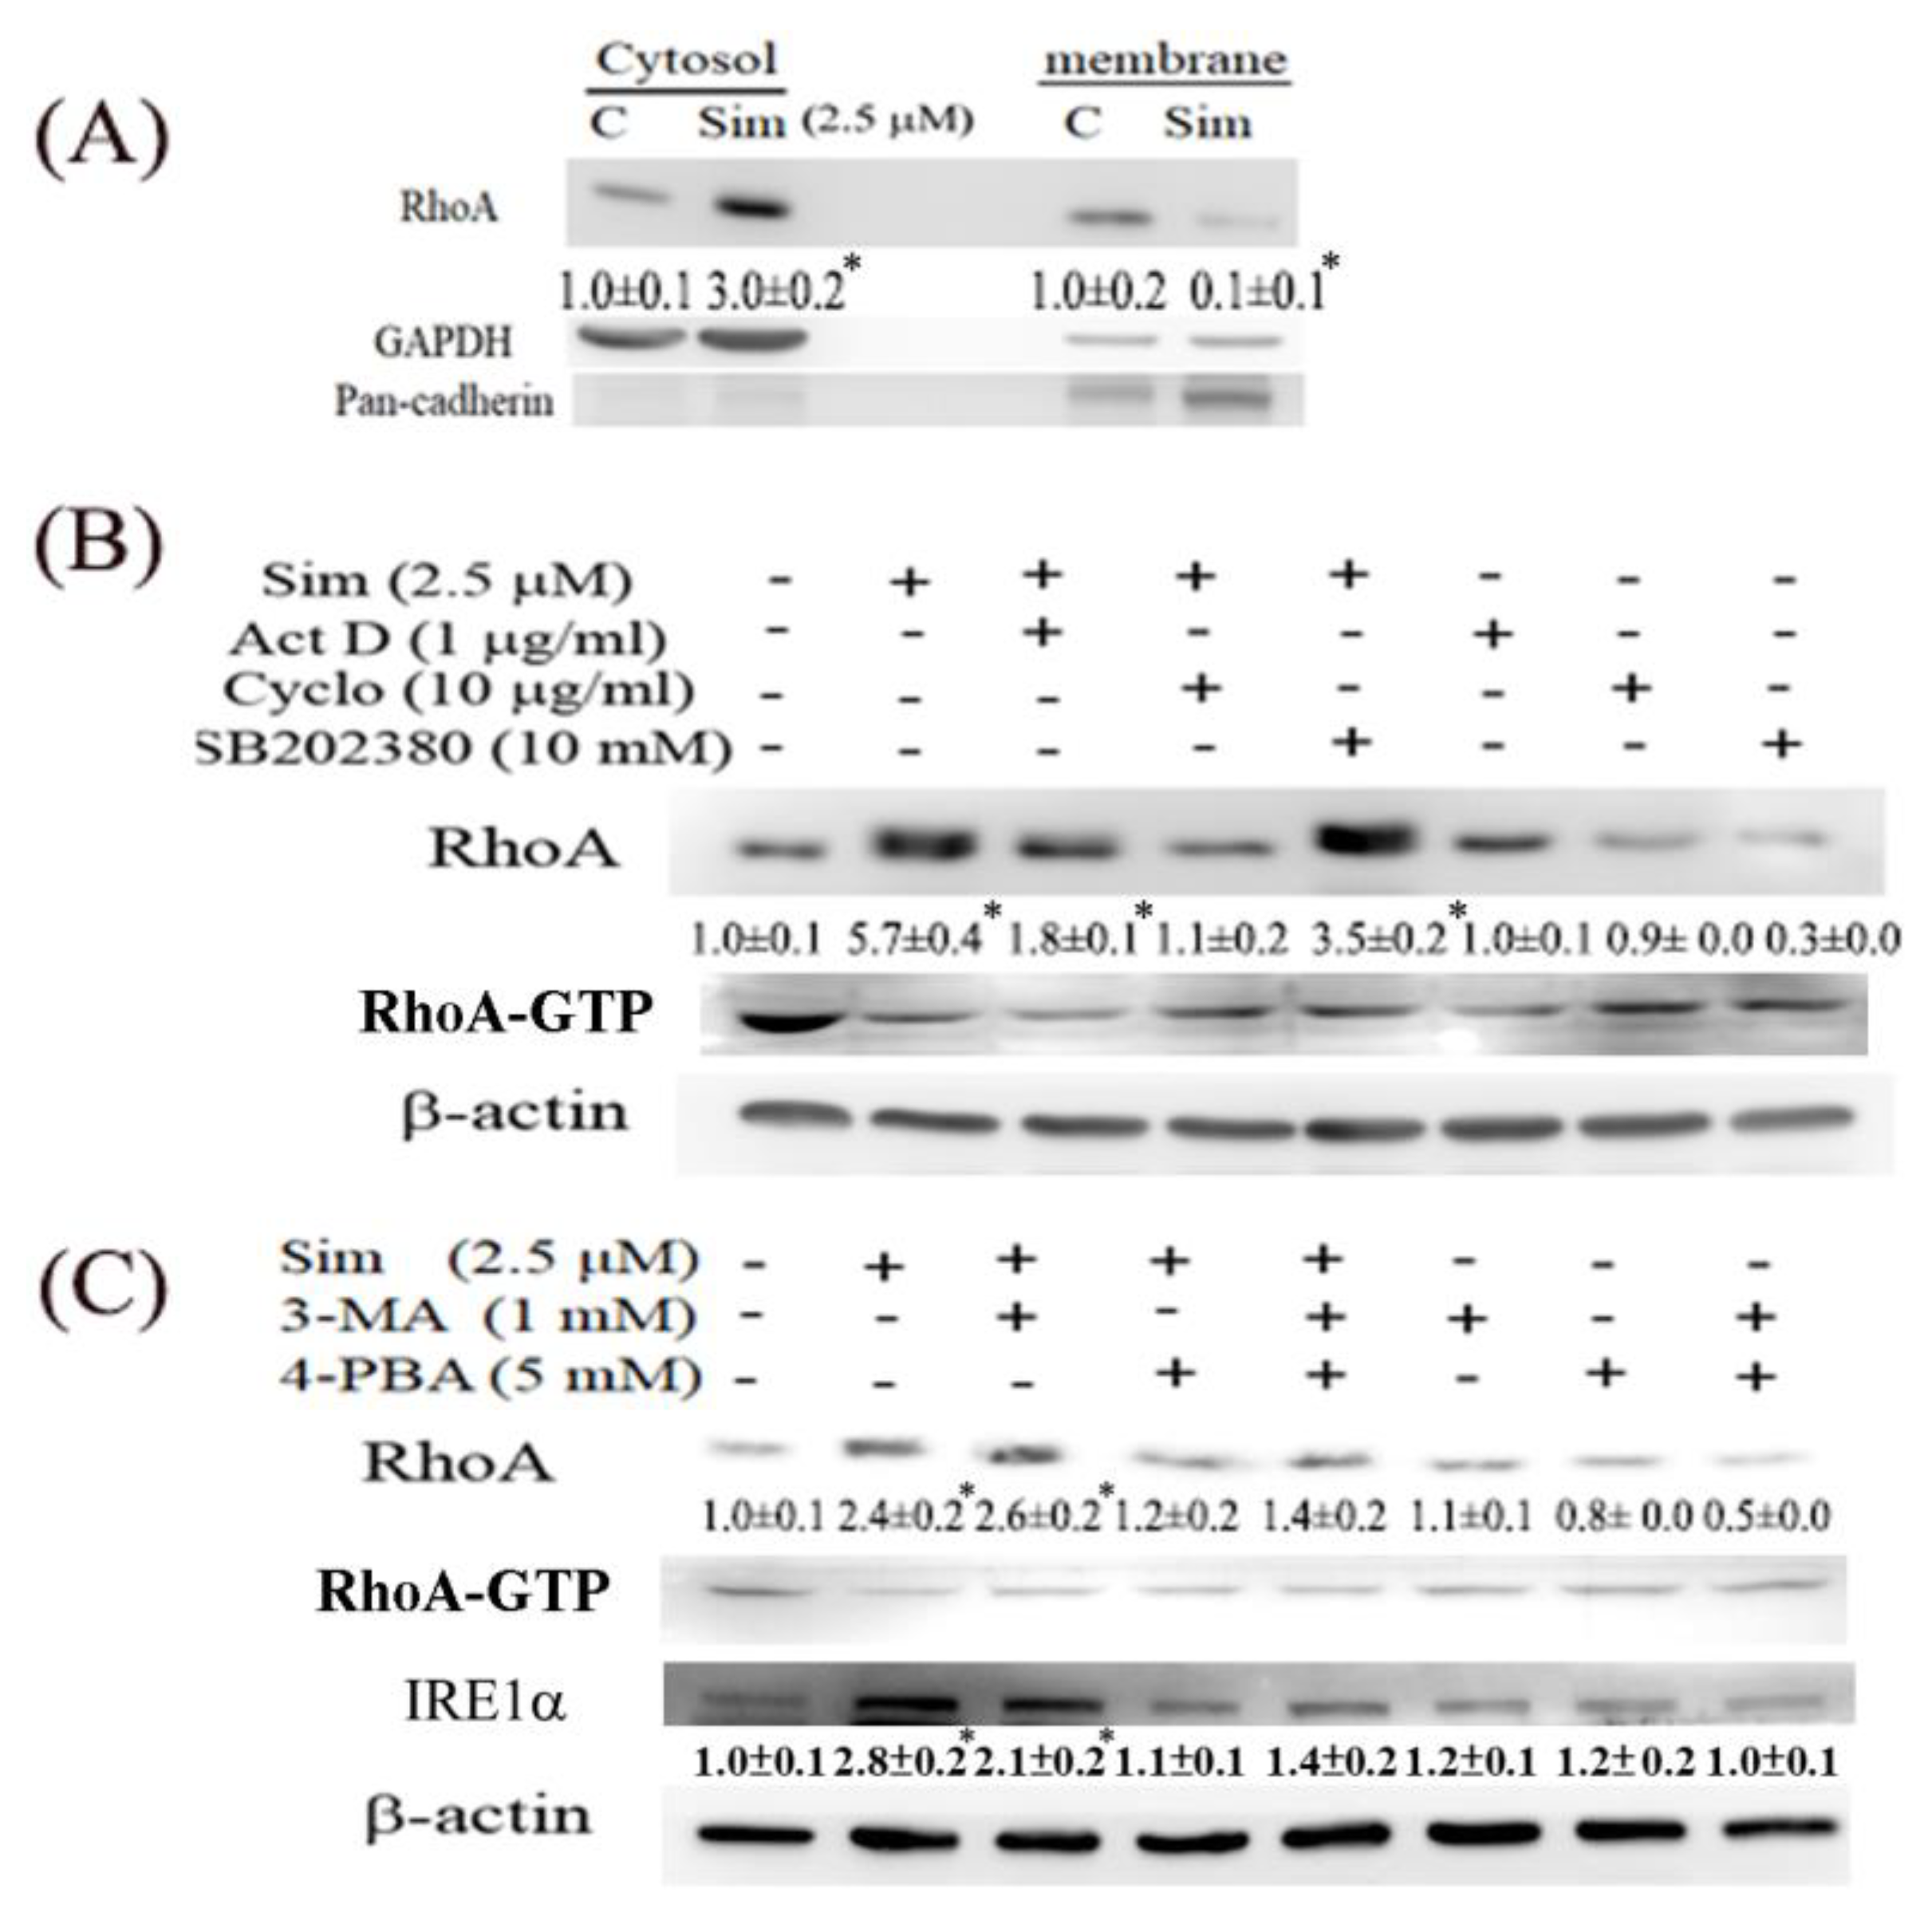
We also observed that simvastatin reduced cell migration, which was associated with decreased RhoA activity, but it induced RhoA expression in ccRCC cells. This phenomenon is attributable to a negative feedback mechanism caused by the inhibition of RhoA prenylation by simvastatin. Although RhoA was transcriptionally and translationally upregulated by simvastatin, RhoA was confined to the cytosol because protein prenylation was reduced in cytosolic–membrane fractionation (
Figure 5). Additionally, simvastatin increased ER stress, accompanied by increased RhoA accumulation, which can be eliminated by 4-PBA (an ER stress inhibitor) in simvastatin-treated ccRCC cells. Moreover, simvastatin reduced RhoA activity, which was further validated by an ELISA analysis of the activity of ROCK (a downstream target of RhoA) (
Figure 6C). The results revealed that simvastatin reduced RhoA activity. We also found that the expression of the RhoA protein and its related pathway were upregulated in the ccRCC data set. These results validated the findings of the GeneSpring analysis of clinical data, which indicated markedly increased RhoA levels in ccRCC of TNM stages 1–2 compared with the levels in ccRCC of stages 3 and 4 versus their paired normal tissues. Thus, early treatment with simvastatin might inhibit the progression of ccRCC by blocking RhoA activation. Thus, RhoA inactivation by simvastatin treatment might have led to the reduced migration of ccRCC cells in the transwell assay, which was confirmed in DNRhoA, but not CARhoA, cells.
Statins have been reported to induce autophagy in cancer cells, which in part contributes to the antimetastatic effect of statins, presumably by interfering with the posttranslational modification of Rho GTPases [
17]. Belaid et al. [
18] demonstrated that cell autophagy plays a critical role in the degradation of active RhoA. Autophagy serves as a RhoA regulator, which aids in maintaining an appropriate amount of active RhoA in cells in order to prevent tumor metastasis. In the present study, we observed the apparent induction of RhoA, pLKB1, and pAMPKα in simvastatin-treated ccRCC cells. Although the antimigratory effects of simvastatin were induced by RhoA inactivation by simvastatin, the mechanism by which the LKB1/AMPKα pathway causes reduced cell migration warrants further investigation. The induction of pLKB1/pAMPKα has been reported to contribute to pmTOR inhibition, autophagy, and reduced cell migration [
19]. Our findings are supported by a study that reported that LKB1 deficiency disturbs the polarity of mammary epithelial cells, resulting in cell disorder and the increased invasion and migration of epithelial cells [
20]. The activation of key targets, pLKB1 and pAMPKα, by simvastatin was significantly reversed by mevalonate supplementation (
Figure 3A). RhoA upregulation was also dependent on the effect of simvastatin on HMG-CoA reductase inhibition, as evidenced by its significant reversal in cells with mevalonate supplementation.
4. Materials and Methods
4.1. Agents
Chemicals were purchased from the following sources: simvastatin, cycloheximide, actinomycin D, and 4-PBA from Sigma-Aldrich (St. Louis, MO, USA); 3-methyladenine (3-MA) from Merck Millipore (Darmstadt, Germany); and 3-(4,5-dimethylthiazol-2-yl)-2,5-diphenyltetrazolium bromide (MTT) from SERVA Electrophoresis GmbH (Berlin, Germany). SB202380 was purchased from Tocris Cookson Inc. (Bristol, UK), and mevalonate was purchased from Biosynth Carbosynth (Berkshire, UK). Unless specified, stock solutions were prepared by dissolving powdered drugs in dimethyl sulfoxide. Protein assay agents were purchased from Bio-Rad (Hercules, CA, USA). The chemical concentrations of agents and treatment duration for each assay were set according to our previous publications [
21] or pilot studies.
4.2. Cell Culture Systems and Subcutaneous Transplantation of Caki2 Cells in Nude Mice
ccRCC cells of Caki1, Caki2, and 786O were maintained in RPMI medium and A498 cells in minimum essential medium (MEM) supplemented with 10% fetal bovine serum (FBS). ccRCC cells were all purchased from ATCC, which were grown to 85–95% confluence before use. RPMI-1640 medium, MEM, FBS, and tissue culture reagents were obtained from Invitrogen (Carlsbad, CA, USA). Cells from passages 5 to 20 were used in the experiments. All animal study procedures were conducted in accordance with the Taipei Medical University Animal Care and Use rules (licenses No. LAC-2018-0436) and Institutional Animal Care and Use Committee or Panel (IACUC/IACUP). Eight-week-old male Balb/c nude mice weighing 20–25 g were maintained in a laminar air-flow cabinet in specific pathogen-free facilities in the Animal Center of Taipei Medical University. After anesthetization, the skins close to thigh and abdomen at the back of the mice were lifted to separate them from the underlying muscle, and then mice were subcutaneously injected with the 5 × 10
8 viable tumor cells suspended in 0.1 mL of 1× HBSS via a 29-gauge needle. The growth of implanted ccRCC cells at subcutaneous tissue were measured weekly, and tumor volume was calculated as follows [
22]: tumor volume = (length × width
2)/2. Tumor weight values were plotted day by day post-injection, and tumor doubling time was calculated from the resulting graph. When the tumor size reached 2 cm in diameter, the mice were sacrificed. Stock solution of 1 mg/kg simvastatin was prepared by dissolving in DMSO.
4.3. Analysis of Cell Cycle Regulation and Apoptosis through Flow Cytometry
For cell cycle analysis, cells were seeded in 60 mm culture dishes and then serum-deprived for 24 h, followed by the indicated treatment. Harvested cells were fixed with 70% ethanol and allowed to set for at least 1 h. To remove ethanol, cells were centrifuged and washed with phosphate-buffered saline (PBS) twice. DNA underwent propidium iodide (PI) staining (PI: 20 µg/mL, Triton-X 100: 0.1%, RNase A: 0.2 µg/mL in ddH2O) for at least 30 min in the dark. Additionally, apoptosis induced by simvastatin in ccRCC cells was detected through annexin V-FITC/PI double labeling flow analysis according to the manufacturer’s instructions (Elabscience, Houston, TX, USA). Flow cytometry was performed using CytoFLEX and CytoExpert software (Beckman Coulter); dot plots and histograms were used for data visualization. Additionally, following two washes with PBS, simvastatin-treated ccRCC cells were stained with 1 μg/mL 4′,6-diamidino-2-phenylindole (DAPI) dye in PBS for 8 min for evaluating apoptotic bodies. Fluorescence was analyzed using a Zeiss Axio Observer Z1 inverted phase contrast microscope (Wilmington, MA, USA).
4.4. Cell Migration
Transwell in vitro invasion assays were conducted to evaluate the transmigration of cells, as described previously [
23], by using 24-well transwell units with 8 μm polyvinylpyrrolidone-free polycarbonate filters (Dow Corning, Midland, MI, USA) that had been coated with 1 mg/mL collagen for 30 min at 37 °C. Pretreated cells (2.5 × 10
4 cells) were seeded in medium containing 2% FBS in the upper compartment of the transwell plates. Medium containing 10% FBS was added to the lower compartment. The transwell plates were incubated at 37 °C for 12 h in a humidified atmosphere containing 5% CO
2. Cells that migrated to the lower surface of the membrane were observed through staining with crystal violet dye under a light microscope. Cells migrating from the leading edge were photographed and counted at 0 and 16 h by using an Olympus SC-5 CCD camera (Tokyo, Japan) attached to an Olympus BX51 microscope system. Fluorescence was observed using a charge-coupled device camera (DP72, Olympus, Melville, NY, USA) attached to a microscope system (BX51, Olympus) at 200× magnification. Four slides with coverslips were examined in each experimental group. The subsequent procedures were described in a previous study [
24].
4.5. Oil-Red O Staining
Cells were seeded in 24-well cell culture plates and treated with the drugs of interest. Cells were fixed in 4% paraformaldehyde for at least 30 min. During fixation, oil-red O (ORO) stock solution (3 mg ORO powder in 1 mL isopropanol) was diluted with deionized water (ddH2O) at a dilution rate of 3:2, and the staining solution was filtered. The fixing solution was discarded, and cells were washed with ddH2O once. Isopropanol (60%) was added to evaporate the remaining water. Lipids were stained using ORO staining solution for 10 min. Wells were washed with tap water until the water ran clear. ORO was dissolved by adding 99% isopropanol, and absorbance was measured using a spectrophotometer at 500 nm.
4.6. Preparation of Cell Fractions (Cytosol and Membrane) and Western Blot Analysis
Cells grown in 6 or 10 cm
2 dishes were harvested after the indicated treatments with protease inhibitors. To prepare membrane–cytosolic fractions, cells were collected after the indicated treatments and incubated in 0.1 mL of hypotonic buffer (10 mM Tris (pH 7.5), 0.5 mM EDTA, and 2 mM phenylmethylsulfonyl fluoride) at 4 °C for 30 min. After centrifugation, the supernatant (cytosolic fraction) was collected, and the pellet was resuspended in 0.1 mL of radioimmunoprecipitation assay buffer and incubated at 4 °C for 30 min. The resulting fractions were sheared 100 times through an insulin syringe with a 29-G needle. After centrifugation, the supernatant (membrane fraction) was collected for analysis. Western blotting was performed as described previously [
24], and the following antibodies were used: antibodies against the RhoA, pAKT1/AKT1, pmTOR/mTOR, p4EBP1, pMLC, p27, FASN, SCD PARP, α-tubulin, β-actin, and pan-cadherin (Santa Cruz Biotechnology, Dallas, TX, USA); LC3BI/II, CDK4, and cyclin D3 (GeneTex, Irvine, CA, USA); p21 (BD Biosciences, San Jose, CA, USA); and cyclin D1, pLKB1, and pAMPKα/AMPKα, (Cell Signaling, Danvers, MA, USA); RhoA-GTP (NewEast Biosciences, King of Prussia, PA, USA). Total protein (80 μg) was separated on a 10% acrylamide gel through sodium dodecyl sulfate–polyacrylamide gel electrophoresis. Hybond-P membranes (GE Healthcare Life Sciences, Waukesha, WI, USA) containing the electrophoretically transferred protein bands were probed using various primary antibodies. Band intensities were normalized to the band intensity of α-tubulin/β-actin (control) by using an IS-1000 digital imaging system (ARRB, Victoria, Australia).
4.7. Cells Overexpressing RhoA Variants and Activity Assay
RhoA constructs of constitutively active (CA) RhoA (G14V) and dominantly negative (DN) RhoA (T19N) in pUSEamp were purchased from Millipore (Burlington, MA, USA). Caki2 cells were transfected with pUSEamp-overexpressing variants (6 µg/10 cm Petri dish) overnight by using Lipofectamine 2000 (Invitrogen). After transfection, cells were plated in RPMI supplemented with 10% FBS and 400 µg/mL G418 as selective pressure. G418-resistant cells were selected and expanded. The resulting cells were harvested and subjected to a Western blot analysis of the proteins of interest. ROCK activity was assessed using enzyme-linked immunosorbent assay (ELISA) kits (Millipore, Burlington, MA, USA) according to the manufacturer’s protocol.
4.8. Gene Set Enrichment Analysis
Expression profiles of the gene expression data series (GSE) 53757 from the Gene Expression Omnibus (GEO) database at the National Center for Biotechnology Information were selected and analyzed using the HG-U133_Plus_2 GeneChip (Affymetrix) [
25]. GeneSpring (v.14.9) and GSEA (v4.2) were employed to normalize the data and to identify gene sets enriched in the ccRCC data set compared with paired adjacent normal renal tissues, respectively. This data set contains 142 expression data files from normal and renal tumor tissues of 71 patients with ccRCC, grouped into tumor–node–metastasis (TNM) stages 1–4. GSEA was performed using GSEA v4.2 software. After gene set permutations were practiced 1000 times, significant gene sets were identified based on enrichment scores (ES) and false discovery rates (FDRs) below 0.25. All gene set files used were obtained from the Molecular Signatures Database.
4.9. Statistical Analysis
Data are presented as the mean ± SEM of at least three experiments. Differences in the means of two groups were calculated using unpaired Student’s t tests, and differences among multiple groups were determined using one-way analysis of variance. The Bonferroni method was used for post hoc analysis. p < 0.05 was considered significant.


 ,
, 


