Author Contributions
J.Z., J.X., P.E.L., T.Z., and X.H. conceived the project and designed the experiments. J.Z., J.X., W.W., M.W. (Miaomiao Wang), L.Y., H.C., and Q.X. generated the data. J.Z., J.X., M.W. (Mingming Wu), C.C., P.E.L., T.Z., and X.H. analyzed the results. J.Z., P.E.L., T.Z., and X.H. wrote the manuscript. All authors have read and agreed to the published version of the manuscript.
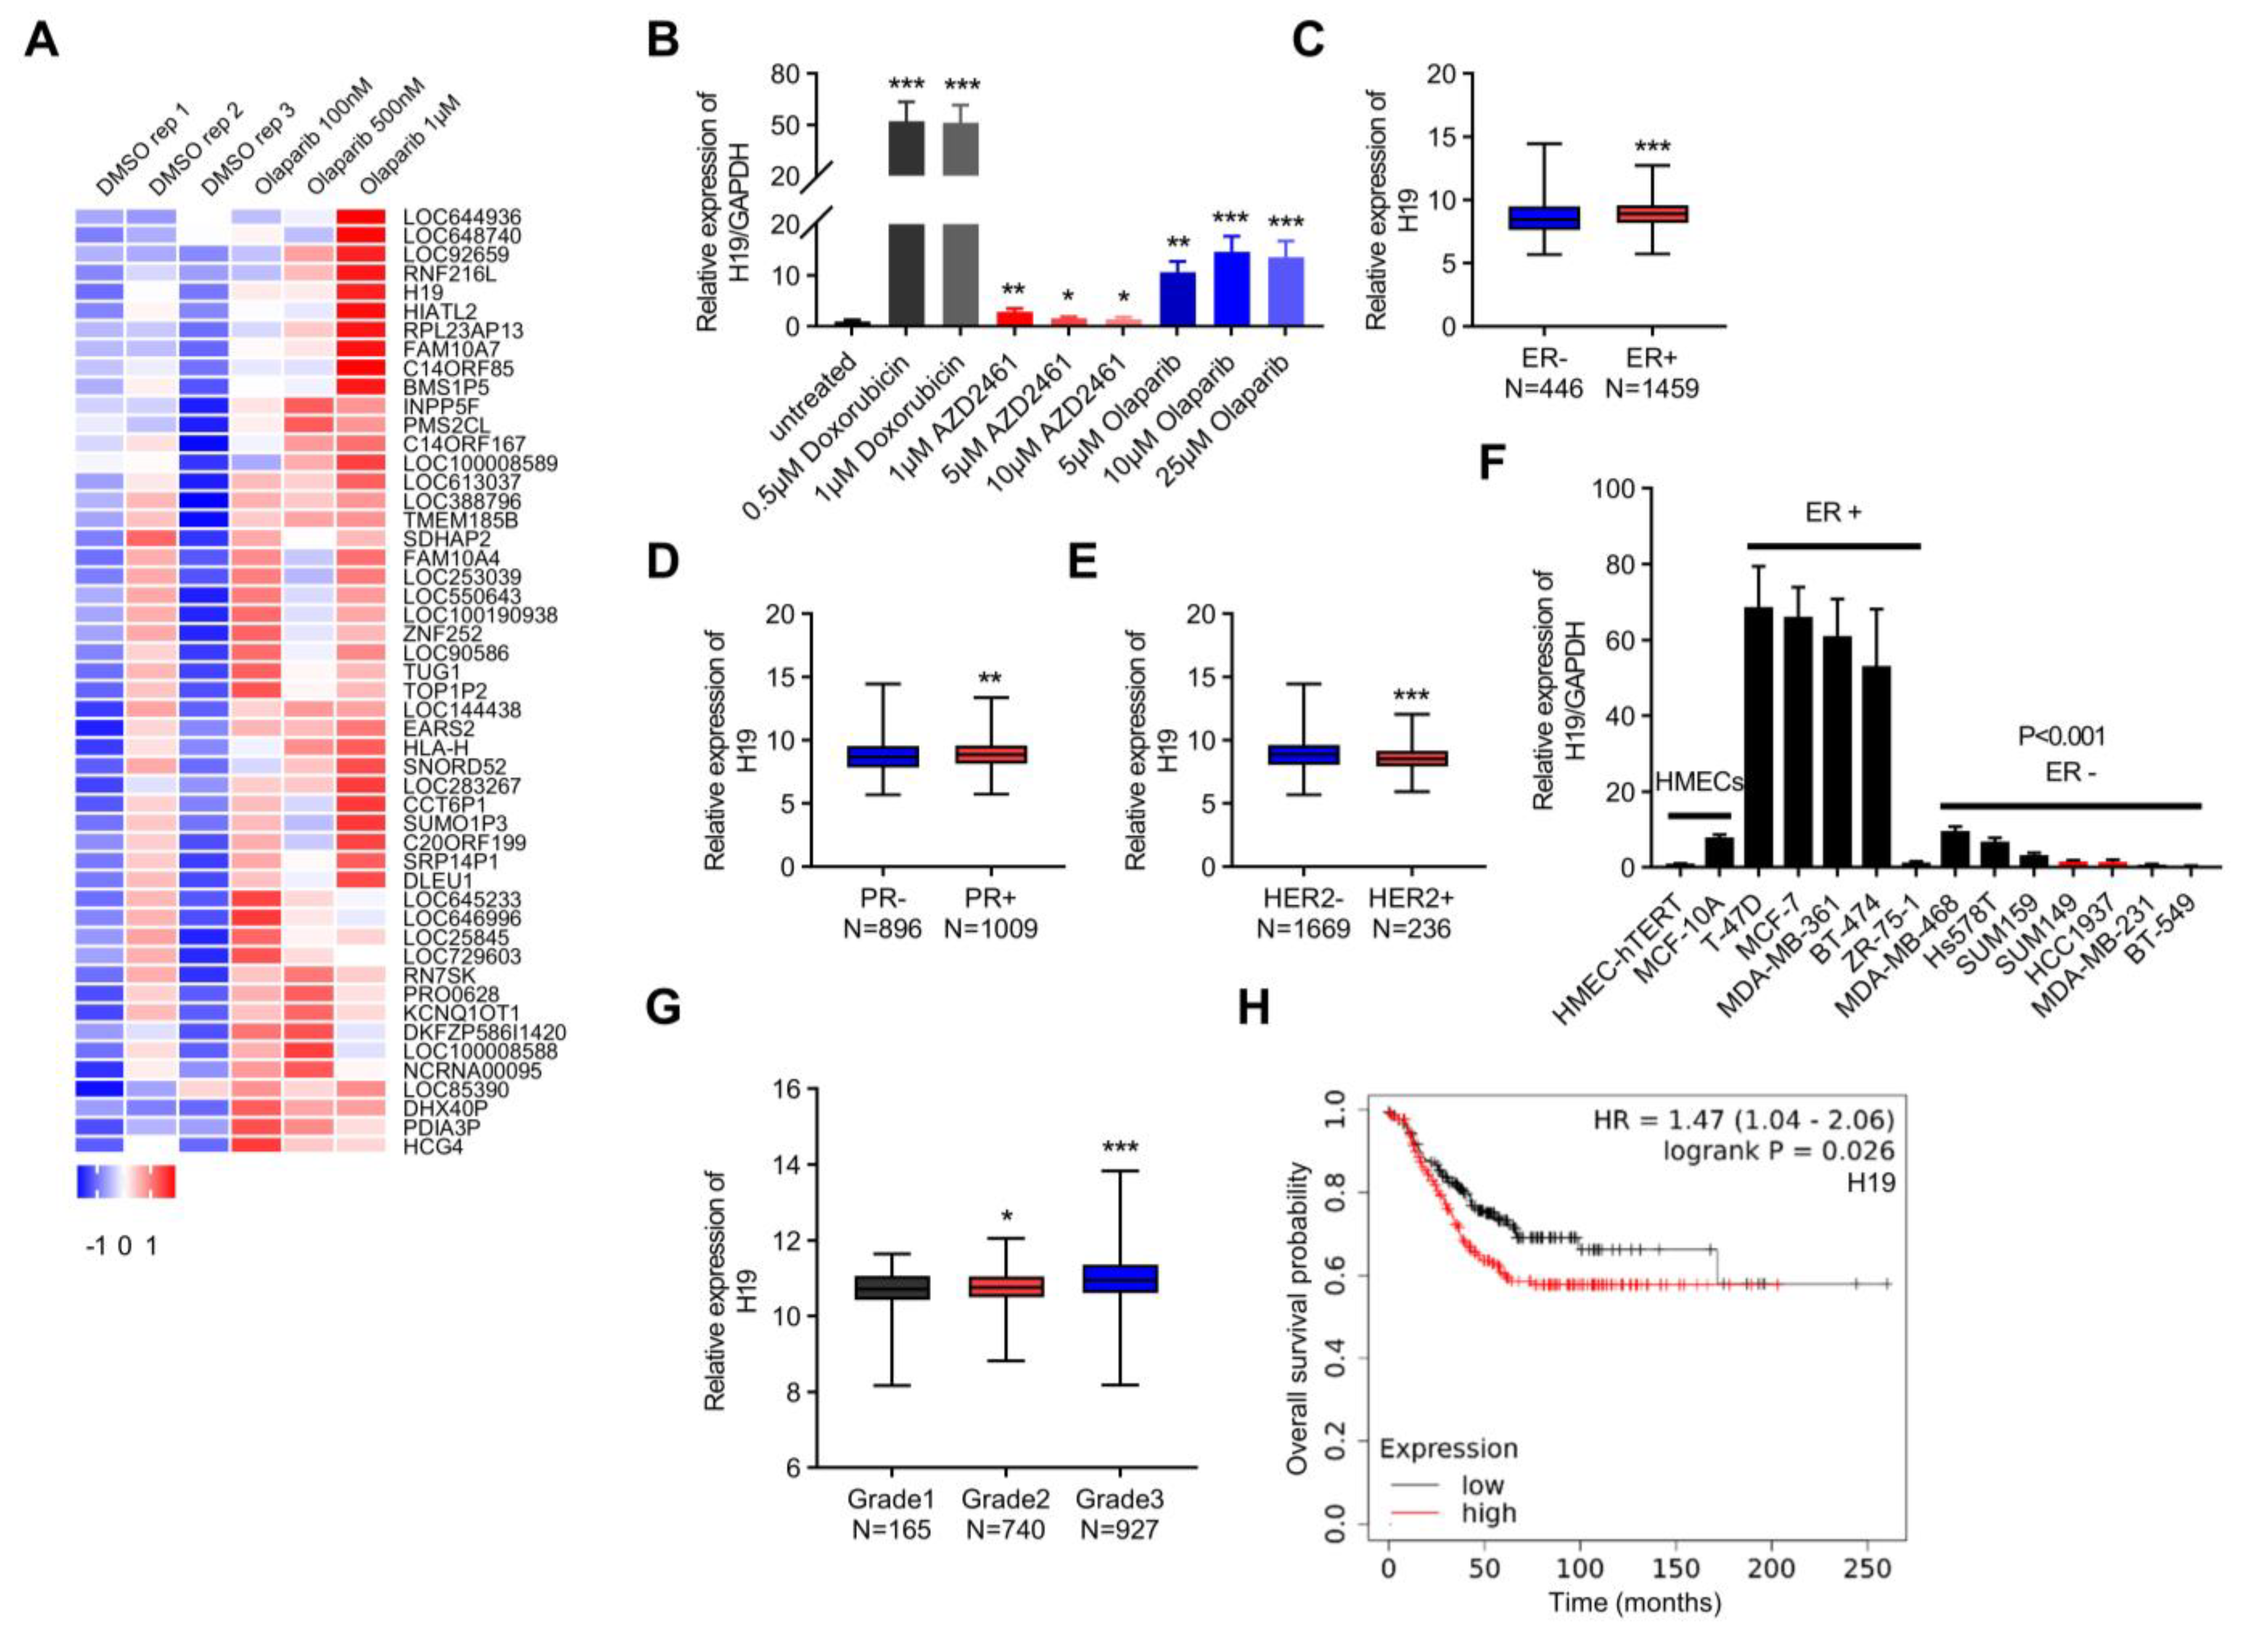
Figure 1.
H19 is associated with DNA damage in breast cancer. (A) The heatmap lists differentially expressed lncRNAs in the GEO database (GSE56400). (B) The H19 levels in response to Doxorubicin and PARP inhibitor treatment were determined by qRT-PCR. Data are shown as means ± SD. * p < 0.05, ** p < 0.01, and *** p < 0.001 by two-tailed Student’s t-test. Data are representative of at least three independent experiments. (C) Box plot showing H19 expression in ER positive (N = 1459) breast cancer samples versus ER negative (N = 446) samples. *** p < 0.001 by two-tailed Student’s t-test. (D) Box plot showing H19 expression in PR positive (N = 1009) breast cancer samples versus PR negative (N = 896) samples. ** p < 0.01 by two-tailed Student’s t-test. (E) Box plot showing H19 expression in HER2 negative (N = 1669) breast cancer samples versus HER2 positive (N = 236) samples. *** p < 0.001 by two-tailed Student’s t-test. (F) The H19 levels in 14 human mammary cell lines were determined by qRT-PCR. Data are shown as means ± SD. p < 0.001 by two-tailed Student’s t-test. Data are representative of at least three independent experiments. (G) Box plot showing H19 expression across different breast cancer histological grading in the TCGA breast cancer cohorts. * p < 0.05, and *** p < 0.001 by two-tailed Student’s t-test. (H) Overall survival of breast cancer patients based on H19 expression in the KM-Plotter database. The Affymetrix ID of H19 is 224646_x_at. The upper quartile expression value was used as the cutoff. p value was determined by the Log-rank test.

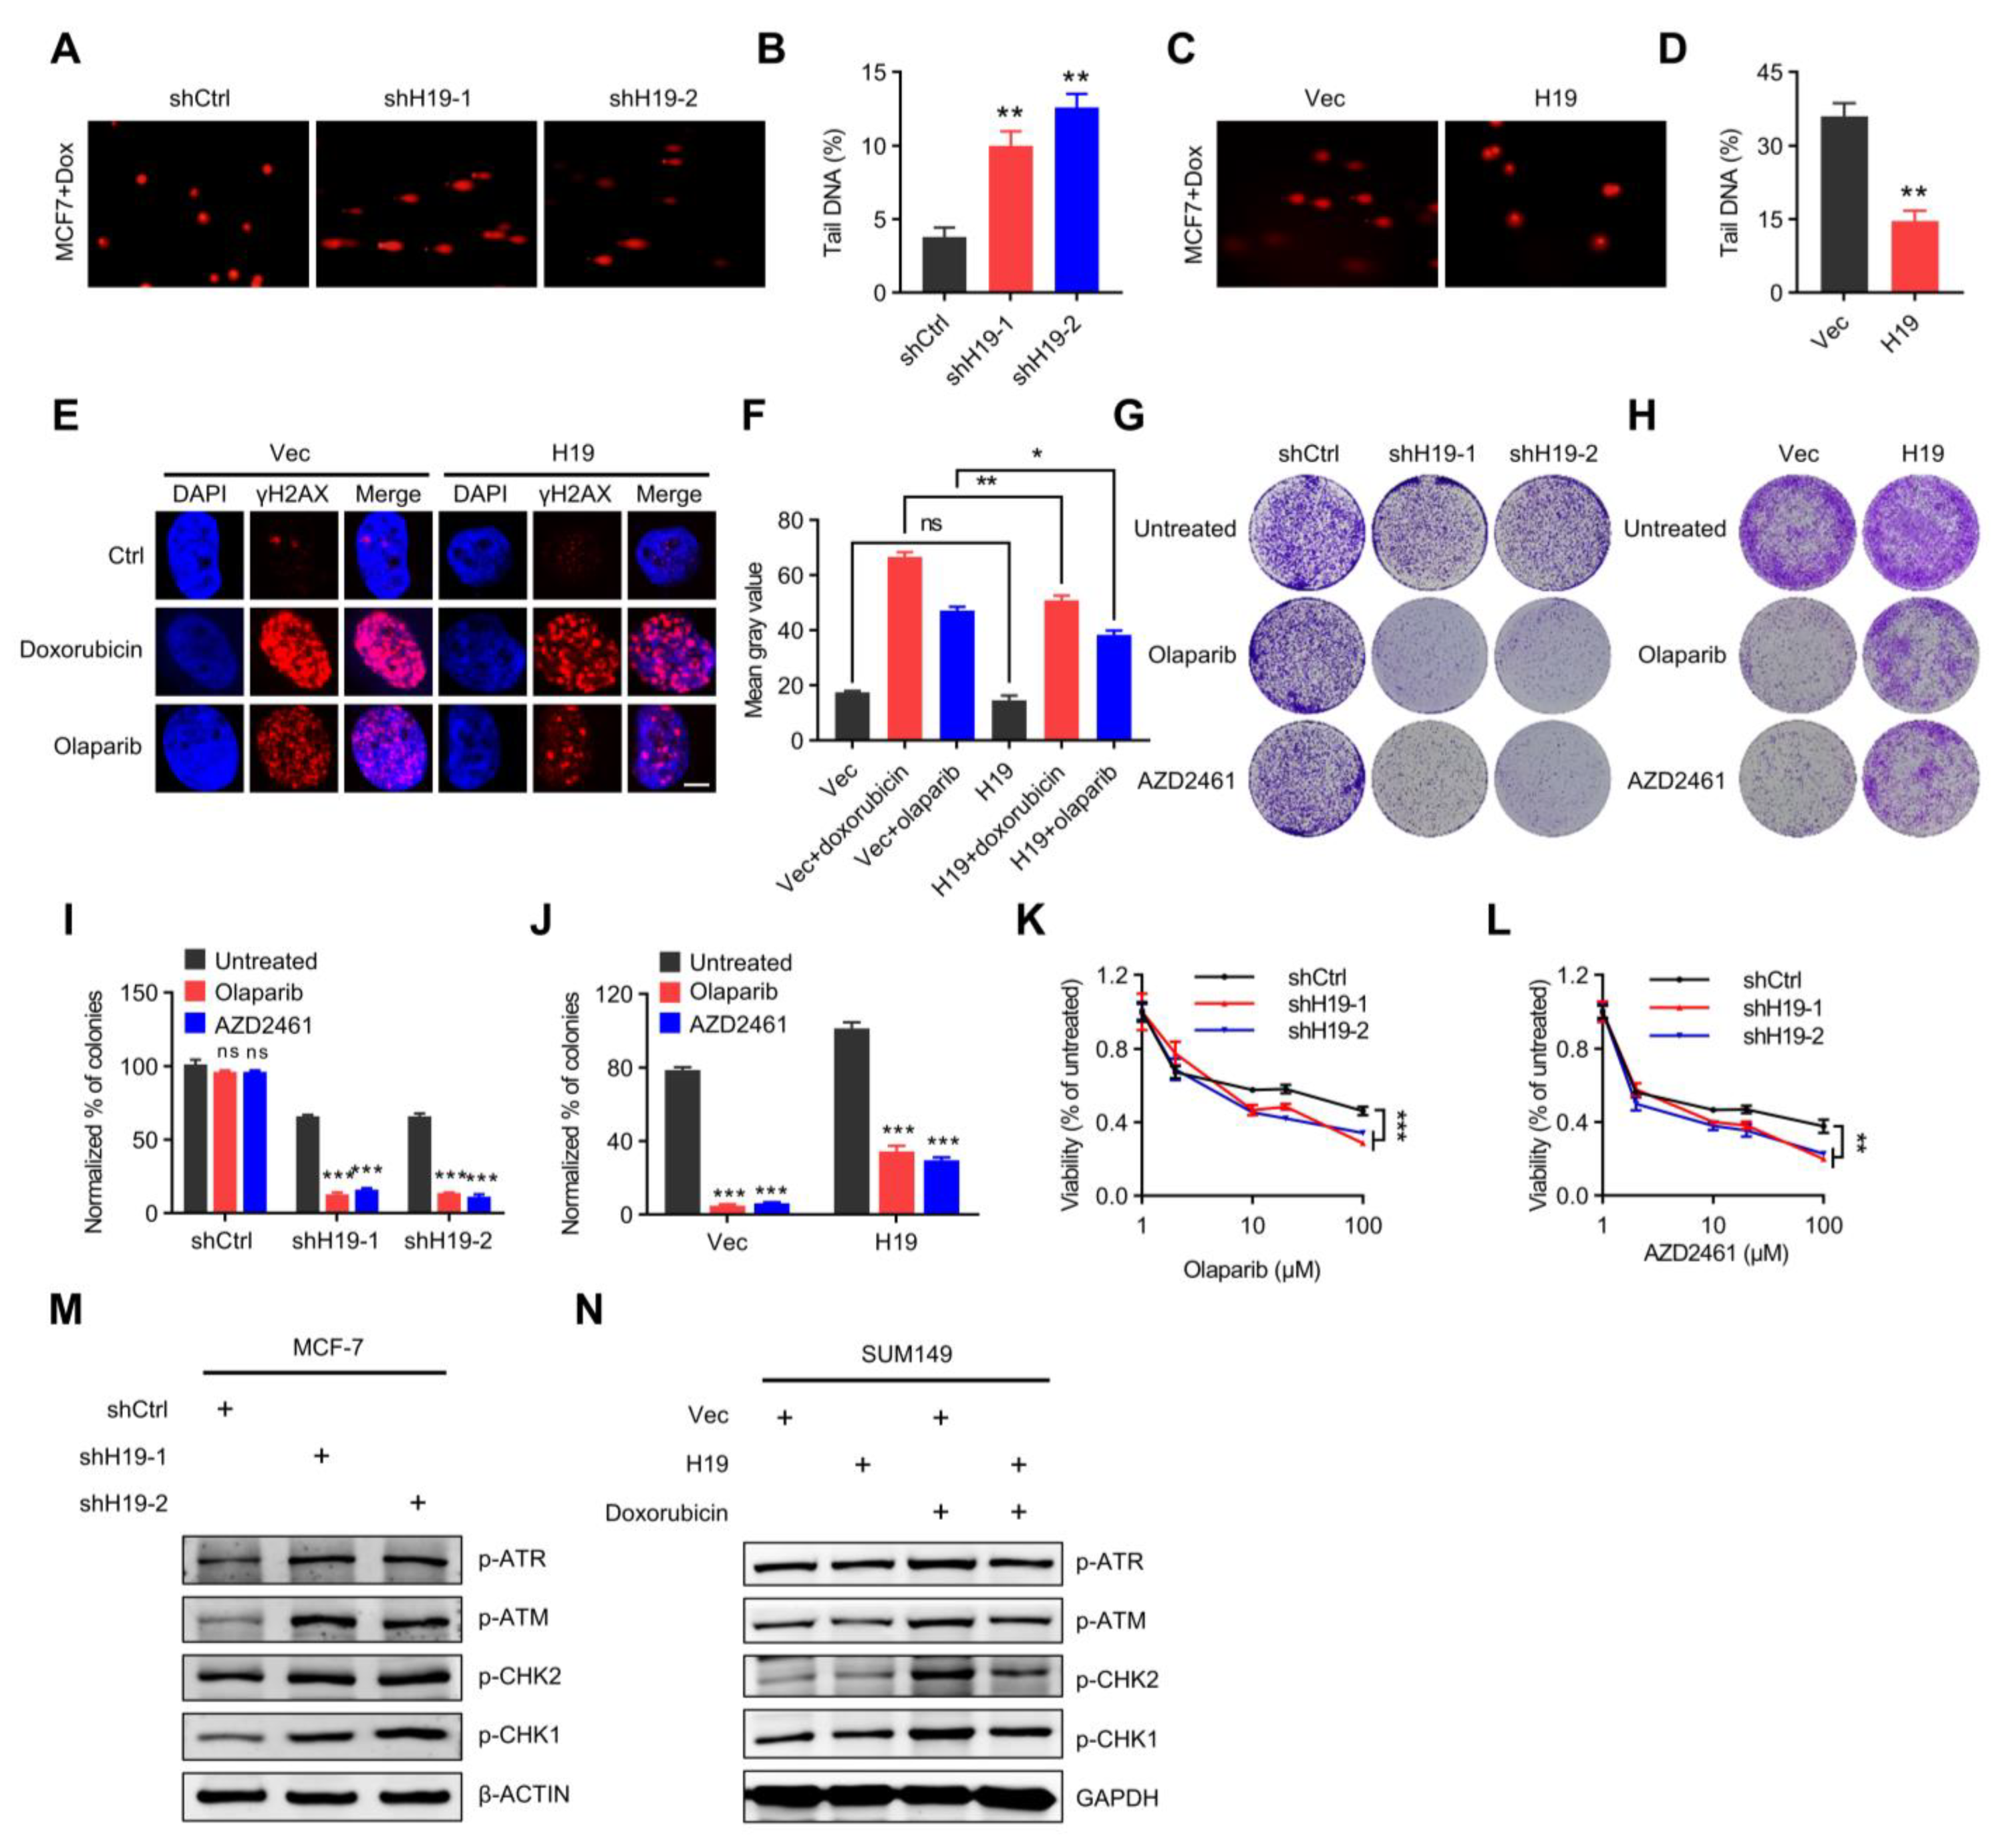
Figure 2.
H19 regulates DNA damage response and sensitivity to PARP inhibitors. (A,B) Doxorubicin-induced DNA damage in control and H19-depleted MCF-7 cells as measured by comet assay. Scale bars, 10 µm. Levels of DNA damage quantified by the tail moment. Error bars, s.d. ** p < 0.01 by two-tailed Student’s t-test. n = 3 independent cell cultures. (C,D) Doxorubicin-induced DNA damage in control and MCF-7 cells with forced expression of H19 as measured by comet assay. Scale bars, 10 µm. Levels of Doxorubicin-induced DNA damage quantified by the tail moment. Error bars, s.d. ** p < 0.01 by two-tailed Student’s t-test; n = 3 independent cell cultures. (E) Doxorubicin or Olaparib-induced DNA damage in control and T47D cells with forced expression of H19 as measured by immunofluorescence staining. Representative pictures of γ-H2AX-positive foci in control cells and cells with forced expression of H19. Scale bars, 5 µm. One hundred cells were analyzed for each time point. (F) Quantification of the mean grey value of γ-H2AX-positive foci in the control cells and T47D cells with forced expression of H19. Error bars, s.d. ns, not significant, * p < 0.05, and ** p < 0.01 by two-tailed Student’s t-test; n = 3 independent cell cultures. (G) Long-term clonogenic assay using MCF-7 cells transfected with the indicated constructs and treatments. (H) Long-term clonogenic assay using SUM149 cells transfected with the indicated constructs and treatments. (I) Quantification of the clonogenic assay in G by determining the absorbance of crystal violet at 590 nm. All groups were normalized to the absorbance of the vector control. The data represent the mean ± s.d. ns, not significant, and *** p < 0.001 by two-tailed Student’s t-test; n = 3 independent cell cultures. (J) Quantification of the clonogenic assay in H by determining the absorbance of crystal violet at 590 nm. All the groups were normalized to the absorbance of the vector control. The data represent the mean ± s.d. *** p < 0.001 by two-tailed Student’s t-test; n = 3 independent cell cultures. (K) Survival of control or H19-depleted MCF-7 cells in response to Olaparib treatments. Cells transfected with control or H19-specific shRNAs were treated with different concentrations of Olaparib and the survival after treatment was measured. Error bars, s.d. *** p < 0.001 by ANOVA test; n = 3 independent cell cultures. (L) Survival of control or H19-depleted MCF-7 cells in response to AZD2461 treatment. Cells transfected with control or H19-specific shRNAs were treated with different concentrations of AZD2461 and the survival after treatment was measured. Error bars, s.d. ** p < 0.01 by ANOVA test; n = 3 independent cell cultures. (M) Several DNA damage response-related proteins were detected in H19-depleted and shCtrl MCF-7 cells. Cell lysates were analyzed by immunoblotting. The data shown represent three independent experiments. (N) Several DNA damage response-related proteins were detected in H19 forced expression and control SUM149 cells pre-treatment with doxorubicin. Cell lysates were analyzed by immunoblotting. The data shown represent three independent experiments.

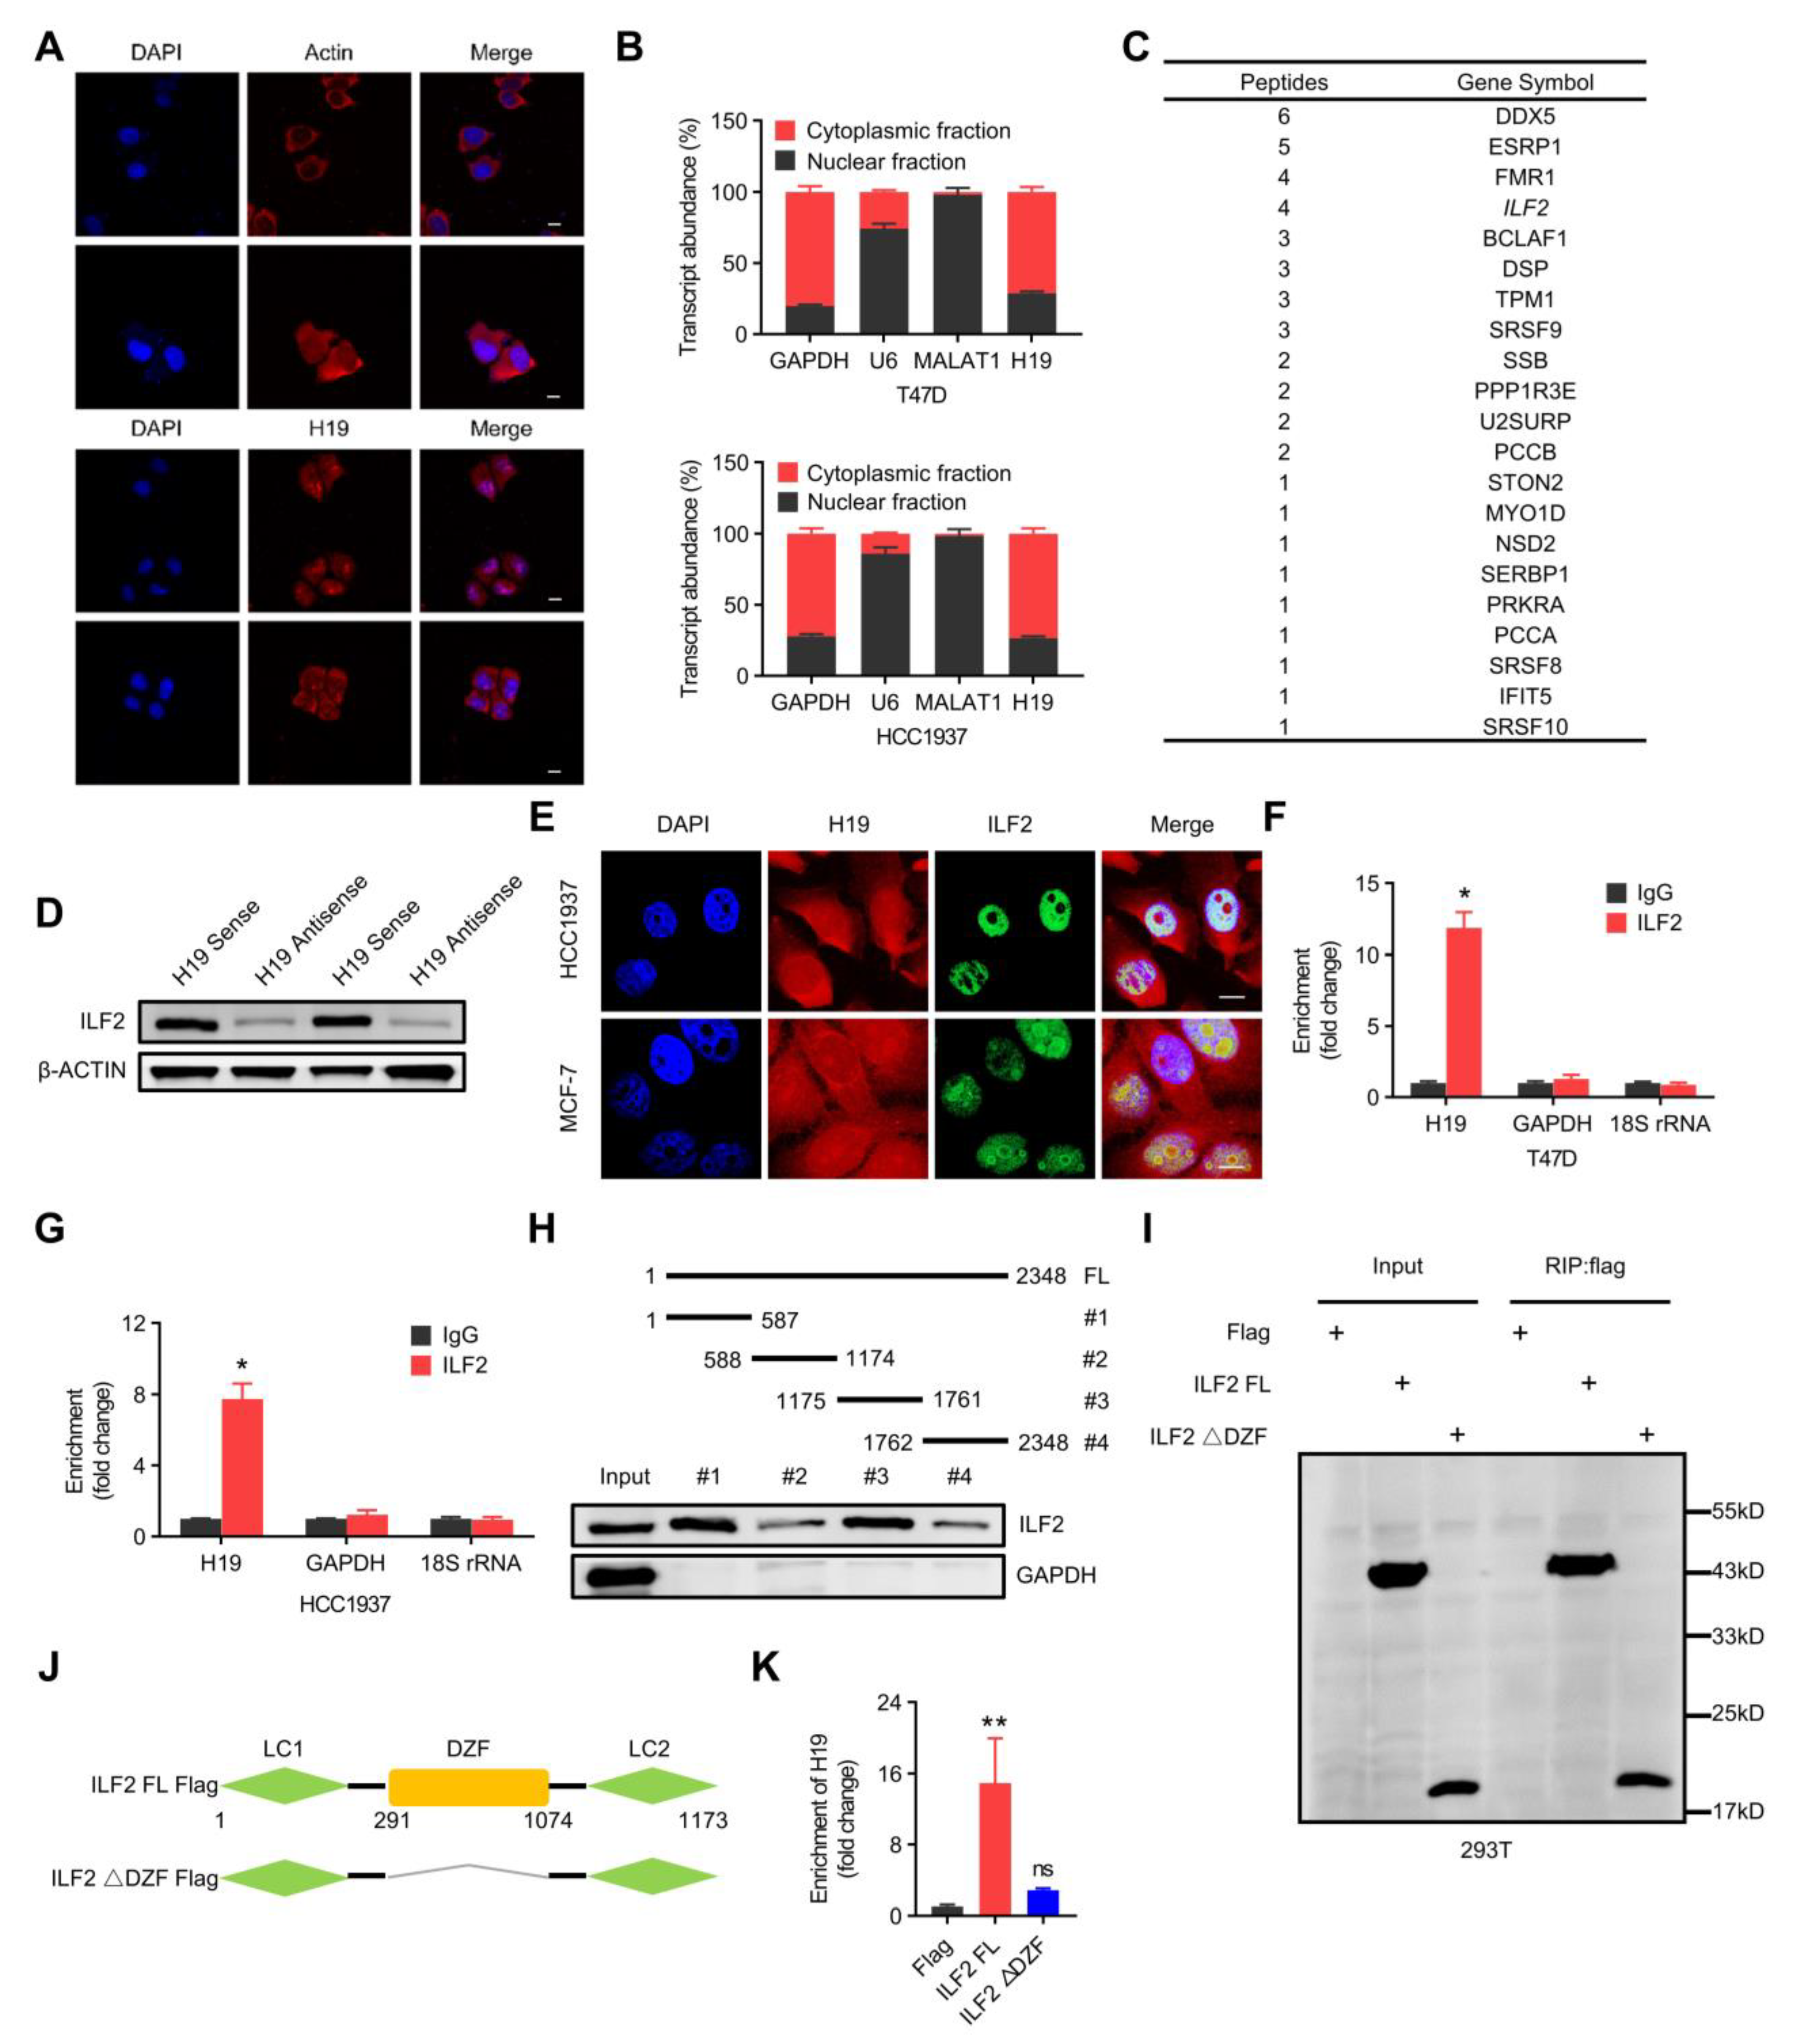
Figure 3.
H19 interacts with ILF2 directly. (A) H19 intracellular localization was visualized in MCF-7 cells by RNA-FISH assays. Representative images are shown. DAPI, 4′,6-diamidino-2-phenylindole. Probes, H19. Scale bar, 10 μm. (B) Subcellular fractionation of T47D and HCC1937 cells followed by quantitative real-time PCR. U6 RNA served as a positive control for nuclear gene expression. Data are shown as means ± SD. Data are representative of at least three independent experiments. (C) Biotin-RNA pulldowns were performed with whole extracts of MCF-7 cells using full-length H19 transcript (sense) and antisense followed by mass spectrometry. This table shows the differential proteins that were enriched. (D) The interaction between H19 and ILF2 was confirmed by RNA pulldown and western blot. β-ACTIN was used as input control. (E) H19 was visualized by RNA-FISH, and immunofluorescence staining of ILF2 in MCF-7 and HCC1937 cells was performed. Scale bar, 10 μm. (F,G) The interaction of H19 with ILF2 was verified by an RNA immunoprecipitation (RIP) assay. The results are shown as means ± SD. * p < 0.05 by two-tailed Student’s t-test. (H) Mapping analysis of ILF2 binding domains of H19, showing the following: schematic diagram of H19 full-length and truncated fragments (top panel); western blot of ILF2 in RNA pulldown samples by different H19 fragments (bottom panel). (I–K) Deletion mapping for the domains of ILF2 that bind to H19. RIP analysis for H19 enrichment in cells transiently transfected with plasmids containing the indicated FLAG-tagged full-length or truncated constructs. The results are shown as means ± SD. ns, not significant, and ** p < 0.01 by two-tailed Student’s t-test; n = 3 independent cell cultures.

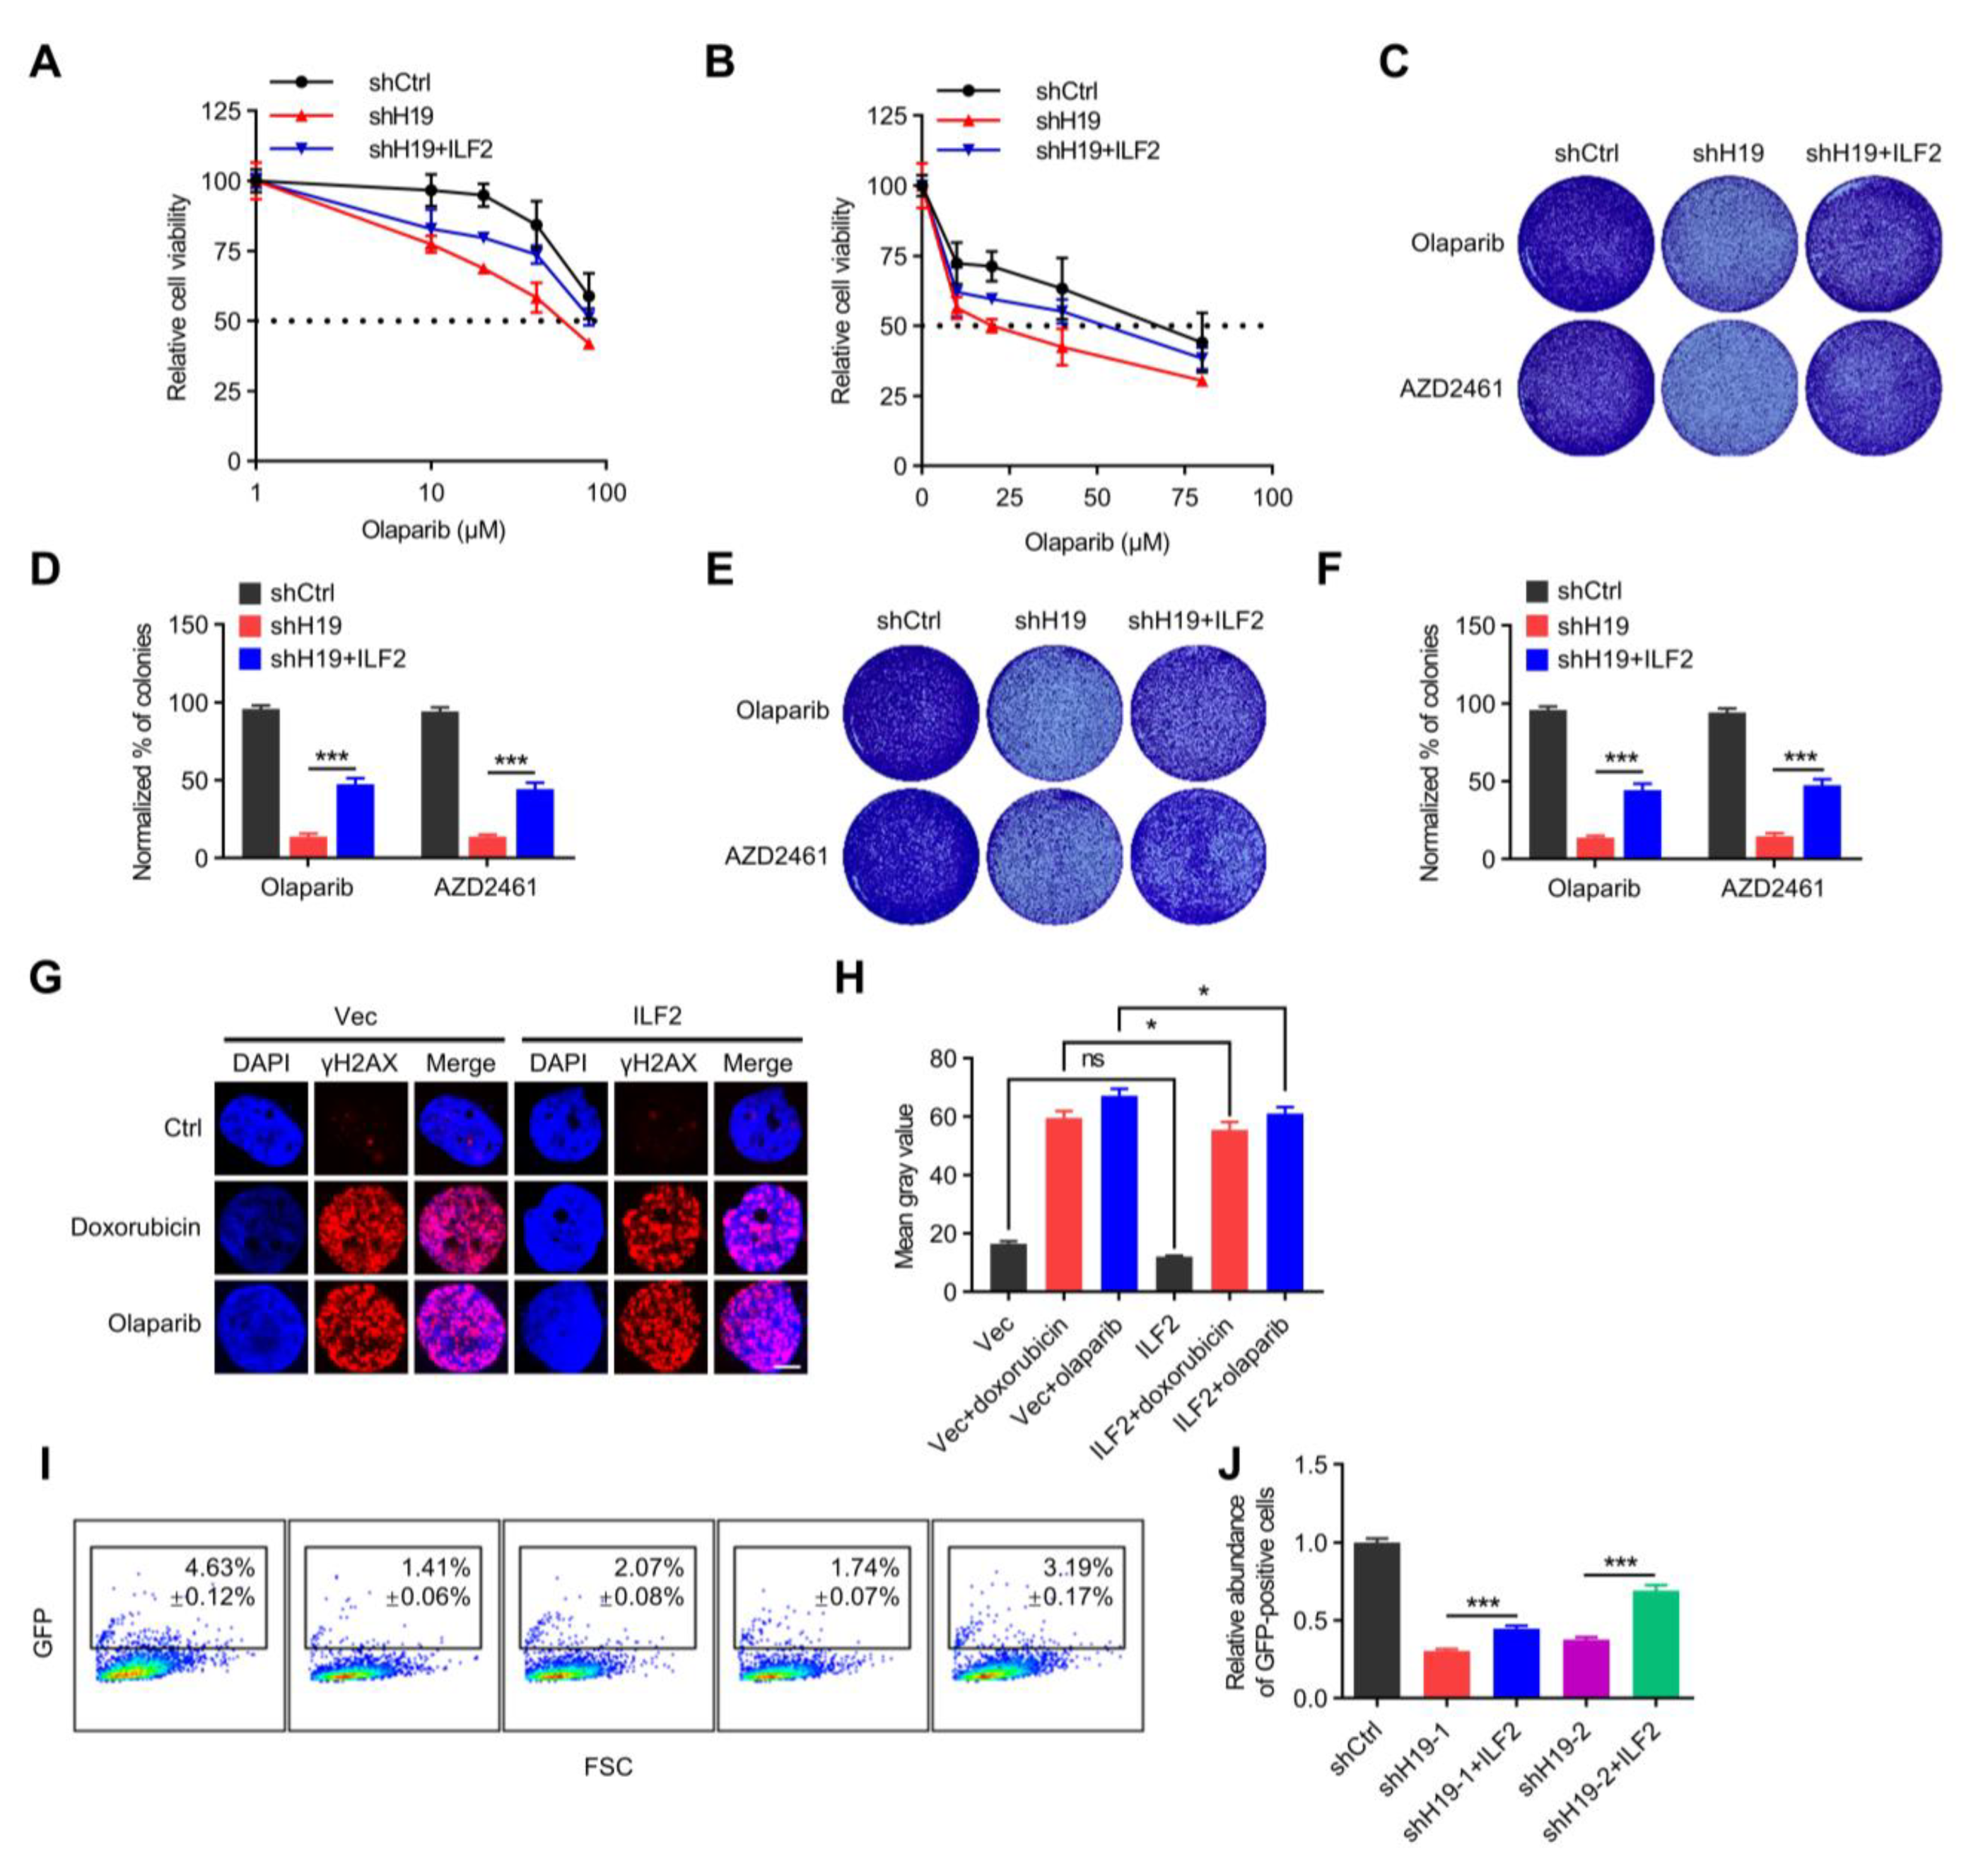
Figure 4.
H19 regulates DNA damage repair via binding to ILF2. (A) Cell viability of MCF-7 cells transfected with H19 shRNA and/or Flag-ILF2 was determined by MTT. (B) Cell viability of T47D cells transfected with H19 shRNA and/or Flag-ILF2 was determined by MTT. (C) Colony formation was determined in MCF-7 cells transfected with H19 shRNA and/or Flag-ILF2. (D) Quantification of the clonogenic assay in C by determining the absorbance of crystal violet at 590 nm. All the groups were normalized to the absorbance of the vector control. The data represent the mean ± s.d. *** p < 0.001 by two-tailed Student’s t-test; n = 3 independent cell cultures. (E) Colony formation was determined in T47D cells transfected with H19 shRNA and/or Flag-ILF2. (F) Quantification of the clonogenic assay in E by determining the absorbance of crystal violet at 590 nm. All groups were normalized to the absorbance of the vector control. The data represent the mean ± s.d. *** p < 0.001 by two-tailed Student’s t-test; n = 3 independent cell cultures. (G) Doxorubicin or Olaparib-induced DNA damage in control and T47D cells with forced expression of ILF2 as measured by immunofluorescence staining. Representative pictures of γ-H2AX-positive foci in control cells and cells with forced expression of ILF2. Scale bars, 5 µm. One hundred cells were analyzed for each time point. (H) Quantifying the mean grey value of γ-H2AX-positive foci in control cells and cells with forced expression of ILF2. Error bars, s.d. ns, not significant, and * p < 0.05 by two-tailed Student’s t-test; n = 3 independent cell cultures. (I,J) H19-depletion or ILF2-supplementation modulated HR DNA repair. FSC, forward scatter. Data are shown as mean ± s.d. *** p < 0.001 by two-tailed Student’s t-test; n = 3 independent experiments.

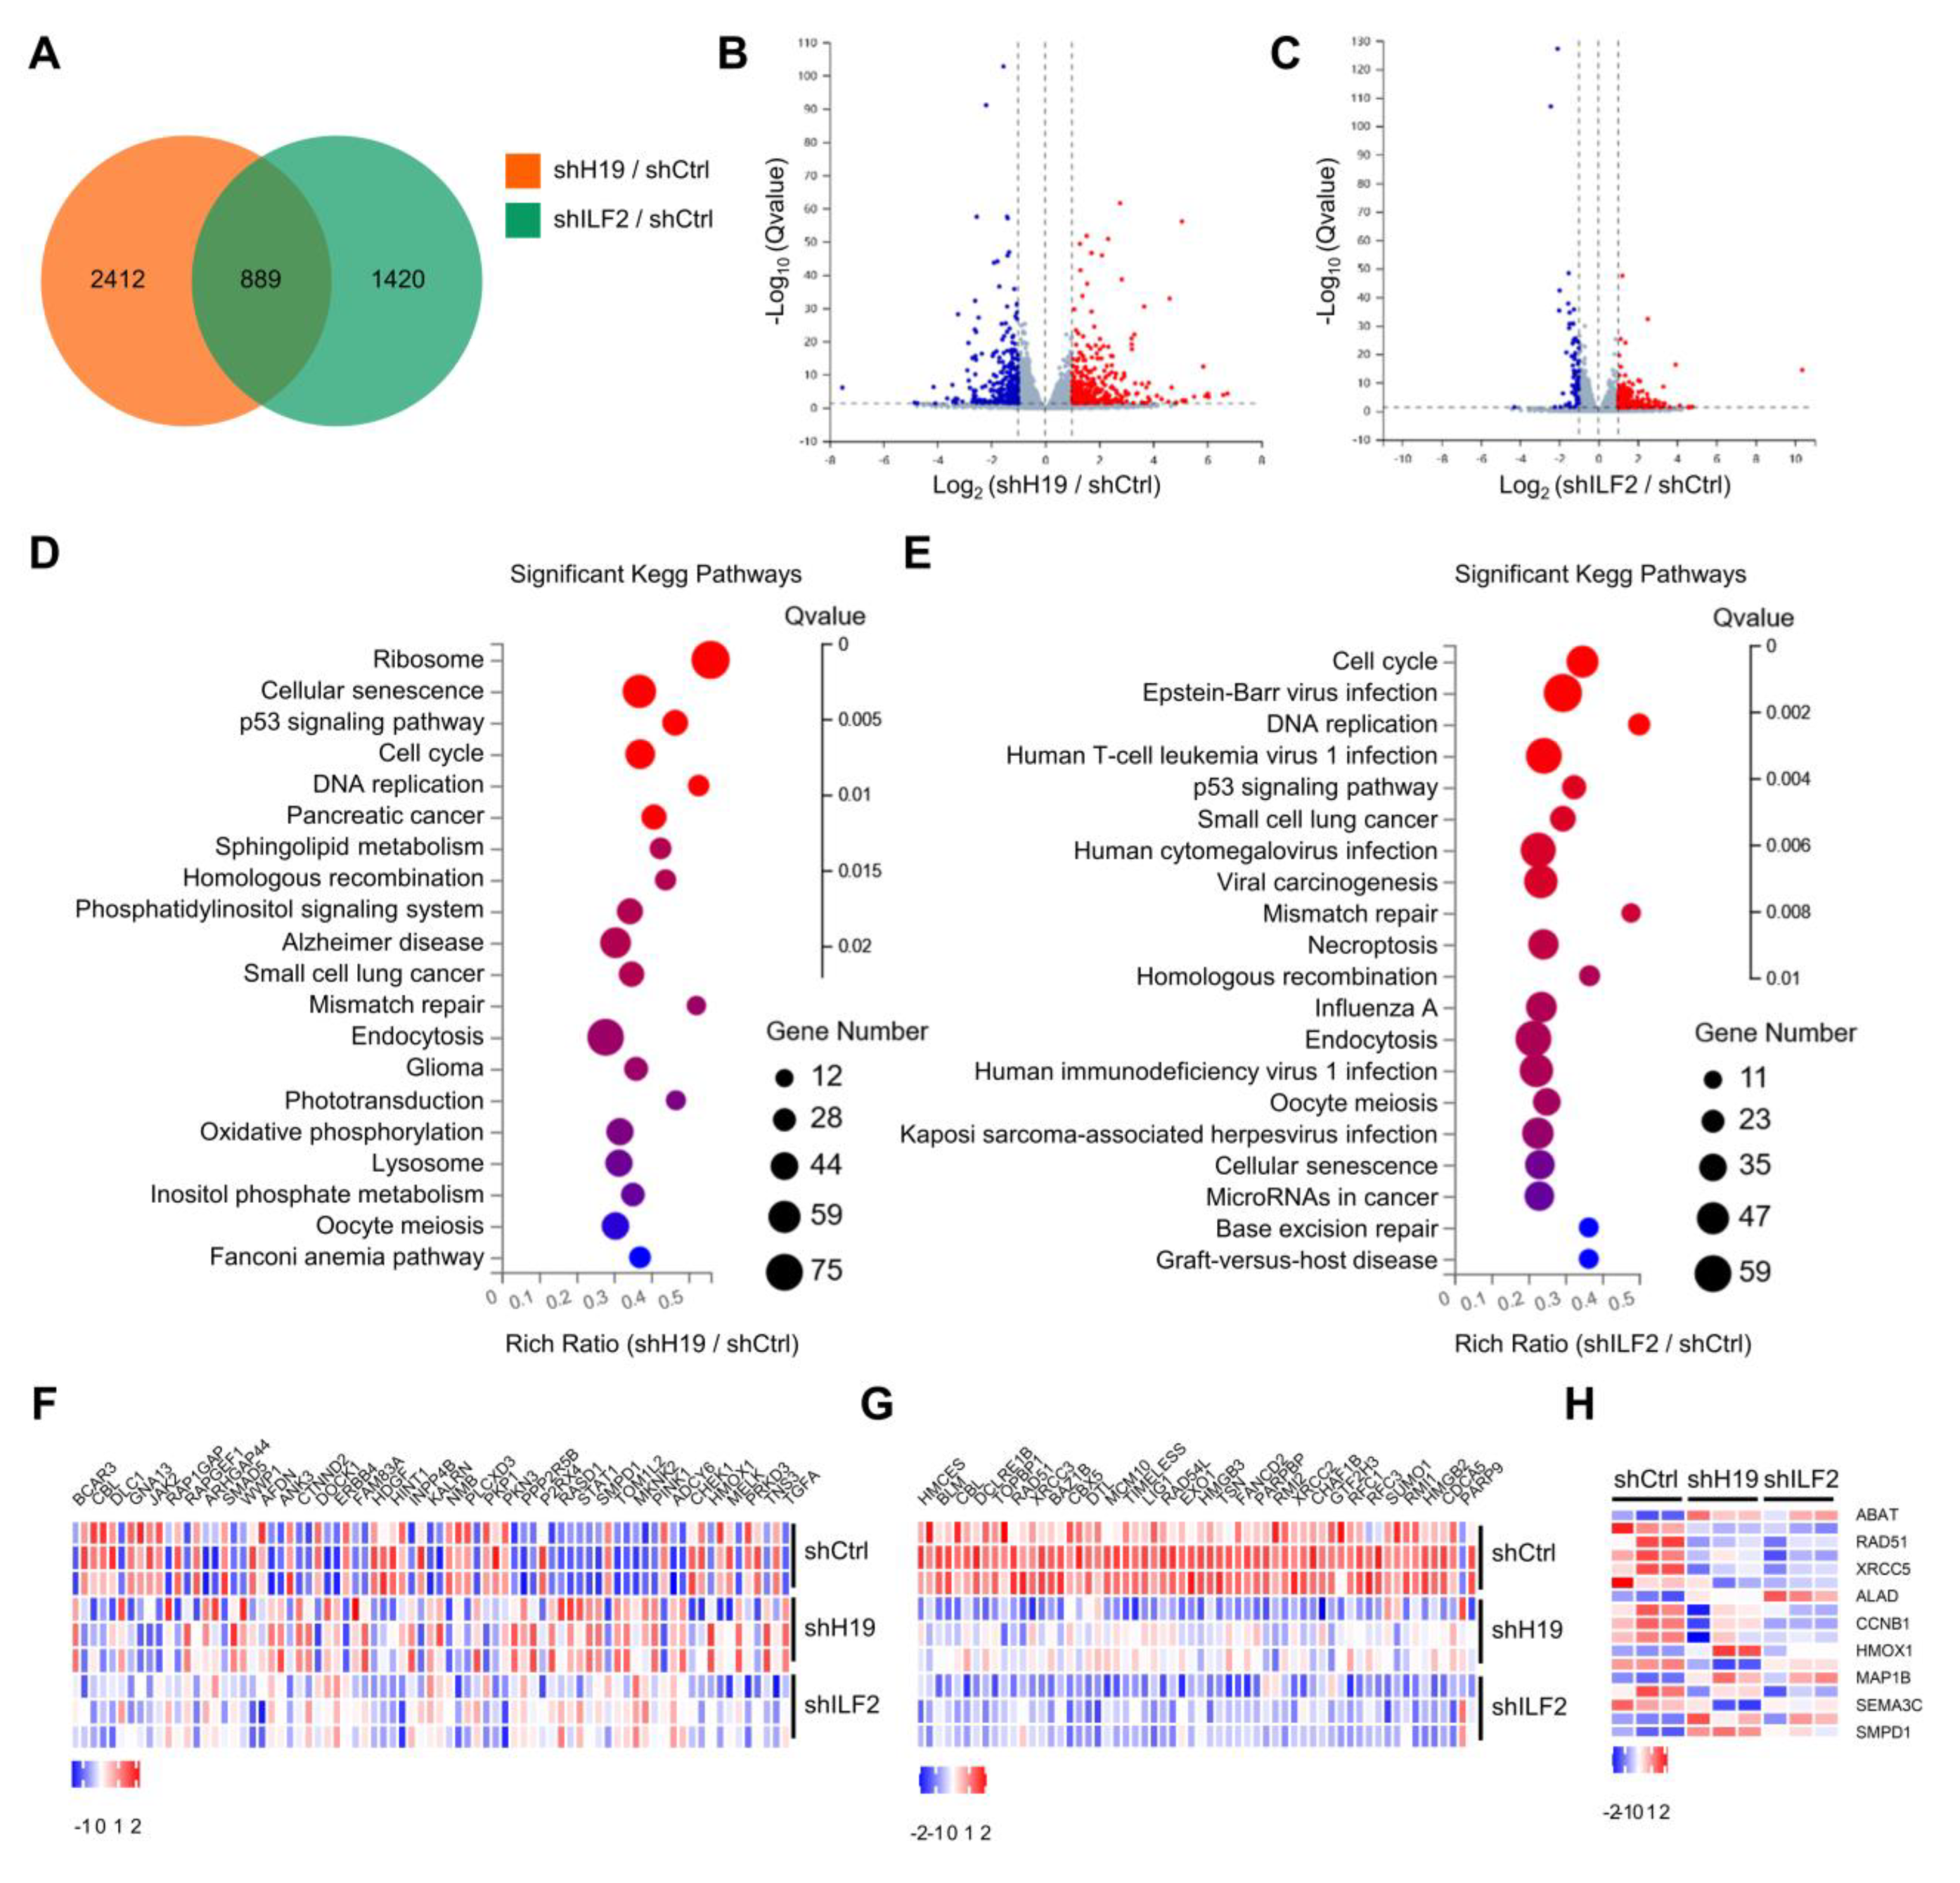
Figure 5.
H19 and ILF2 affect the expression of genes involved in the DNA damage response. (A) Venn diagram representing 889 overlapping transcripts obtained from H19 RNA-seq (yellow) and ILF2 RNA-seq (green). (B) Volcano plot showing differentially expressed mRNAs in MCF-7 cells upon H19 depletion. (C) Volcano plot showing differentially expressed mRNAs in MCF-7 cells upon ILF2 depletion. (D) Summary of gene set enrichment analysis (GSEA) of protein-coding genes ranked by differentially expressed genes (H19 depletion versus control) correlation values using annotated KEGG (Kyoto Encyclopedia of Genes and Genomes) pathways. (E) Summary of gene set enrichment analysis (GSEA) of protein-coding genes ranked by differentially expressed genes (ILF2 knockdown versus control) correlation values using annotated KEGG (Kyoto Encyclopedia of Genes and Genomes) pathways. (F) Differential HR-related genes were validated in H19 or ILF2-silenced MCF-7 cells. (G) Differential DDR-related genes were validated in H19 or ILF2-silenced MCF-7 cells. (H) Differential responses to drug-related genes were validated in H19 or ILF2-silenced MCF-7 cells.

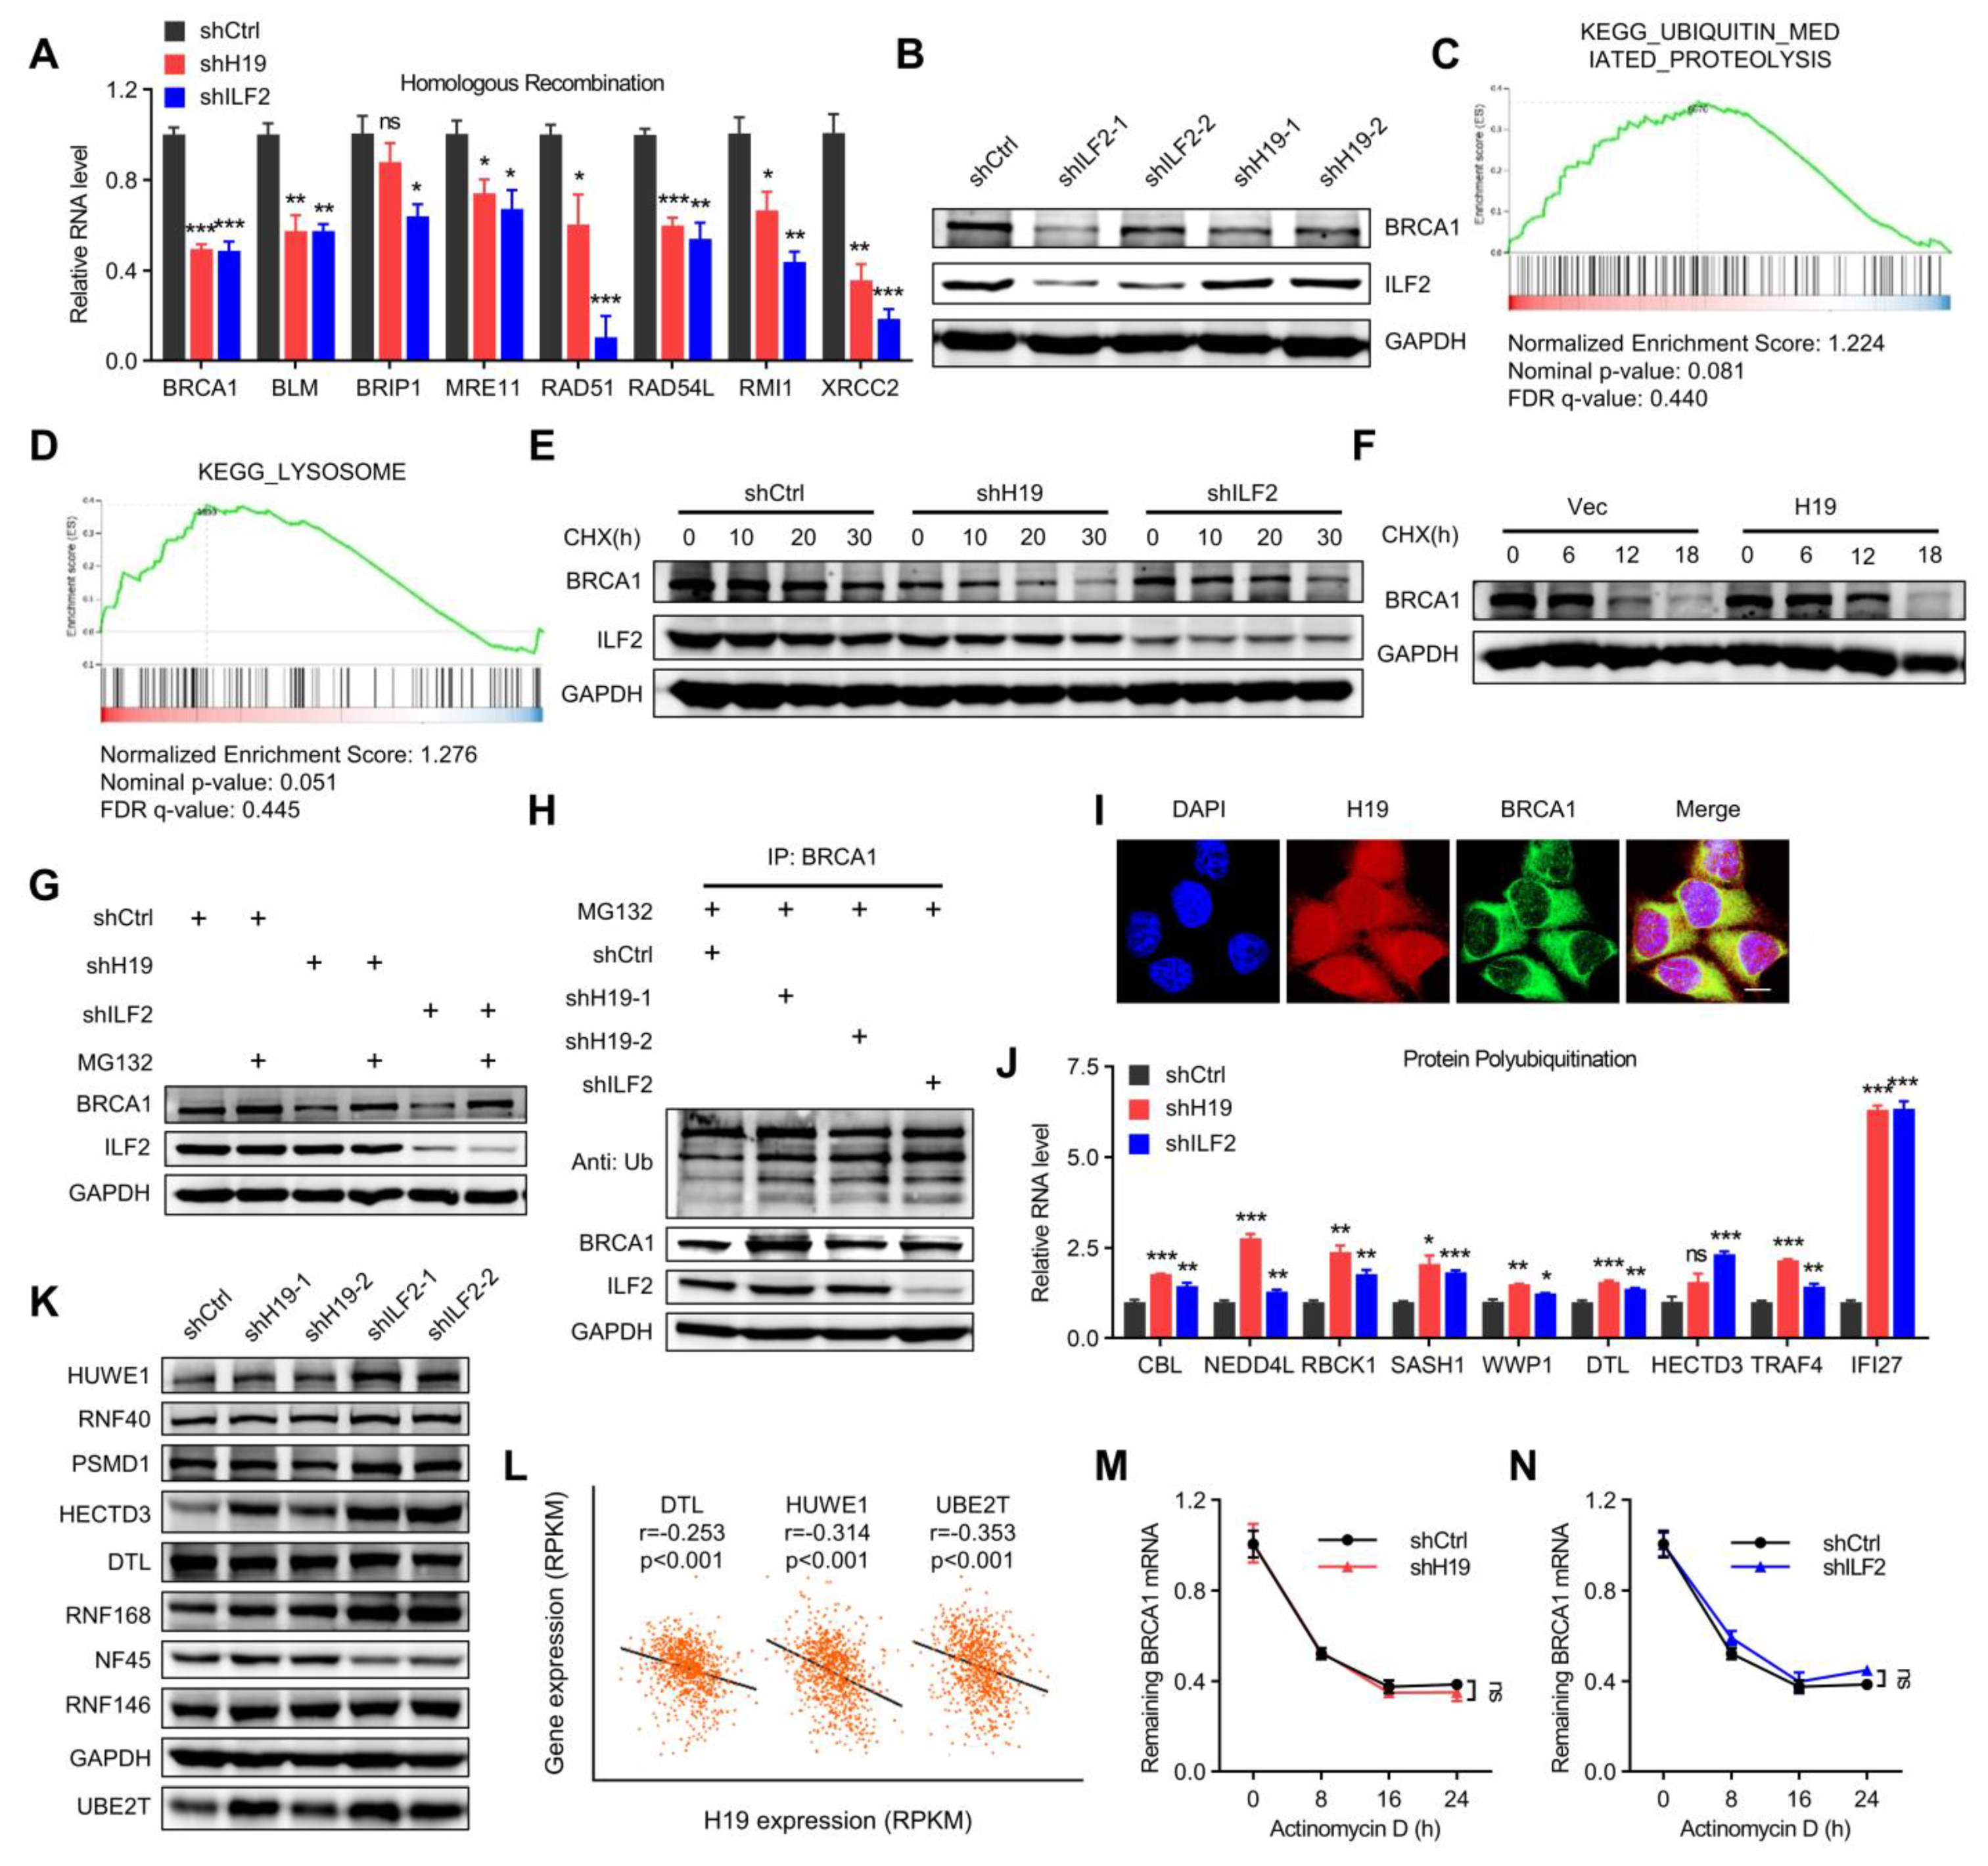
Figure 6.
H19 and ILF2 increase the expression and stability of BRCA1. (A) Differential homologous recombination-related genes were validated in H19- or ILF2-silenced MCF-7 cells. Data are shown as means ± SD. ns, not significant, * p < 0.05, ** p < 0.01, and *** p < 0.001 by two-tailed Student’s t-test. Data are representative of at least three independent experiments. (B) BRCA1 was detected in H19-depleted, ILF2-depleted, and shCtrl MCF-7 cells. (C) GSEA plots of ubiquitin-mediated proteolysis-related signatures in H19-depleted or ILF2-depleted MCF-7 cells versus control cells. FDR, false discovery rate; NES, normalized enrichment score. (D) GSEA plots of lysosome degradation pathway-related signatures in H19-depleted or ILF2-depleted MCF-7 cells versus control cells. FDR, false discovery rate; NES, normalized enrichment score. (E) MCF-7 cells with stable depletion of H19 or ILF2 and control cells were treated with cycloheximide (CHX; 20 µg/mL) or vehicle for the indicated periods. BRCA1 levels were analyzed by immunoblotting. (F) SUM149 cells with stable forced expression of H19 and control cells were both treated with cycloheximide (CHX; 20 µg/mL) or vehicle for the indicated periods. BRCA1 levels were analyzed by immunoblotting. (G) MCF-7 cells with stable depletion of H19 or ILF2 and control cells were treated with MG132 (5 µM) or vehicle for 24 h. Cell lysates were analyzed by immunoblotting. (H) MCF-7 cells with stable forced expression of H19 or depletion of H19 were treated with MG132 (5 µM) for 24 h. Cell lysates were immunoprecipitated (IP) with either control IgG or antibody against BRCA1 and analyzed by immunoblotting with ubiquitin (Ub)-specific antibody. Bottom, input from cell lysates. (I) H19 was visualized by RNA-FISH and immunofluorescence staining of BRCA1 in MCF-7 cells was performed. Scale bar, 10 μm. (J) Differential protein polyubiquitination-related genes were validated in H19- or ILF2-silenced MCF-7 cells. Data are shown as means ± SD. ns, not significant, * p < 0.05, ** p < 0.01, and *** p < 0.001 by two-tailed Student’s t-test. Data are representative of at least three independent experiments. (K) Several E3 ubiquitin ligases were detected in H19-depleted, ILF2-depleted, and shCtrl MCF-7 cells. Cell lysates were analyzed by immunoblotting. (L) Pearson correlation between H19 expression and expression of DTL, HUWE1, and UBE2T in the breast cancer samples (817 samples in which H19 expression was detectable were used in correlation analysis). (M) MCF-7 cells expressing control shRNA or H19 shRNA were treated with actinomycin D (1 µg/mL) for the indicated periods. Total RNA was purified and then analyzed by real-time RT-PCR to examine the mRNA half-life of BRCA1. Data shown are the mean ± SD. ns, not significant by ANOVA test; n = 3 independent experiments. (N) MCF-7 cells expressing control shRNA or ILF2 shRNA were treated with actinomycin D (1 µg/mL) for the indicated periods. Total RNA was purified and then analyzed by real-time RT-PCR to examine the half-life of BRCA1 mRNA. Data shown are the mean ± SD. ns, not significant by ANOVA test; n = 3 independent experiments.

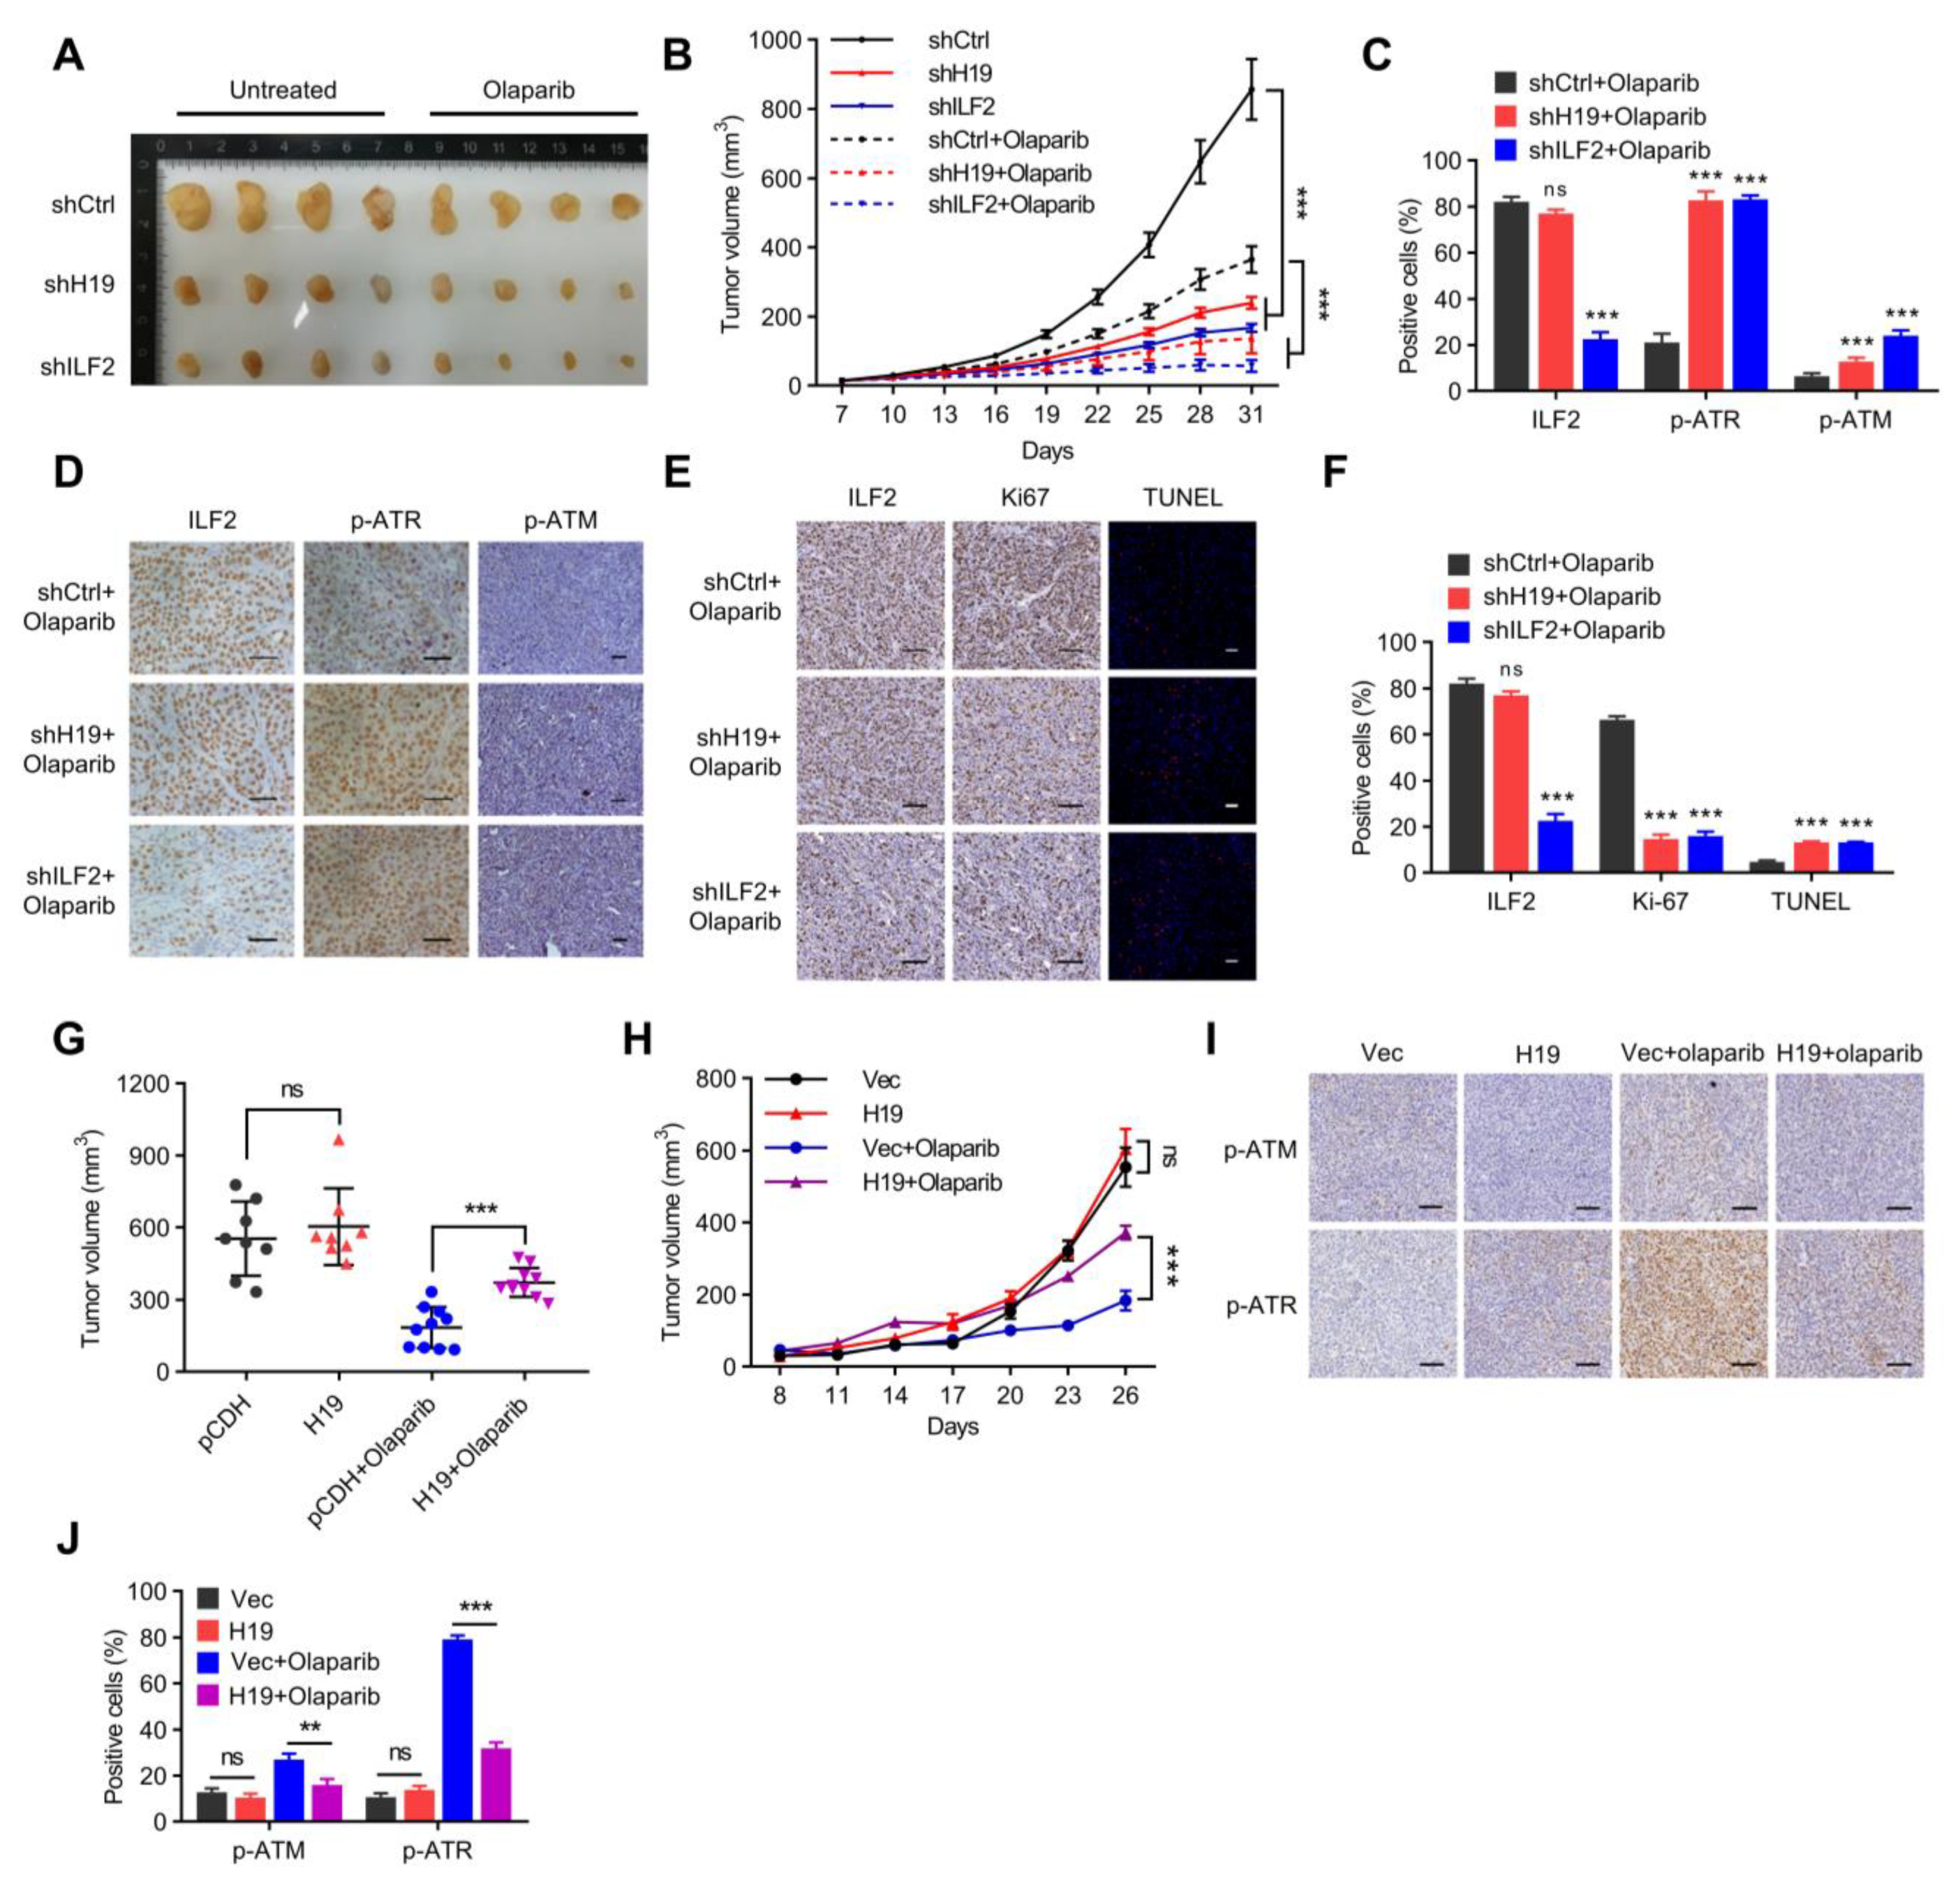
Figure 7.
H19 and ILF2 confer resistance to PARP inhibitors in vivo. (A) Final sizes of individual MCF-7-derived H19-silenced, ILF2-silenced, and shCtrl xenografts treated with a regimen of 50 mg/kg Olaparib daily for 28 days or left untreated. (B) Relative xenograft growth of individual MCF-7-derived H19-silenced, ILF2-silenced, or shCtrl xenografts treated with a regimen of 50 mg/kg Olaparib daily for 28 days or left untreated. Data shown are the mean ± SD. *** p < 0.001 by ANOVA test; n = 4 mice for each group. (C) Quantification of ILF2, p-ATR, and p-ATM levels in formalin-fixed paraffin-embedded xenograft specimens derived from H19-silenced, ILF2-silenced, and shCtrl MCF-7 cells treated with Olaparib. The values represent the average percentage of DAB-positive cells. The data represent the mean ± s.d. ns, not significant, and *** p < 0.001 by two-tailed Student’s t-test; n = 3 independent experiments. (D) IHC detection of p-ATR and p-ATM in formalin-fixed paraffin-embedded xenograft specimens derived from H19-silenced, ILF2-silenced, and shCtrl MCF-7 cells treated with Olaparib. Scale bar, 50 μm (E) Ki-67 staining (left) and TUNEL labeling (right) were performed on formalin-fixed paraffin-embedded xenograft specimens derived from H19-silenced, ILF2-silenced, and shCtrl MCF-7 cells treated with Olaparib. Scale bar, 100 μm (F) Quantification of Ki-67 and TUNEL levels in formalin-fixed paraffin-embedded xenograft specimens derived from H19-silenced, ILF2-silenced, and shCtrl MCF-7 cells treated with Olaparib. The data represent the mean ± s.d. ns, not significant, and *** p < 0.001 by two-tailed Student’s t-test; n = 3 independent experiments. (G) Final sizes of individual H19 forced expressed SUM149 cell derived and control xenografts treated with a regimen of 50 mg/kg Olaparib daily for 28 days or left untreated. ns, not significant, and *** p < 0.001 by two-tailed Student’s t-test. (H) Relative xenograft growth of individual SUM149 cells with forced expression of H19 and control cells treated with a regimen of 50mg/kg Olaparib daily for 28 days or left untreated. Data shown are the mean ± SD. ns, not significant, and *** p < 0.001 by ANOVA test; n = 4 mice for each group. (I) Expression of H19 was examined by in situ hybridization, and levels of p-ATM and p-ATR were detected by IHC in formalin-fixed paraffin-embedded xenograft specimens. Scale bar, 100 μm (J) Quantification of p-ATR and p-ATM levels in formalin-fixed paraffin-embedded xenograft specimens. The values represent the average percentage of DAB-positive cells. The data represent the mean ± s.d. ns, not significant, ** p < 0.01, and *** p < 0.001 by two-tailed Student’s t-test; n = 3 independent experiments.


 ,
, 


