Article

Genome-Wide Characterization and Expression of the Hsf Gene Family in Salvia miltiorrhiza (Danshen) and the Potential Thermotolerance of SmHsf1 and SmHsf7 in Yeast

State Key Laboratory Breeding Base of Dao-di Herbs, National Resource Center for Chinese Materia Medica, China Academy of Chinese Medical Sciences, Beijing 100700, China
*
Authors to whom correspondence should be addressed.
Int. J. Mol. Sci. 2023, 24(10), 8461; https://doi.org/10.3390/ijms24108461
Submission received: 22 March 2023 / Revised: 20 April 2023 / Accepted: 29 April 2023 / Published: 9 May 2023
(This article belongs to the Section Molecular Plant Sciences)

Abstract

:
Salvia miltiorrhiza Bunge (Danshen) is a traditional Chinese herb with significant medicinal value. The yield and quality of Danshen are greatly affected by climatic conditions, in particular high temperatures. Heat shock factors (Hsfs) play important regulatory roles in plant response to heat and other environmental stresses. However, little is currently known about the role played by the Hsf gene family in S. miltiorrhiza. Here, we identified 35 SmHsf genes and classified them into three major groups: SmHsfA (n = 22), SmHsfB (n = 11), and SmHsfC (n = 2) using phylogenetic analysis. The gene structure and protein motifs were relatively conserved within subgroups but diverged among the different groups. The expansion of the SmHsf gene family was mainly driven by whole-genome/segmental and dispersed gene duplications. The expression profile of SmHsfs in four distinct organs revealed its members (23/35) are predominantly expressed in the root. The expression of a large number of SmHsfs was regulated by drought, ultraviolet, heat and exogenous hormones. Notably, the SmHsf1 and SmHsf7 genes in SmHsfB2 were the most responsive to heat and are conserved between dicots and monocots. Finally, heterologous expression analysis showed that SmHsf1 and SmHsf7 enhance thermotolerance in yeast. Our results provide a solid foundation for further functional investigation of SmHsfs in Danshen plants as a response to abiotic stresses.

1. Introduction

Sessile plants often suffer from adverse environmental stresses, such as drought, extreme temperature fluctuations, water deficiency, and high salinity [1]. In particular, high temperatures have become a serious concern worldwide due to global warming, which causes yield loss and a decrease in nutrient quality of crop [2]. For instance, it is predicted that for every additional degree Celsius of temperature increase, the global production of wheat, rice, and maize will decrease by 6%, 32%, and 7.4%, respectively [3]. The devastating effects of heat stress are caused by priming protein misfolding, the accumulation of reactive oxygen species and the destruction of cell membranes [4]. To alleviate these adverse effects, plants have developed effective mechanisms of prevention and repair throughout evolution [5]. The transcriptional control of stress-inducible genes enables plant adaption to changing environments [6]. Accordingly, heat-shock factor proteins (Hsfs) are recognized as crucial components of signal transduction chain that mediates the activation of genes responsive to heat and other stresses [7].
Plant Hsfs share a basic modular structure, comprising a DNA-binding domain (DBD), an oligomerization domain (OD), a nuclear localization signal (NLS) and a nuclear export signal (NES). The highly conserved N-terminal DBD specifically binds to heat shock elements (nGAAnnTTCn) in the promoter region of target genes [8]. Hsfs usually exert transcriptional activation dependent on the occurrence of trimerization [9]. The OD contains a hydrophobic heptad repeat (HR-A/B) that forms a coiled-coil motif essential for the oligomerization [10]. In plants, Hsfs can be classified into three subfamilies (A, B or C) based on the characteristics of the HR-A/B regions [11,12]. The transcriptional activation domain (AHA motif) is characteristic of HsfAs [12], while HsfBs contain the conserved tetrapeptide (FLGV) motif that is typically identified as a core repressor domain (RD) [13]. In addition, HSFs contain other well-defined domains, such as the NLS and the NES, which are essential for the dynamic distribution of Hsfs between the cytoplasm and the nucleus [14,15]. The complexity of HSFs in plants suggests a diversification in functional roles in response to different environmental stresses.
Control of thermotolerance is the best characterized function of plant Hsfs. Hsf1a is a master regulator of induced thermotolerance in tomato [16]. HsfA1 (a, b, d and e) and HsfA2 respond to heat stress (HS) in Arabidopsis [17,18,19,20], and HsfA1 and HsfA2 form heterodimers to activate HS-inducible genes [21]. Molecular breeding and genetic engineering are effective and time-saving methods for producing heat-tolerant plants [22]. Hsfs are also involved in plant growth, development and response to other abiotic stresses. The Seed-specific HsfA9 can regulate embryogenesis and seed maturation in Helianthus annuus and Arabidopsis [12,23], while quadruple mutants of AtHsf1s delay plant growth and increase sensitivity to H2O2, salt and mannitol [24]. Moreover, the overexpression of AtHsfB2A impaired biomass production and gametophyte development in transgenic plants [25], while HSFA2 enhanced tolerance in combination with HS and high light [19]. A growing number of articles have reported that HsfA3, HsfA4a, HsfB2a and HsfC1 respond to salt, cold and osmotic induction [9]. In rice, OsHSFA3 improved drought tolerance by increasing the amount of ABA and polyamine [26] Crucially, the involvement of Hsfs in the response of Salvia miltiorrhiza to various environmental stresses remains unclear.
Salvia miltiorrhiza Bunge is a perennial and widely cultivated herb plant of the Salvia genus and Lamiaceae family [27]. The dried root of S. miltiorrhiza is known as Danshen and has been extensively used in the treatment of cardiovascular and cerebrovascular disease [28]. During growth, unfavorable environmental conditions seriously affect yield and the quality of the Danshen [24], whereby it is crucial to unravel the genes associated with stress tolerance in this plant. The availability of a high-quality S. miltiorrhiza genome makes it possible to systematically analyze the SmHsf gene family [29]. In this study, a total of 35 SmHsf genes were identified from S. miltiorrhiza. The chromosomal distribution, phylogenetic relationship, gene structure, conserved domains, evolutionary relationships, and cis-regulatory elements were analyzed. We further explored the expression patterns across SmHsf genes using RNAseq data from different organs and various stresses. Finally, we investigated SmHsf1- and SmHsf7-mediated heat response in yeast. Our results provide a foundation for further functional research on Hsf genes in Danshen plants that will help the breeding and genetic engineering of this plant.

2. Results

2.1. Identification and Chromosomal Distribution of Hsf Genes in S. miltiorrhiza

We identified 35 non-redundant SmHsf genes in the S. miltiorrhiza genome, which we termed SmHsf1 to SmHsf35 according to their respective location along the chromosomes (Figure 1). Two genes (SmHsf34 and SmHsf35) were located on unanchored scaffolds, while the remaining 33 were distributed on eight chromosomes.
Sequence analysis showed that most (77%) SmHsfs contained two exons, with coding sequences (CDS) varying from 558 bp (SmHsf22) to 1527 bp (SmHsf9) and a protein length ranging from 207 to 665 amino acids (Table S1). The relative molecular weight (MW) of SmHsfs was 21.54 kDa (SmHsf22)–56.36 kDa (SmHsf9), the computed theoretical isoelectric points (pI) ranged from 4.64 (SmHsf23) to 9.93 (SmHsf27), and the instability index indicated that all SmHsf proteins were unstable. The grand average of hydropathicity (GRAVY) varied between −0.91 (SmHsf4) and −0.48 (SmHsf6). Additionally, subcellular localization analysis showed that all SmHsfs were localized in the nucleus, with the exception of SmHsfs 11, 18 and 30, which were also located in the cytoplasm and mitochondria.

2.2. Phylogenetic and Classification Analyses of SmHsfs

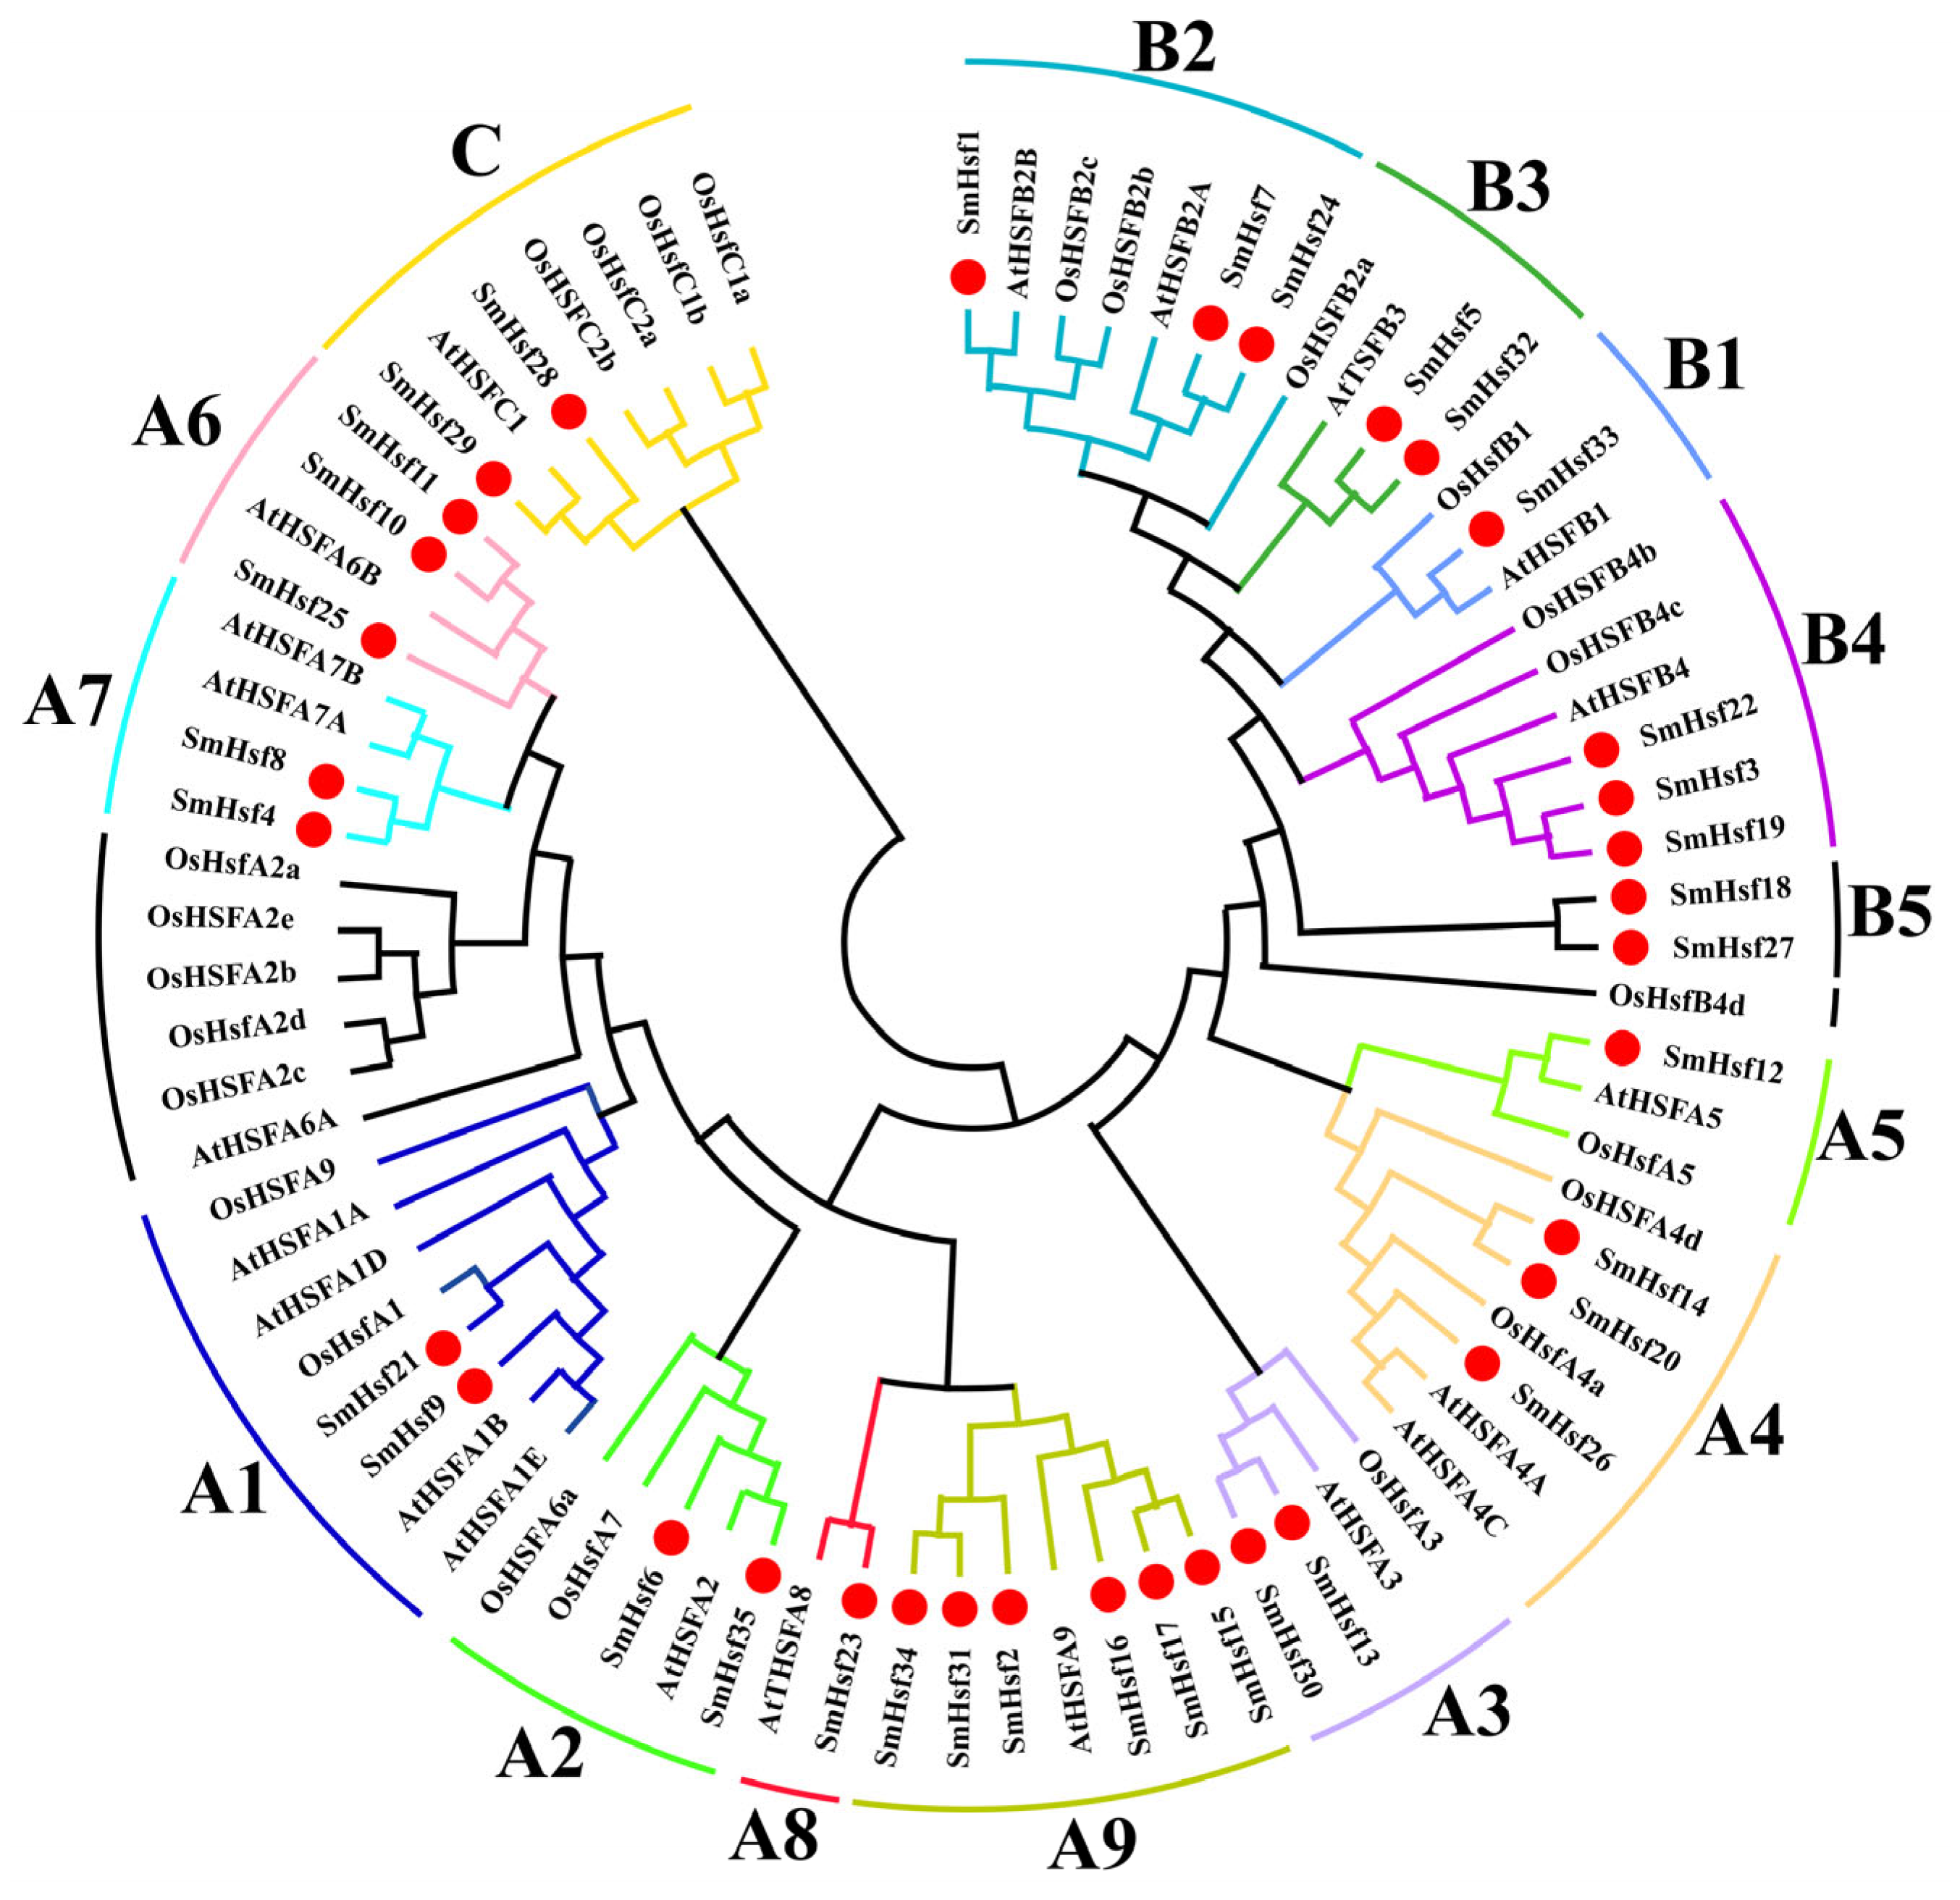
To explore the evolutionary relationships and classification of Hsfs, we built an unrooted phylogenetic tree consisting of 35, 25 and 22 Hsf proteins from S. miltiorrhiza, Oryza sativa and Arabidopsis thaliana, respectively (Figure 2). This allowed us to classify the SmHsf family members into three main groups, SmHsfA, SmHsfB, and SmHsfC, of which SmHsfA was the largest (62.8% of the total) with a total of 22 members distributed across nine subgroups (A1–A9). SmHsfB contained five subclasses (B1–B5) and 11 genes, representing 31.4% of the total, while SmHsfC represented 5.8% of the total and contained only two genes (SmHsf28, SmHsf29). As expected, the Hsfs of S. miltiorrhiza are phylogenetically closer to A. thaliana than O. sativa.

2.3. Gene Structure, Conserved Domains and Motif Analyses

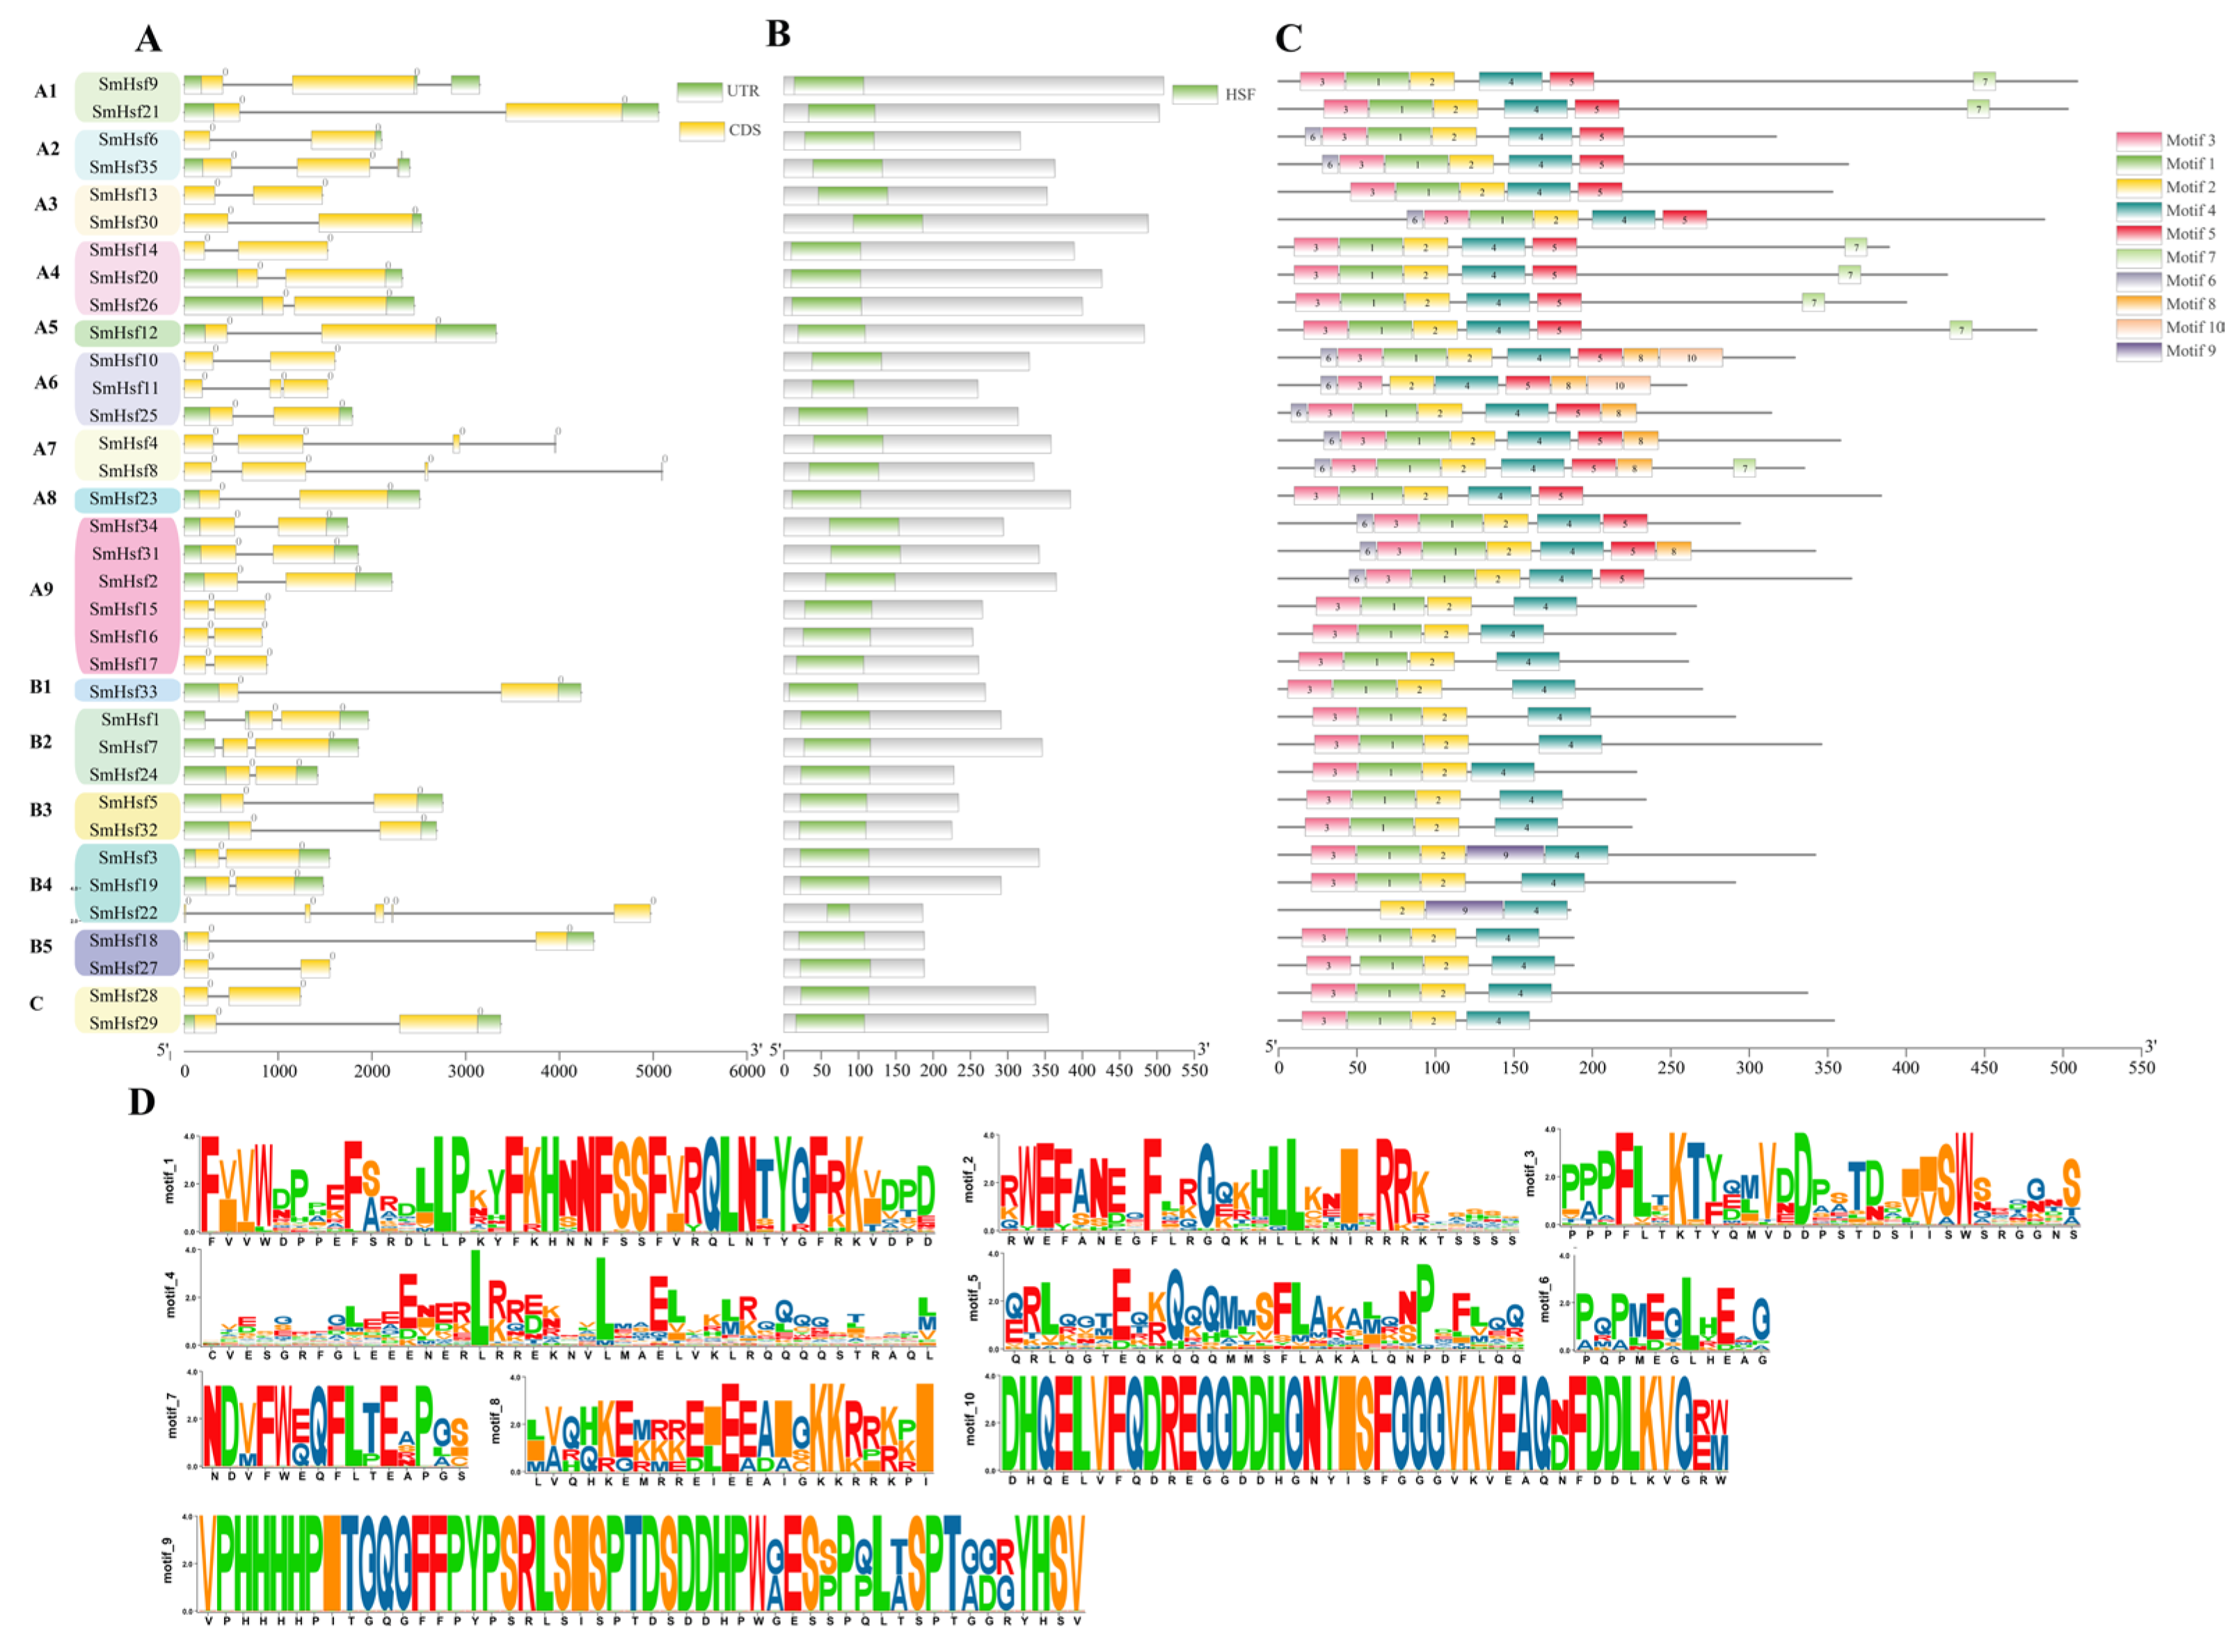
To explore the structural diversity of the SmHsf gene family, we analyzed the intron–exon boundaries of the 35 identified SmHsf genes and the conservation of protein sequences. We found that 27 SmHsf genes contained two exons, with SmHsf1, SmHsf7, SmHsf9, SmHsf11 and SmHsf35 containing three exons each; SmHsf4 and SmHsf8 containing four exons; and SmHsf22 containing five exons (Figure 3A). The exon–intron organization of SmHsfs suggested conservation during S. miltiorrhiza evolution. We predicted six conserved domains, including DBD, HR-A/B, NLS, NES, AHA, and RD, in the SmHsf family (Table S2). Of these, DBD and HR-A/B were conserved across all SmHsf members. The DBD domain consisted of three α-helices and four β-sheets (Figure 3B and Figure S1), but SmHsf11 contained no β1β2 sheet and SmHsf22 had no α1α2 helices. While most SmHsfs contained both the NLS and NES domains indispensable for maintaining SmHsf homeostasis between the nucleus and cytoplasm, the AHA and RD domains were specific to each group. Specifically, AHA motifs were only detected in Group A (A1, A4, A5 and A7), while RD motifs were found in the C-terminus of Group B and were characterized by the presence of a tetrapeptide motif (LFGV) that represses transcription.
We then scanned 10 distinct motifs in the MEME server to identify sequence features. As shown in Figure 3C and Table S3, all SmHsf members contained DBD conserved motifs 1, 2, and 3, except for SmHsf11, which contained motifs 2 and 3 but no motif 1; and SmHsf22, which contained motif 2 but not motifs 1 and 3. HR-A/B conserved motif 4 was also found in all SmHsf proteins. Finally, we identified several group-specific motifs, including motifs 5, 6 and 7, in Group A, motif 10 in the A6 subfamily, and motif 9 in the B4 subfamily. Similar motif composition was usually observed on the same SmHsf clade, indicating these genes possess similar regulatory functions in S. miltiorrhiza.

2.4. Gene Duplication and Synteny Analyses of Hsf Genes in S. miltiorrhiza

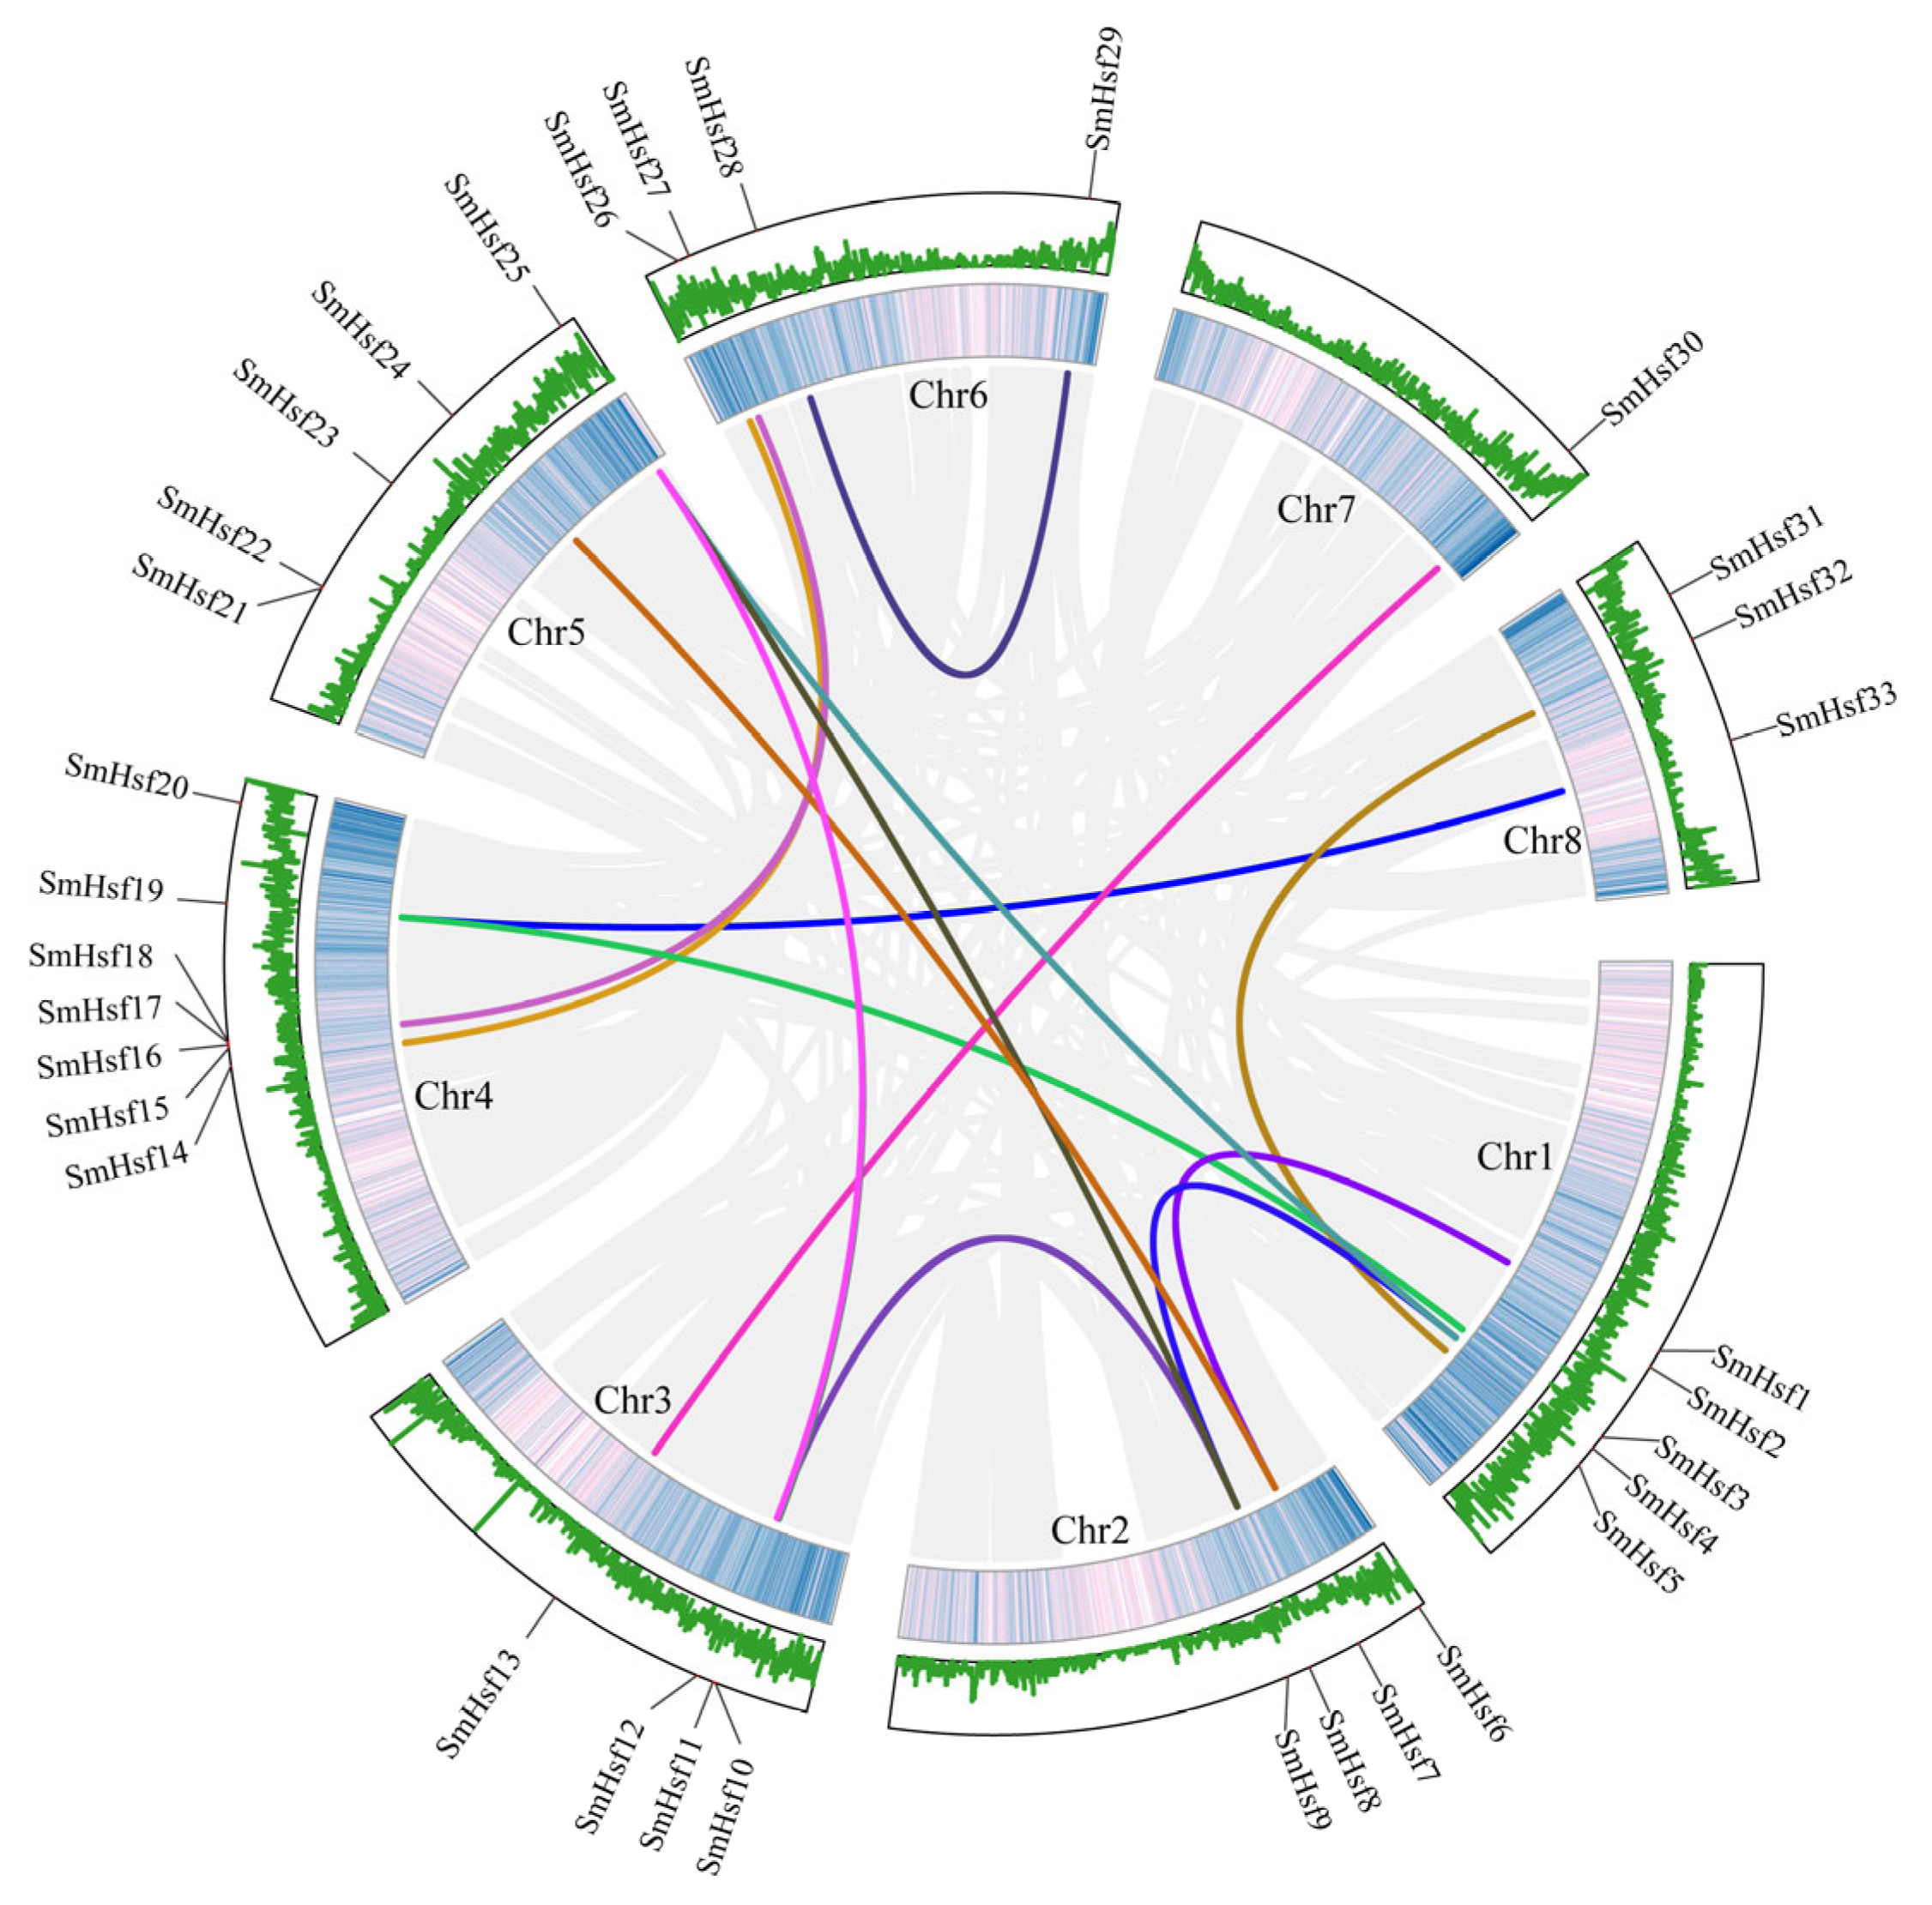
Gene duplication events are important drivers of functional differentiation and gene amplification [30]. We identified 15 paralogous pairs involving 21 SmHsf genes (60%) that resulted from whole-genome/segmental duplication events (Figure 4). We also found 14 genes that underwent dispersed duplication events (40%) (Supplementary Materials, Table S4), suggesting this process was important for the expansion of SmHsf genes.
To further explore the evolution patterns of the SmHsf family, we performed synteny analysis between S. miltiorrhiza and four dicots (S. bowleyana, S. baicalensis, A. hispanicum, and A. thaliana) and two monocots (O. sativa and Zea mays) (Figure 5). We identified syntenic relationships in A. hispanicum (28 genes), S. bowleyana (25 genes), S. baicalensis (21 genes), A. thaliana (19 genes), O. sativa (nine genes) and Z. mays (nine genes); and orthologous pairs between S. miltiorrhiza and these six species, numbering 42, 41, 30, 24, 24 and 17, respectively (Supplementary Materials, Table S5). A total of 13 Hsf collinear gene pairs were identified between S. miltiorrhiza and S. bowleyana and anchored to highly conserved syntenic blocks spanning > 100 genes. Moreover, SmHsf7, SmHsf24 and SmHsf32 were associated with three or four syntenic gene pairs between S. miltiorrhiza and S. bowleyana; while other genes showed no fewer than two collinear gene pairs between S. miltiorrhiza and other five species. Interestingly, SmHsf1 and SmHsf7 were identified in S. miltiorrhiza and all six representative species, indicating an ancestral origin for these orthologous pairs.

2.5. Analysis of Cis-Acting Elements and Upstream Regulators of SmHsfs

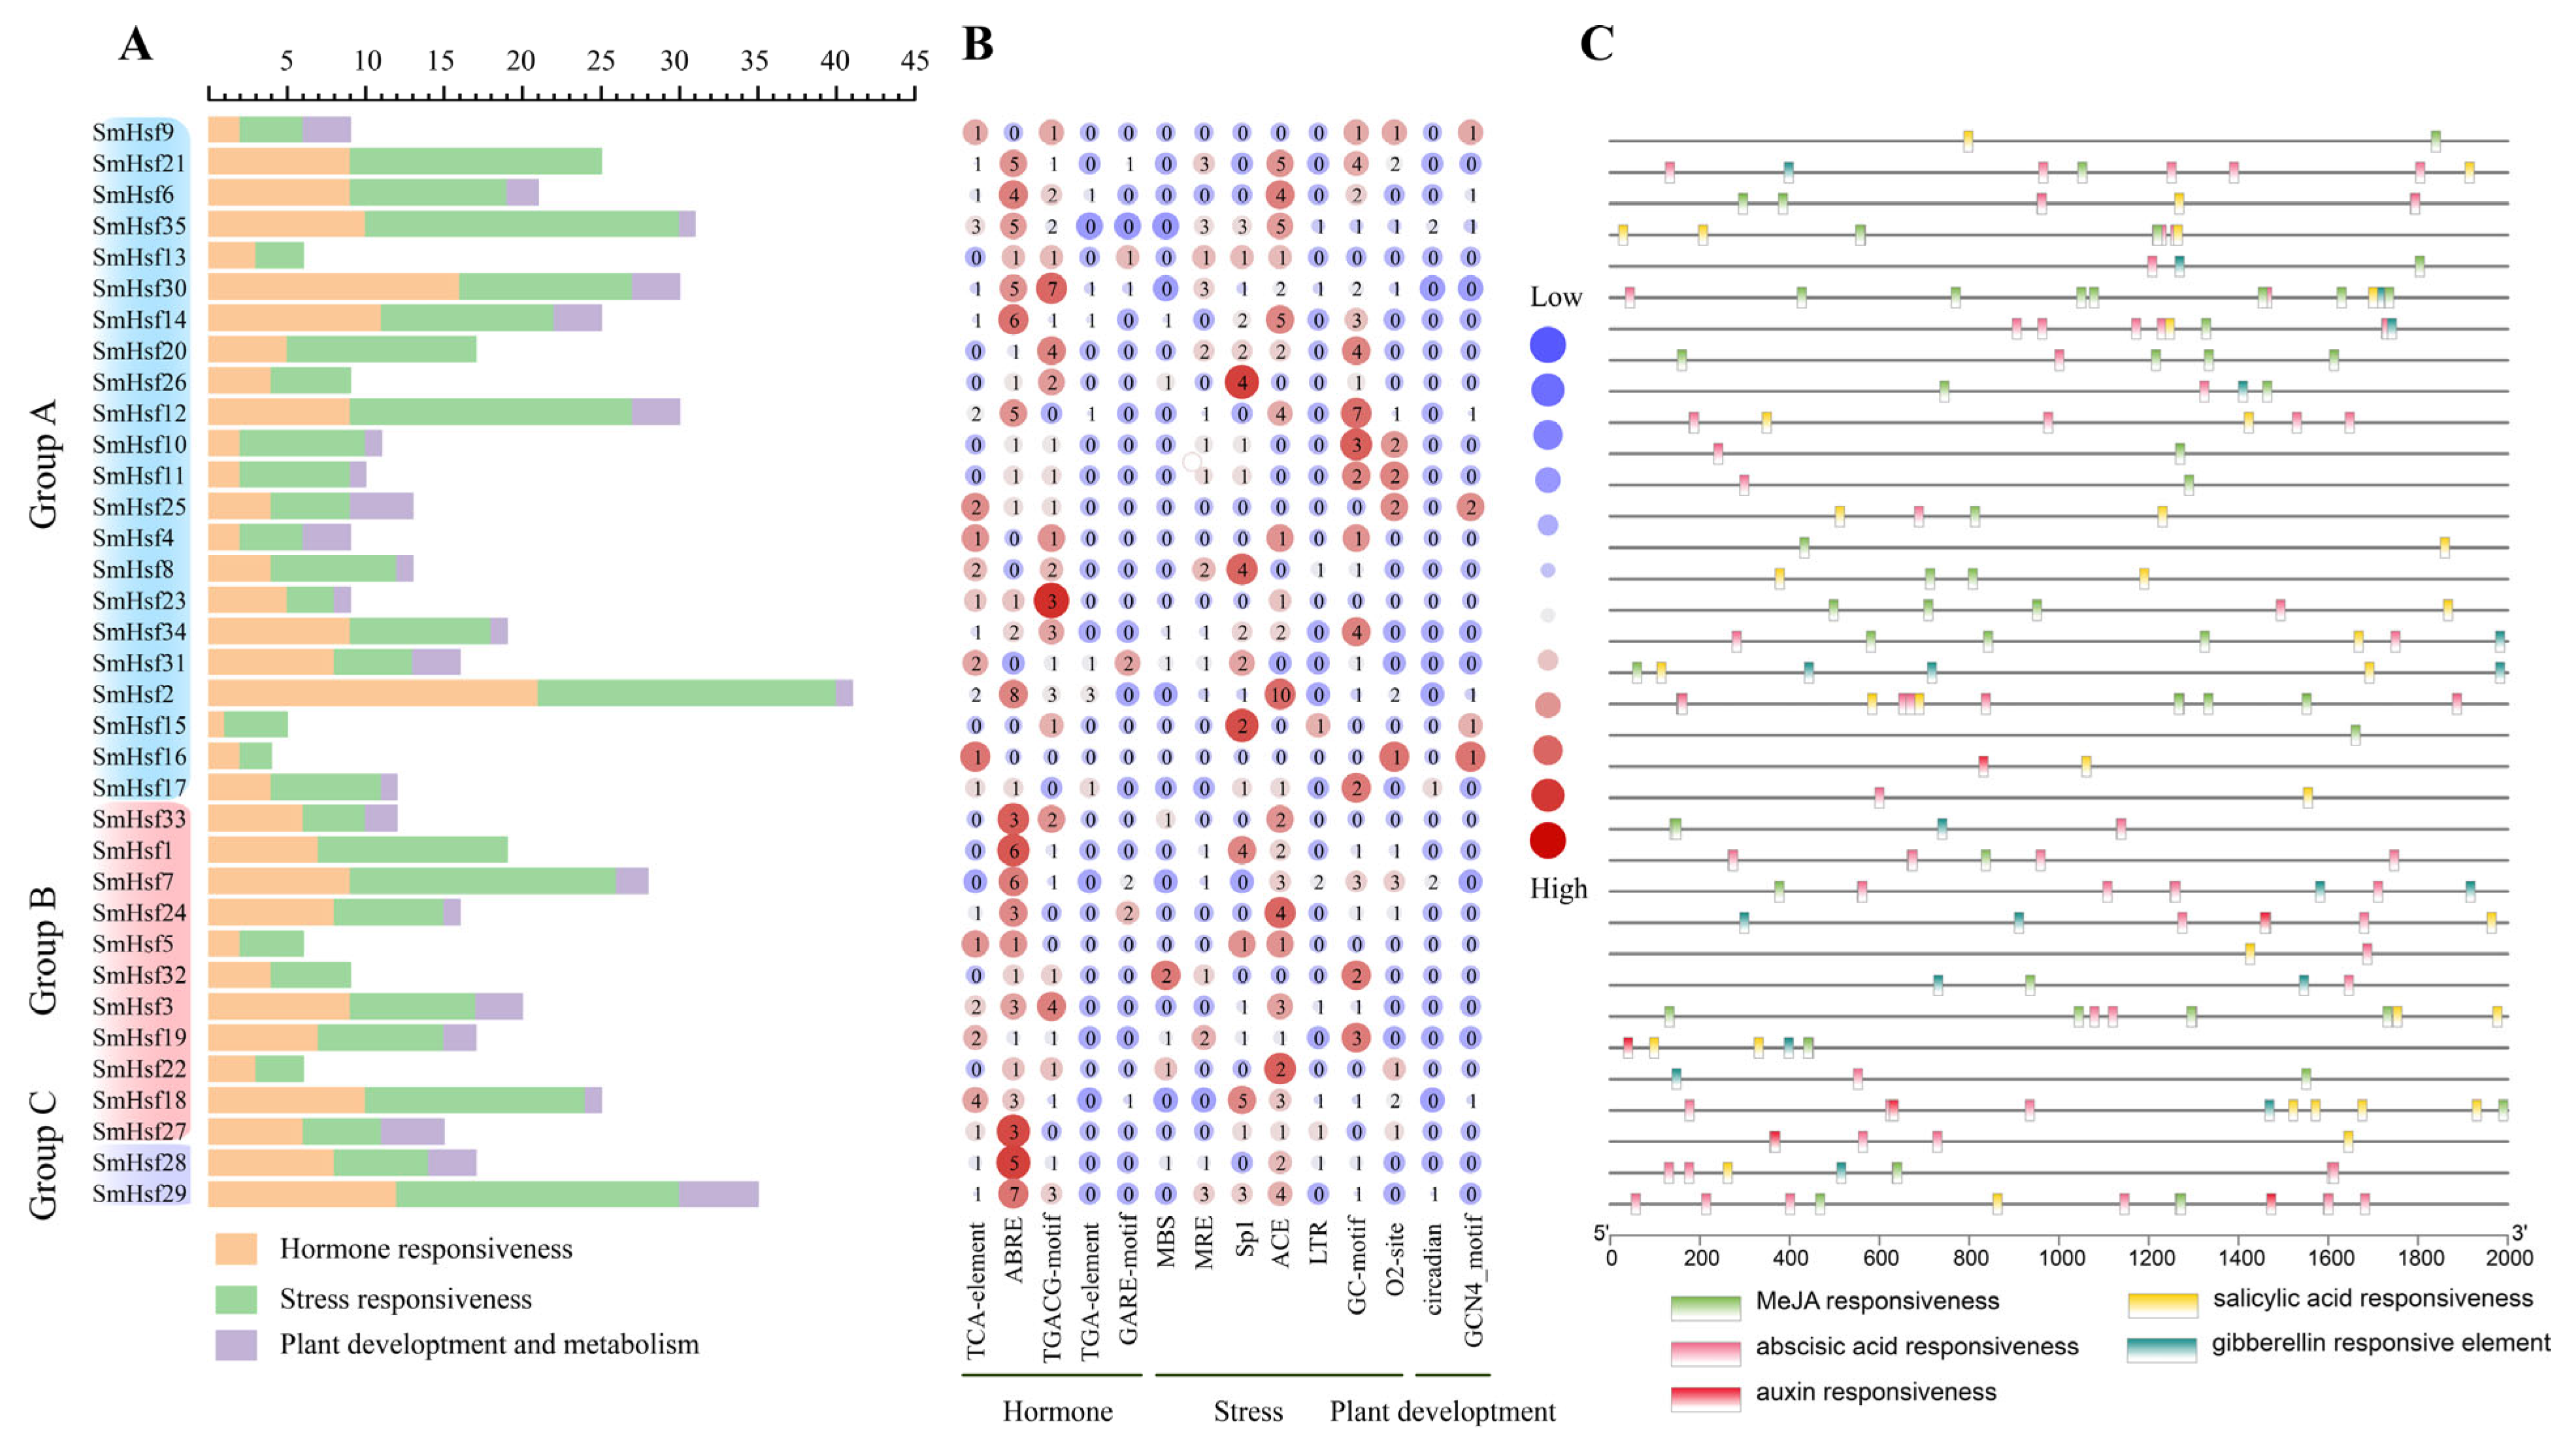
In order to understand the regulatory network associated with SmHsfs roles, the cis-elements located 2 kb upstream of each of the 35 SmHsfs were analyzed by plantCARE. Beyond core promoter elements, we discovered 25 types of cis-elements in the promoter region of SmHsf genes, including eight hormone-, 13 stress- and four development- and metabolism-associated elements (Figure 6A; Supplementary Materials, Table S6). Light-responsive elements were abundant, especially the ACE, Sp1, and MRE elements (Figure 6B). We also detected other stress-responsive cis-elements, such as MBS (drought-inducibility), LTR (low-temperature responsiveness), and the GC-motif (anoxic specific inducibility). Among the hormone-responsive elements, the most numerous was the ABA-related ABRE, followed by the TGACG-motif (MeJA-responsiveness), and the TCA-element (SA-responsiveness) (Figure 6B,C). Among the elements related to plant development and metabolism, 16 SmHsfs contained an O2-site (zein metabolism regulation), nine SmHsfs contained a GCN4_motif (endosperm expression), and four included elements associated with the regulation of the circadian rhythm. Intriguingly, only SmHsf30 contained one heat shock element (heat response) in its promoter region (Supplementary Materials, Table S6).
The abundance of cis-elements in the promoter regions of SmHsf genes may be related to the regulation of signaling pathways involved in plant development and stress response. To test this hypothesis, we predicted the potential regulatory interactions between SmHsfs and their upstream regulators using Arabidopsis as a model (Figure 7A; Supplementary Materials, Table S7). A total of 521 transcript factors (TFs) were scanned and a GO enrichment analysis performed, which indicated that most TFs were associated with positive regulation of transcription, plant development and ethylene responsiveness (Figure 7B). The genes SmHsf3, SmHsf29, SmHsf31, SmHsf32 and SmHsf35 were regulated by a higher number of TFs (Figure 7C). The most abundant TFs were AtTCP17, AtTCP21, AtNAC079, AtERF115 and AtWRKY26 (Figure 7D).

2.6. Expression Patterns of SmHsfs in S. miltiorrhiza Organs

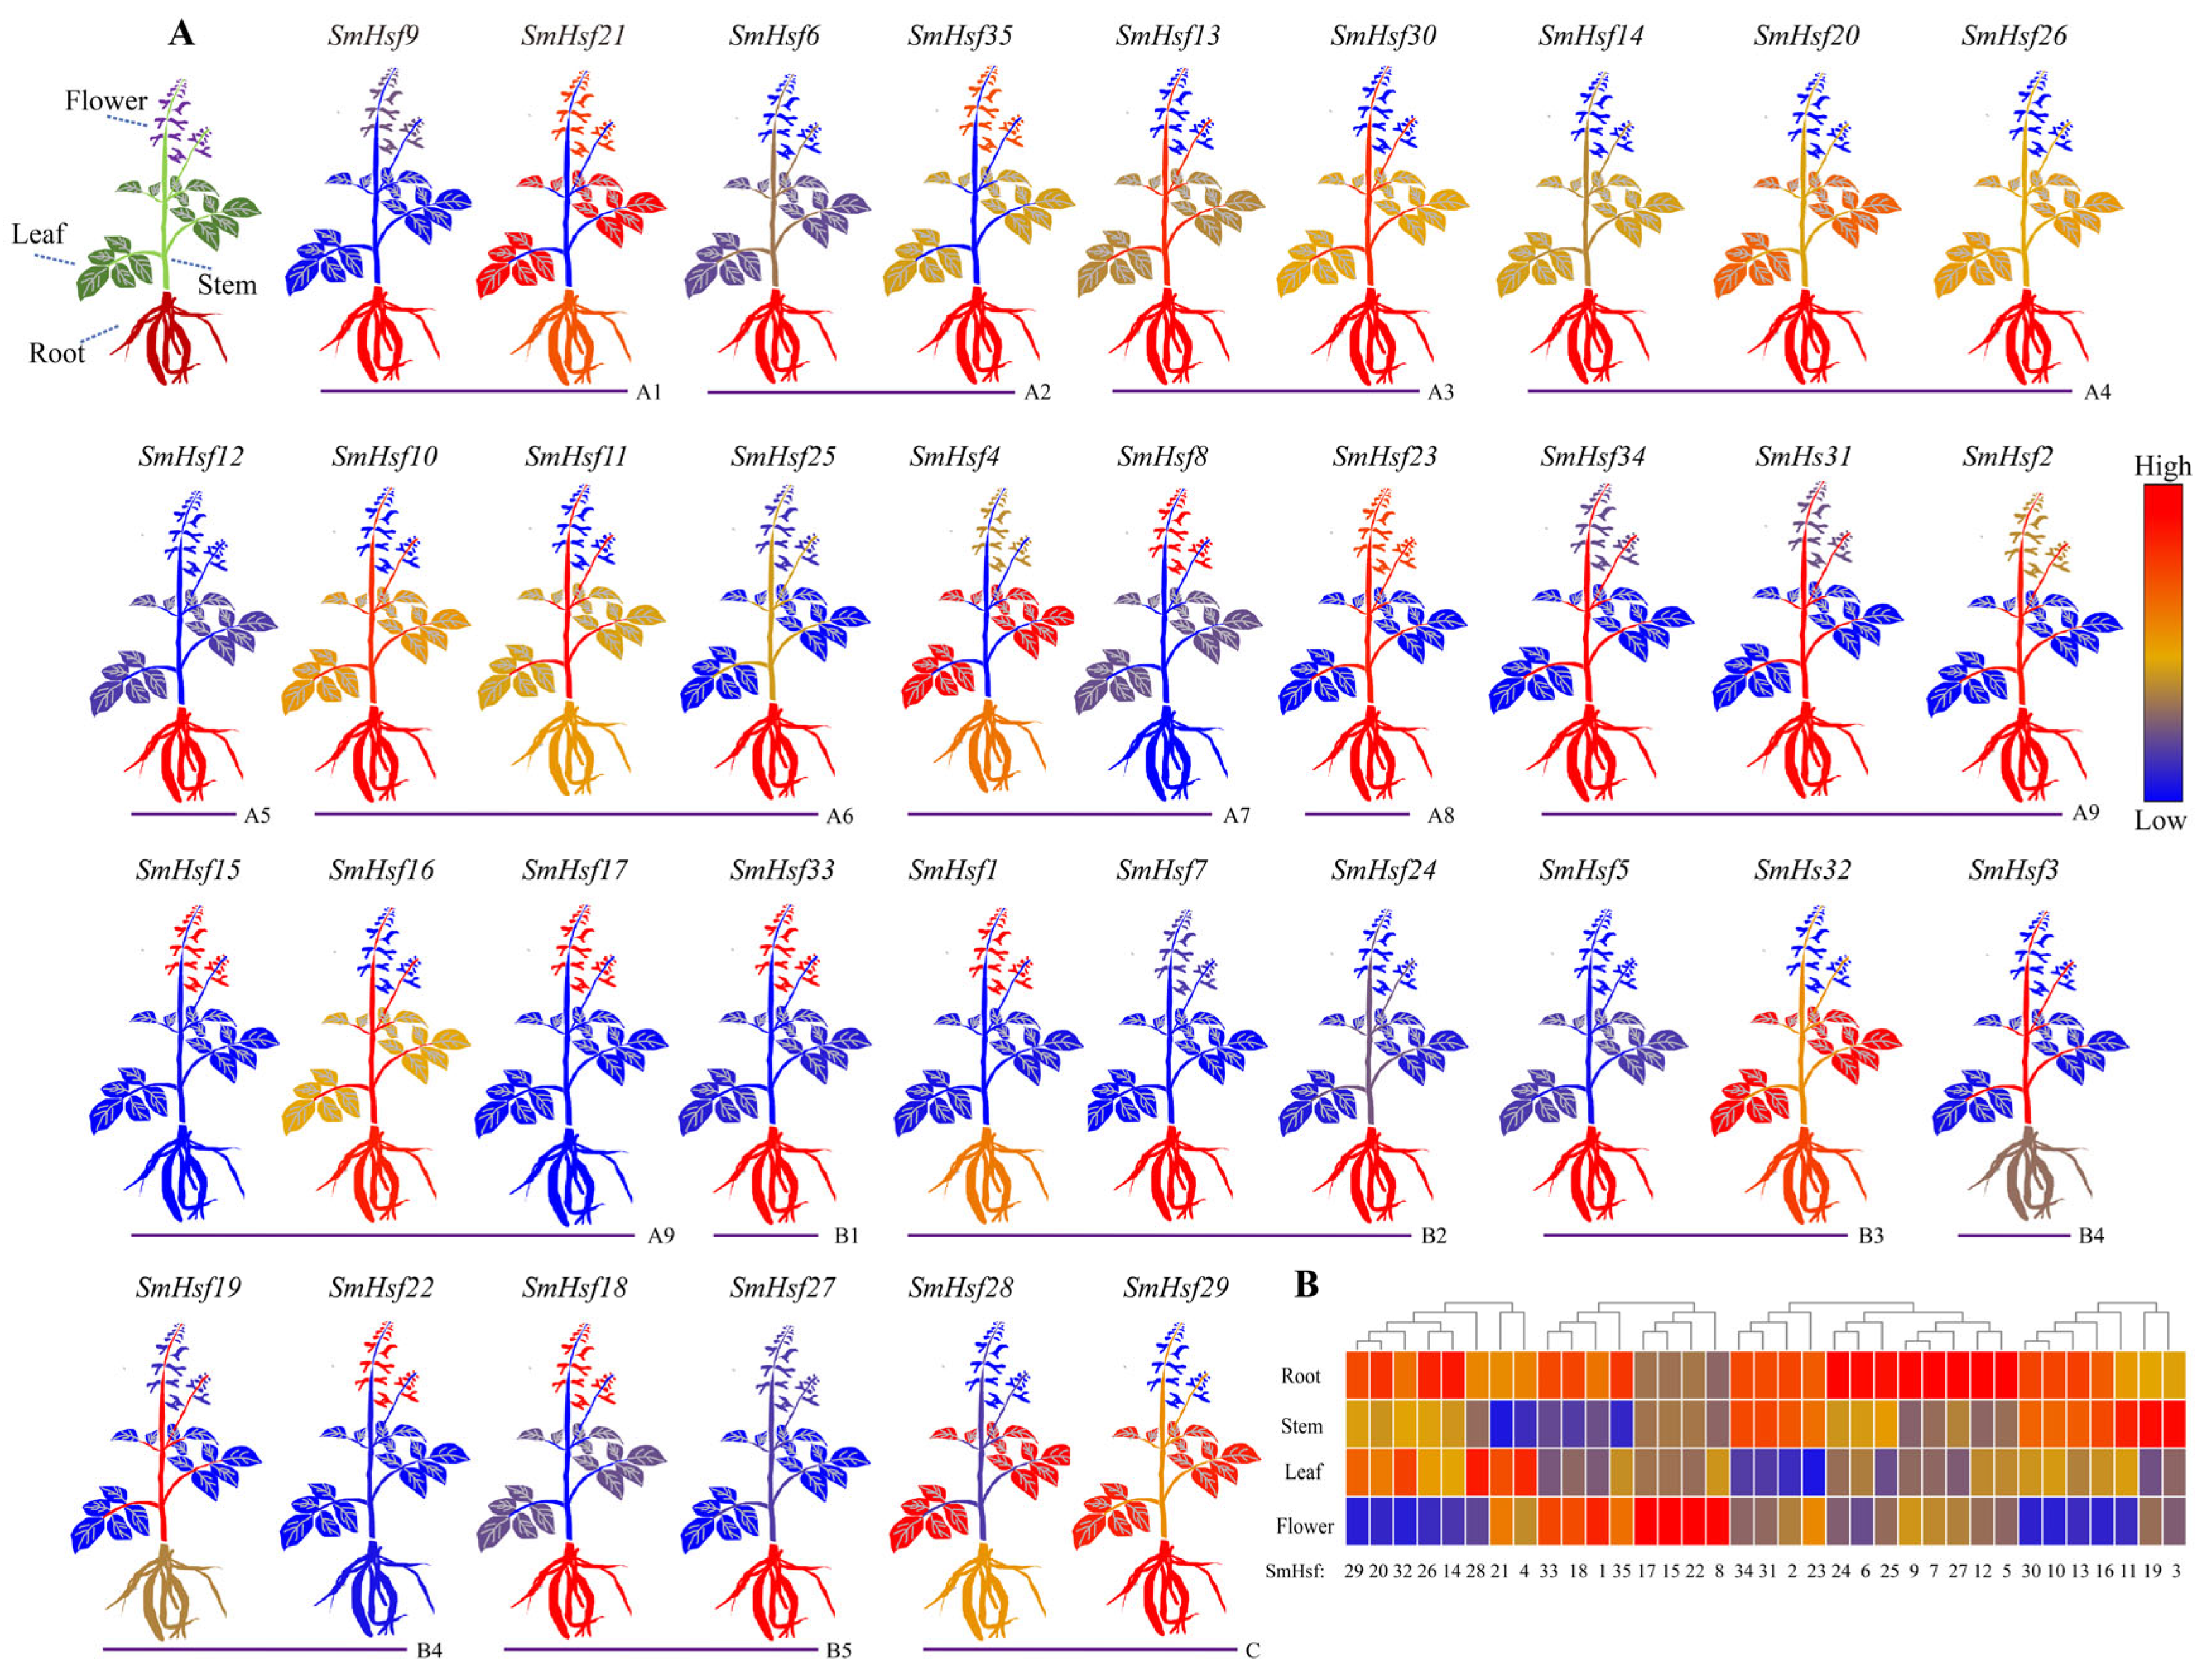
We analyzed the expression patterns of SmHsf genes in four organs of S. miltiorrhiza using transcriptomic data (SRP327565), and found most of the genes (23/35) were upregulated in roots—eight of these genes had an exclusive high expression in this organ (Figure 8A; Supplementary Materials, Table S8). In addition, we found higher expression levels of SmHsf3, SmHsf11, SmHsf19 in stems; SmHsf4, SmHsf21 in leaves; and SmHsf8, SmHsf15 in flowers. Along with the aforementioned tissue specificity of gene expression, we found a high diversity of transcript abundance. For example, the SmHsf20, SmHsf29, SmHsf32 genes were highly expressed in the root and leaves; SmHsf2, SmHsf13, SmHsf30 in the root and stems; and SmHsf35, SmHsf33, SmHsf1 in the root and flowers (Figure 8B). Notably, SmHsf23 had a relatively high expression profile in the root, stems, and flowers.

2.7. Expression Patterns of SmHsfs in Response to Hormone Treatment

We then examined the expression patterns of SmHsf genes as a response to ABA, MeJA, SA, and GA based on transcriptomic data (Figure 9; Supplementary Materials, Table S9). Genes with TPM < 1 were excluded, while those with a fold-change in TPM > 1.5-fold compared to controls were considered significantly regulated. After exposure to ABA, the expression levels of eight SmHsfs (SmHsf12, SmHsf25, SmHsf2, SmHsf1, SmHsf5, SmHsf7, SmHsf32, SmHsf29) showed significant upregulation; while SmHsf14, SmHsf30, SmHsf19 and SmHsf18 were significantly downregulated (Figure 9A). Under GA stress, most of SmHsfs (60%) displayed a decrease in expression levels, especially SmHsf2 and SmHsf25 (Figure 9B). After MeJA treatment, the transcription levels of SmHsf20, SmHsf31, SmHsf32 and SmHsf33 increased significantly in early stages (1 h), while SmHsf13, SmHsf18 and SmHsf27 were expressed at high levels in later stages (6 h) (Figure 9C). We also found that the expression of SmHsf31 and SmHsf34 under SA stress was 18 and 12 times lower than controls, respectively (Figure 9D). Finally, some genes responded to more than one treatment, including the upregulation of SmHsf1, SmHsf2 and SmHsf25 by ABA and SA, and SmHsf33 by SA and MeJA.

2.8. Expression Patterns of SmHsfs in Response to Various Abiotic Stresses

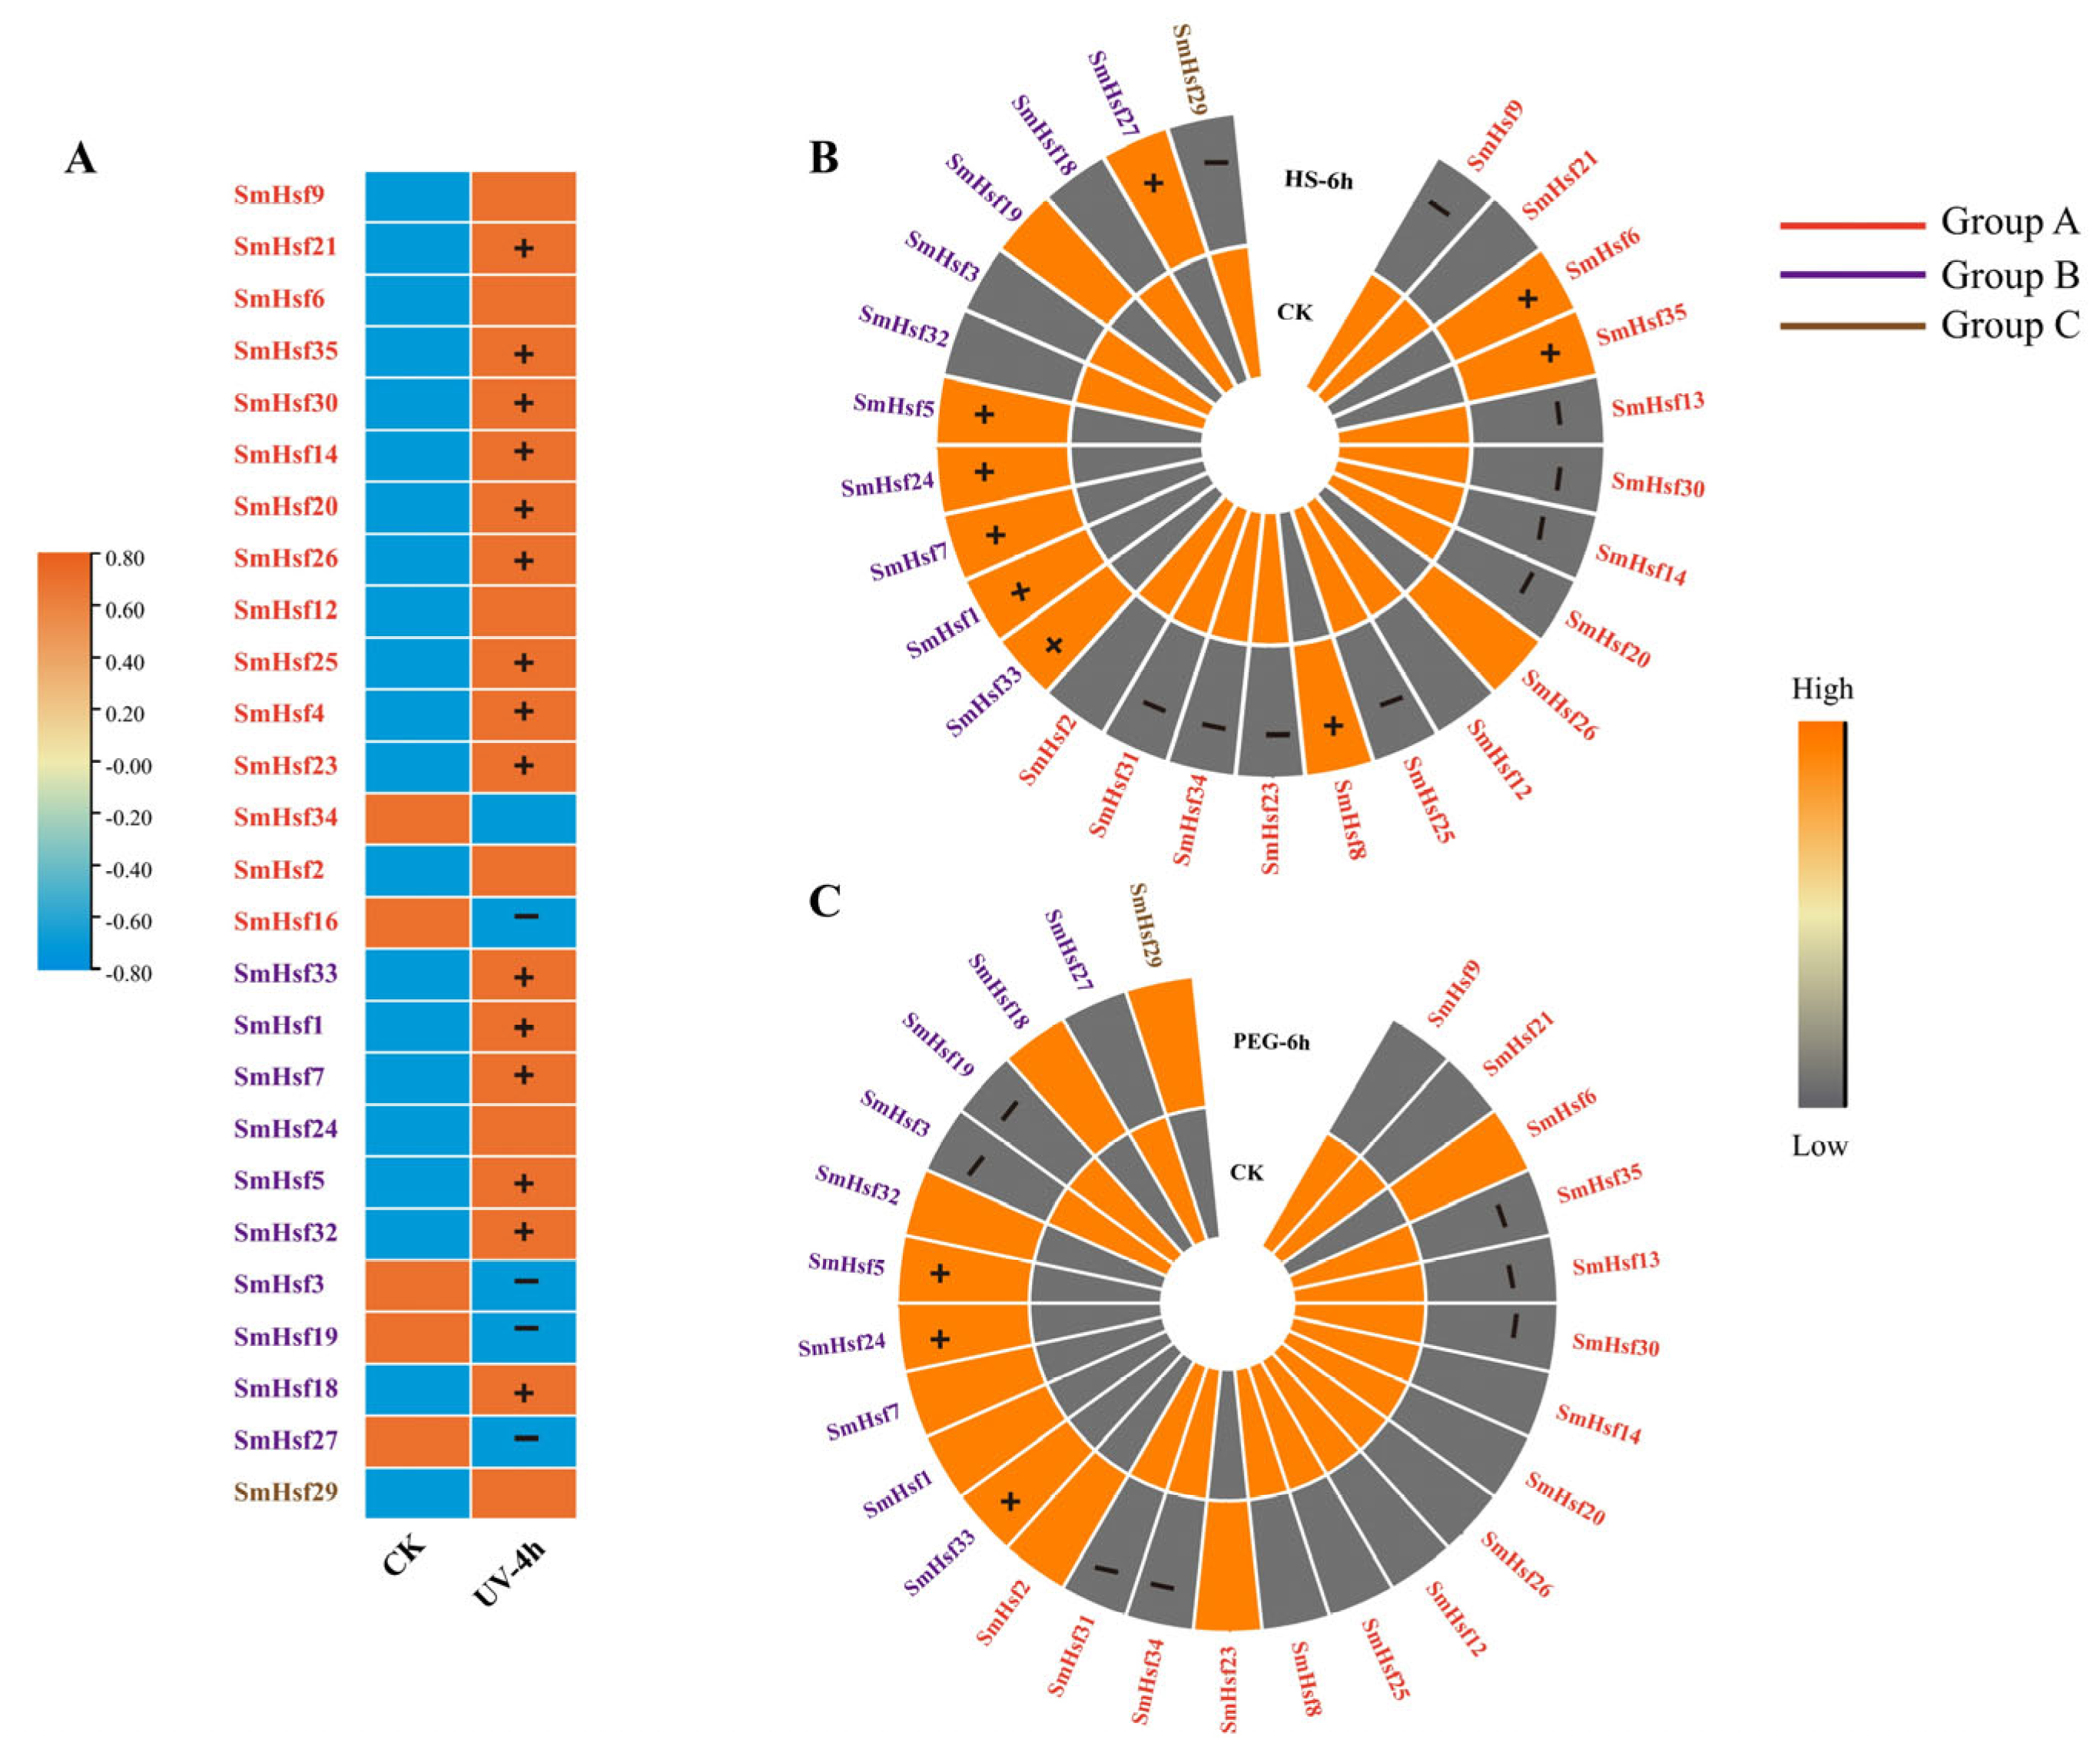
Abiotic stresses (heat stress, drought and UV) affect plant growth and development, constituting the major factor limiting crop production. After UV treatment, we identified 22 upregulated (81%), and five downregulated (SmHsf3, SmHsf16, SmHsf19, SmHsf27, SmHsf34) genes (Figure 10A). Under heat and drought stress, a high proportion of Group A SmHsfs showed low transcript abundance, while most members of Group B exhibited high expression levels (Figure 10B), especially SmHsf1 and SmHsf7 (8.7 and 6.1 times, respectively, the levels found in the control group). In addition, the genes SmHsf5, SmHsf24 and SmHsf33 were highly expressed following drought treatment (Figure 10C). Finally, we identified SmHsfs responding to multiple stresses, including significant upregulation of SmHsf24 by heat and drought; SmHsf1, SmHsf7, SmHsf4 and SmHsf35 by heat and UV; and SmHsf5 and SmHsf33 by heat, drought and UV (Supplementary Materials, Table S10).

2.9. Overexpression of SmHsf1 and SmHsf7 Enhanced Thermotolerance in Yeast Recombinant Cells

Interspecific synteny analysis showed that SmHsf1 and SmHsf7 were conserved between dicots and monocots, indicating that both genes might play an important role in adaptation during evolution. Since the two genes were also among the top upregulated genes in response to heat stress, we hypothesized they may play a vital role in thermotolerance in S. miltiorrhiza. Accordingly, we started by performing subcellular localization analysis. As shown in Figure 11A, the control GFP signal was observed throughout the entire cell, whereas SmHsf1-GFP and SmHsf7-GFP were only expressed in the nucleus, suggesting these are nuclear proteins.
Since heat stress response is conserved in eukaryotes, we performed thermotolerance analysis in yeast [31]. To achieve this, we evaluated the growth of yeast cultures transfected with a pPIC3.5K expression vector and the vector containing SmHsf1 and SmHsf7 under normal and heat stress conditions. Both sets of transformed yeast cells grew equally at 30 °C (Figure 11B). However, when exposed to 50 °C, SmHsf1/7-transformed yeast cells outgrew control cells, demonstrating that heterologous expression of SmHsf1 and SmHsf7 improves thermotolerance in yeast.

3. Materials and Methods

3.1. Identification and Sequence Analysis of Hsf Genes from S. miltiorrhiza

The whole genome sequences and annotation files of S. miltiorrhiza (Accession No. GWHAOSJ00000000), Scutellaria baicalensis (GWHBJEC00000000), Antirrhinum hispanicum (GWHBFSA00000000), Salvia bowleyana (GWHASIU00000000) were obtained from the China National Center for Bioinformation (CNCB) database (https://ngdc.cncb.ac.cn/, accessed on 1 September 2022). The protein sequences of AtHsf and OsHsf were downloaded from TAIR (https://www.arabidopsis.org, accessed on 28 August 2022) and Rice data (https://www.ricedata.cn/gene/, accessed on 9 September 2022), respectively. Hidden Markov model (HMM) search and BLAST-P were combined to identify potential SmHsfs. Firstly, the conserved Hsf DNA-binding domain (PF00447) was used as a query to identify SmHSF proteins using the HMMER (v3.3) software with an e-value < 10−5. Secondly, AtHsfs and OsHsfs were queried to search for possible SmHsfs by Blast Several Sequences to a Big Database program with default parameters in TBtools [32]. Finally, all obtained SmHsf proteins were submitted to the SMART (http://smart.embl.de/smart/set_mode.cgi?NORMAL=1, accessed on 13 September 2022) and MARCOIL databases (http://toolkit.tuebingen.mpg.de/marcoil, accessed on 9 October 2022) to verify the presence of Hsf-type DBD domain and HR-A/B domains. After the removal of the same genes, the remaining genes were identified as SmHsf genes.
The physicochemical parameters of SmHsf proteins, including their theoretical molecular weight (MW), theoretical isoelectric point (pI), were analyzed using the ExPASy (https://web.expasy.org/protparam/, accessed on 20 October 2022). The protein subcellular localization was predicted using Plant-mPLoc (http://www.csbio.sjtu.edu.cn/bioinf/plant-multi/, accessed on 20 October 2022). NES domains were analyzed using Wregex server (http://wregex.ehubio.es, accessed on 20 October 2022). NLS domains was predicted using NLS Mapper (https://nls-mapper.iab.keio.ac.jp/cgi-bin/NLS_Mapper_form.cgi accessed on 20 October 2022). The MEME (https://meme-suite.org/meme/, accessed on 13 September 2022) was used to analyze SmHsf conserved motifs with the number of motifs = 10. Visualization of SmHsf motifs and the structures of SmHsf genes was performed using TBtools software. Phylogenetic trees were constructed using the neighbour-joining (NJ) method in MEGA (version 11) software with 1000 bootstrap replicates. Furthermore, the 2000 bp promoter regions upstream of the initiation codon (ATG) of SmHsf genes were searched in the PlantCARE database for identification of cis-regulatory elements, and the number and location of cis-elements in each SmHsf were visualized using Heatmap and Simple BioSequence viewer in the TBtools program.

3.2. Duplication and Synteny Analysis of Hsf Genes

The duplication types of SmHsf genes were examined by the Collinearity Scan toolkit software (MCScanX) with the default parameters [33]. To explore the syntenic relationships of the Hsf genes obtained from S. miltiorrhiza and other selected species, syntenic analysis were performed using MCScanX and visualization was completed by Advanced Circos and Dual Systeny Plot program in TBtools.

3.3. Plant Growth Conditions and Plant Stress Treatments

S. miltiorrhiza seedlings were cultured in a greenhouse at 25 °C, a relative humidity of 50–60%, and a 16 h light/8 h dark photoperiod. The uniform four-week-old plants transferred from soil were grown adaptively in 1/2 Hogland nutrient solution for one week. For abiotic stresses, seedings were treated with 15% PEG 6000, 42 °C, abscisic acid (ABA, 100 μM) and salicylic acid (SA, 100 μM) solution described previously [34]. The roots of samples were collected at 6 h; the untreated plants were used as controls (CK). Three biological replicates were prepared for each treatment. All of the harvested samples were frozen in liquid nitrogen and stored at −80 °C for RNA-seq.

3.4. Transcriptome Analysis of SmHsfs Expression Patterns in Different Organs and under Abiotic Treatments

We analyzed SmHsf expression patterns based on RNA-seq data. Raw data from four organs (root, stem, leaf and flower) in S. miltiorrhiza were download from the National Center for Biotechnology Information (NCBI) (https://www.ncbi.nlm.nih.gov/sra/?term=, accessed on 3 October 2022) under BioProject SRP327565. The public RNA-seq data of S. miltiorrhiza response to abiotic stresses were also obtained from NCBI included gibberellin (GA) (SRP282755), Methyl jasmonate (MeJA) (SRP111399) and ultraviolet radiation (UV) (SRP214513). Besides public data, we also constructed 15 libraries for transcriptome sequencing, which were performed by Illumina Novaseq platform (Beijing) with 150 bp paired-end reads including CK, ABA, SA, PEG and heat samples (PRJNA916388). After quality control of raw data, clean data were mapped to the reference transcriptome sequence by kallisto, and transcript abundances, indicated as TPM (transcripts per million) values, were calculated [35]. The expression profiles of each SmHsf were visualized using Fancy Heatmap Browser program and Heatmap program in TBtools.

3.5. Subcellular Localization

The CDS of SmHsf1 and SmHsf1 without the stop codon were cloned in-frame into the pCAMBIA1300-C-GFP plant expression vector using a Basic Seamless Cloning and Assembly Kit (TransGen Biotech, Beijing). The constructed plasmids of pCAMBIA1300-SmHsf1/7-GFP and empty vector were transformed into Agrobacterium tumefaciens strain GV3101 Chemically Competent Cell (Coolaber, Beijing, China) by the conventional freezing thawing method. Next, all vectors GV3101 were transformed into 4-week-old Nicotiana benthamiana leaves with incubation buffer (10 mM MES pH 5.6, 10 mM MgCl2, 150 µM acetosyringone). In addition, HY5-mcherry was used as the nucleus-located marker. Fluorescent images were obtained at 48–60 h after infiltration by confocal laser microscopy (Zeiss LSM880).

3.6. Thermotolerance Analysis of Transgenic Yeast

The complete SmHsf1 and SmHsf7 (Open Reading Frame) ORF were inserted into the yeast expression vector pPIC3.5K (Coolaber). The plasmid pPIC3.5K-SmHsf1/7 and pPIC3.5K were introduced into Pichia pastoris strain SMD1168 (Coolaber) using the lithium acetate method. A single positive clone of SMD1168 harboring the recombinant pPIC3.5K-SmHsf1/7 or pPIC3.5K vector was incubated into 5 mL SD/-His liquid medium to grow overnight at 30 °C with 200 rpm. The overnight culture was diluted with sterile water to OD600 = 0.8. In addition, then one group of diluted culture were incubated in a water bath at 50 °C for 20 min, another group at 30 °C for 20 min. After heat treatment, 10 μL yeast cells of 10-fold serial dilutions were dotted on SD/-His plates. All plate were photographed after four days of incubation of 30 °C.

4. Discussion

Because they are sessile, plants have evolved complicated transcription control systems to adapt to fluctuating environmental conditions, and a growing amount of evidence suggests Hsfs are essential regulators of this process [19,36]. Genome-wide analysis of the Hsf family were performed in Arabidopsis [36], rice [36], maize [37], Chinese cabbage [38], and so on. However, the Hsf family has not been extensively studied in S. miltiorrhiza.
Here, we identified 35 Hsf genes from the S. miltiorrhiza genome, which were classified into three groups based on evolutionary relationships and respective characteristics. When compared to Arabidopsis and rice, S. miltiorrhiza contains a higher number of SmHsfs [36], with each subgroup showing partial expansion (except subgroupA1) as a result of gene duplication events. In particular, subgroup A9 contained six members in S. miltiorrhiza, but only one in Arabidopsis [36]. The reasons behind this expansion require further investigation, but are usually related to novel traits [39]. We also found that SmHsf genes shared similar exon–intron patterns. Since introns can significantly affect gene expression [40], the similar structures and conserved motifs found within subgroups indicated they may have similar functions.
Gene families are groups of genes originating from a common ancestor, which often retain similarities [41]. Rapid gene family expansion of phenotypically important genes can help plants adapt to adverse environmental conditions [42]. Several gene duplication events contribute differentially to gene family expansion in plants, including WGD/segment duplications, tandem/local duplications, and dispersed duplications, of which the former two account for the majority of duplicates [43,44,45]. A total of three WGD events in Arabidopsis led to a 90% increase in regulatory genes [46]. As for S. miltiorrhiza, it experienced a very recent species-specific duplication event and multiple TE (transposable elements) transposition bursts [29]. In fact, intraspecific synteny analysis showed that the expansion of the smHsf family derived primarily from WGD or segmental duplications, which was also observed in maize [37]. We also found that TE-mediated dispersed duplications were the other major drivers of this gene family expansion.
DanShen is an important medicinal plant, whose breeding can be improved by first cultivating a few thin branching rootlets and screening the genes that control lateral root [27]. Previous studies have shown that Hsf TFs play important roles during root development in plants. For example, the Athsfa4c mutant has a reduced number of lateral and smaller roots [47], while root length and number of lateral roots were significantly lower in Arabidopsis overexpressing Prunus persica HSF5 [48]. Accordingly, we explored the expression profiles of SmHsfs in four different organs to excavate the SmHsf genes that potentially regulate Danshen root development. While we observed tissue-specific expression patterns in SmHsfs, such as SmHsf3 in stems, SmHsf4 in leaves and SmHsf15 in flowers, most genes were highly expressed in the root, including SmHsf5, SmHsf7, SmHsf14 and SmHsf26. These genes may thus play a major role in root developmental processes in this plant.
The expression patterns of SmHsfs following stress induction may lead to a deeper understanding of their biological functions. We found that 11 SmHsf genes were induced by heat stress (42 °C), including significantly higher expressions of SmHsfA2, A7, B1, B2, B3 and B5, which can be major regulators of Hsp- or heat-inducible genes. A previous study showed that AtHSFA2 is the most strongly induced Hsf gene under heat stress, with mutant lines displaying thermosensitivity [7]. Moreover, the expressions of DcaHsf-A2a and A2b were highly upregulated under heat stress in carnation plants [49]; the expression of AtHSFA2, LlHSFA2 and OsHSFA2e enhanced thermotolerance in transgenic Arabidopsis [50,51]; and HsfA7 expression in tomato rapidly increased under mild heat stress, after which the complex HsfA7-HsfA1a was formed to modulate heat stress response [4]. Considering these studies, it is possible that SmHsfA2 and SmHsfA7 may also enhance thermotolerance in S. miltiorrhiza.
Several reports have documented that the majority of HsfA members are upregulated by heat stress and play a particularly important role in thermotolerance [20,50]. However, our results showed that most of the subgroup SmHsfB genes (6/11) were significantly upregulated by heat stress. In addition, SmHsfB2 (SmHsf1,7) and SmHsfB3 (SmHsf5) contained the tetrapeptide expression repressor LFGV, which was not present in SmHsfB1 (SmHsf33), SmHsfB2 (SmHsf24) and SmHsfB5 (SmHsf27). The few studies available on groups HsfB and HsfC were vital for assessing heat-stress recovery in plants [7]. The repressive activity of HsfB1 and HsfB2 were confirmed in Arabidopsis, as these genes could negatively regulate the expression of heat-inducible Hsfs, such as HsfA2 [52]. However, tomato HsfB1 is a coactivator factor that assembles with HsfA1 into an enhanceosome-like complex to synergistically activate a reporter gene [53].
We analyzed the biological function of the most highly induced SmHsf1,7 genes under heat stress in yeast cells. Thermotolerance assays suggested that overexpression of SmHsf1 and SmHsf7 in yeast enhanced resistance to high temperatures, whereby it seems plausible that SmHsf1 and SmHsf7 act as coactivators and not as repressors. However, the exact mechanisms require further investigation. We also note that expression levels of SmHsfC (SmHsf29) were significantly decreased under heat stress, suggesting that the gene has a negative control function.
Previous work has demonstrated that plant Hsfs regulate various stress responses and overlap considerably [54]. In Arabidopsis, cold, salt, ABA, drought and UV-B stress activate the HsfA2, HsfA4, HsfA6B, HSFB1, HSFB2A, and HSFB2B genes to varying degrees [9]. The ectopic expression of Hsfs demonstrates it is possible to enhance Arabidopsis or tobacco tolerance to various stresses, including high salinity, osmotic, extreme temperatures, or UV light [55]. According to the cues of cis-acting elements analysis, the expression patterns of SmHsfs were comprehensively analyzed under treatments of ABA, MeJA, SA, GA, PEG and UV. Most of these genes responded to more than one stress—upregulation or downregulation, which can point out directions of further investigations of biological function.

5. Conclusions

We identified 35 SmHsfs in the S. miltiorrhiza genome and performed a comprehensive bioinformatic analysis on the newly characterized. Firstly, we examined the chromosome distribution, gene structures, conserved domains, gene duplication and synteny analysis. After this, cis-element analysis allowed us to specifically investigate the expression profiles of SmHsfs in four different organs, as well as their expression profiles in response to multiple abiotic stresses and phytohormones. Furthermore, our results revealed that SmHsf1 and SmHsf7 belonged to SmHsfB and perform similar heat response functions in yeast. Yet more studies are needed to determine the precise pathway linking the Hsf gene to heat stress in S. miltiorrhiza. This research provides a basis for the functional study of SmHsfs and mechanisms of resistance to environmental change in S. miltiorrhiza.

Supplementary Materials

The supporting information can be downloaded at: https://www.mdpi.com/article/10.3390/ijms24108461/s1.

Author Contributions

R.Q.: Conceptualization, Formal analysis, Roles/Writing—original draft. S.W. (Shiwei Wang): Validation, Formal analysis. X.W.: Formal analysis. J.P.: Investigation. J.G.: Resources, Visualization, Funding acquisition. G.C.: Visualization. M.C.: Visualization. J.M.: Data Curation. C.L.: Resources, Investigation. L.H.: Resources, Funding acquisition. S.W. (Sheng Wang): Project administration, Funding acquisition. Y.S.: Writing—Review and Editing, Project administration. All authors have read and agreed to the published version of the manuscript.

Funding

This work was supported by the CACMS Innovation Fund (CI2021A03903), National Natural Science Foundation of China (81573533), and National Key R&D Program of China (2020YFA0908000).

Institutional Review Board Statement

Not applicable.

Informed Consent Statement

Not applicable.

Data Availability Statement

Data generated in this work is provided in the manuscript.

Conflicts of Interest

The authors declare no conflict of interest.

References

  1. Singh, K.B.; Foley, R.C.; Oñate-Sánchez, L. Transcription factors in plant defense and stress re-sponses. Curr. Opin. Plant Biol. 2002, 5, 430–436. [Google Scholar] [CrossRef] [PubMed]
  2. Khan, Z.; Shahwar, D. Role of Heat Shock Proteins (HSPs) and Heat Stress Tolerance in Crop Plants. In Sustainable Agriculture in the Era of Climate Change; Roychowdhury, R., Choudhury, S., Hasanuzzaman, M., Srivastava, S., Eds.; Springer International Publishing: Cham, Switzerland, 2020; pp. 211–234. [Google Scholar] [CrossRef]
  3. Zhao, C.; Liu, B.; Piao, S.; Wang, X.; Lobell, D.B.; Huang, Y.; Huang, M.T.; Yao, Y.T.; Bassu, S.; Ciais, P.; et al. Temperature increase reduces global yields of major crops in four independent estimates. Proc. Natl. Acad. Sci. USA 2017, 114, 9326–9331. [Google Scholar] [CrossRef] [PubMed]
  4. Mesihovic, A.; Ullrich, S.; Rosenkranz, R.R.; Gebhardt, P.; Bublak, D.; Eich, H.; Weber, D.; Berberich, T.; Scharf, K.-D.; Schleiff, E.; et al. HsfA7 coordinates the transition from mild to strong heat stress response by controlling the activity of the master regulator HsfA1a in tomato. Cell Rep. 2022, 38, 110224. [Google Scholar] [CrossRef] [PubMed]
  5. Boyer, J.S. Plant Productivity and Environment. Science 1982, 218, 443–448. [Google Scholar] [CrossRef]
  6. Wolters, H.; Jürgens, G. Survival of the Flexible: Hormonal Growth Control and Adaptation in Plant Development. Nat. Rev. Genet. 2009, 10, 305–317. [Google Scholar] [CrossRef]
  7. Jacob, P.; Hirt, H.; Bendahmane, A. The heat-shock protein/chaperone network and multiple stress resistance. Plant Biotechnol. J. 2017, 15, 405–414. [Google Scholar] [CrossRef]
  8. Schultheiss, J.; Kunert, O.; Gase, U.; Scharf, K.-D.; Nover, L.; Rüterjans, H. Solution Structure of the DNA-Binding Domain of the Tomato Heat-Stress Transcription Factor HSF24. Eur. J. Bio-Chem. 1996, 236, 911–921. [Google Scholar] [CrossRef]
  9. Andrási, N.; Pettkó-Szandtner, A.; Szabados, L. Diversity of plant heat shock factors: Regulation, interactions, and functions. J. Exp. Bot. 2020, 72, 1558–1575. [Google Scholar] [CrossRef]
  10. Peteranderl, R.; Rabenstein, M.; Shin, Y.-K.; Liu, C.W.; Wemmer, D.E.; King, D.S.; Nelson, H.C.M. Biochemical and Biophysical Characterization of the Trimerization Domain from the Heat Shock Transcription Factor. Biochemistry 1999, 38, 3559–3569. [Google Scholar] [CrossRef]
  11. Nover, L.; Scharf, K.-D.; Gagliardi, D.; Vergne, P.; Czarnecka-Verner, E.; Gurley, W.B. The Hsf world: Classification and properties of plant heat stress transcription factors. Cell Stress Chaperones 1996, 1, 215. [Google Scholar] [CrossRef]
  12. Kotak, S.; Port, M.; Ganguli, A.; Bicker, F.; von Koskull-Döring, P. Characterization of C-terminal domains of Arabidopsis heat stress transcription factors (Hsfs) and identification of a new signature com-bination of plant class A Hsfs with AHA and NES motifs essential for activator function and intracellular lo-calization. Plant J. 2004, 39, 98–112. [Google Scholar] [CrossRef] [PubMed]
  13. Czarnecka-Verner, E.; Pan, S.; Salem, T.; Gurley, W.B. Plant class B HSFs inhibit transcription and exhibit affinity for TFIIB and TBP. Plant Mol. Biol. 2004, 56, 57–75. [Google Scholar] [CrossRef] [PubMed]
  14. Heerklotz, D.; Döring, P.; Bonzelius, F.; Winkelhaus, S.; Nover, L. The Balance of Nuclear Import and Export Determines the Intracellular Distribution and Function of Tomato Heat Stress Transcription Factor HsfA2. Mol. Cell. Biol. 2001, 21, 1759–1768. [Google Scholar] [CrossRef]
  15. Lyck, R.; Harmening, U.; Höhfeld, I.; Treuter, E.; Scharf, K.-D.; Nover, L. Intracellular distribution and identification of the nuclear localization signals of two plant heat-stress transcription factors. Planta 1997, 202, 117–125. [Google Scholar] [CrossRef] [PubMed]
  16. Mishra, S.K.; Tripp, J.; Winkelhaus, S.; Tschiersch, B.; Theres, K.; Nover, L.; Scharf, K.-D. In the com-plex family of heat stress transcription factors, HsfA1 has a unique role as master regulator of thermotol-erance in tomato. Genes Dev. 2002, 16, 1555–1567. [Google Scholar] [CrossRef]
  17. Busch, W.; Wunderlich, M.; Schöffl, F. Identification of novel heat shock factor-dependent genes and biochemical pathways in Arabidopsis thaliana. Plant J. 2005, 41, 1–14. [Google Scholar] [CrossRef]
  18. Liu, H.; Wang, X.; Wang, D.; Zou, Z.; Liang, Z. Effect of drought stress on growth and accumulation of active constituents in Salvia miltiorrhiza Bunge. Ind. Crops Prod. 2011, 33, 84–88. [Google Scholar] [CrossRef]
  19. Nishizawa, A.; Yabuta, Y.; Yoshida, E.; Maruta, T.; Yoshimura, K.; Shigeoka, S. Arabidopsis heat shock transcription factor A2 as a key regulator in response to several types of environmental stress. Plant J. 2006, 48, 535–547. [Google Scholar] [CrossRef]
  20. Nishizawa-Yokoi, A.; Nosaka, R.; Hayashi, H.; Tainaka, H.; Maruta, T.; Tamoi, M.; Ikeda, M.; Ohme-Takagi, M.; Yoshimura, K.; Yabuta, Y.; et al. HsfA1d and HsfA1e Involved in the Transcriptional Regulation of HsfA2 Function as Key Regulators for the Hsf Signaling Network in Response to Environmental Stress. Plant Cell Physiol. 2011, 52, 933–945. [Google Scholar] [CrossRef]
  21. Chan-Schaminet, K.Y.; Baniwal, S.K.; Bublak, D.; Nover, L.; Scharf, K.-D. Specific Interaction between Tomato HsfA1 and HsfA2 Creates Hetero-oligomeric Superactivator Complexes for Synergistic Activation of Heat Stress Gene Expression. J. Biol. Chem. 2009, 284, 20848–20857. [Google Scholar] [CrossRef]
  22. Xu, Y.; Chu, C.; Yao, S. The impact of high-temperature stress on rice: Challenges and solutions. Crop J. 2021, 9, 963–976. [Google Scholar] [CrossRef]
  23. Tejedor-Cano, J.; Prieto-Dapena, P.; Almoguera, C.; Carranco, R.; Hiratsu, K.; Ohme-Takagi, M.; Jordano, J. Loss of function of the HSFA9 seed longevity program. Plant Cell Environ. 2010, 33, 1408–1417. [Google Scholar] [CrossRef] [PubMed]
  24. Liu, H.-C.; Liao, H.-T.; Charng, Y.-Y. The role of class A1 heat shock factors (HSFA1s) in response to heat and other stresses in Arabidopsis. Plant Cell Environ. 2011, 34, 738–751. [Google Scholar] [CrossRef] [PubMed]
  25. Wunderlich, M.; Groß-Hardt, R.; Schöffl, F. Heat shock factor HSFB2a involved in gametophyte development of Arabidopsis thaliana and its expression is controlled by a heat-inducible long non-coding antisense RNA. Plant Mol. Biol. 2014, 85, 541–550. [Google Scholar] [CrossRef]
  26. Yin, X.; Fan, H.; Chen, Y.; Li, L.; Song, W.; Fan, Y.; Zhou, W.; Ma, G.; Alolga, R.N.; Li, W.; et al. Integrative omic and transgenic analyses reveal the positive effect of ultraviolet-B irradiation on salvianolic acid biosynthesis through upregulation of SmNAC1. Plant J. 2020, 104, 781–799. [Google Scholar] [CrossRef]
  27. Sui, C. Salvia miltiorrhiza Resources, Cultivation, and Breeding. In The Salvia Miltiorrhiza Genome; Lu, S., Ed.; Springer International Publishing: Cham, Switzerland, 2019; pp. 17–32. [Google Scholar] [CrossRef]
  28. Wu, W.-Y.; Wang, Y.-P. Pharmacological actions and therapeutic applications of Salvia miltiorrhiza depside salt and its active components. Acta Pharmacol. Sin. 2012, 33, 1119–1130. [Google Scholar] [CrossRef]
  29. Song, Z.; Lin, C.; Xing, P.; Fen, Y.; Jin, H.; Zhou, C.; Gu, Y.Q.; Wang, J.; Li, X. A high-quality reference genome sequence of Salvia miltiorrhiza provides insights into tanshinone synthesis in its red rhizomes. Plant Genome 2020, 13, e20041. [Google Scholar] [CrossRef]
  30. Maher, C.; Stein, L.; Ware, D. Evolution of Arabidopsis microRNA families through duplication events. Genome Res. 2006, 16, 510–519. [Google Scholar] [CrossRef]
  31. Liu, Z.; Li, G.; Zhang, H.; Zhang, Y.; Zhang, Y.; Duan, S.; Sheteiwy, M.S.A.; Zhang, H.; Shao, H.; Guo, X. TaHsfA2-1, a new gene for thermotolerance in wheat seedlings: Characterization and functional roles. J. Plant Physiol. 2020, 246–247, 153135. [Google Scholar] [CrossRef]
  32. Chen, C.J.; Chen, H.; Zhang, Y.; Thomas, H.R.; Frank, M.H.; He, Y.H.; Xia, R. TBtools: An Integrative Toolkit Developed for Interactive Analyses of Big Biological Data. Mol. Plant 2020, 13, 1194–1202. [Google Scholar] [CrossRef]
  33. Wang, Y.; Tang, H.; DeBarry, J.D.; Tan, X.; Li, J.; Wang, X.; Lee, T.-H.; Jin, H.; Marler, B.; Guo, H.; et al. MCScanX: A toolkit for detection and evolutionary analysis of gene synteny and collinearity. Nucleic Acids Res. 2012, 40, e49. [Google Scholar] [CrossRef]
  34. Li, L.; Liu, Y.; Huang, Y.; Li, B.; Ma, W.; Wang, D.; Cao, X.; Wang, Z. Genome-Wide Identification of the TIFY Family in Salvia miltiorrhiza Reveals That SmJAZ3 Interacts With SmWD40-170, a Relevant Protein That Modulates Secondary Metabolism and Development. Front. Plant Sci. 2021, 12, 630424. [Google Scholar] [CrossRef]
  35. Bray, N.L.; Pimentel, H.; Melsted, P.; Pachter, L. Near-optimal probabilistic RNA-seq quantification. Nat. Biotechnol. 2016, 34, 525–527. [Google Scholar] [CrossRef]
  36. Guo, J.; Wu, J.; Ji, Q.; Wang, C.; Luo, L.; Yuan, Y.; Wang, Y.; Wang, J. Genome-wide analysis of heat shock transcription factor families in rice and Arabidopsis. J. Genet. Genom. 2008, 35, 105–118. [Google Scholar] [CrossRef]
  37. Lin, Y.-X.; Jiang, H.-Y.; Chu, Z.-X.; Tang, X.-L.; Zhu, S.-W.; Cheng, B.-J. Genome-wide identification, classification and analysis of heat shock transcription factor family in maize. BMC Genom. 2011, 12, 76. [Google Scholar] [CrossRef]
  38. Song, S.; Qi, T.; Wasternack, C.; Xie, D. Jasmonate signaling and crosstalk with gibberellin and ethylene. Curr. Opin. Plant Biol. 2014, 21, 112–119. [Google Scholar] [CrossRef]
  39. Van de Peer, Y.; Maere, S.; Meyer, A. The evolutionary significance of ancient genome duplications. Nat. Rev. Genet. 2009, 10, 725–732. [Google Scholar] [CrossRef]
  40. Rose, A.B. Intron-Mediated Regulation of Gene Expression. In Nuclear Pre-MRNA Processing in Plants; Reddy, A.S.N., Golovkin, M., Eds.; Springer: Berlin/Heidelberg, Germany, 2008; pp. 277–290. [Google Scholar] [CrossRef]
  41. Todd, A.E.; Orengo, C.A.; Thornton, J.M. Evolution of function in protein superfamilies, from a struc-tural perspective. J. Mol. Biol. 2001, 307, 1113–1143. [Google Scholar] [CrossRef]
  42. Demuth, J.P.; Hahn, M.W. The life and death of gene families. Bioessays 2009, 31, 29–39. [Google Scholar] [CrossRef]
  43. Achaz, G.; Coissac, E.; Viari, A.; Netter, P. Analysis of Intrachromosomal Duplications in Yeast Saccharomyces cerevisiae: A Possible Model for Their Origin. Mol. Biol. Evol. 2000, 17, 1268–1275. [Google Scholar] [CrossRef]
  44. Blanc, G.; Hokamp, K.; Wolfe, K.H. A recent polyploidy superimposed on older large-scale duplica-tions in the Arabidopsis genome. Genome Res. 2003, 13, 137–144. [Google Scholar] [CrossRef] [PubMed]
  45. Hughes, A.L.; Friedman, R.; Ekollu, V.; Rose, J.R. Non-random association of transposable elements with duplicated genomic blocks in Arabidopsis thaliana. Mol. Phylogenet. Evol. 2003, 29, 410–416. [Google Scholar] [CrossRef] [PubMed]
  46. Maere, S.; De Bodt, S.; Raes, J.; Casneuf, T.; Van Montagu, M.; Kuiper, M.; Van de Peer, Y. Modeling gene and genome duplications in eukaryotes. Proc. Natl. Acad. Sci. USA 2005, 102, 5454–5459. [Google Scholar] [CrossRef] [PubMed]
  47. Fortunati, A.; Piconese, S.; Tassone, P.; Ferrari, S.; Migliaccio, F. A new mutant of Arabidopsis disturbed in its roots, right-handed slanting, and gravitropism defines a gene that encodes a heat-shock factor. J. Exp. Bot. 2008, 59, 1363–1374. [Google Scholar] [CrossRef]
  48. Tan, B.; Yan, L.; Li, H.; Lian, X.; Cheng, J.; Wang, W.; Zheng, X.; Wang, X.; Li, J.; Ye, X.; et al. Ge-nome-wide identification of HSF family in peach and functional analysis of PpHSF5 involvement in root and aerial organ development. PeerJ 2021, 9, e1096. [Google Scholar] [CrossRef]
  49. Li, W.; Wan, X.-L.; Yu, J.-Y.; Wang, K.-L.; Zhang, J. Genome-Wide Identification, Classification, and Expression Analysis of the Hsf Gene Family in Carnation (Dianthus caryophyllus). Int. J. Mol. Sci. 2019, 20, 5233. [Google Scholar] [CrossRef]
  50. Ogawa, D.; Yamaguchi, K.; Nishiuchi, T. High-level overexpression of the Arabidopsis HsfA2 gene confers not only increased themotolerance but also salt/osmotic stress tolerance and enhanced callus growth. J. Exp. Bot. 2007, 58, 3373–3383. [Google Scholar] [CrossRef]
  51. Yokotani, N.; Ichikawa, T.; Kondou, Y.; Matsui, M.; Hirochika, H.; Iwabuchi, M.; Oda, K. Expression of rice heat stress transcription factor OsHsfA2e enhances tolerance to environmental stresses in transgenic Arabidopsis. Planta 2008, 227, 957–967. [Google Scholar] [CrossRef]
  52. Ikeda, M.; Mitsuda, N.; Ohme-Takagi, M. Arabidopsis HsfB1 and HsfB2b Act as Repressors of the Expression of Heat-Inducible Hsfs but Positively Regulate the Acquired Thermotolerance. Plant Physiol. 2011, 157, 1243–1254. [Google Scholar] [CrossRef]
  53. Bharti, K.; von Koskull-Döring, P.; Bharti, S.; Kumar, P.; Tintschl-Körbitzer, A.; Treuter, E.; Nover, L. Tomato Heat Stress Transcription Factor HsfB1 Represents a Novel Type of General Transcription Coactivator with a Histone-Like Motif Interacting with the Plant CREB Binding Protein Ortholog HAC1. Plant Cell 2004, 16, 1521–1535. [Google Scholar] [CrossRef]
  54. Swindell, W.R.; Huebner, M.; Weber, A.P. Transcriptional profiling of Arabidopsis heat shock proteins and transcription factors reveals extensive overlap between heat and non-heat stress response pathways. BMC Genom. 2007, 8, 125. [Google Scholar] [CrossRef]
  55. Zhu, X.; Huang, C.; Zhang, L.; Liu, H.; Yu, J.; Hu, Z.; Hua, W. Systematic Analysis of Hsf Family Genes in the Brassica napus Genome Reveals Novel Responses to Heat, Drought and High CO2 Stresses. Front. Plant Sci. 2017, 8, 1174. [Google Scholar] [CrossRef]
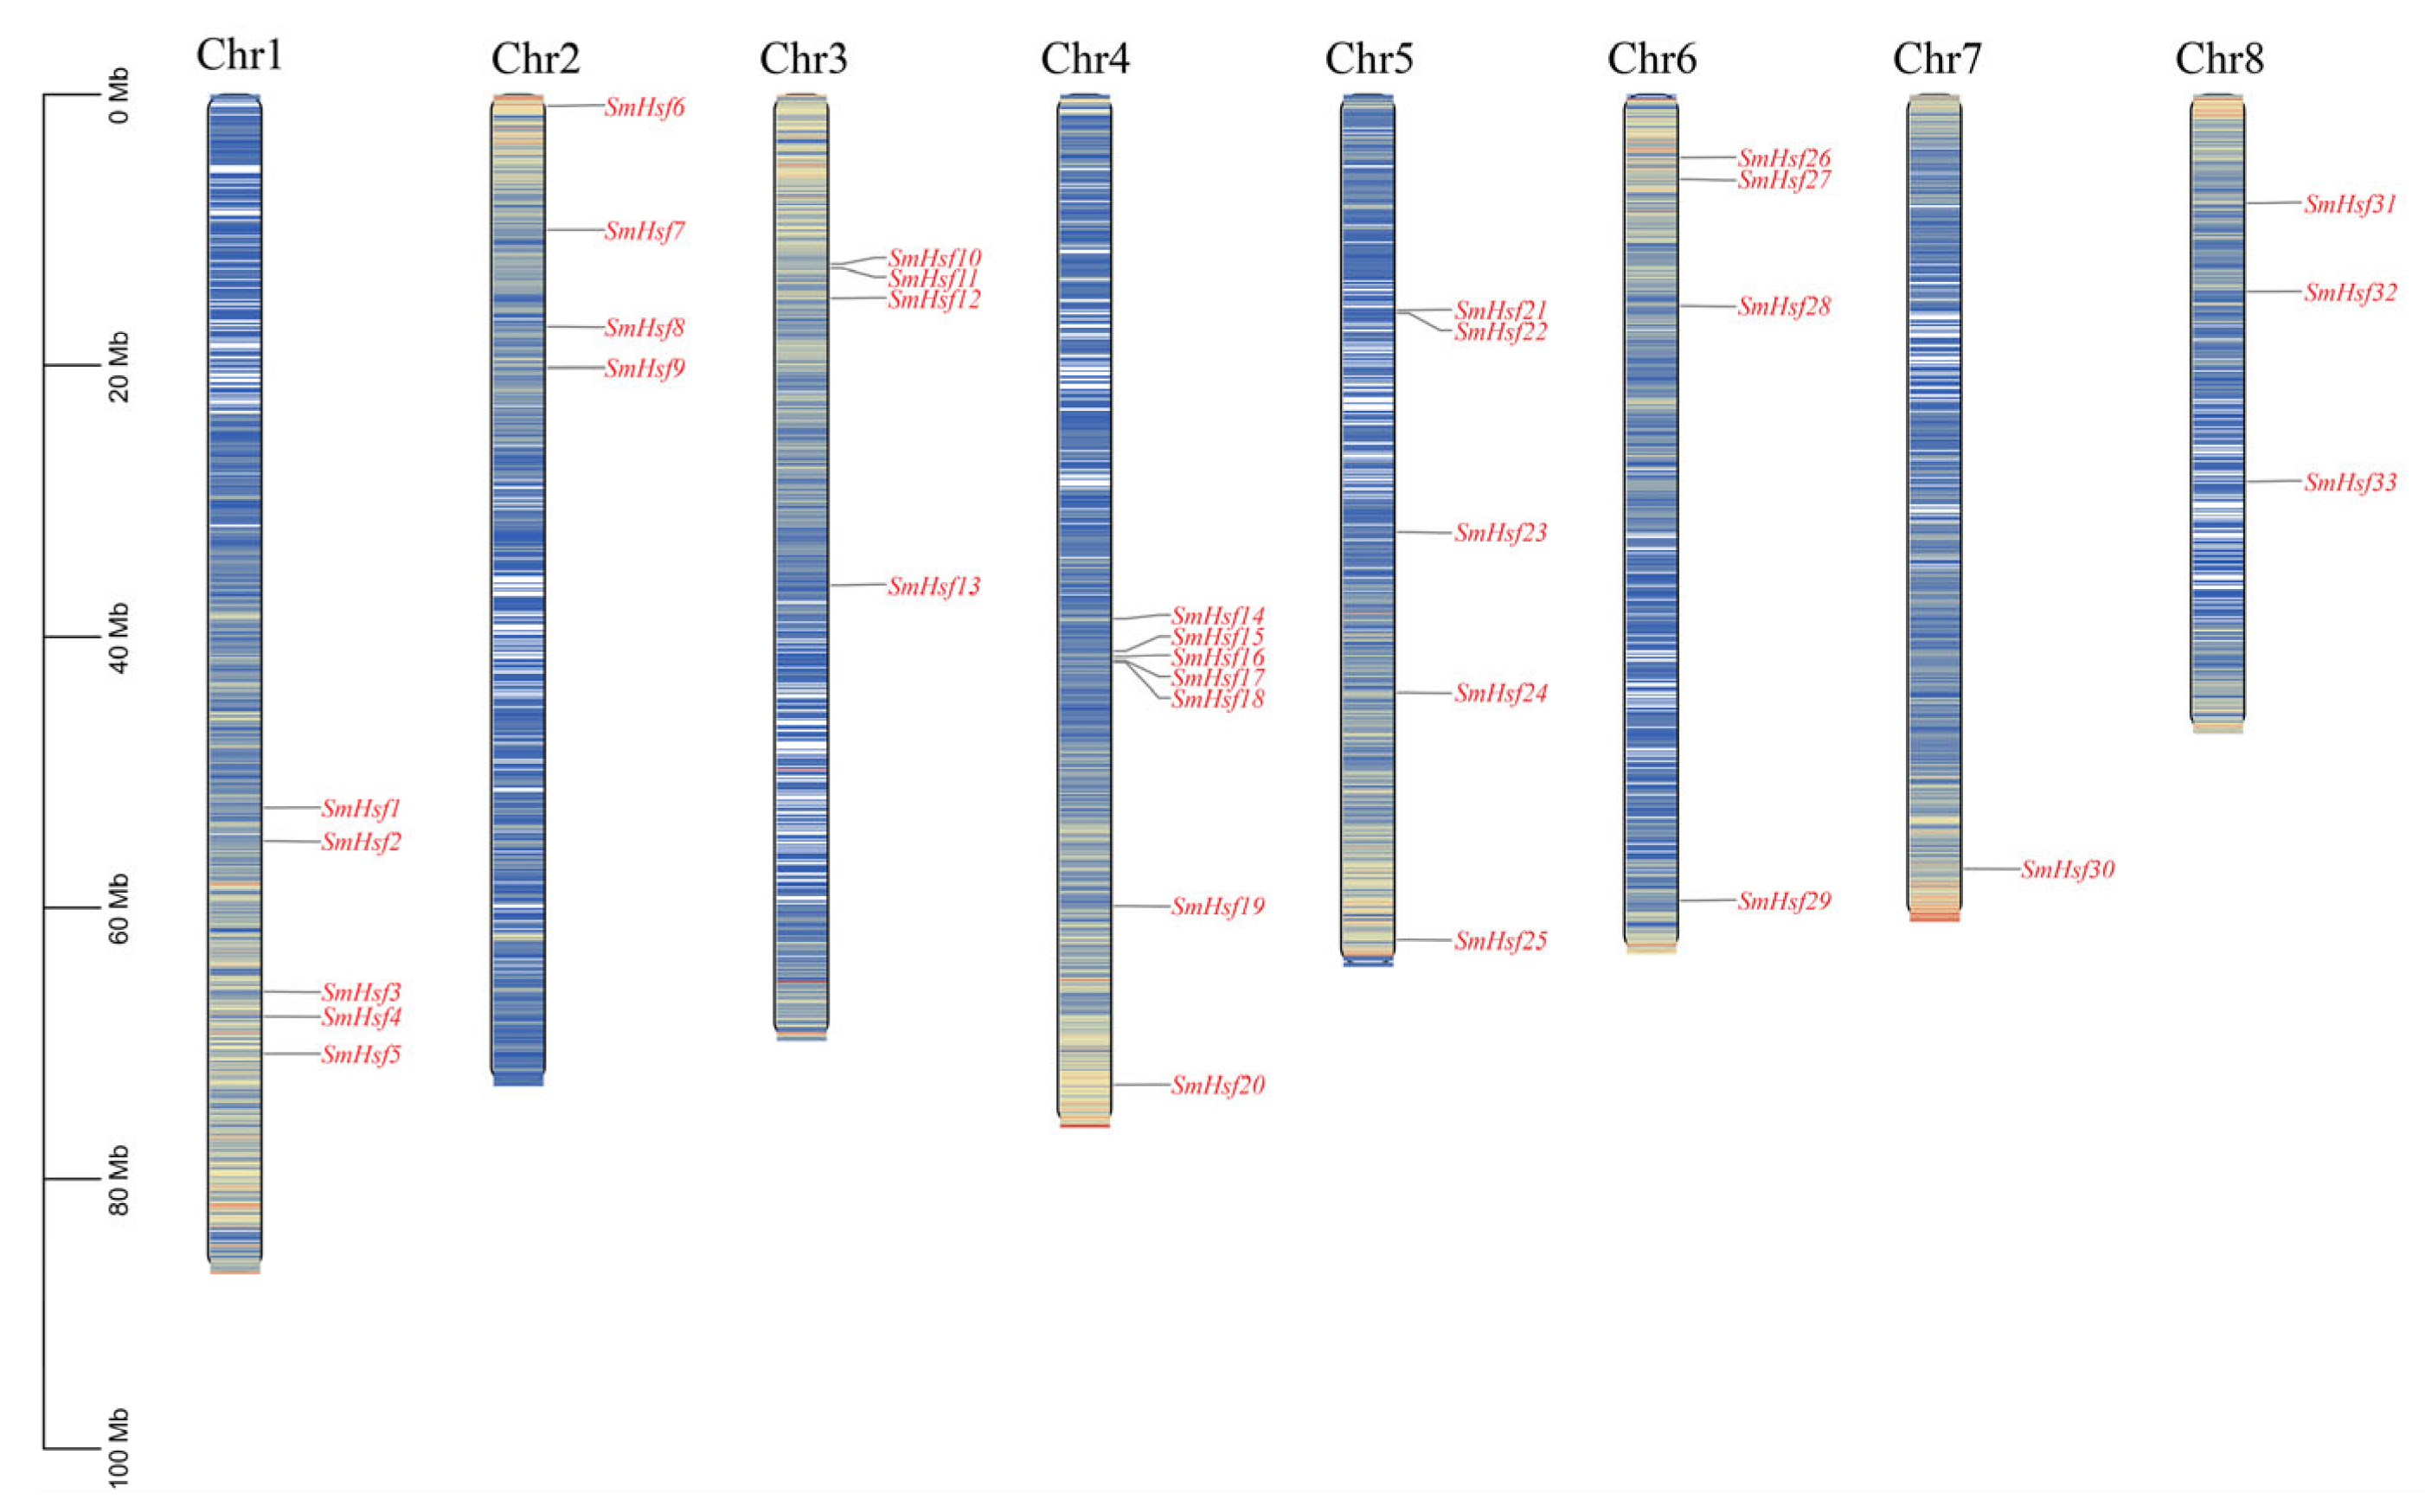
Figure 1. Chromosomal locations of Hsf in S. miltiorrhiza on chromosomes 1–8. The scale represents sequence length in megabases (Mb).
Ijms 24 08461 g001
Figure 2. Phylogenetic tree of the Hsf gene family from S. miltiorrhiza, A. thaliana, and O. Sativa. The phylogenetic tree was constructed using MEGA (version 11) with the neighbor-joining (NJ) method (1000 bootstrap replicates). Hsfs in S. miltiorrhiza are indicated by the red nodes.
Ijms 24 08461 g002
Figure 3. Gene structure, conserved domains and motif analysis of SmHsf proteins from S. miltiorrhiza. (A) Exon–intron structures of SmHsf. UTRs, exons and introns were represented by green boxes, yellow boxes and black single lines, respectively. (B) The conserved domain in the SmHsf proteins. Green boxes indicate Hsf or DBD domain. (C) Distribution of conserved motifs of the SmHsf proteins. The ten motifs are represented by different colored boxes, of which sequence logos were showed in (D). The sequence length of the domain or motif was indicated at the bottom of each figure.
Ijms 24 08461 g003
Figure 4. The inter-chromosomal relationships of SmHsf genes. The two outer rings represent the gene density per chromosome of S. miltiorrhiza. Gray lines represent synteny blocks in the genome, while duplicated SmHsf gene pairs are connected with different color lines.
Ijms 24 08461 g004
Figure 5. Synteny analysis of Hsfs between S. miltiorrhiza and six other species. The collinear blocks are marked by gray lines, while the collinear gene pairs with Hsf genes are highlighted in the purple lines. The different color bar indicated the different chromosomes. ‘S. bowleyana’, ‘S. baicalensis’, ‘A. hispanicum’, ‘A. thaliana’, ‘O. sativa’ and ‘Z. mays’ indicate Salvia bowleyana, Scutellaria baicalensis, Antirrhinum hispanicum, Arabidopsis thaliana, Oryza sativa and Zea mays, respectively.
Ijms 24 08461 g005
Figure 6. Analysis of the cis-elements in SmHsf gene promoters. (A) The sum of the cis-elements in each category is demonstrated by the varied color bar diagram. (B) Heatmap of the numbers of major cis-elements in hormone-responsive, stress responsiveness and plant development and metabolism. (C) Distribution of hormone-responsive elements in the promoter region, including position, kind and quantity of elements.
Ijms 24 08461 g006
Figure 7. The prediction of the regulation network between SmHsfs and upstream regulators. (A) Construction of the network using Cytoscape. The purple box represents 35 SmHsf genes, the green boxes represent different upstream regulators. (B) GO enrichment analysis of all upstream regulators in the network. (C) The top five regulated SmHsfs. (D) The top five upstream regulators.
Ijms 24 08461 g007
Figure 8. Expression profile of SmHsf genes in different organs. The investigation based on a public transcriptome data of S. miltiorrhiza (SRP327565), and the mean expression value of three biological replications was used for each organ sample. (A) Diagram showing the different organs of the 2-year-old S. miltiorrhiza, including root, stem, leaf and flower. (B) The heatmaps were generated using TBtools. Red color signifies high expression level, while blue signifies low expression level.
Ijms 24 08461 g008
Figure 9. Expression profiles of 35 SmHsf genes in roots of S. miltiorrhiza under exogenous phytohormone treatments. The transcriptional levels of SmHsf genes in response to ABA (A), GA (B), MeJA (C) and SA (D) treatments were analyzed based on transcriptome data. The normalized TPM values indicated expression level of genes, which green indicates downregulation, and red represents upregulation. The genes with fold-change > 1.5 were considered as significantly changed genes. The significantly upregulated genes are marked by “+” and significantly downregulated genes are marked by “−”. SmHsfA, SmHsfB and SmHsfC are grouped with red, purple and brown colors. CK, control; ABA-6h, abscisic acid treatment for 6 h; GA-2 h, gibberellin treatment for 2 h; MeJA-1 h/6 h, methyl jasmonate treatment for 1 h or 6 h; SA-6 h, salicylic acid treatment for 6 h. Detail data in Supplementary Materials, Table S9.
Ijms 24 08461 g009
Figure 10. Expression patterns of 35 SmHsf genes in roots of S. miltiorrhiza under various abiotic stresses. The transcriptional levels of SmHsf genes in response to UV−light (A), heat stress (HS) (B) and PEG (C) stressors were analyzed based on transcriptome data. The normalized TPM values indicated expression level of genes. The genes with fold−change > 1.5 were considered as significantly changed genes. The significantly upregulated genes are marked by “+” and significantly downregulated genes are marked by “−”. SmHsfA, SmHsfB and SmHsfC are grouped with red, purple and brown colors. CK, control; UV−4 h, UV−light treatment for 4 h; HS−6 h, 42 °C treatment for 6 h; PEG−6 h, PEG−6000 treatment for 6 h. Detail data in Supplementary Materials, Table S10.
Ijms 24 08461 g010
Figure 11. Characteristic analysis of SmHsf1 and SmHsf7. (A) Subcellular localization analysis in tobacco epidermal cells. HY5-mcherry was used as indication of nuclear localization. (B) Growth of P. pastoris SMD1168 transformants after HS (50 °C) and normal temperature (30 °C). pPIC3.5K, SMD1168 cells carrying empty vector; SmHsf1/7, SMD1168 cells carrying vector pPIC3.5k-SmHsf1/7.
Ijms 24 08461 g011
Disclaimer/Publisher’s Note: The statements, opinions and data contained in all publications are solely those of the individual author(s) and contributor(s) and not of MDPI and/or the editor(s). MDPI and/or the editor(s) disclaim responsibility for any injury to people or property resulting from any ideas, methods, instructions or products referred to in the content.