
Synthesis and Anticancer Evaluation of New Indole-Based Tyrphostin Derivatives and Their (p-Cymene)dichloridoruthenium(II) Complexes

 ,
,  and
and 
Abstract
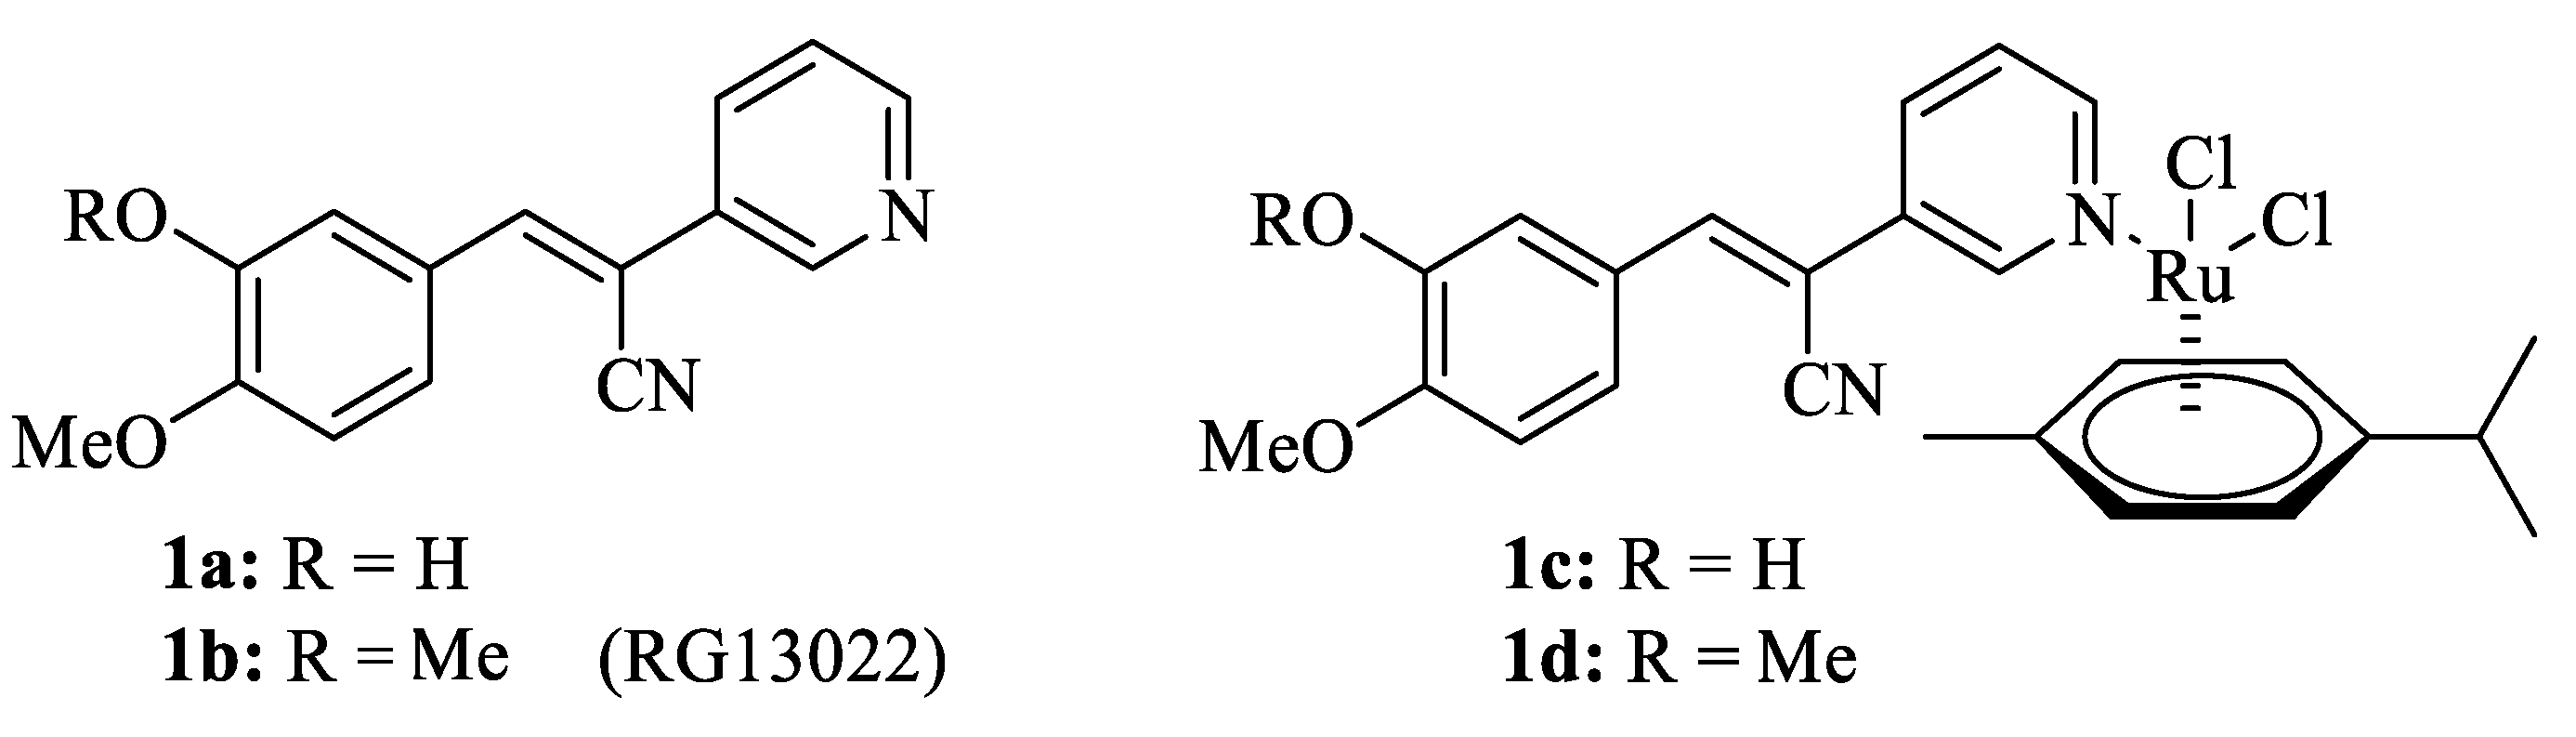
1. Introduction
2. Results
2.1. Chemistry
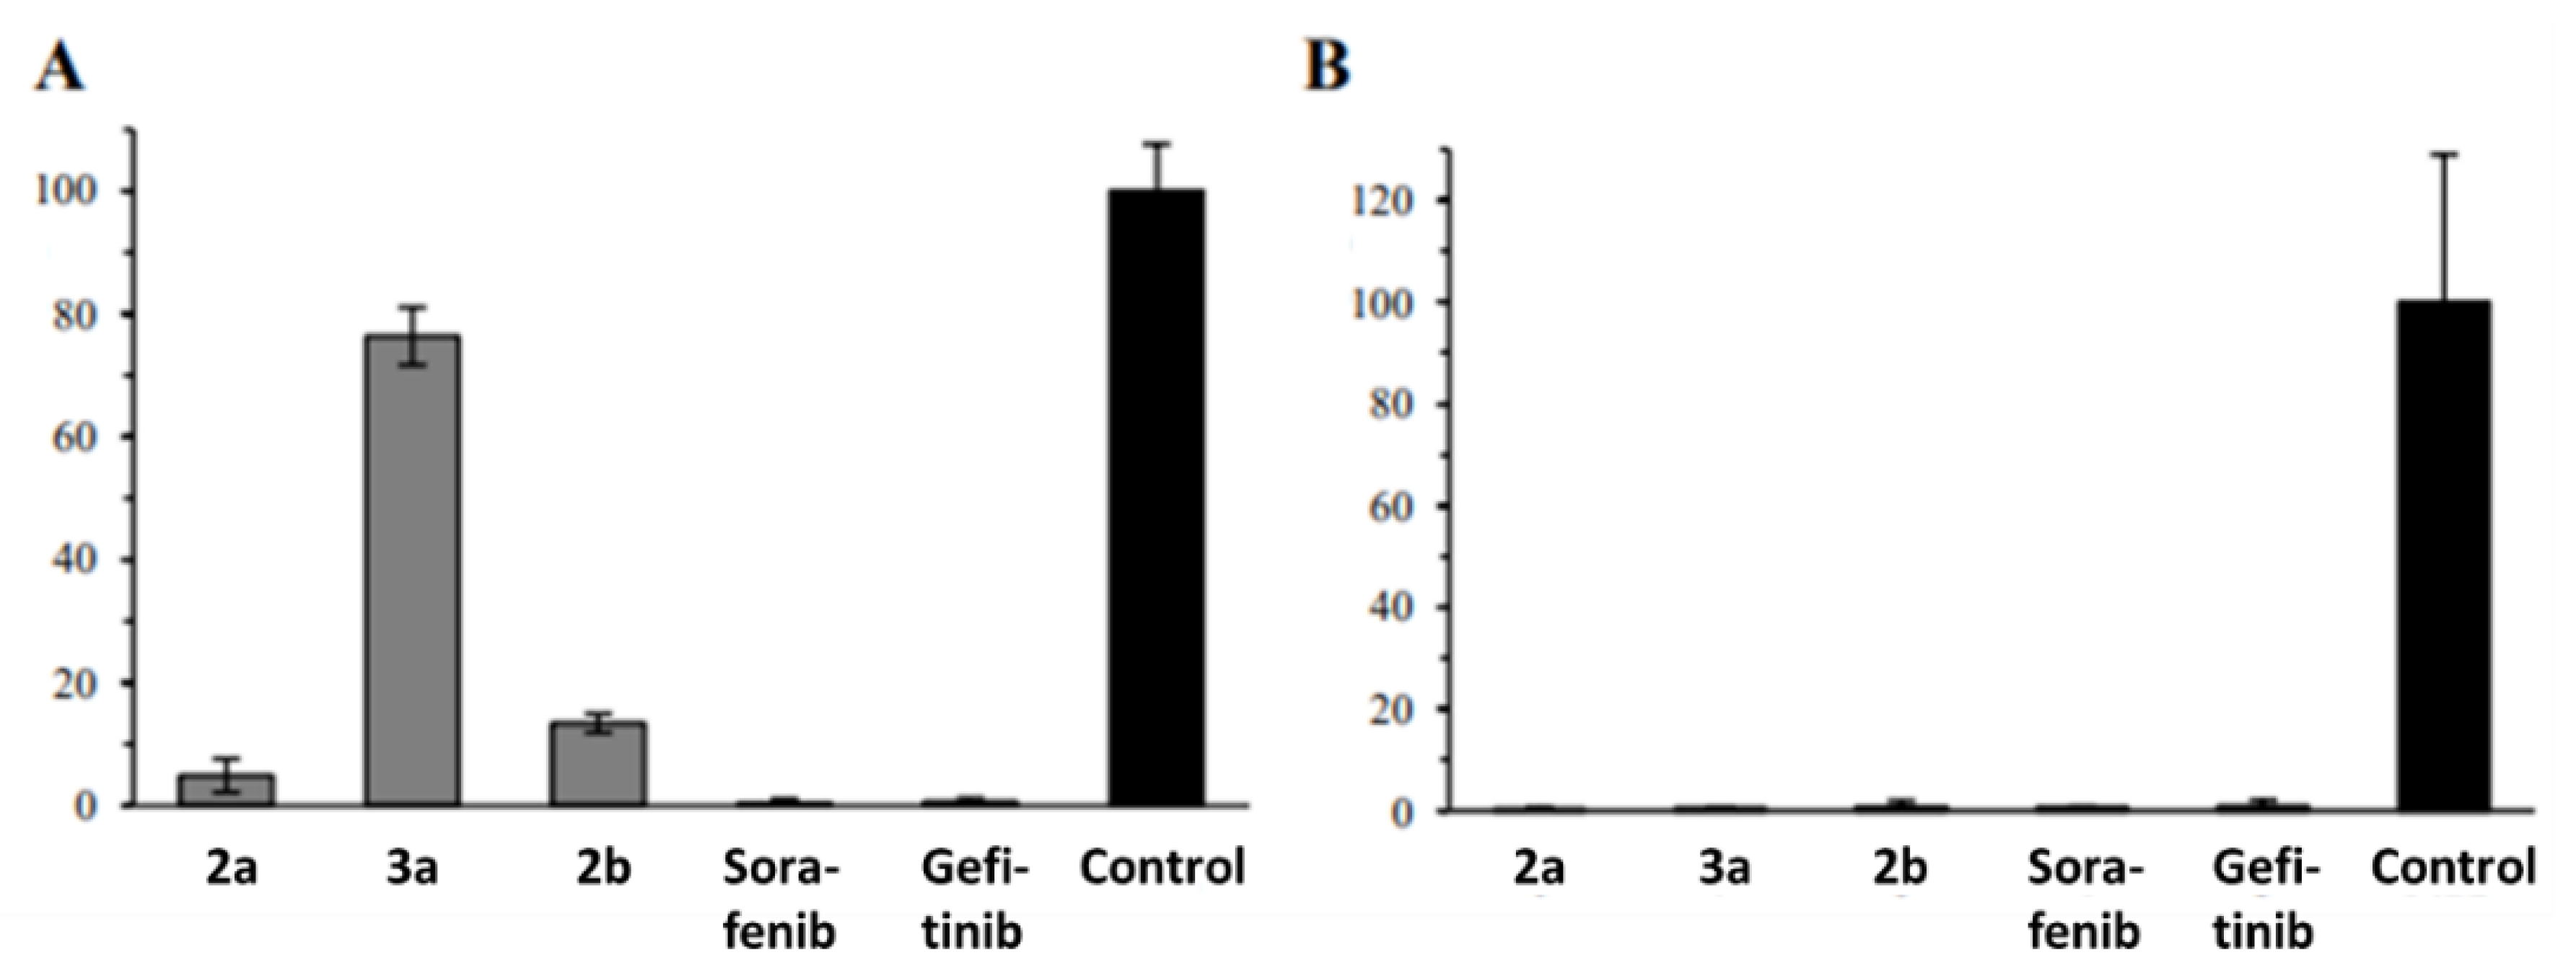
2.2. Anticancer Activity
3. Discussion
4. Materials and Methods
4.1. General Procedures
4.2. Materials
4.3. Synthesis
4.3.1. Synthesis of Acrylonitriles 2
3-[1-Cyano-2-(1-methylindol-5-yl)-(Z)-ethenyl)]-3-pyridine (2a)
3-[1-Cyano-2-(1-ethylindol-5-yl)-(Z)-ethenyl)]-3-pyridine (2b)
3-[1-Cyano-2-(2,3-dichloro-1-ethyl-indol-5-yl)-(Z)-ethenyl)]-3-pyridine (2c)
3-[1-Cyano-2-(1-propylindol-5-yl)-(Z)-ethenyl)]-3-pyridine (2d)
3-[1-Cyano-2-(1-propargylindol-5-yl)-(Z)-ethenyl)]-3-pyridine (2e)
4.3.2. Synthesis of (p-Cymene)dichloridoruthenium(II) Complexes 3
Complex 3a
Complex 3b
Complex 3c
Complex 3d
Complex 3e
4.4. Anticancer Activity
4.4.1. Cell Line and Culture Conditions
4.4.2. MTT Assay
4.4.3. Hexosaminidase Assay
4.4.4. Cell Cycle Analysis
4.4.5. Ethidium Bromide Assay
4.4.6. ROS Formation Assay
4.4.7. Caspase 3/7 Activation Assay
4.4.8. LDH Assay
4.4.9. Colony Formation Assay
4.4.10. Tumor Spheroid Inhibition Assay
4.4.11. Tube Formation Assay
4.5. Molecular Docking
Author Contributions
Funding
Institutional Review Board Statement
Informed Consent Statement
Data Availability Statement
Acknowledgments
Conflicts of Interest
References
- Dua, R.; Shrivastava, S.; Sonwane, S.K.; Srivastava, S.K. Pharmacological significance of synthetic heterocycles scaffold: A review. Adv. Biol. Res. 2011, 5, 120–144. [Google Scholar]
- Khare, R.; Pandey, J.; Smriti, S.; Rupanwar, R. The importance and applications of Knoevenagel reaction. Orient. J. Chem. 2019, 35, 423–429. [Google Scholar] [CrossRef]
- Loupy, A.; Pellet, M.; Petit, A.; Vo-Thanh, G. Solvent-free condensation of phenylacetonitrile and nonanenitrile with 4-methoxybenzaldehyde: Optimization and mechanistic studies. Org. Biomol. Chem. 2005, 3, 1534–1540. [Google Scholar] [CrossRef] [PubMed]
- Yoneda, T.; Lyall, R.M.; Alsina, M.M.; Persons, P.E.; Spada, A.P.; Levitzki, A.; Zilberstein, A.; Mundy, G.R. The antiproliferative effects of tyrosine kinase inhibitors tyrphostins on a human squamous cell carcinoma in vitro and in nude mice. Cancer Res. 1991, 51, 4430–4435. [Google Scholar]
- Köhler, J.; Schuler, M. Afatinib, erlotinib and gefitinib in the first-line therapy of EGFR mutation-positive lung adenocarcinoma: A review. Onkologie 2013, 36, 510–518. [Google Scholar] [CrossRef]
- Alam, M.S.; Nam, Y.-J.; Lee, D.-U. Synthesis and evaluation of (Z)-2,3-diphenylacrylonitrile analogs as anti-cancer and antimicrobial agents. Eur. J. Med. Chem. 2013, 69, 790–797. [Google Scholar] [CrossRef]
- Tarleton, M.; Gilbert, J.; Sakoff, J.A.; McCluskey, A. Cytotoxic 2-phenyacrylnitriles, the importance of the cyanide moiety and discovery of potent broad spectrum cytotoxic agents. Eur. J. Med. Chem. 2012, 57, 65–73. [Google Scholar] [CrossRef]
- Madadi, N.R.; Ketkar, A.; Penthala, N.R.; Bostian, A.C.L.; Eoff, R.L.; Crooks, P.A. Dioxol and dihydrodioxin analogs of 2- and 3-phenylacetonitriles as potent anti-cancer agents with nanomolar activity against a variety of human cancer cells. Bioorg. Med. Chem. Lett. 2016, 26, 2164–2169. [Google Scholar] [CrossRef]
- Tcherniuk, S.; Skoufias, D.A.; Labriere, C.; Rath, O.; Gueritte, F.; Guillou, C.; Kozielski, F. Relocation of aurora B and survivin from centromeres to the central spindle impaired by a kinesin-specific MKLP-2 inhibitor. Angew. Chem. Int. Ed. 2010, 49, 8228–8231. [Google Scholar] [CrossRef]
- Penthala, N.R.; Janganati, V.; Bommagani, S.; Crooks, P.A. Synthesis and evaluation of a series of quinolinyl trans-cyanostilbene analogs as anticancer agents. Med. Chem. Commun. 2014, 5, 886–890. [Google Scholar] [CrossRef]
- Tarleton, M.; Gilbert, J.; Robertson, M.J.; McCluskey, A.; Sakoff, J.A. Library synthesis and cytotoxicity of a family of 2-phenylacrylonitriles and discovery of an estrogen dependent breast cancer lead compound. Med. Chem. Commun. 2011, 2, 31–37. [Google Scholar] [CrossRef]
- Carta, A.; Briguglio, I.; Piras, S.; Boatto, G.; La Colla, P.; Loddo, R.; Tolomeno, M.; Grimaudo, S.; Di Cristina, A.; Pipitone, R.M.; et al. 3-Aryl-2-[1H-benzotriazol-1-yl]acrylonitriles: A novel class of potent tubulin inhibitors. Eur. J. Med. Chem. 2011, 46, 4151–4167. [Google Scholar] [CrossRef] [PubMed]
- Schaller, E.; Ma, A.; Gosch, L.C.; Klefenz, A.; Schaller, D.; Goehringer, N.; Kaps, L.; Schuppan, D.; Volkamer, A.; Schobert, R.; et al. New 3-aryl-2-(2-thienyl)acrylonitriles with high activity against hepatoma cells. Int. J. Mol. Sci. 2021, 22, 2243. [Google Scholar] [CrossRef]
- Biersack, B.; Zoldakova, M.; Effenberger, K.; Schobert, R. (Arene)Ru(II) complexes of epidermal growth factor receptor inhibiting tyrphostins with enhanced selectivity and cytotoxicity in cancer cells. Eur. J. Med. Chem. 2010, 45, 1972–1975. [Google Scholar] [CrossRef]
- Galanski, M.; Keppler, B.K. Tumorhemmende Metallverbindungen: Entwicklung, Bedeutung und Perspektiven. Pharm. Unserer Zeit 2006, 35, 118–123. [Google Scholar] [CrossRef] [PubMed]
- Sava, G.; Gagliardi, R.; Bergamo, A.; Alessio, E.; Mestroni, G. Treatment of metastases of solid mouse tumours by NAMI-A: Comparison with cisplatin, cyclophosphamide and dacarbazine. Anticancer Res. 1999, 19, 969–972. [Google Scholar]
- Alessio, E.; Messori, L. NAMI-A and KP1019/1339, two iconic ruthenium anticancer drug candidates face-to-face: A case story in medicinal inorganic chemistry. Molecules 2019, 24, 1995. [Google Scholar] [CrossRef]
- Zava, O.; Zakeeruddin, S.M.; Danelon, C.; Vogel, H.; Grätzel, M.; Dyson, P.J. A cytotoxic ruthenium tris(bipyridyl) complex that accumulates in plasma membranes. ChemBioChem 2009, 10, 1796–1800. [Google Scholar] [CrossRef]
- Scolaro, C.; Bergamo, A.; Brescacin, L.; Delfino, R.; Cocchietto, M.; Laurenczy, G.; Geldbach, T.J.; Sava, G.; Dyson, P.J. In vitro and in vivo evaluation of ruthenium(II)-arene PTA complexes. J. Med. Chem. 2005, 48, 4161–4171. [Google Scholar] [CrossRef] [PubMed]
- Morris, R.E.; Aird, R.E.; del Socorro Murdoch, P.; Chen, H.; Cummings, J.; Hughes, N.D.; Parsons, S.; Parkin, A.; Boyd, G.; Jodrell, D.I.; et al. Inhibition of cancer cell growth by ruthenium(II) arene complexes. J. Med. Chem. 2001, 44, 3616–3621. [Google Scholar] [CrossRef]
- Ang, W.H.; de Luca, A.; Chapuis-Bernasconi, C.; Juillerat-Jeanneret, L.; Lo Bello, M.; Dyson, P.J. Organometallic ruthenium inhibitors of glutathione-S-transferase P1-1 as anticancer drugs. ChemMedChem 2007, 2, 1799–1806. [Google Scholar] [CrossRef] [PubMed]
- Vock, C.A.; Ang, W.H.; Scolaro, C.; Phillips, A.D.; Lagopoulos, L.; Juillerat-Jeanneret, L.; Sava, G.; Scopelliti, R.; Dyson, P.J. Development of ruthenium antitumor drugs that overcome multidrug resistance mechanisms. J. Med. Chem. 2007, 50, 2166–2175. [Google Scholar] [CrossRef]
- Oehninger, L.; Stefanopoulou, M.; Alborzina, H.; Schur, J.; Ludewig, S.; Namikawa, K.; Munoz-Castro, A.; Köster, R.W.; Baumann, K.; Wölfl, S.; et al. Evaluation of arene ruthenium(II) N-heterocyclic carbene complexes as organometallics interacting with thiol and selenol containing biomolecules. Dalton Trans. 2013, 42, 1657–1666. [Google Scholar] [CrossRef] [PubMed]
- Hackenberg, F.; Müller-Bunz, H.; Smith, R.; Streciwilk, W.; Zhu, X.; Tacke, M. Novel ruthenium(II) and gold(I) NHC complexes: Synthesis, characterization, and evaluation of their anticancer properties. Organometallics 2013, 32, 5551–5560. [Google Scholar] [CrossRef]
- Oberhoff, C.; Kieback, D.G.; Würstlein, R.; Deertz, H.; Sehouli, J.; van Soest, C.; Hilfrich, J.; Mesrogli, M.; von Minckwitz, G.; Staab, H.J.; et al. Topotecan chemotherapy in patients with breast cancer and brain metastases: Results of a pilot study. Onkologie 2001, 24, 256–260. [Google Scholar] [CrossRef] [PubMed]
- Nakanishi, T.; Ross, D.D. Breast cancer resistance protein (BCRP/ABCG2): Its role in multidrug resistance and regulation of its gene expression. Chin. J. Cancer 2012, 31, 73–99. [Google Scholar] [CrossRef]
- Dei, S.; Braconi, L.; Romanelli, M.N.; Teodori, E. Recent advances in the search of BCRP- and dual P-gp/BCRP-based multidrug resistance modulators. Cancer Drug. Resist. 2019, 2, 710–743. [Google Scholar] [CrossRef]
- Zhang, Y.-K.; Zhang, X.-Y.; Zhang, G.-N.; Wang, Y.-J.; Xu, H.; Zhang, D.; Shukla, S.; Liu, L.; Yang, D.-H.; Ambudkar, S.V.; et al. Selective reversal of BCRP-mediated MDR by VEGFR-2 inhibitor ZM323881. Biochem. Pharmacol. 2017, 132, 29–37. [Google Scholar] [CrossRef]
- Zhang, Y.-K.; Wang, Y.-J.; Lei, Z.-N.; Zhang, G.-N.; Zhang, X.-Y.; Wang, D.; Al-Rihani, S.B.; Shukla, S.; Ambudkar, S.V.; Kaddoumi, A.; et al. Regorafenib antagonizes BCRP-mediated multidrug resistance in colon cancer. Cancer Lett. 2019, 442, 104–112. [Google Scholar] [CrossRef]
- Vassilev, L.T.; Vu, B.T.; Graves, B.; Carvajal, D.; Podlaski, F.; Filipovic, Z.; Kong, N.; Kammlott, U.; Lukacs, C.; Klein, C.; et al. In vivo activation of the p53 pathway by small-molecule antagonists of MDM2. Science 2004, 303, 844–848. [Google Scholar] [CrossRef]
- Czarna, A.; Beck, B.; Srivastava, S.; Popowicz, G.M.; Wolf, S.; Huang, Y.; Bista, M.; Holak, T.A.; Dömling, A. Robust generation of lead compounds for protein-protein interactions by computational and MCR chemistry: p53/Hdm2 antagonists. Angew. Chem. Int. Ed. 2010, 49, 5352–5356. [Google Scholar] [CrossRef]
- Liebl, M.C.; Hofmann, T.G. The role of p53 signaling in colorectal cancer. Cancers 2021, 13, 2125. [Google Scholar] [CrossRef]
- Deben, C.; Boullosa, L.F.; Domen, A.; Wouters, A.; Cuypers, B.; Laukens, K.; Lardon, F.; Pauwels, P. Characterization of acquired nutlin-3 resistant non-small cell lung cancer cells. Cancer Drug Resist. 2021, 4, 233–243. [Google Scholar] [CrossRef]
- Ma, A.; Biersack, B.; Goehringer, N.; Nitzsche, B.; Höpfner, M. Novel thienyl-based tyrosine kinase inhibitors for the treatment of hepatocellular carcinoma. J. Pers. Med. 2022, 12, 738. [Google Scholar] [CrossRef]
- Hayashi, Y.; Tsujii, M.; Kodama, T.; Akasaka, T.; Kondo, J.; Hikita, H.; Inoue, T.; Tsujii, Y.; Maekawa, A.; Yoshii, S.; et al. p53 functional deficiency in human colon cancer cells promotes fibroblast-mediated angiogenesis and tumor growth. Carcinogenesis 2016, 37, 972–984. [Google Scholar] [CrossRef]
- Wheler, J.J.; Janku, F.; Naing, A.; Li, Y.; Stephen, B.; Zinner, R.; Subhiah, V.; Fu, S.; Karp, D.; Falchook, G.S.; et al. TP53 alterations correlate with response to VEGF/VEGFR inhibitors: Implications for targeted therapeutics. Mol. Cancer Ther. 2016, 15, 2475–2485. [Google Scholar] [CrossRef]
- Chen, L.; Meng, Y.; Guo, X.; Sheng, X.; Tai, G.; Zhang, F.; Cheng, H.; Zhou, Y. Gefitinib enhances human colon cancer cells to TRAIL-induced apoptosis via autophagy- and JNK-mediated death receptors upregulation. Apoptosis 2016, 21, 1291–1301. [Google Scholar] [CrossRef]
- Holoch, P.A.; Griffith, T.S. TNF-related apoptosis-inducing ligand (TRAIL): A new path to anti-cancer therapies. Eur. J. Pharmacol. 2009, 625, 63–72. [Google Scholar] [CrossRef]
- Taylor, W.R.; Stark, G.R. Regulation of the G2/M transition by p53. Oncogene 2001, 20, 1803–1815. [Google Scholar] [CrossRef]
- Jo, H.J.; Song, J.D.; Kim, K.M.; Cho, Y.H.; Kim, K.H.; Park, Y.C. Diallyl disulfide induces reversible G2/M phase arrest on a p53-independent mechanism in human colon cancer HCT-116 cells. Oncol. Rep. 2008, 19, 275–280. [Google Scholar] [CrossRef]
- Mitchell, J.K.; Midkiff, B.R.; Israelow, B.; Evans, M.J.; Lanford, R.E.; Walker, C.M.; Lemon, S.M.; McGivern, D.R. Hepatitis C virus indirectly disrupts DNA damage-induced p53 responses by activating protein kinase R. mBio 2017, 8, e00121-17. [Google Scholar] [CrossRef] [PubMed]
- Bressac, B.; Galvin, K.M.; Liang, T.J.; Isselbacher, K.J.; Wands, J.R.; Ozturk, M. Abnormal structure and expression of p53 gene in human hepatocellular carcinoma. Proc. Natl. Acad. Sci. USA 1990, 87, 1973–1977. [Google Scholar] [CrossRef] [PubMed]
- Hsu, I.C.; Tokiwa, T.; Bennett, W.; Metcalf, R.A.; Welsh, J.A.; Sun, T.; Harris, C.C. p53 gene mutation and integrated hepatitis B viral DNA sequences in human liver cancer cell lines. Carcinogenesis 1993, 14, 987–992. [Google Scholar] [CrossRef] [PubMed]
- Bagnolini, G.; Milano, D.; Manerba, M.; Schipani, F.; Ortega, J.A.; Gioia, D.; Falchi, F.; Balboni, A.; Farabegoli, F.; De Franco, F.; et al. Synthetic lethality in pancreatic cancer: Discovery of a new RAD51-BRCA2 small molecule disruptor that inhibits homologous recombination and synergizes with olaparib. J. Med. Chem. 2020, 63, 2588–2619. [Google Scholar] [CrossRef] [PubMed]
- Cheng, K.; Lee, J.-S.; Hao, P.; Yao, S.Q.; Ding, K.; Li, Z. Tetrazole-based probes for integrated phenotypic screening, affinity-based proteome profiling, and sensitive detection of a cancer biomarker. Angew. Chem. Int. Ed. 2017, 56, 15044–15048. [Google Scholar] [CrossRef] [PubMed]
- Landegren, U. Measurement of cell numbers by means of the endogenous enzyme hexosaminidase. Applications to detection of lymphokines and cell surface antigens. J. Immunol. Methods 1984, 67, 379–388. [Google Scholar] [CrossRef] [PubMed]
- Schmidt, J.; Kuzyniak, W.; Berkholz, J.; Steinemann, G.; Ogbodu, R.; Hoffmann, B.; Nouailles, G.; Gürek, A.; Nitzsche, B.; Höpfner, M. Novel zinc- and silicon-phthalocyanines as photosensitizers for photodynamic therapy of cholangiocarcinoma. Int. J. Mol. Med. 2018, 42, 534–546. [Google Scholar] [CrossRef]
- Lin, R.-Z.; Chang, H.-Y. Recent advances in three-dimensional multicellular spheroid culture for biomedical research. Biotechnol. J. 2008, 3, 1172–1184. [Google Scholar] [CrossRef]
- Carpentier, G.; Berndt, S.; Ferratge, S.; Rasband, W.; Cuendet, M.; Uzan, G.; Albanese, P. Angiogenesis Analyzer for ImageJ—A comparative morphometric analysis of “Endothelial Tube Formation Assay” and “Fibrin Bead Assay”. Sci. Rep. 2020, 10, 11568. [Google Scholar] [CrossRef]
- Trott, O.; Olson, A.J. AutoDock Vina: Improving the speed and accuracy of docking with a new scoring function, efficient optimization, and multithreading. J. Comput. Chem. 2010, 31, 455–461. [Google Scholar] [CrossRef]
- Stamos, J.; Sliwkowski, M.X.; Eigenbrot, C. Structure of the epidermal growth factor receptor kinase domain alone and in complexwith a 4-anilinoquinazoline inhibitor. J. Biol. Chem. 2002, 277, 46265–46272. [Google Scholar] [CrossRef] [PubMed]
- Hasegawa, M.; Nishigaki, N.; Washio, Y.; Kano, K.; Harris, P.A.; Sato, H.; Mori, I.; West, R.I.; Shibahara, M.; Toyoda, H.; et al. Discovery of novel benzimidazoles as potent inhibitors of TIE-2 and VEGFR-2 tyrosine kinase receptors. J. Med. Chem. 2007, 50, 4453–4470. [Google Scholar] [CrossRef] [PubMed]
- Alexander, N.; Woetzel, N.; Meiler, J. bcl::Cluster: A method for clustering biological molecules coupled with visualization in the Pymol Molecular Graphics System. In Proceedings of the 2011 IEEE 1st International Conference on Computational Advances in Bio and Medical Sciences (ICCABS), Orlando, FL, USA, 3–5 February 2011; pp. 13–18. [Google Scholar]


| Compound | HCT-116 wt | HCT-116 p53-Negative | MCF-7 |
|---|---|---|---|
| 2a | 3.0 ± 0.2 | 0.9 ± 0.2 | 1.7 ± 0.2 |
| 2b | 0.4 ± 0.1 | 0.6 ± 0.1 | 2.6 ± 0.6 |
| 2c | 7.7 ± 0.3 | 6.1 ± 0.5 | 8.4 ± 0.7 |
| 2d | >50 | >50 | >50 |
| 2e | >50 | >50 | >50 |
| 3a | 0.02 ± 0.003 | 1.7 ± 0.6 | 0.5 ± 0.7 |
| 3b | 4.0 ± 0.6 | 1.7 ± 0.6 | 2.7 ± 0.4 |
| 3c | >50 | >50 | 3.2 ± 0.5 |
| 3d | >50 | >50 | >50 |
| 3e | >50 | >50 | >50 |
| Sorafenib | 10 ± 1.8 | 7.7 ± 0.7 | 9.1 ± 1.1 |
| Gefitinib | >50 | 17.8 ± 3.7 | 21.1 ± 9.4 |
| NAMI-A | >50 | >50 | >50 |
| Cell Line | 2a | 2b | 3a | Sorafenib | Gefitinib |
|---|---|---|---|---|---|
| MCF-7/Topo | 0.18 ± 0.09 | 1.5 ± 0.1 | 0.10 ± 0.02 | 7.4 ± 0.4 | 27.6 ± 2.4 |
| 518A2 | 1.4 ± 0.6 | 2.8 ± 0.3 | 0.6 ± 0.1 | 9.7 ± 2.1 | 27.5 ± 1.6 |
| EaHy.926 | 1.3 ± 0.2 | 0.9 ± 0.1 | 1.9 ± 0.2 | 12.8 ± 0.2 | 9.9 ± 2.9 |
| Huh-7 | 0.04 ± 0.01 | - | 0.01 ± 0.001 | 0.9 ± 0.08 | >50 |
| FLO-1 | 1.2 ± 0.2 | >40 | 2.5 ± 0.3 | - | - |
| SK-GT-4 | >40 | >40 | >40 | - | - |
| Protein | Compound | B.E. (kcal/mol) | H Bonds | Distance (Å) | Amino Acid (s) |
|---|---|---|---|---|---|
| EGFR | 2a | −8.2 | 1 | 3.3 | MET769 |
| 2b | −7.7 | 2 | 3.3 3.3 | GLU738 ASP831 | |
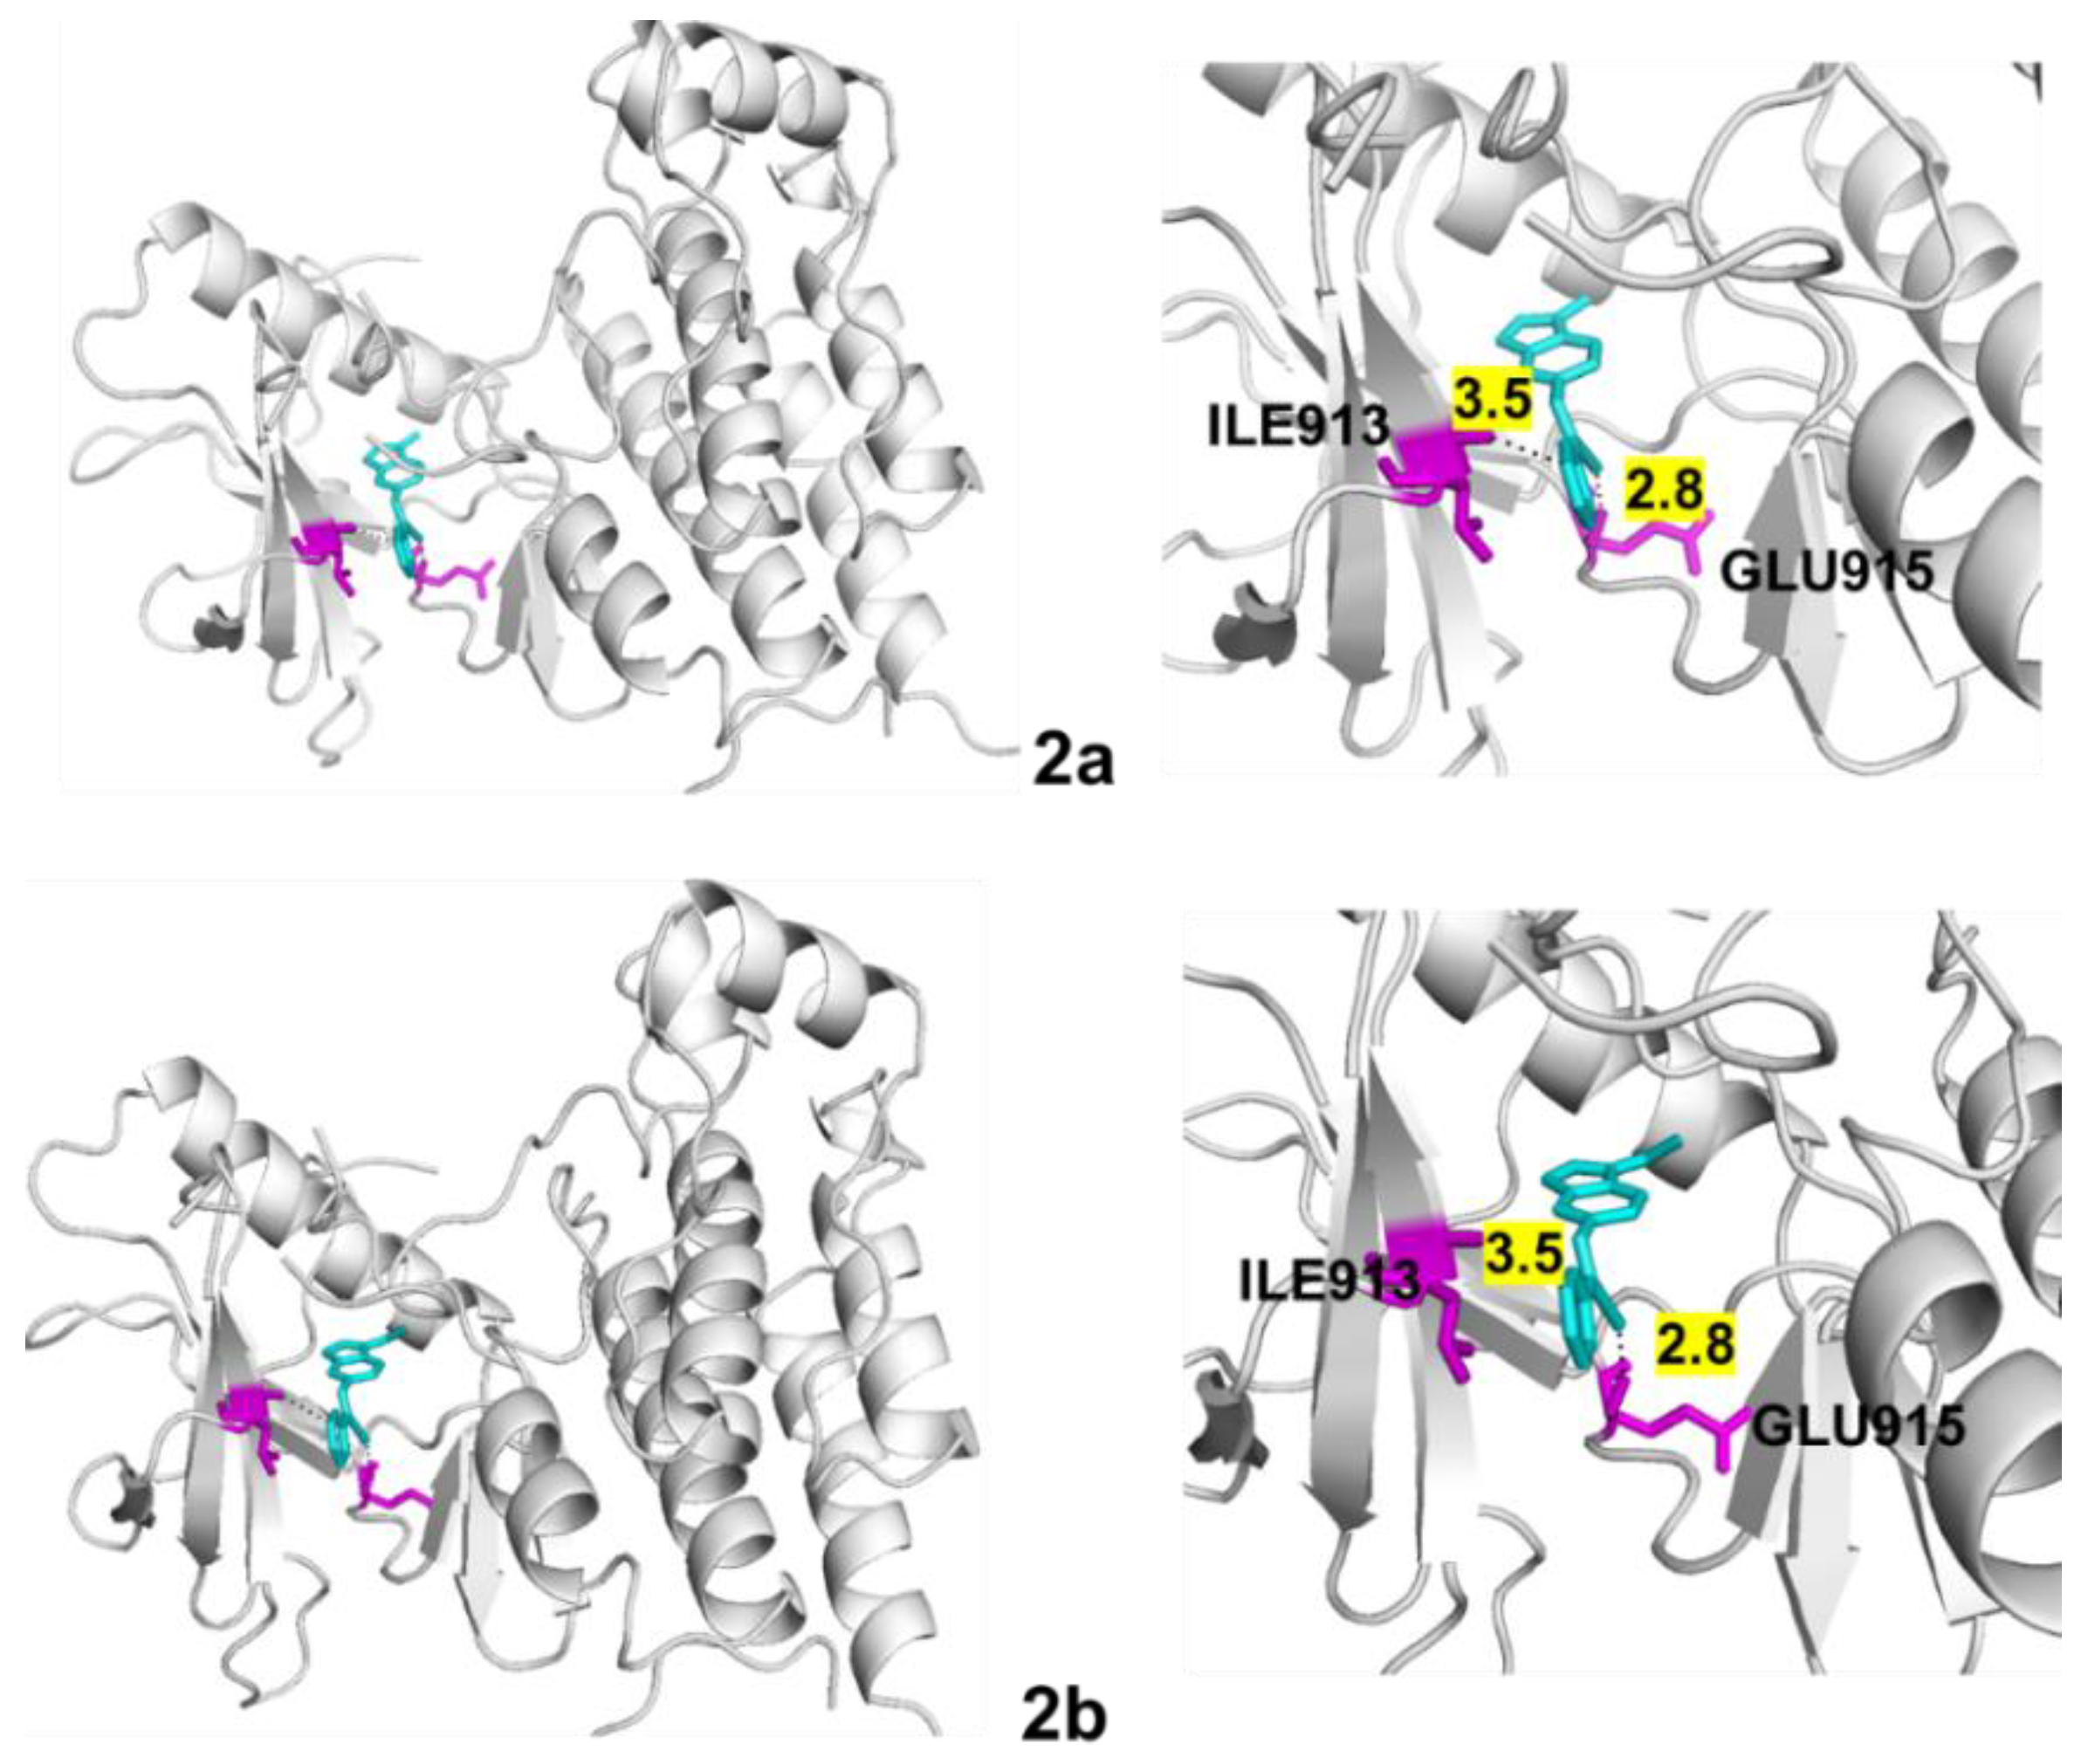
| VEGFR-2 | 2a | −9.5 | 2 | 2.8 3.5 | ILE913 GLU915 |
| 2b | −9.5 | 2 | 2.8 3.5 | ILE913 GLU915 |
Disclaimer/Publisher’s Note: The statements, opinions and data contained in all publications are solely those of the individual author(s) and contributor(s) and not of MDPI and/or the editor(s). MDPI and/or the editor(s) disclaim responsibility for any injury to people or property resulting from any ideas, methods, instructions or products referred to in the content. |
© 2023 by the authors. Licensee MDPI, Basel, Switzerland. This article is an open access article distributed under the terms and conditions of the Creative Commons Attribution (CC BY) license (https://creativecommons.org/licenses/by/4.0/).
Share and Cite
Oberhuber, N.; Ghosh, H.; Nitzsche, B.; Dandawate, P.; Höpfner, M.; Schobert, R.; Biersack, B. Synthesis and Anticancer Evaluation of New Indole-Based Tyrphostin Derivatives and Their (p-Cymene)dichloridoruthenium(II) Complexes. Int. J. Mol. Sci. 2023, 24, 854. https://doi.org/10.3390/ijms24010854
Oberhuber N, Ghosh H, Nitzsche B, Dandawate P, Höpfner M, Schobert R, Biersack B. Synthesis and Anticancer Evaluation of New Indole-Based Tyrphostin Derivatives and Their (p-Cymene)dichloridoruthenium(II) Complexes. International Journal of Molecular Sciences. 2023; 24(1):854. https://doi.org/10.3390/ijms24010854
Chicago/Turabian StyleOberhuber, Natalie, Hindole Ghosh, Bianca Nitzsche, Prasad Dandawate, Michael Höpfner, Rainer Schobert, and Bernhard Biersack. 2023. "Synthesis and Anticancer Evaluation of New Indole-Based Tyrphostin Derivatives and Their (p-Cymene)dichloridoruthenium(II) Complexes" International Journal of Molecular Sciences 24, no. 1: 854. https://doi.org/10.3390/ijms24010854
APA StyleOberhuber, N., Ghosh, H., Nitzsche, B., Dandawate, P., Höpfner, M., Schobert, R., & Biersack, B. (2023). Synthesis and Anticancer Evaluation of New Indole-Based Tyrphostin Derivatives and Their (p-Cymene)dichloridoruthenium(II) Complexes. International Journal of Molecular Sciences, 24(1), 854. https://doi.org/10.3390/ijms24010854