
Reovirus μ2 Protein Impairs Translation to Reduce U5 snRNP Protein Levels

 ,
,  and
and 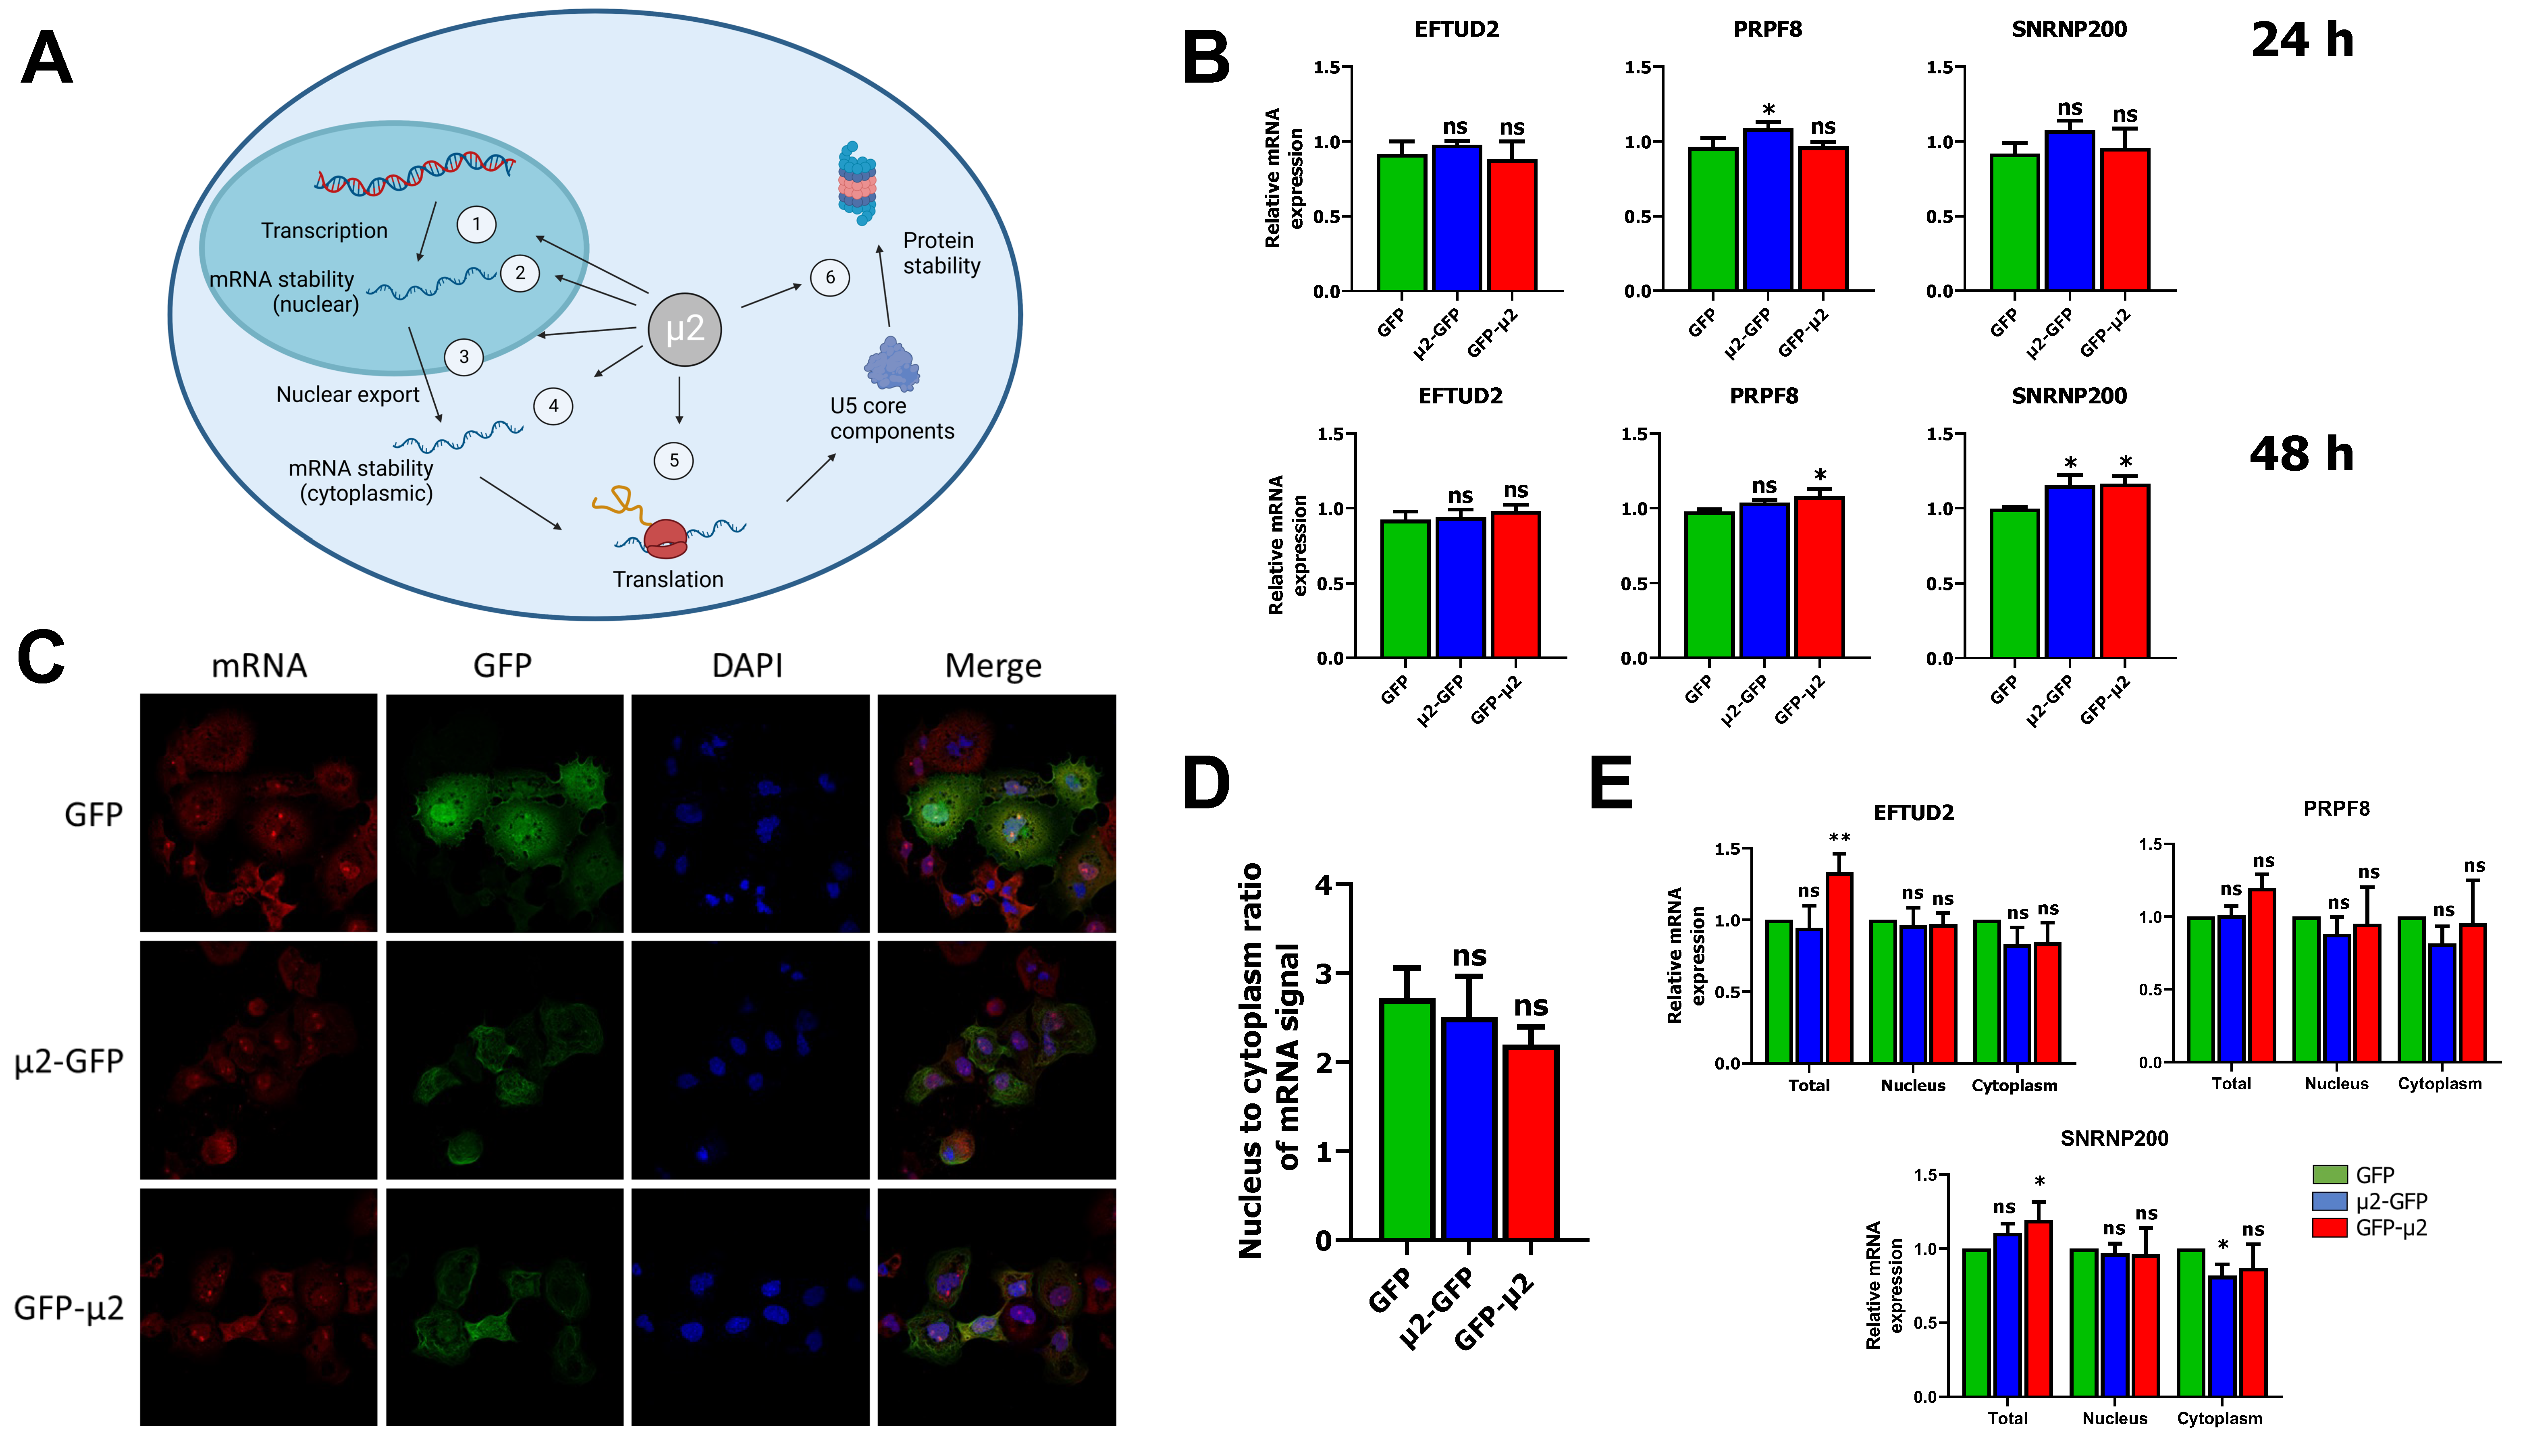
Abstract
1. Introduction
2. Results
2.1. The μ2 Protein Does Not Impact EFTUD2, PRPF8, and SNRNP200 mRNA Levels or Nuclear Export
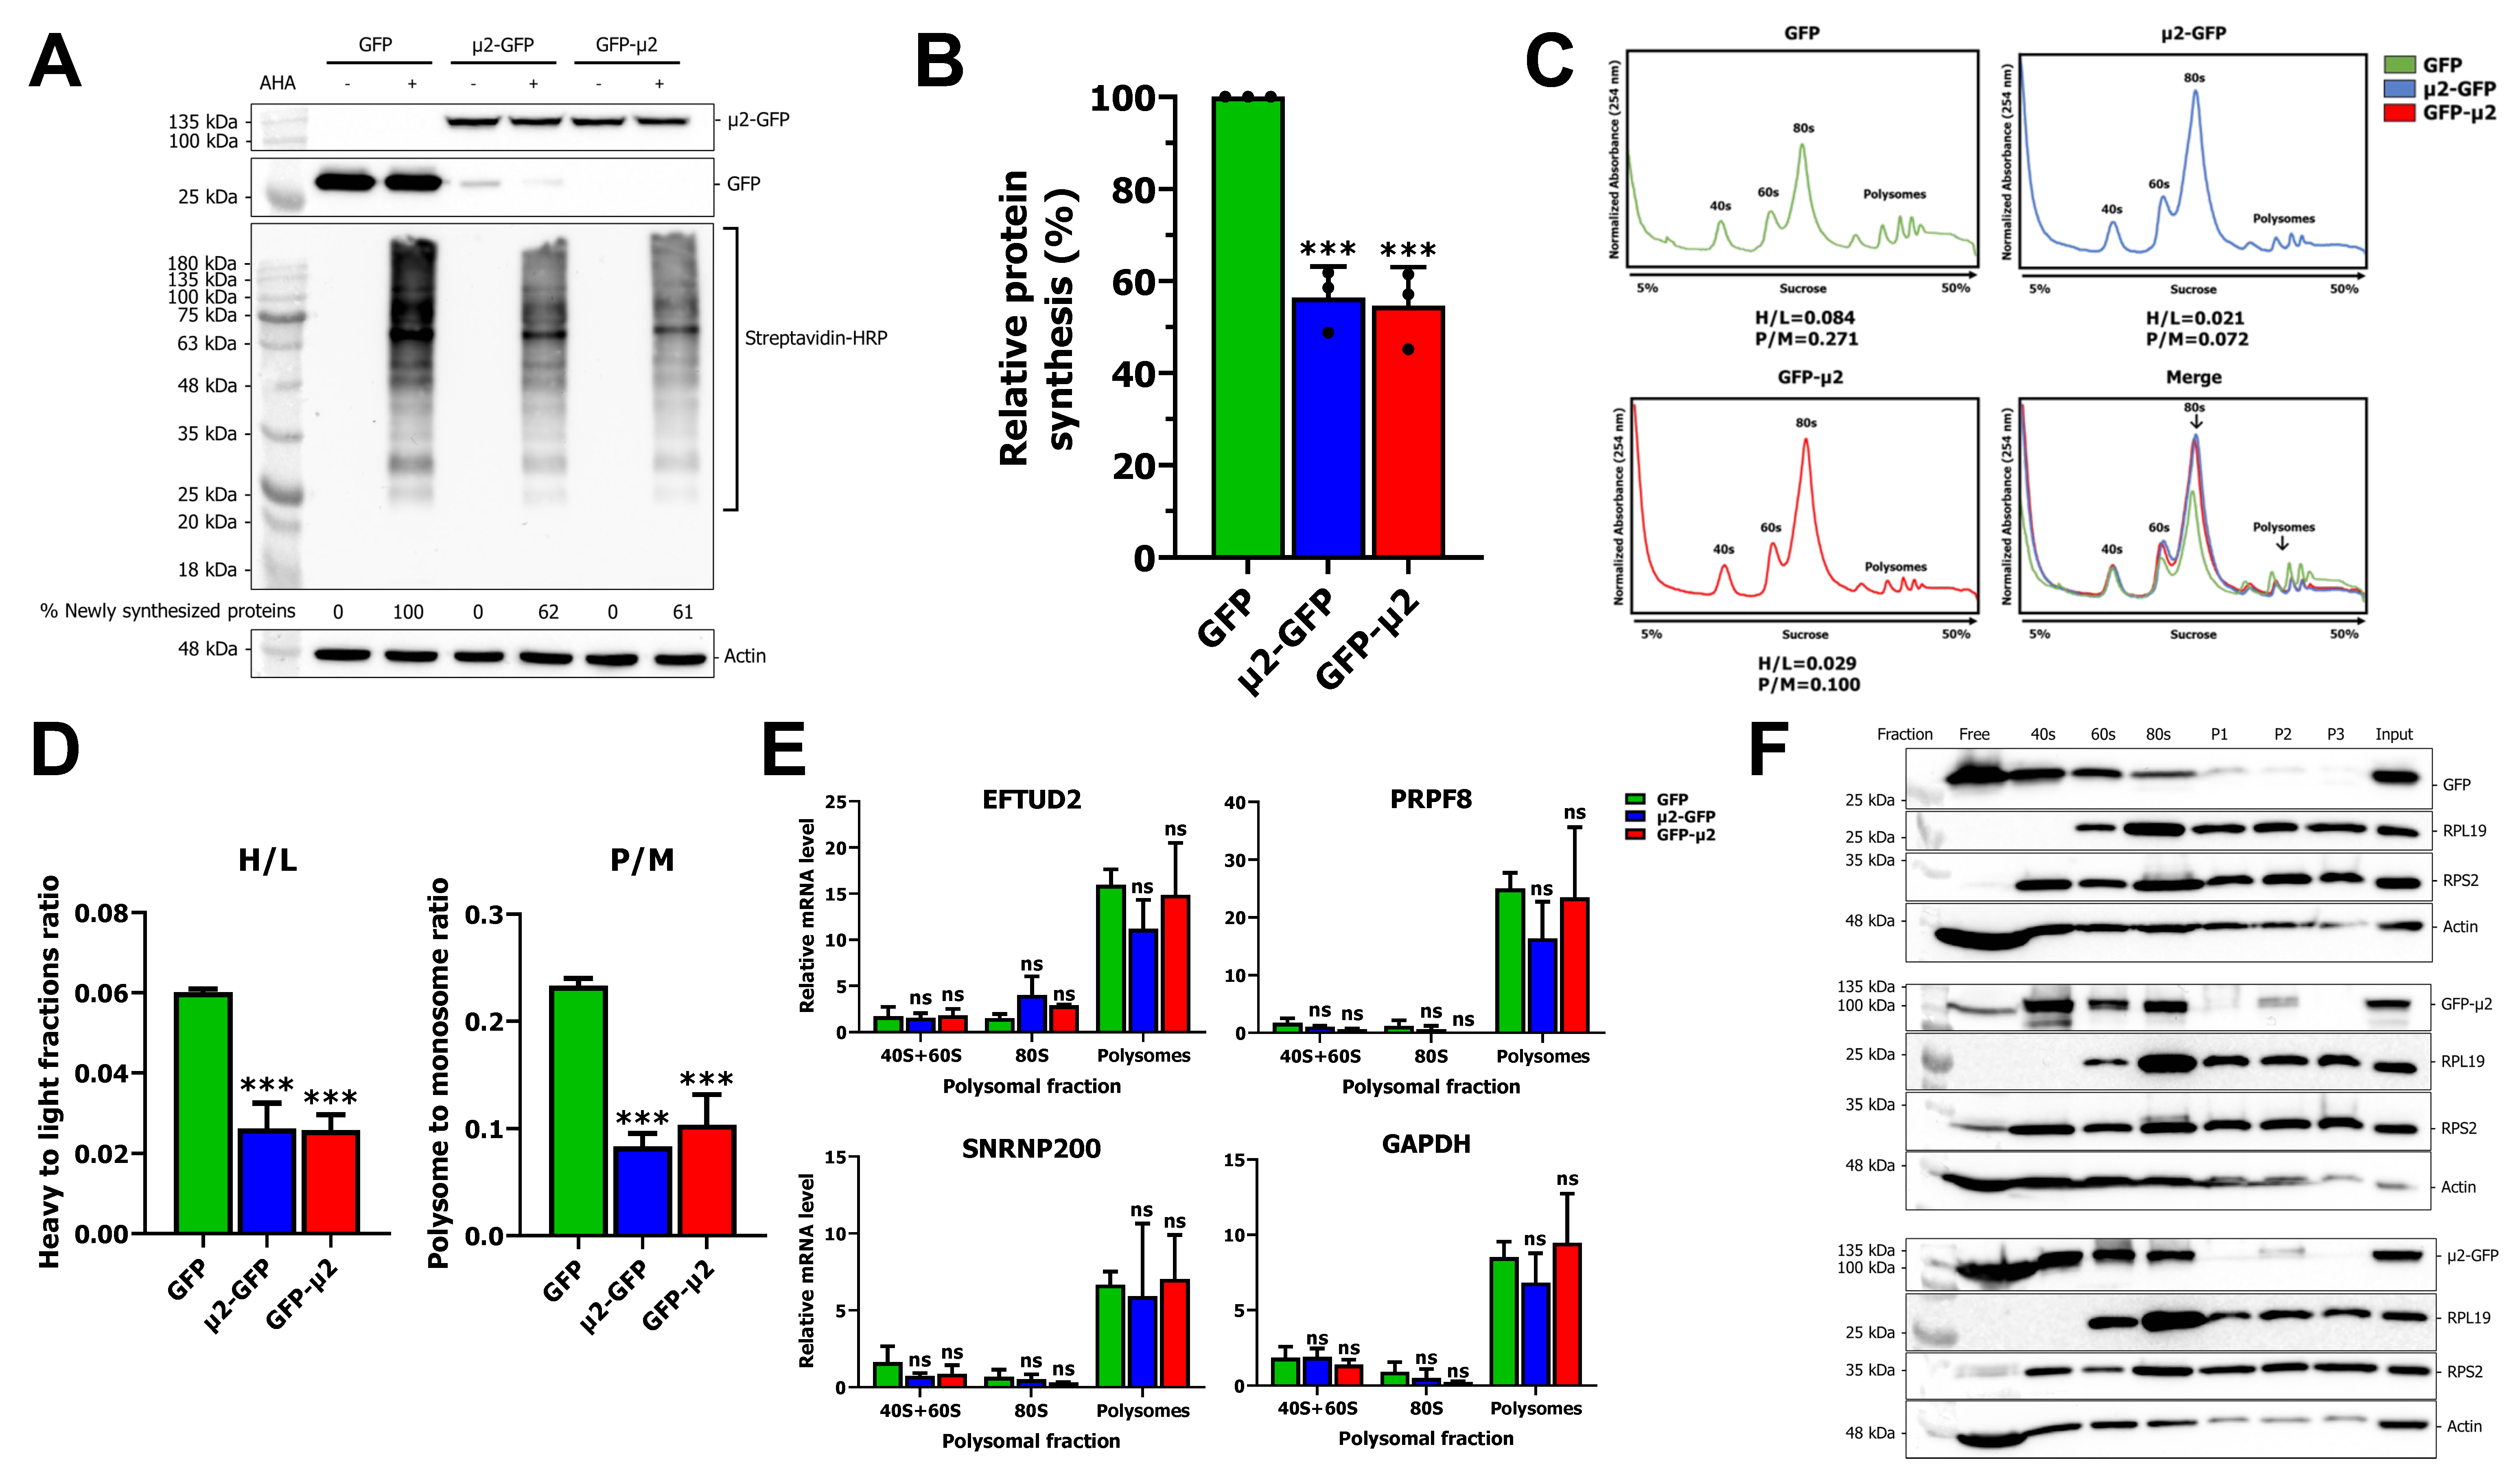
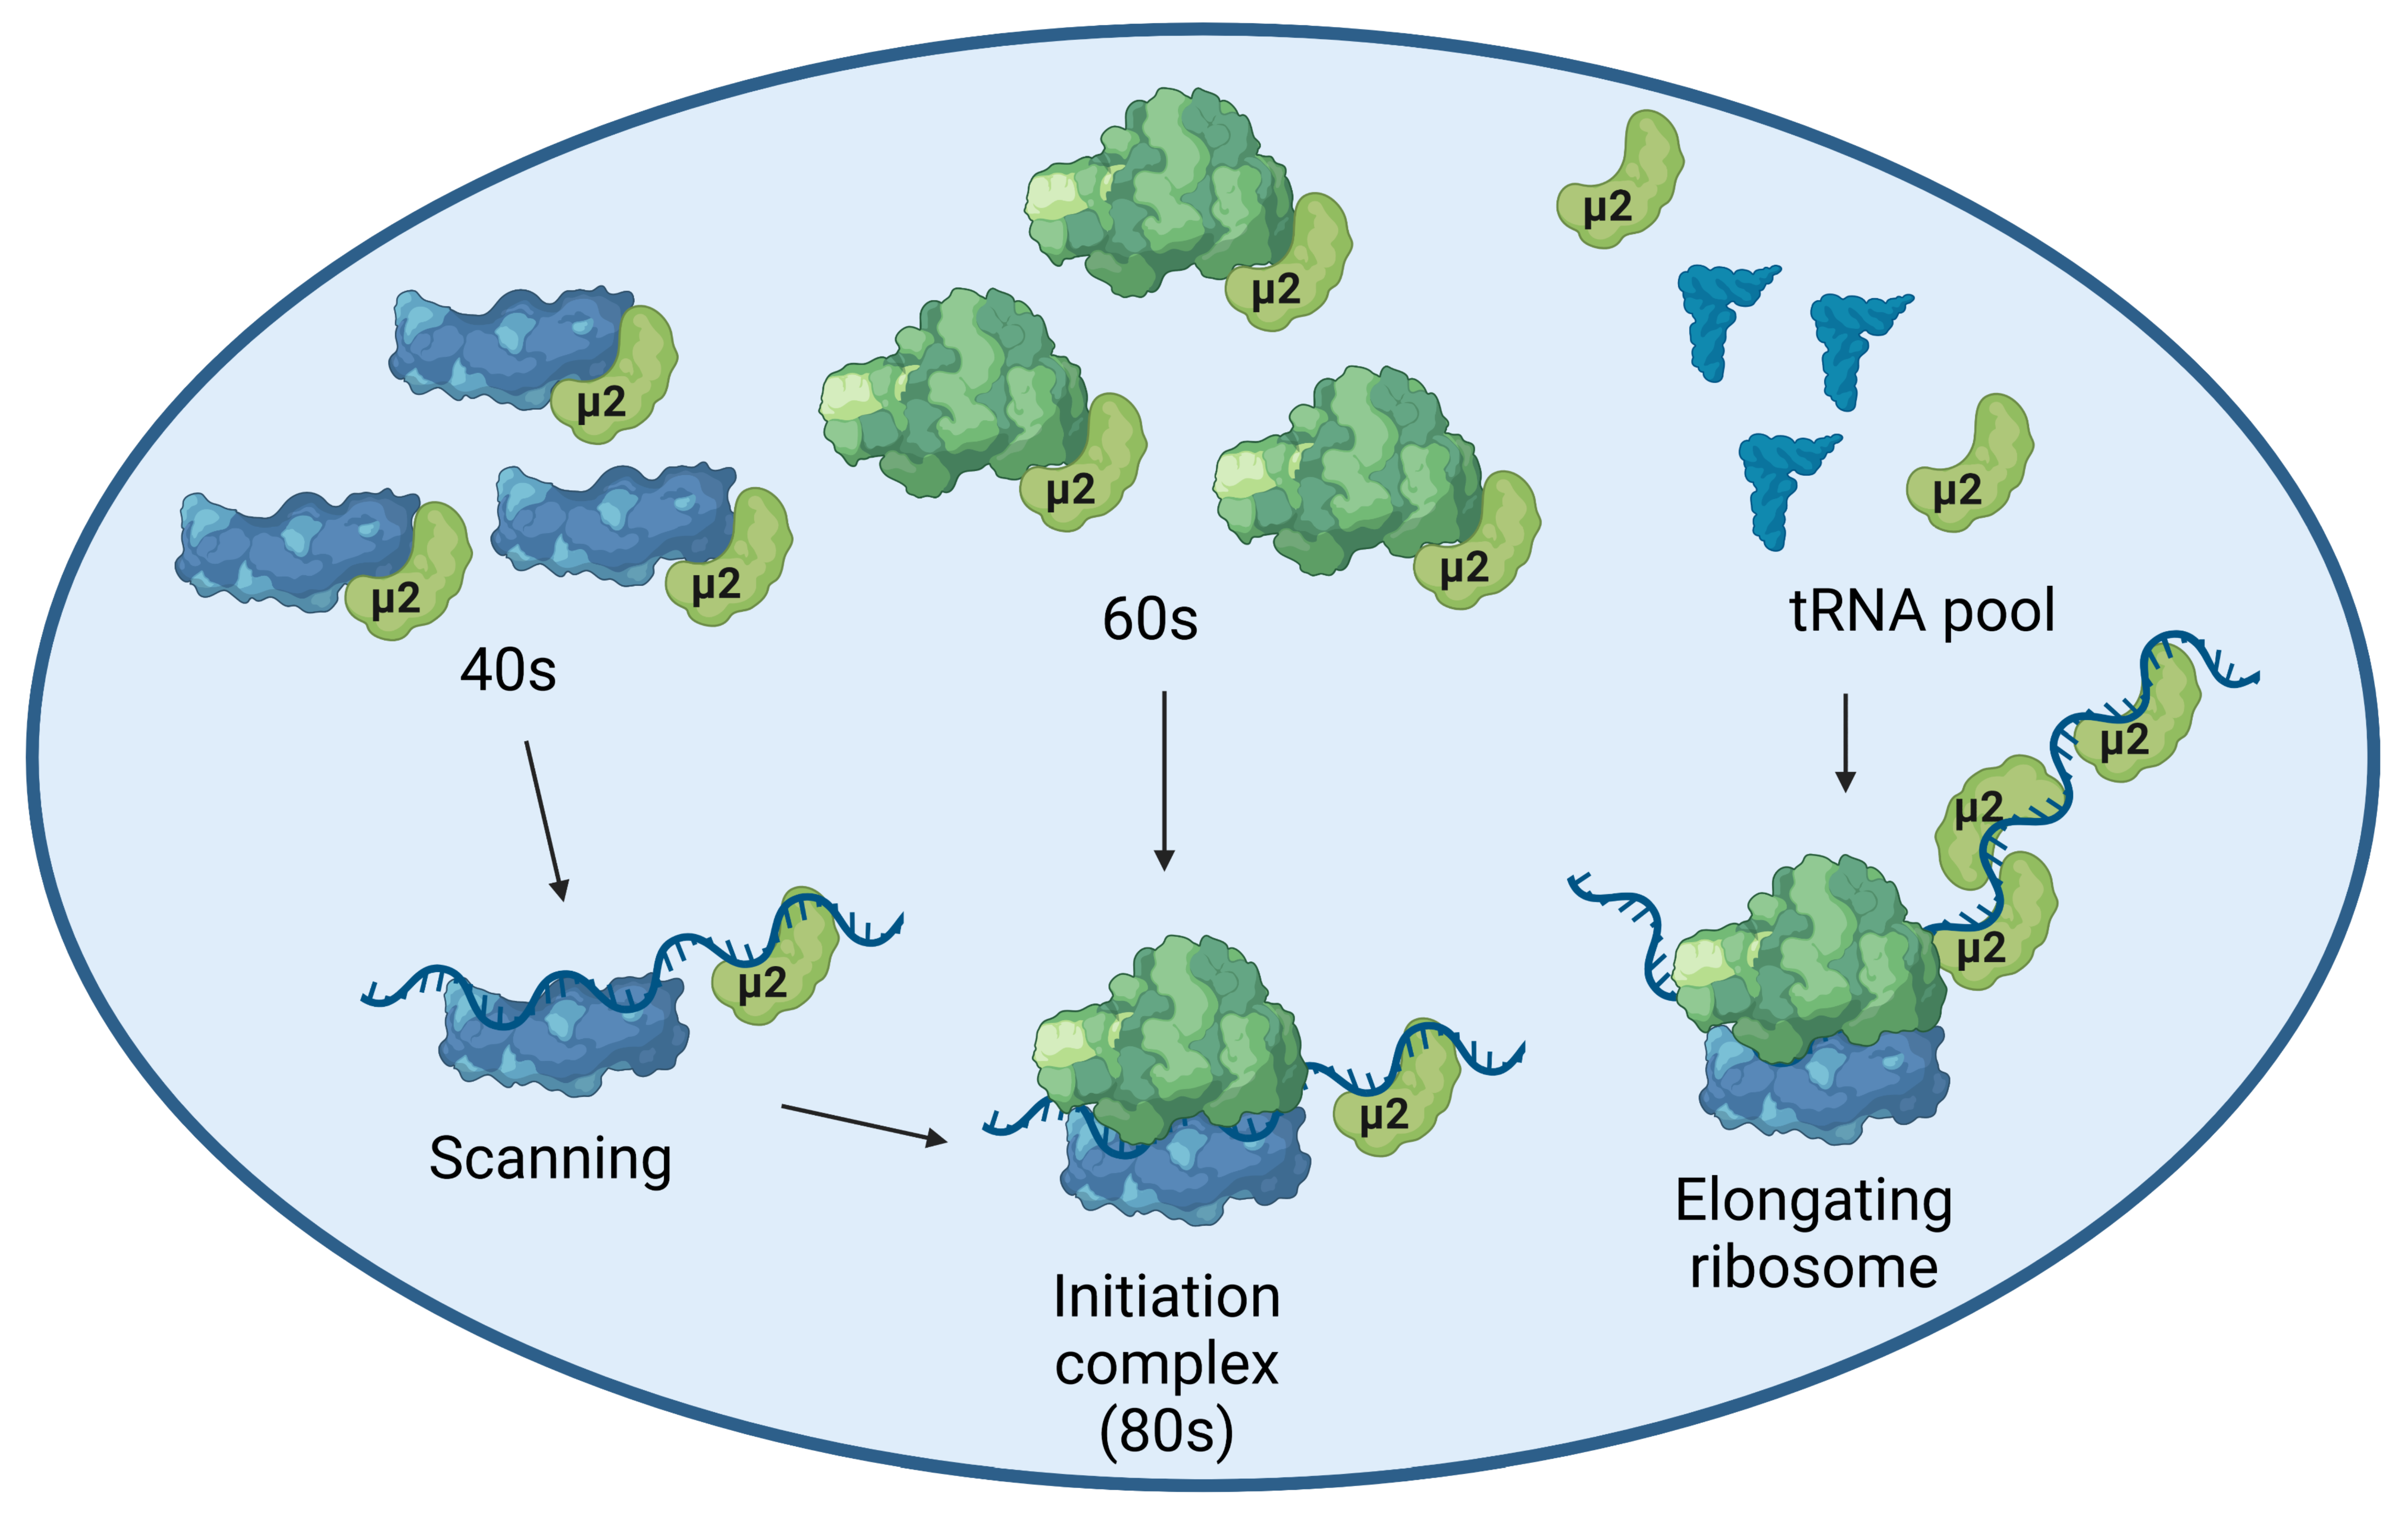
2.2. The μ2 Protein Impairs mRNA Translation
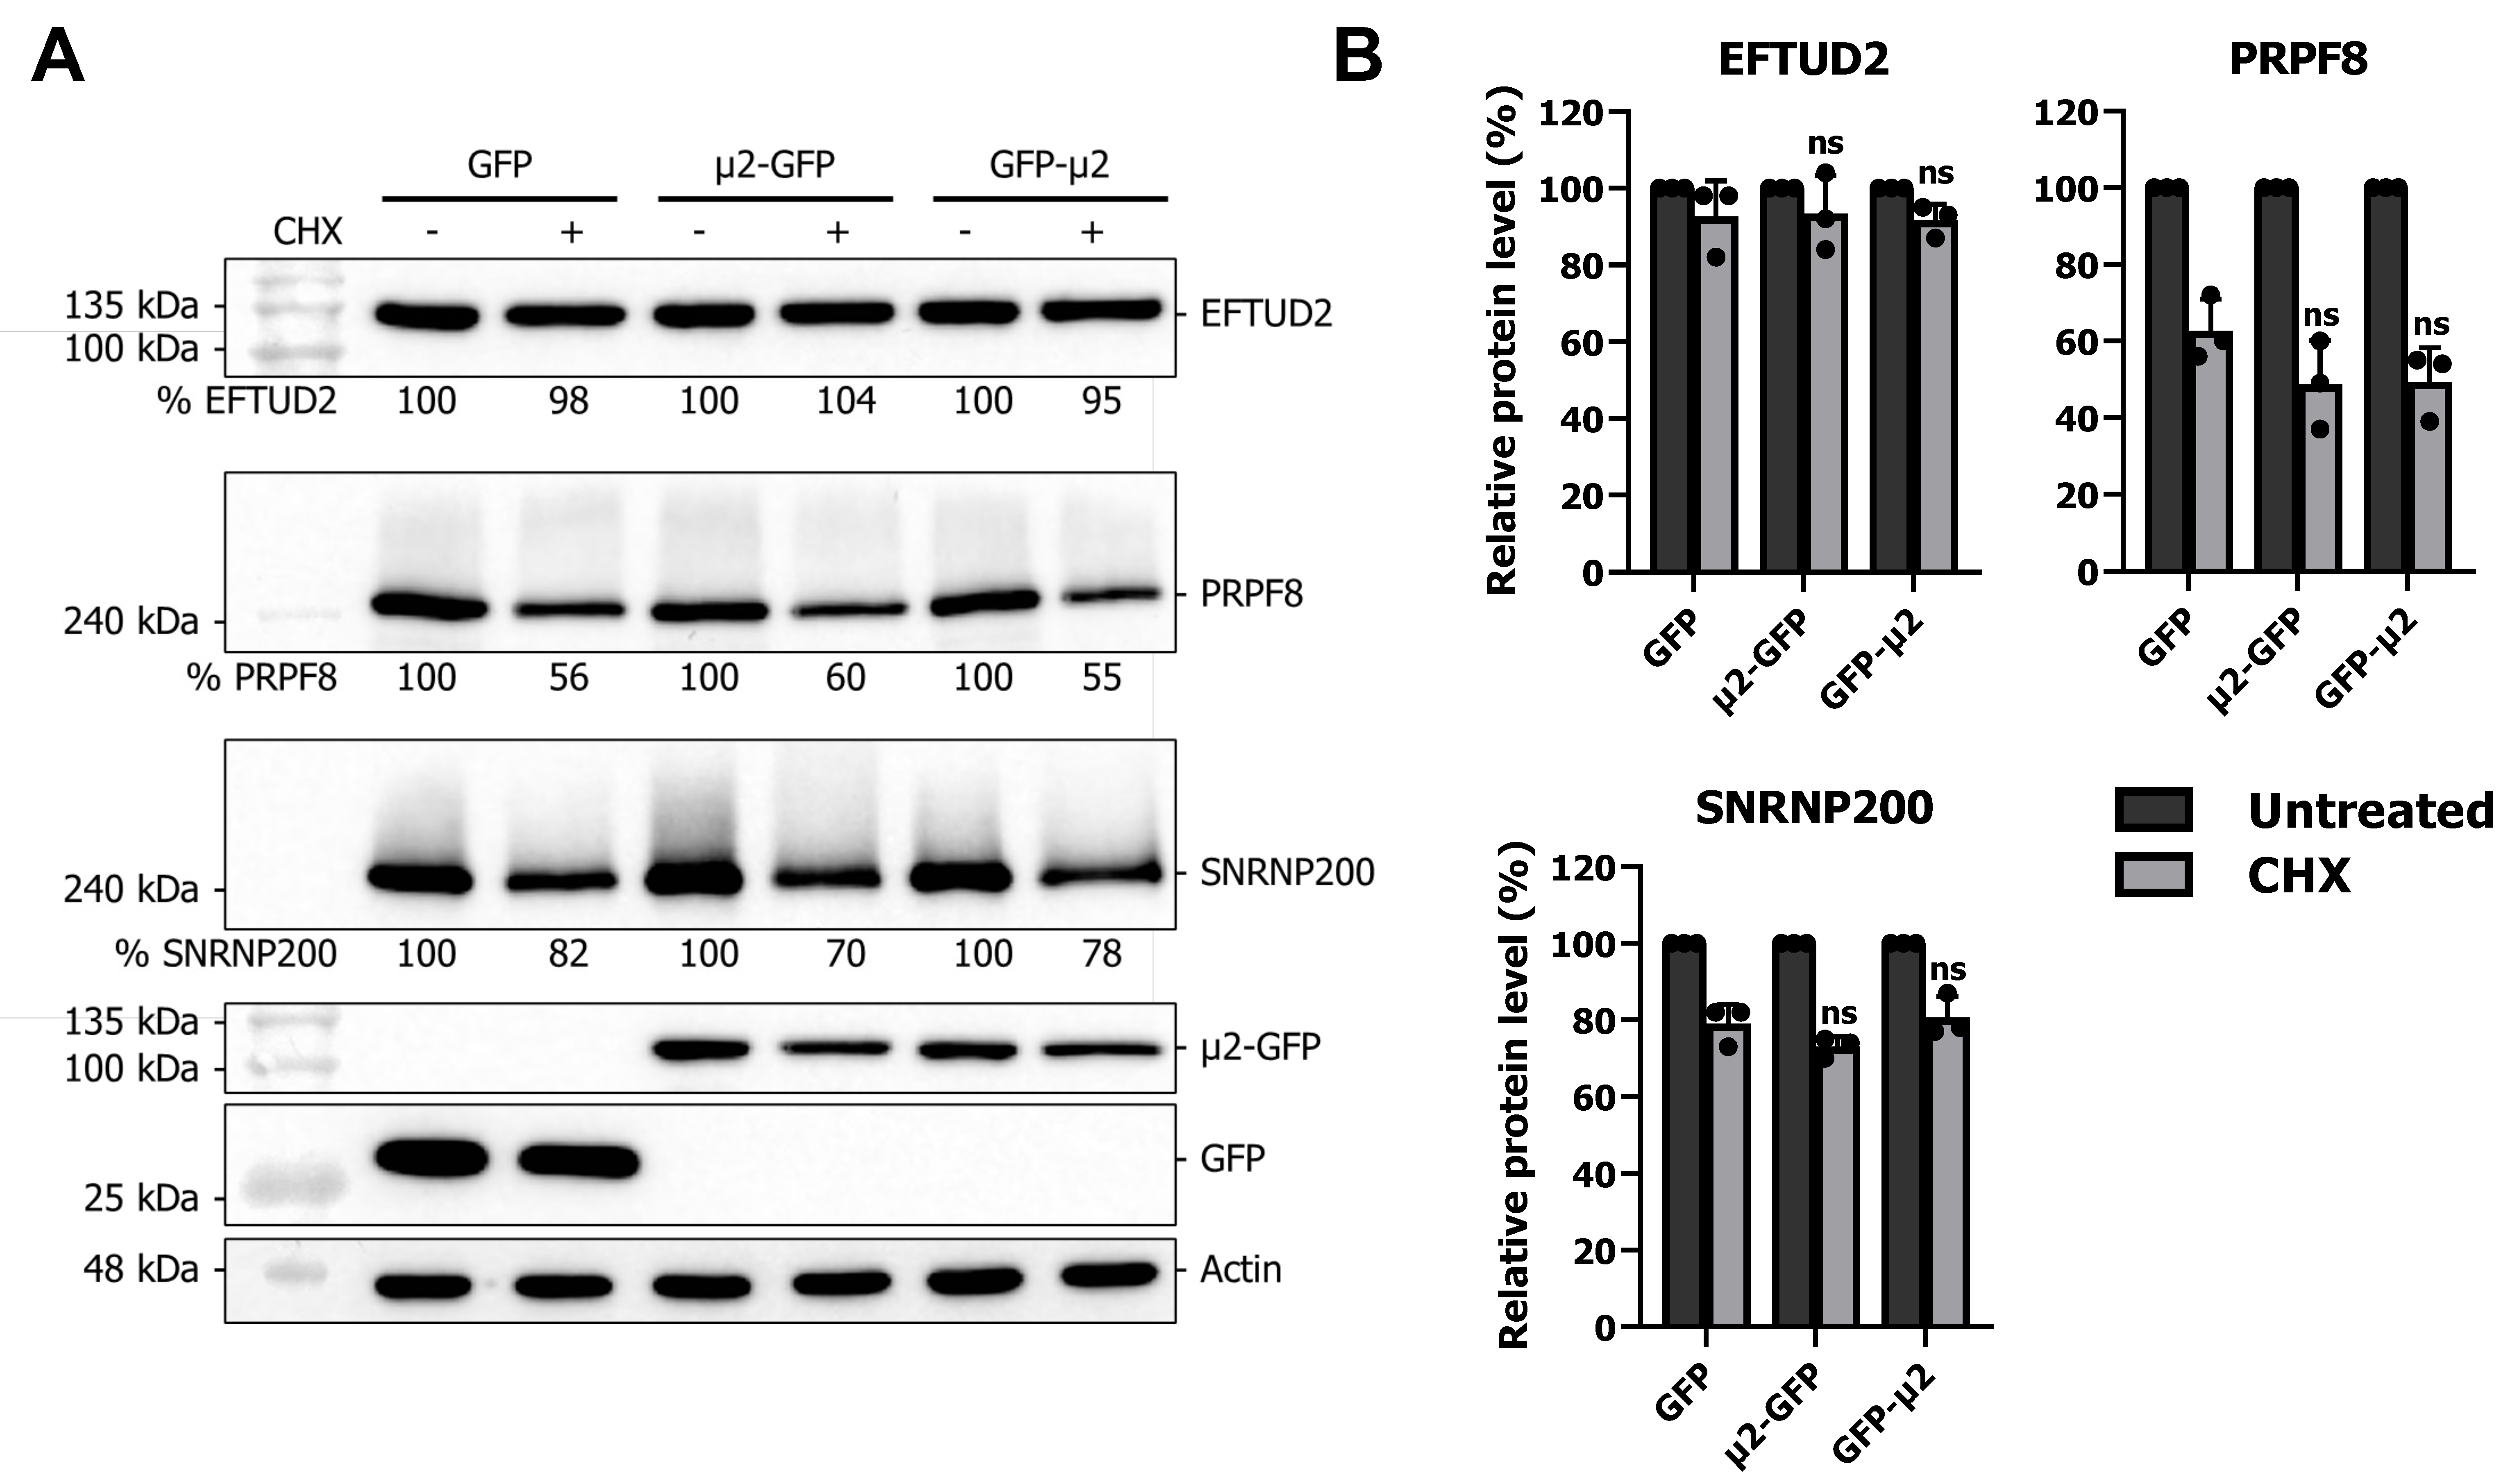
2.3. The μ2 Protein Does Not Affect EFTUD2, PRPF8, and SNRNP200 Protein Degradation
2.4. The Nuclear Localization of μ2 Is Mainly Dispensable for Its Effect on U5 snRNP Protein Levels
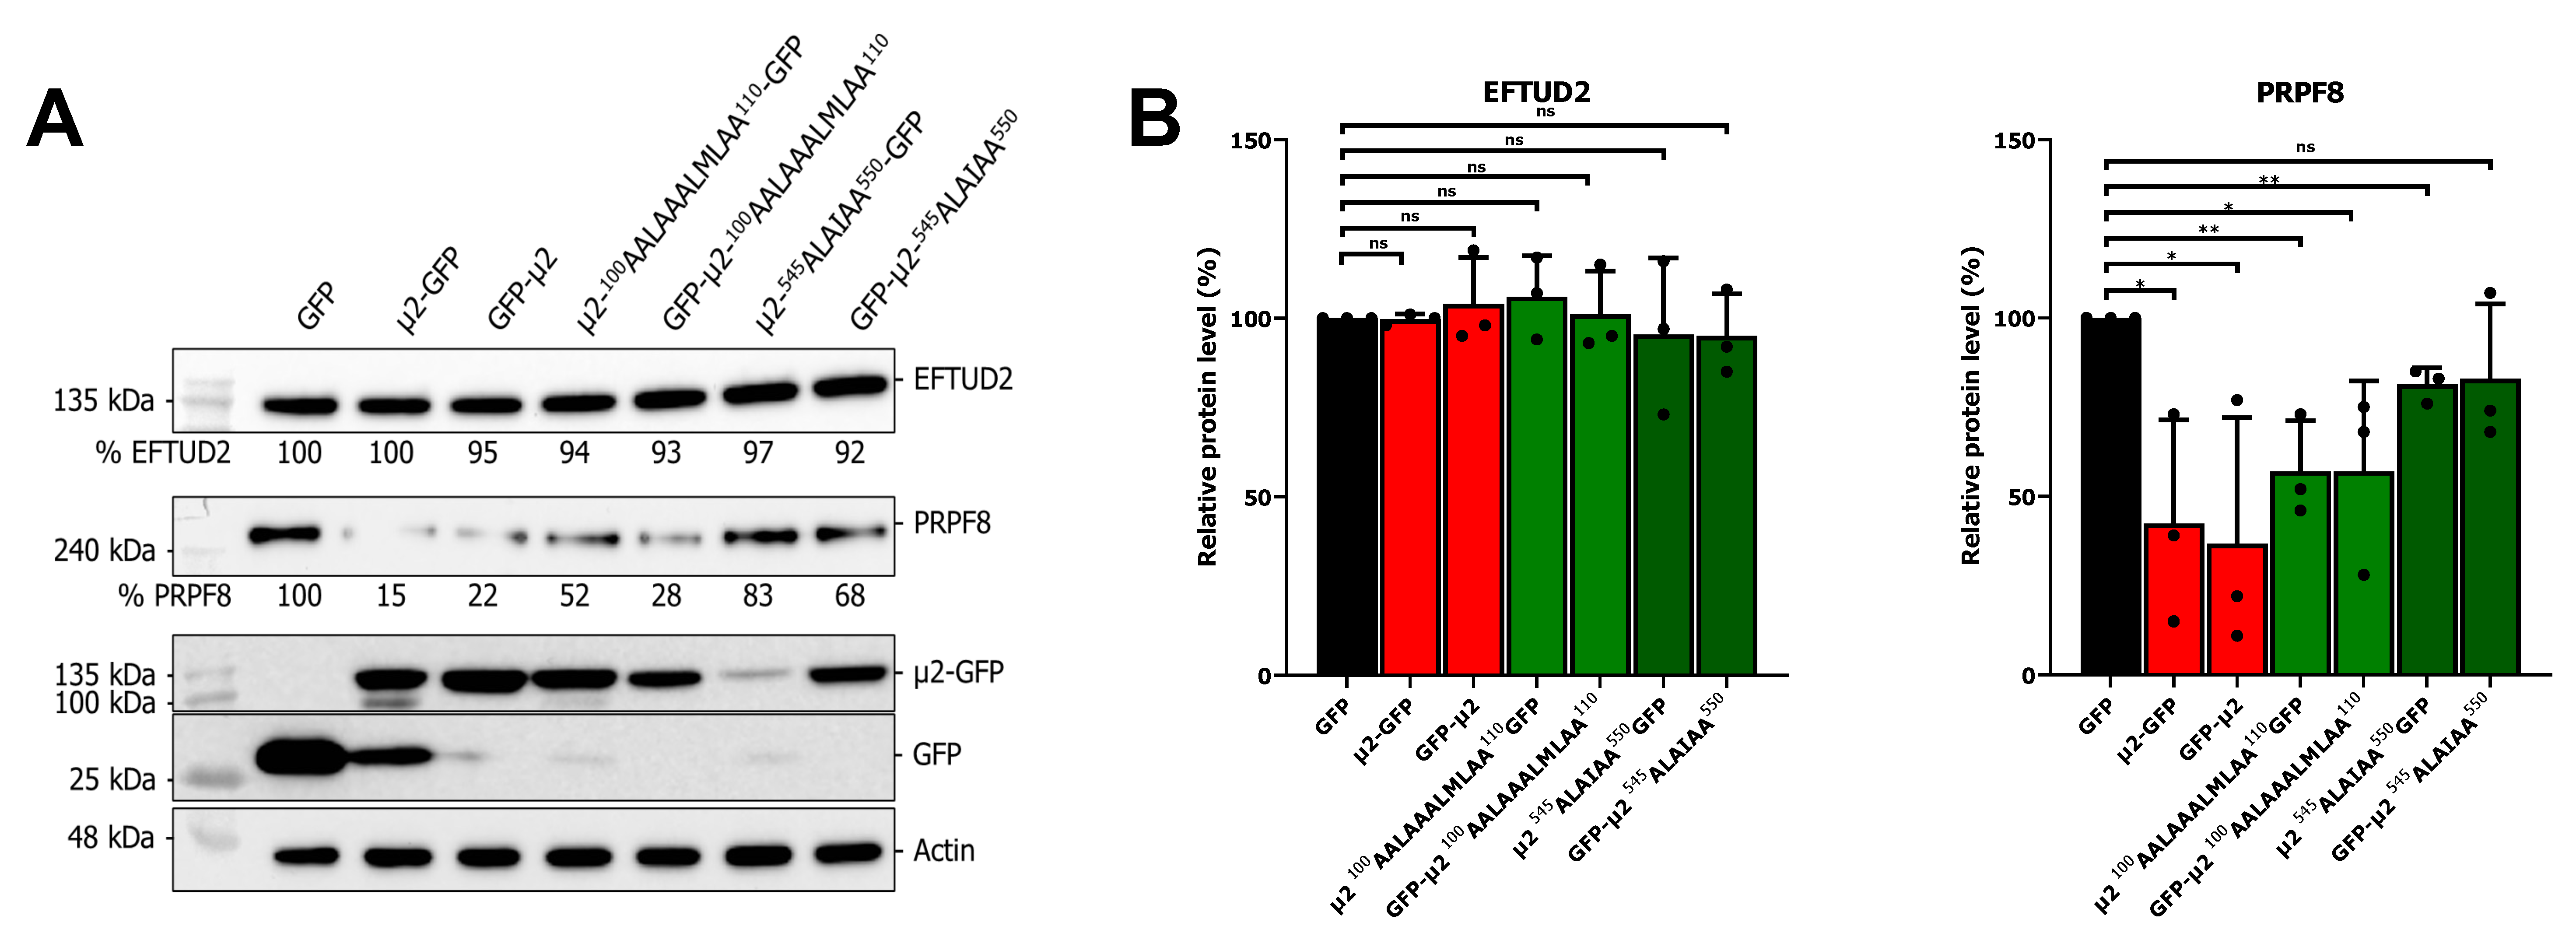
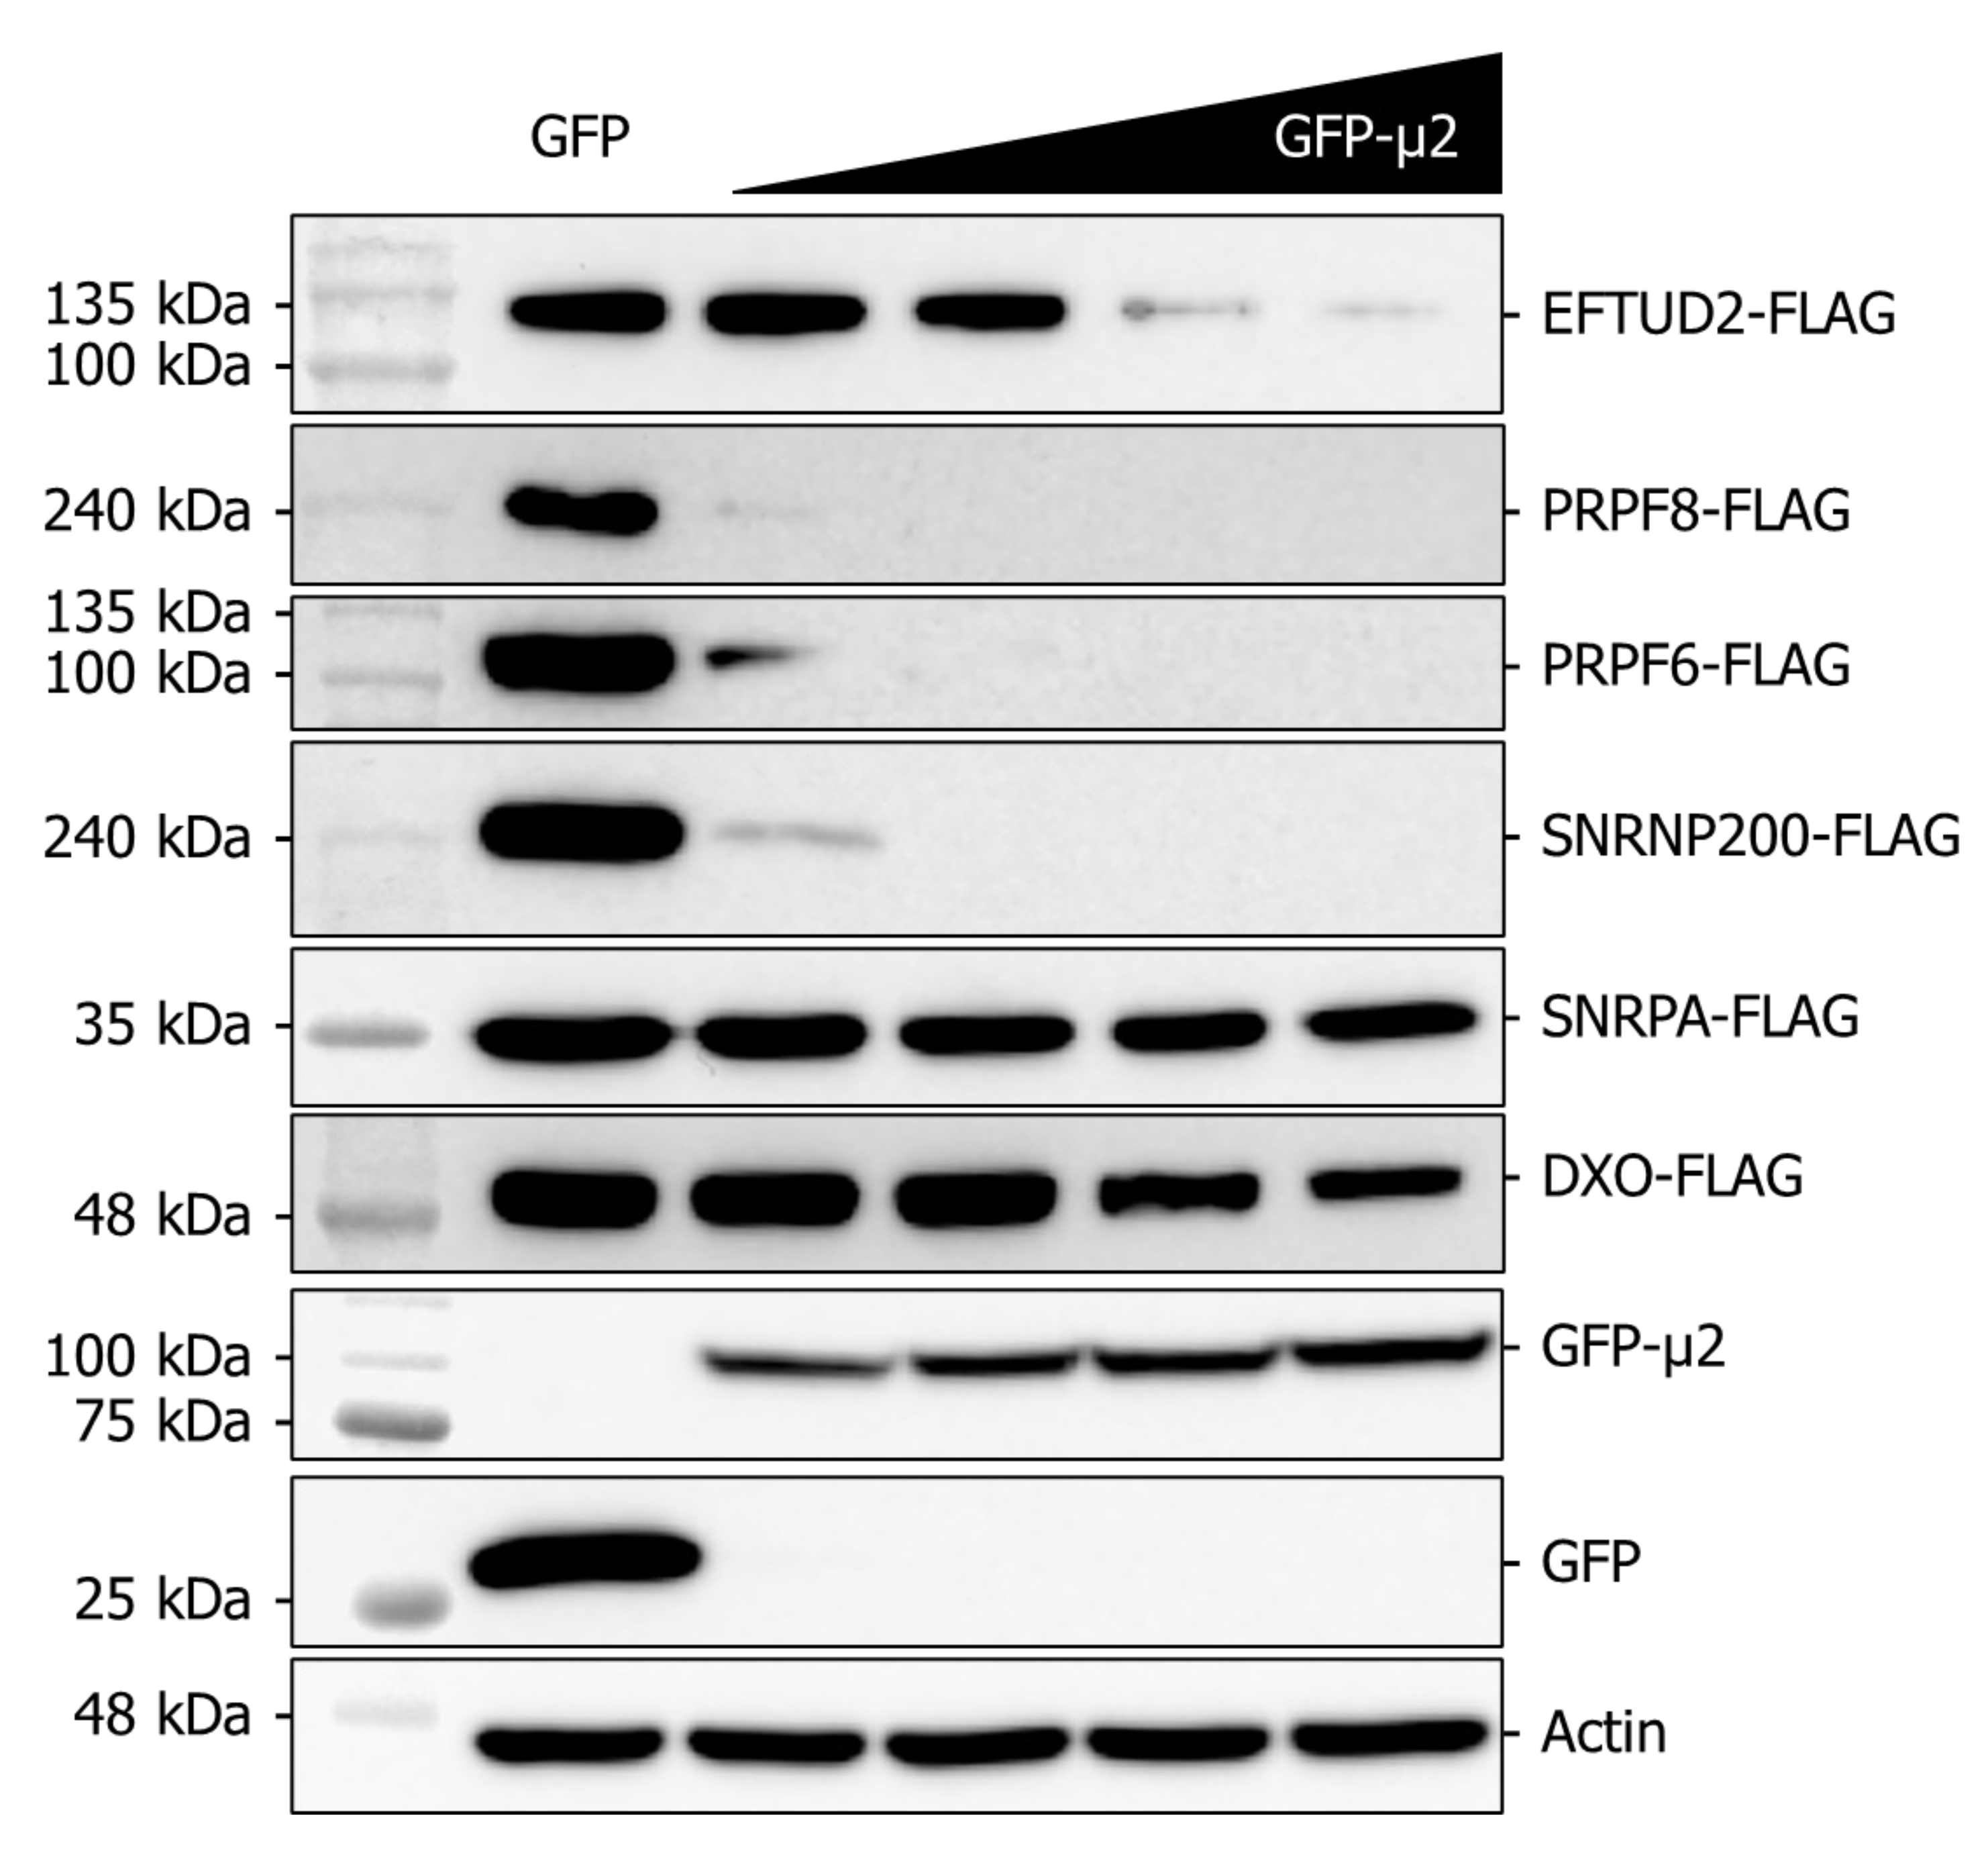
2.5. The Presence of μ2 Hampers the Ectopic Expression of U5 Proteins in a Dose-Dependent Manner
3. Discussion
4. Materials and Methods
4.1. Cells and Reagents
4.2. Plasmid Transfection
4.3. RNA Extraction, Reverse Transcription and qPCR
4.4. Fluorescence In Situ Hybridization (FISH) of mRNA
4.5. Cell Fractionation
4.6. Newly Synthesized Proteins Assay
4.7. Western Blot (WB)
4.8. Polysome Profiling
4.9. Protein Degradation Assay
4.10. Co-Expression Experiments
4.11. Data Analysis and Statistical Analyses
Supplementary Materials
Author Contributions
Funding
Institutional Review Board Statement
Informed Consent Statement
Acknowledgments
Conflicts of Interest
References
- Mertens, P. The dsRNA Viruses. Virus Res. 2004, 101, 3–13. [Google Scholar] [CrossRef] [PubMed]
- Dermody, T.S.; Parker, J.S.; Sherry, B. Orthoreoviruses. In Fields Virology; David, M., Howley, K.P., Eds.; Lippincott Williams & Wilkins: Philadelphia, PA, USA, 2013; ISBN 978-1-4511-0563-6. [Google Scholar]
- Kim, J.; Parker, J.S.L.; Murray, K.E.; Nibert, M.L. Nucleoside and RNA Triphosphatase Activities of Orthoreovirus Transcriptase Cofactor μ2. J. Biol. Chem. 2004, 279, 4394–4403. [Google Scholar] [CrossRef] [PubMed]
- Eichwald, C.; Kim, J.; Nibert, M.L. Dissection of Mammalian Orthoreovirus μ2 Reveals a Self-Associative Domain Required for Binding to Microtubules but Not to Factory Matrix Protein muNS. PLoS ONE 2017, 12, e0184356. [Google Scholar] [CrossRef] [PubMed]
- Parker, J.S.L.; Broering, T.J.; Kim, J.; Higgins, D.E.; Nibert, M.L. Reovirus Core Protein μ2 Determines the Filamentous Morphology of Viral Inclusion Bodies by Interacting with and Stabilizing Microtubules. J. Virol. 2002, 76, 4483–4496. [Google Scholar] [CrossRef]
- Eichwald, C.; Ackermann, M.; Nibert, M.L. The Dynamics of Both Filamentous and Globular Mammalian Reovirus Viral Factories Rely on the Microtubule Network. Virology 2018, 518, 77–86. [Google Scholar] [CrossRef]
- Zurney, J.; Kobayashi, T.; Holm, G.H.; Dermody, T.S.; Sherry, B. Reovirus μ2 Protein Inhibits Interferon Signaling through a Novel Mechanism Involving Nuclear Accumulation of Interferon Regulatory Factor 9. J. Virol. 2009, 83, 2178–2187. [Google Scholar] [CrossRef]
- Lanoie, D.; Lemay, G. Multiple Proteins Differing between Laboratory Stocks of Mammalian Orthoreoviruses Affect Both Virus Sensitivity to Interferon and Induction of Interferon Production during Infection. Virus Res. 2018, 247, 40–46. [Google Scholar] [CrossRef] [PubMed]
- Irvin, S.C.; Zurney, J.; Ooms, L.S.; Chappell, J.D.; Dermody, T.S.; Sherry, B. A Single-Amino-Acid Polymorphism in Reovirus Protein μ2 Determines Repression of Interferon Signaling and Modulates Myocarditis. J. Virol. 2012, 86, 2302–2311. [Google Scholar] [CrossRef]
- Mohamed, A.; Clements, D.R.; Gujar, S.A.; Lee, P.W.; Smiley, J.R.; Shmulevitz, M. Single Amino Acid Differences between Closely Related Reovirus T3D Lab Strains Alter Oncolytic Potency In Vitro and In Vivo. J. Virol. 2020, 94, e01688-19. [Google Scholar] [CrossRef]
- Mohamed, A.; Smiley, J.R.; Shmulevitz, M. Polymorphisms in the Most Oncolytic Reovirus Strain Confer Enhanced Cell Attachment, Transcription and Single-Step Replication Kinetics. J. Virol. 2019, 94, e01937-19. [Google Scholar] [CrossRef]
- Ooms, L.S.; Kobayashi, T.; Dermody, T.S.; Chappell, J.D. A Post-Entry Step in the Mammalian Orthoreovirus Replication Cycle Is a Determinant of Cell Tropism. J. Biol. Chem. 2010, 285, 41604–41613. [Google Scholar] [CrossRef] [PubMed]
- Ooms, L.S.; Jerome, W.G.; Dermody, T.S.; Chappell, J.D. Reovirus Replication Protein μ2 Influences Cell Tropism by Promoting Particle Assembly within Viral Inclusions. J. Virol. 2012, 86, 10979–10987. [Google Scholar] [CrossRef] [PubMed]
- Brentano, L.; Noah, D.L.; Brown, E.G.; Sherry, B. The Reovirus Protein μ2, Encoded by the M1 Gene, Is an RNA-Binding Protein. J. Virol. 1998, 72, 8354–8357. [Google Scholar] [CrossRef] [PubMed]
- Boudreault, S.; Martenon-Brodeur, C.; Caron, M.; Garant, J.-M.; Tremblay, M.-P.; Armero, V.E.S.; Durand, M.; Lapointe, E.; Thibault, P.; Tremblay-Létourneau, M.; et al. Global Profiling of the Cellular Alternative RNA Splicing Landscape during Virus-Host Interactions. PLoS ONE 2016, 11, e0161914. [Google Scholar] [CrossRef]
- Boudreault, S.; Durand, M.; Martineau, C.-A.; Perreault, J.-P.; Lemay, G.; Bisaillon, M. Reovirus μ2 Protein Modulates Host Cell Alternative Splicing by Reducing Protein Levels of U5 SnRNP Core Components. Nucleic Acids Res. 2022, 50, 5263–5281. [Google Scholar] [CrossRef]
- Rivera-Serrano, E.E.; Fritch, E.J.; Scholl, E.H.; Sherry, B. A Cytoplasmic RNA Virus Alters the Function of the Cell Splicing Protein SRSF2. J. Virol. 2017, 91, e02488-16. [Google Scholar] [CrossRef]
- Wang, E.T.; Sandberg, R.; Luo, S.; Khrebtukova, I.; Zhang, L.; Mayr, C.; Kingsmore, S.F.; Schroth, G.P.; Burge, C.B. Alternative Isoform Regulation in Human Tissue Transcriptomes. Nature 2008, 456, 470–476. [Google Scholar] [CrossRef]
- Stamm, S.; Ben-Ari, S.; Rafalska, I.; Tang, Y.; Zhang, Z.; Toiber, D.; Thanaraj, T.A.; Soreq, H. Function of Alternative Splicing. Gene 2005, 344, 1–20. [Google Scholar] [CrossRef]
- Hardy, M.P.; O’Neill, L.A.J. The Murine Irak2 Gene Encodes Four Alternatively Spliced Isoforms, Two of Which Are Inhibitory. J. Biol. Chem. 2004, 279, 27699–27708. [Google Scholar] [CrossRef]
- Ku, C.-C.; Che, X.-B.; Reichelt, M.; Rajamani, J.; Schaap-Nutt, A.; Huang, K.-J.; Sommer, M.H.; Chen, Y.-S.; Chen, Y.-Y.; Arvin, A.M. Herpes Simplex Virus-1 Induces Expression of a Novel MxA Isoform That Enhances Viral Replication. Immunol. Cell. Biol. 2011, 89, 173–182. [Google Scholar] [CrossRef]
- Dörner, A.; Xiong, D.; Couch, K.; Yajima, T.; Knowlton, K.U. Alternatively Spliced Soluble Coxsackie-Adenovirus Receptors Inhibit Coxsackievirus Infection. J. Biol. Chem. 2004, 279, 18497–18503. [Google Scholar] [CrossRef]
- Labbé, P.; Faure, E.; Lecointe, S.; Le Scouarnec, S.; Kyndt, F.; Marrec, M.; Le Tourneau, T.; Offmann, B.; Duplaà, C.; Zaffran, S.; et al. The Alternatively Spliced LRRFIP1 Isoform-1 Is a Key Regulator of the Wnt/β-Catenin Transcription Pathway. Biochim. Biophys. Acta Mol. Cell Res. 2017, 1864, 1142–1152. [Google Scholar] [CrossRef] [PubMed]
- Ule, J.; Blencowe, B.J. Alternative Splicing Regulatory Networks: Functions, Mechanisms, and Evolution. Mol. Cell 2019, 76, 329–345. [Google Scholar] [CrossRef] [PubMed]
- Grainger, R.J.; Beggs, J.D. Prp8 Protein: At the Heart of the Spliceosome. RNA 2005, 11, 533–557. [Google Scholar] [CrossRef]
- Montes, M.; Sanford, B.L.; Comiskey, D.F.; Chandler, D.S. RNA Splicing and Disease: Animal Models to Therapies. Trends Genet. TIG 2019, 35, 68. [Google Scholar] [CrossRef]
- Chen, M.; Manley, J.L. Mechanisms of Alternative Splicing Regulation: Insights from Molecular and Genomics Approaches. Nat. Rev. Mol. Cell Biol. 2009, 10, 741–754. [Google Scholar] [CrossRef] [PubMed]
- Meyer, F. Chapter Eight-Viral Interactions with Components of the Splicing Machinery. In Progress in Molecular Biology and Translational Science; San Francisco, M., San Francisco, B., Eds.; Host-Microbe Interactions; Academic Press: Cambridge, MA, USA, 2016; Volume 142, pp. 241–268. [Google Scholar]
- Boudreault, S.; Roy, P.; Lemay, G.; Bisaillon, M. Viral Modulation of Cellular RNA Alternative Splicing: A New Key Player in Virus–Host Interactions? Wiley Interdiscip. Rev. RNA 2019, 10, e1543. [Google Scholar] [CrossRef] [PubMed]
- Ashraf, U.; Benoit-Pilven, C.; Lacroix, V.; Navratil, V.; Naffakh, N. Advances in Analyzing Virus-Induced Alterations of Host Cell Splicing. Trends Microbiol. 2019, 27, 268–281. [Google Scholar] [CrossRef]
- Chauhan, K.; Kalam, H.; Dutt, R.; Kumar, D. RNA Splicing: A New Paradigm in Host-Pathogen Interactions. J. Mol. Biol. 2019, 431, 1565–1575. [Google Scholar] [CrossRef]
- Kuss, S.K.; Mata, M.A.; Zhang, L.; Fontoura, B.M.A. Nuclear Imprisonment: Viral Strategies to Arrest Host MRNA Nuclear Export. Viruses 2013, 5, 1824–1849. [Google Scholar] [CrossRef]
- Kobayashi, T.; Ooms, L.S.; Chappell, J.D.; Dermody, T.S. Identification of Functional Domains in Reovirus Replication Proteins muNS and μ2. J. Virol. 2009, 83, 2892–2906. [Google Scholar] [CrossRef]
- Mbisa, J.L.; Becker, M.M.; Zou, S.; Dermody, T.S.; Brown, E.G. Reovirus μ2 Protein Determines Strain-Specific Differences in the Rate of Viral Inclusion Formation in L929 Cells. Virology 2000, 272, 16–26. [Google Scholar] [CrossRef][Green Version]
- Lemay, J.-F.; Lemieux, C.; St-André, O.; Bachand, F. Crossing the Borders: Poly(A)-Binding Proteins Working on Both Sides of the Fence. RNA Biol. 2010, 7, 291–295. [Google Scholar] [CrossRef]
- Qin, Q.; Hastings, C.; Miller, C.L. Mammalian Orthoreovirus Particles Induce and Are Recruited into Stress Granules at Early Times Postinfection. J. Virol. 2009, 83, 11090–11101. [Google Scholar] [CrossRef]
- Carroll, K.; Hastings, C.; Miller, C.L. Amino Acids 78 and 79 of Mammalian Orthoreovirus Protein muNS Are Necessary for Stress Granule Localization, Core Protein lambda2 Interaction, and de Novo Virus Replication. Virology 2014, 448, 133–145. [Google Scholar] [CrossRef]
- Choudhury, P.; Bussiere, L.D.; Miller, C.L. Mammalian Orthoreovirus Factories Modulate Stress Granule Protein Localization by Interaction with G3BP1. J. Virol. 2017, 91, e01298-17. [Google Scholar] [CrossRef]
- Guo, Y.; Hinchman, M.M.; Lewandrowski, M.; Cross, S.T.; Sutherland, D.M.; Welsh, O.L.; Dermody, T.S.; Parker, J.S.L. The Multi-Functional Reovirus sigma3 Protein Is a Virulence Factor That Suppresses Stress Granule Formation and Is Associated with Myocardial Injury. PLoS Pathog. 2021, 17, e1009494. [Google Scholar] [CrossRef]
- Qin, Q.; Carroll, K.; Hastings, C.; Miller, C.L. Mammalian Orthoreovirus Escape from Host Translational Shutoff Correlates with Stress Granule Disruption and Is Independent of EIF2α Phosphorylation and PKR. J. Virol. 2011, 85, 8798–8810. [Google Scholar] [CrossRef]
- Parker, D.M.; Winkenbach, L.P.; Osborne Nishimura, E. It’s Just a Phase: Exploring the Relationship Between MRNA, Biomolecular Condensates, and Translational Control. Front. Genet. 2022, 13, 931220. [Google Scholar] [CrossRef]
- Schmechel, S.; Chute, M.; Skinner, P.; Anderson, R.; Schiff, L. Preferential Translation of Reovirus MRNA by a sigma3-Dependent Mechanism. Virology 1997, 232, 62–73. [Google Scholar] [CrossRef]
- Yue, Z.; Shatkin, A.J. Double-Stranded RNA-Dependent Protein Kinase (PKR) Is Regulated by Reovirus Structural Proteins. Virology 1997, 234, 364–371. [Google Scholar] [CrossRef] [PubMed]
- Sharpe, A.H.; Fields, B.N. Reovirus Inhibition of Cellular RNA and Protein Synthesis: Role of the S4 Gene. Virology 1982, 122, 381–391. [Google Scholar] [CrossRef] [PubMed]
- Munir, M.; Berg, M. The Multiple Faces of Proteinkinase R in Antiviral Defense. Virulence 2013, 4, 85–89. [Google Scholar] [CrossRef] [PubMed]
- García, M.A.; Gil, J.; Ventoso, I.; Guerra, S.; Domingo, E.; Rivas, C.; Esteban, M. Impact of Protein Kinase PKR in Cell Biology: From Antiviral to Antiproliferative Action. Microbiol. Mol. Biol. Rev. 2006, 70, 1032–1060. [Google Scholar] [CrossRef]
- Skup, D.; Zarbl, H.; Millward, S. Regulation of Translation in L-Cells Infected with Reovirus. J. Mol. Biol. 1981, 151, 35–55. [Google Scholar] [CrossRef]
- Lemieux, R.; Zarbl, H.; Millward, S. mRNA Discrimination in Extracts from Uninfected and Reovirus-Infected L-Cells. J. Virol. 1984, 51, 215–222. [Google Scholar] [CrossRef]
- Skup, D.; Millward, S. Reovirus-Induced Modification of Cap-Dependent Translation in Infected L Cells. Proc. Natl. Acad. Sci. USA 1980, 77, 152–156. [Google Scholar] [CrossRef]
- Danis, C.; Mabrouk, T.; Garzon, S.; Lemay, G. Establishment of Persistent Reovirus Infection in SC1 Cells: Absence of Protein Synthesis Inhibition and Increased Level of Double-Stranded RNA-Activated Protein Kinase. Virus Res. 1993, 27, 253–265. [Google Scholar] [CrossRef]
- Smith, J.A.; Schmechel, S.C.; Raghavan, A.; Abelson, M.; Reilly, C.; Katze, M.G.; Kaufman, R.J.; Bohjanen, P.R.; Schiff, L.A. Reovirus Induces and Benefits from an Integrated Cellular Stress Response. J. Virol. 2006, 80, 2019–2033. [Google Scholar] [CrossRef]
- Smith, J.A.; Schmechel, S.C.; Williams, B.R.G.; Silverman, R.H.; Schiff, L.A. Involvement of the Interferon-Regulated Antiviral Proteins PKR and RNase L in Reovirus-Induced Shutoff of Cellular Translation. J. Virol. 2005, 79, 2240–2250. [Google Scholar] [CrossRef]
- Lemay, G. Synthesis and Translation of Viral MRNA in Reovirus-Infected Cells: Progress and Remaining Questions. Viruses 2018, 10, 671. [Google Scholar] [CrossRef]
- Mathieson, T.; Franken, H.; Kosinski, J.; Kurzawa, N.; Zinn, N.; Sweetman, G.; Poeckel, D.; Ratnu, V.S.; Schramm, M.; Becher, I.; et al. Systematic Analysis of Protein Turnover in Primary Cells. Nat. Commun. 2018, 9, 689. [Google Scholar] [CrossRef] [PubMed]
- De Arras, L.; Laws, R.; Leach, S.M.; Pontis, K.; Freedman, J.H.; Schwartz, D.A.; Alper, S. Comparative Genomics RNAi Screen Identifies Eftud2 as a Novel Regulator of Innate Immunity. Genetics 2014, 197, 485–496. [Google Scholar] [CrossRef] [PubMed]
- Zhu, C.; Xiao, F.; Hong, J.; Wang, K.; Liu, X.; Cai, D.; Fusco, D.N.; Zhao, L.; Jeong, S.W.; Brisac, C.; et al. EFTUD2 Is a Novel Innate Immune Regulator Restricting Hepatitis C Virus Infection through the RIG-I/MDA5 Pathway. J. Virol. 2015, 89, 6608–6618. [Google Scholar] [CrossRef]
- Tremblay, N.; Baril, M.; Chatel-Chaix, L.; Es-Saad, S.; Park, A.Y.; Koenekoop, R.K.; Lamarre, D. Spliceosome SNRNP200 Promotes Viral RNA Sensing and IRF3 Activation of Antiviral Response. PLoS Pathog. 2016, 12, e1005772. [Google Scholar] [CrossRef]
- Boudreault, S.; Lemay, G.; Bisaillon, M. U5 SnRNP Core Proteins Are Key Components of the Defense Response against Viral Infection through Their Roles in Programmed Cell Death and Interferon Induction. Viruses 2022, 14, 2710. [Google Scholar] [CrossRef]
- Taylor, S.; Wakem, M.; Dijkman, G.; Alsarraj, M.; Nguyen, M. A Practical Approach to RT-QPCR—Publishing Data That Conform to the MIQE Guidelines. Methods 2010, 50, S1–S5. [Google Scholar] [CrossRef]
- Giguère, H.; Dumont, A.-A.; Berthiaume, J.; Oliveira, V.; Laberge, G.; Auger-Messier, M. ADAP1 Limits Neonatal Cardiomyocyte Hypertrophy by Reducing Integrin Cell Surface Expression. Sci. Rep. 2018, 8, 13605. [Google Scholar] [CrossRef] [PubMed]
- Koontz, L. Chapter One-TCA Precipitation. In Methods in Enzymology; Lorsch, J., Ed.; Laboratory Methods in Enzymology: Protein Part C.; Academic Press: Cambridge, MA, USA, 2014; Volume 541, pp. 3–10. [Google Scholar]


Disclaimer/Publisher’s Note: The statements, opinions and data contained in all publications are solely those of the individual author(s) and contributor(s) and not of MDPI and/or the editor(s). MDPI and/or the editor(s) disclaim responsibility for any injury to people or property resulting from any ideas, methods, instructions or products referred to in the content. |
© 2022 by the authors. Licensee MDPI, Basel, Switzerland. This article is an open access article distributed under the terms and conditions of the Creative Commons Attribution (CC BY) license (https://creativecommons.org/licenses/by/4.0/).
Share and Cite
Boudreault, S.; Martineau, C.-A.; Faucher-Giguère, L.; Abou-Elela, S.; Lemay, G.; Bisaillon, M. Reovirus μ2 Protein Impairs Translation to Reduce U5 snRNP Protein Levels. Int. J. Mol. Sci. 2023, 24, 727. https://doi.org/10.3390/ijms24010727
Boudreault S, Martineau C-A, Faucher-Giguère L, Abou-Elela S, Lemay G, Bisaillon M. Reovirus μ2 Protein Impairs Translation to Reduce U5 snRNP Protein Levels. International Journal of Molecular Sciences. 2023; 24(1):727. https://doi.org/10.3390/ijms24010727
Chicago/Turabian StyleBoudreault, Simon, Carole-Anne Martineau, Laurence Faucher-Giguère, Sherif Abou-Elela, Guy Lemay, and Martin Bisaillon. 2023. "Reovirus μ2 Protein Impairs Translation to Reduce U5 snRNP Protein Levels" International Journal of Molecular Sciences 24, no. 1: 727. https://doi.org/10.3390/ijms24010727
APA StyleBoudreault, S., Martineau, C.-A., Faucher-Giguère, L., Abou-Elela, S., Lemay, G., & Bisaillon, M. (2023). Reovirus μ2 Protein Impairs Translation to Reduce U5 snRNP Protein Levels. International Journal of Molecular Sciences, 24(1), 727. https://doi.org/10.3390/ijms24010727