
Salt-Induced Changes in Cytosolic pH and Photosynthesis in Tobacco and Potato Leaves

 , , , and
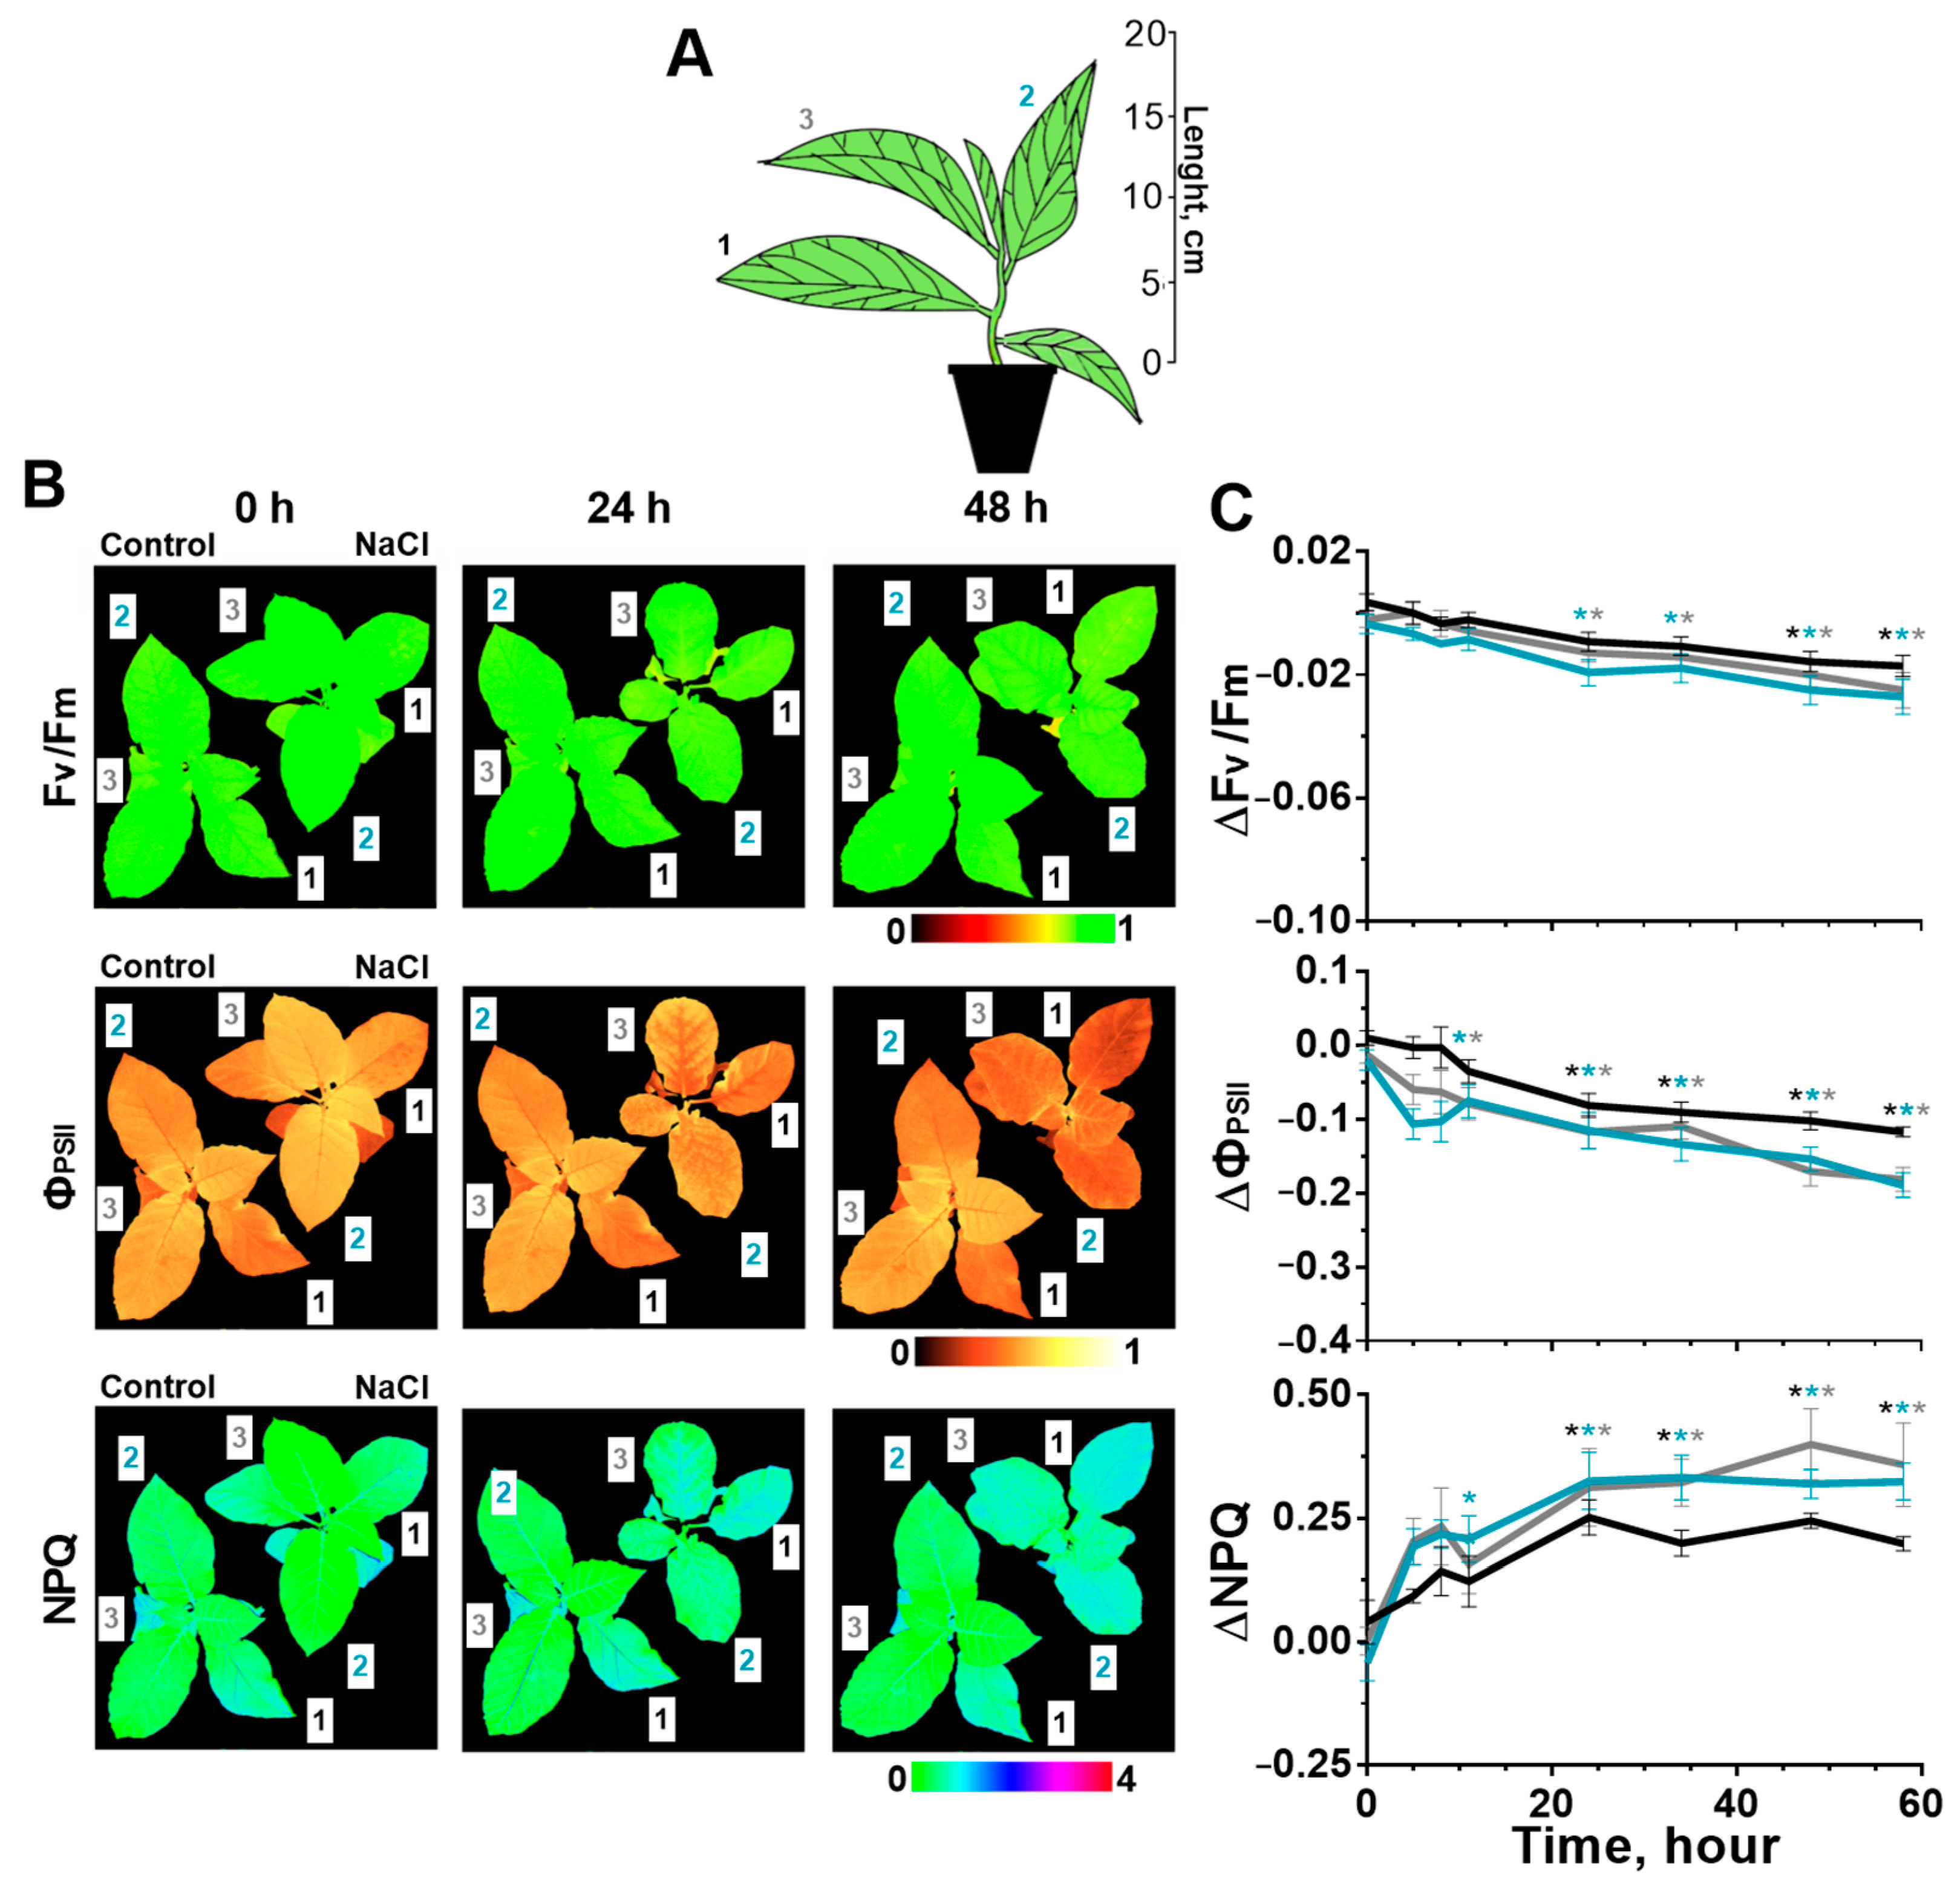
Abstract
1. Introduction
2. Results
2.1. Effect of Salinity on Photosynthesis
2.2. Stomatal Conductance and Water Content in Leaves after Start of the Salt Stress
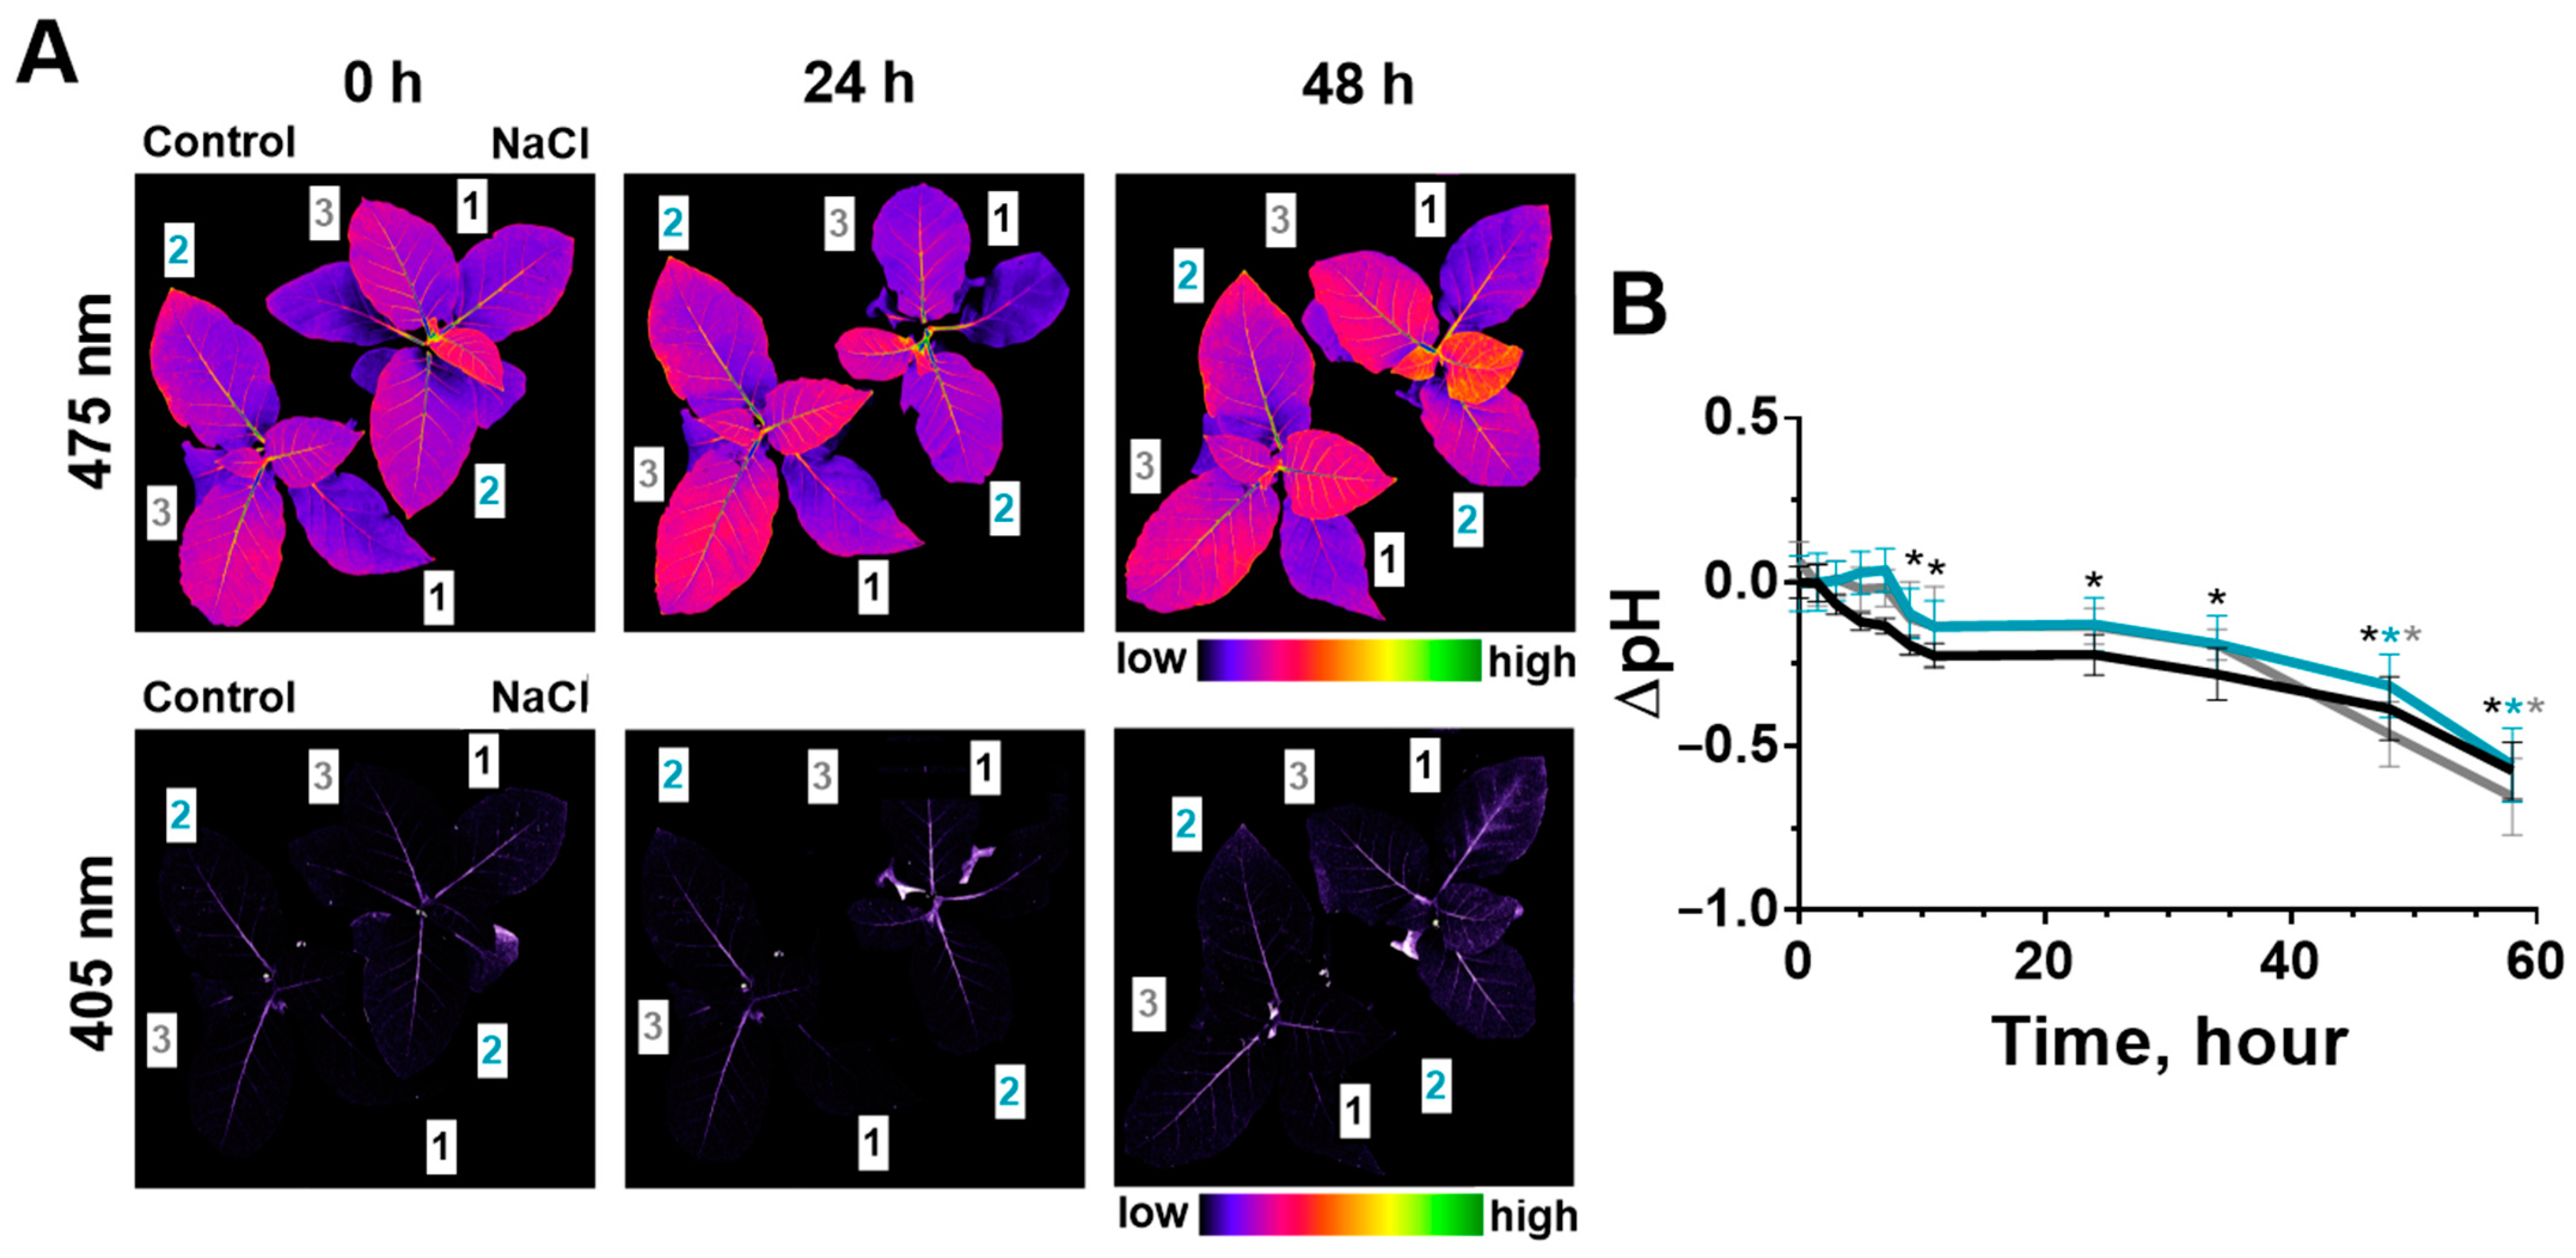
2.3. Change of Leaves’ pH during Salinity
2.4. Sodium Content in Leaves
3. Discussion
4. Materials and Methods
4.1. Plant Material and Salt Treatment
4.2. Chlorophyll Fluorescence Measurement
4.3. Fluorescent Imaging of Cytosolic pH
4.4. CWSI and RWC Measurement
4.5. Measurement of Sodium, Potassium and Chloride Content
4.6. Statistical Analysis
Supplementary Materials
Author Contributions
Funding
Data Availability Statement
Acknowledgments
Conflicts of Interest
References
- Sharma, S.; Pandey, S.; Muthamilarasan, M.; Chaudhry, V.; Dulani, P.; Prasad, M. Genomics Resources for Abiotic Stress Tolerance in Solanaceae Crops. In The Potato Genome; Chakrabari, S.K., Ed.; Springer International Publishing AG: Cham, Switzerland, 2017; pp. 195–216. [Google Scholar] [CrossRef]
- Maathuis, F.J.M.; Ahmad, I.; Patishtan, J. Regulation of Na+ fluxes in plants. Front. Plant Sci. 2014, 5, 469. [Google Scholar] [CrossRef] [PubMed]
- Gorji, T.; Tanik, A.; Sertel, E. Soil Salinity Prediction, Monitoring and Mapping Using Modern Technologies. Procedia Earth Planet. Sci. 2015, 15, 507–512. [Google Scholar] [CrossRef]
- Hanin, M.; Ebel, C.; Ngom, M.; Laplaze, L.; Masmoudi, K. New insights on plant salt tolerance mechanisms and their potential use for breeding. Front. Plant Sci. 2016, 7, 1787. [Google Scholar] [CrossRef] [PubMed]
- Assaha, D.V.M.; Ueda, A.; Saneoka, H.; Al-Yahyai, R.; Yaish, M.W. The role of Na+ and K+ transporters in salt stress adaptation in glycophytes. Front. Physiol. 2017, 8, 509. [Google Scholar] [CrossRef] [PubMed]
- Gupta, B.; Huang, B. Mechanism of salinity tolerance in plants: Physiological, biochemical, and molecular characterization. Int. J. Genom. 2014, 2014, 701596. [Google Scholar] [CrossRef] [PubMed]
- Chourasia, K.N.; Lal, M.K.; Tiwari, R.K.; Dev, D.; Kardile, H.B.; Patil, V.U.; Kumar, A.; Vanishree, G.; Kumar, D.; Bhardwaj, V.; et al. Salinity stress in potato: Understanding physiological, biochemical and molecular responses. Life 2021, 11, 545. [Google Scholar] [CrossRef]
- Munns, R.; Tester, M. Mechanisms of salinity tolerance. Annu. Rev. Plant Biol. 2008, 59, 651–681. [Google Scholar] [CrossRef]
- Maathuis, F.J.M. Sodium in plants: Perception, signalling, and regulation of sodium fluxes. J. Exp. Bot. 2014, 65, 849–858. [Google Scholar] [CrossRef]
- Zhao, C.; Zhang, H.; Song, C.; Zhu, Z.K.; Shabala, S. Mechanisms of Plant Responses and Adaptation to Soil Salinity. Innovation 2020, 1, 1. [Google Scholar] [CrossRef]
- Garthwaite, A.J.; von Bothmer, R.; Colmer, T.D. Salt tolerance in wild Hordeum species is associated with restricted entry of Na+ and Cl− into the shoots. J. Exp. Bot. 2005, 56, 2365–2378. [Google Scholar] [CrossRef]
- Wu, H.; Shabala, L.; Shabala, S.; Giraldo, J.P. Hydroxyl radical scavenging by cerium oxide nanoparticles improves Arabidopsis salinity tolerance by enhancing leaf mesophyll potassium retention. Environ. Sci. Nano 2018, 5, 1567–1583. [Google Scholar] [CrossRef]
- Apse, M.P.; Blumwald, E. Na+ transport in plants. FEBS Lett. 2007, 581, 2247–2254. [Google Scholar] [CrossRef] [PubMed]
- Ji, H.; Pardo, J.M.; Batelli, G.; van Oosten, M.J.; Bressan, R.A.; Li, X. The salt overly sensitive (SOS) pathway: Established and emerging roles. Mol. Plant 2013, 6, 275–286. [Google Scholar] [CrossRef] [PubMed]
- Choi, W.G.; Toyota, M.; Kim, S.H.; Hilleary, R.; Gilroy, S. Salt stress-induced Ca2+ waves are associated with rapid, long-distance root-to-shoot signaling in plants. Proc. Natl. Acad. Sci. USA 2014, 111, 6497–6502. [Google Scholar] [CrossRef] [PubMed]
- Wegner, L.; Li, X.; Zhang, J.; Yu, M.; Shabala, S. Biochemical and biophysical pH clamp controlling Net H+ efflux across the plasma membrane of plant cells. New Phytol. 2021, 230, 408–415. [Google Scholar] [CrossRef]
- Backhausen, J.E.; Klein, M.; Klocke, M.; Jung, S.; Scheibe, R. Salt tolerance of potato (Solanum tuberosum L. var. Desirée) plants depends on light intensity and air humidity. Plant Sci. 2005, 169, 229–237. [Google Scholar] [CrossRef]
- Sarabi, B.; Fresneau, C.; Ghaderi, N.; Bolandnazar, S.; Streb, P.; Badeck, F.W.; Citerne, S.; Tangama, M.; David, A.; Ghashghaie, J. Stomatal and non-stomatal limitations are responsible in down-regulation of photosynthesis in melon plants grown under the saline condition: Application of carbon isotope discrimination as a reliable proxy. Plant Physiol. Biochem. 2019, 141, 1–19. [Google Scholar] [CrossRef]
- Pandolfi, C.; Mancuso, S.; Shabala, S. Physiology of acclimation to salinity stress in pea (Pisum sativum). Environ. Exp. Bot. 2012, 84, 44–51. [Google Scholar] [CrossRef]
- Roy, S.J.; Negrão, S.; Tester, M. Salt resistant crop plants. Curr. Opin. Biotechnol. 2014, 26, 115–124. [Google Scholar] [CrossRef]
- Stepien, P.; Johnson, G.N. Contrasting responses of photosynthesis to salt stress in the glycophyte arabidopsis and the halophyte thellungiella: Role of the plastid terminal oxidase as an alternative electron sink. Plant Physiol. 2009, 149, 1154–1165. [Google Scholar] [CrossRef]
- Pan, T.; Liu, M.; Kreslavski, V.D.; Zharmukhamedov, S.K.; Nie, C.; Yu, M.; Kuznetsov, V.V.; Allakhverdiev, S.I.; Shabala, S. Non-stomatal limitation of photosynthesis by soil salinity. Crit. Rev. Environ. Sci. Technol. 2021, 51, 791–825. [Google Scholar] [CrossRef]
- Amirjani, M.R. Effect of NaCl on Some Physiological Parameters of Rice. EJBS 2010, 3, 6–16. [Google Scholar]
- Zahra, N.; Al Hinai, M.S.; Hafeez, M.B.; Rehman, A.; Wahid, A.; Siddique, K.H.M.; Farooq, M. Regulation of photosynthesis under salt stress and associated tolerance mechanisms. Plant Physiol. Biochem. 2022, 178, 55–69. [Google Scholar] [CrossRef] [PubMed]
- Wang, W.; Wang, R.; Yuan, Y.; Du, N.; Guo, W. Effects of salt and water stress on plant biomass and photosynthetic characteristics of Tamarisk (Tamarix Chinensis Lour.) seedlings. Afr. J. Biotechnol. 2011, 10, 17981–17989. [Google Scholar] [CrossRef]
- Poór, P.; Borbély, P.; Czékus, Z.; Takács, Z.; Ördög, A.; Popović, B.; Tari, I. Comparison of changes in water status and photosynthetic parameters in wild type and abscisic acid-deficient sitiens mutant of tomato (Solanum lycopersicum cv. Rheinlands Ruhm) exposed to sublethal and lethal salt stress. J. Plant Physiol. 2019, 232, 130–140. [Google Scholar] [CrossRef]
- Tsai, Y.C.; Chen, K.C.; Cheng, T.S.; Lee, C.; Lin, S.H.; Tung, C.W. Chlorophyll fluorescence analysis in diverse rice varieties reveals the positive correlation between the seedlings salt tolerance and photosynthetic efficiency. BMC Plant Biol. 2019, 19, 403. [Google Scholar] [CrossRef]
- Percey, W.J.; McMinn, A.; Bose, J.; Breadmore, M.C.; Guijt, R.M.; Shabala, S. Salinity effects on chloroplast PSII performance in glycophytes and halophytes. Funct. Plant Biol. 2016, 43, 1003–1015. [Google Scholar] [CrossRef]
- Li, H.; Chang, J.; Chen, H.; Wang, Z.; Gu, X.; Wei, C.; Zhang, Y.; Ma, J.; Yang, J.; Zhang, X. Exogenous melatonin confers salt stress tolerance to watermelon by improving photosynthesis and redox homeostasis. Front. Plant Sci. 2017, 8, 295. [Google Scholar] [CrossRef]
- Demetriou, G.; Neonaki, C.; Navakoudis, E.; Kotzabasis, K. Salt stress impact on the molecular structure and function of the photosynthetic apparatus-The protective role of polyamines. Biochim. Biophys. Acta Bioenerg. 2007, 1767, 272–280. [Google Scholar] [CrossRef]
- Dhokne, K.; Pandey, J.; Yadav, R.M.; Ramachandran, P.; Rath, J.R.; Subramanyam, R. Change in the photochemical and structural organization of thylakoids from pea (Pisum sativum) under salt stress. Plant Physiol. Biochem. 2022, 177, 46–60. [Google Scholar] [CrossRef]
- Goussi, R.; Manaa, A.; Derbali, W.; Cantamessa, S.; Abdelly, C.; Barbato, R. Comparative analysis of salt stress, duration and intensity, on the chloroplast ultrastructure and photosynthetic apparatus in Thellungiella salsuginea. J. Photochem. Photobiol. B 2018, 183, 275–287. [Google Scholar] [CrossRef] [PubMed]
- Ku, Y.S.; Cheng, S.S.; Ng, M.S.; Chung, G.; Lam, H.M. The Tiny Companion Matters: The Important Role of Protons in Active Transports in Plants. Int. J. Mol. Sci. 2022, 23, 2824. [Google Scholar] [CrossRef] [PubMed]
- Song, C.P.; Guo, Y.; Qiu, Q.; Lambert, G.; Galbraith, D.W.; Jagendorf, A.; Zhu, J.K. A probable Na+ (K+)/H+ exchanger on the chloroplast envelope functions in pH homeostasis and chloroplast development in Arabidopsis thaliana. Proc. Natl. Acad. Sci. USA 2004, 101, 10211–10216. [Google Scholar] [CrossRef] [PubMed]
- Ismail, A.; Seo, M.; Takebayashi, Y.; Kamiya, Y.; Eiche, E.; Nick, P. Salt adaptation requires efficient fine-tuning of jasmonate signalling. Protoplasma 2014, 251, 881–898. [Google Scholar] [CrossRef]
- Kader, M.A.; Lindberg, S.; Seidel, T.; Golldack, D.; Yemelyanov, V. Sodium sensing induces different changes in free cytosolic calcium concentration and pH in salt-tolerant and -sensitive rice (Oryza sativa) cultivars. Physiol. Plant 2007, 130, 99–111. [Google Scholar] [CrossRef]
- Sun, Y.; Lindberg, S.; Shabala, L.; Morgan, S.; Shabala, S.; Jacobsen, S.E. A comparative analysis of cytosolic Na+ changes under salinity between halophyte quinoa (Chenopodium quinoa) and glycophyte pea (Pisum sativum). Environ Exp Bot 2017, 141, 154–160. [Google Scholar] [CrossRef]
- Pitann, B.; Schubert, S.; Mühling, K.H. Decline in leaf growth under salt stress is due to an inhibition of H+-pumping activity and increase in apoplastic pH of maize leaves. J. Plant Nutrition Soil. Sci. 2009, 172, 535–543. [Google Scholar] [CrossRef]
- Gjetting, S.K.; Mahmood, K.; Shabala, L.; Kristensen, A.; Shabala, S.; Palmgren, M.; Fuglsang, A. Evidence for multiple receptors mediating RALF-triggered Ca2+ signaling and proton pump inhibition. Plant J. 2020, 104, 433–446. [Google Scholar] [CrossRef]
- Liu, J.; Zhang, W.; Long, S.; Zhao, C. Maintenance of cell wall integrity under high salinity. Int. J. Mol. Sci. 2021, 22, 3260. [Google Scholar] [CrossRef] [PubMed]
- Geilfus, C.M.; Tenhaken, R.; Carpentier, S.C. Transient alkalinization of the leaf apoplast stiffens the cell wall during onset of chloride salinity in corn leaves. J. Biol. Chem. 2017, 292, 18800–18813. [Google Scholar] [CrossRef]
- Zhou, J.Y.; Hao, D.L.; Yang, G.Z. Regulation of cytosolic pH: The contributions of plant plasma membrane H+-atpases and multiple transporters. Int. J. Mol. Sci. 2021, 22, 12298. [Google Scholar] [CrossRef] [PubMed]
- Qiu, Q.S.; Guo, Y.; Dietrich, M.A.; Schumaker, K.S.; Zhu, J.K. Regulation of SOS1, a plasma membrane Na H exchanger in Arabidopsis thaliana, by SOS2 and SOS3. Proc. Natl. Acad. Sci. USA 2002, 99, 8436–8441. [Google Scholar] [CrossRef] [PubMed]
- Cuin, T.A.; Miller, A.J.; Laurie, S.A.; Leigh, R.A. Potassium activities in cell compartments of salt-grown barley leaves. J. Exp. Bot. 2003, 54, 657–661. [Google Scholar] [CrossRef] [PubMed]
- Adem, G.D.; Roy, S.J.; Huang, Y.; Chen, Z.H.; Wang, F.; Zhou, M.; Bowman, J.P.; Holford, P.; Shabala, S. Expressing Arabidopsis thaliana V-ATPase subunit C in barley (Hordeum vulgare) improves plant performance under saline condition by enabling better osmotic adjustment. Funct. Plant Biol. 2017, 44, 1147–1159. [Google Scholar] [CrossRef]
- Morgan, S.H.; Maity, P.J.; Geilfus, C.M.; Lindberg, S.; Mühling, K.H. Leaf ion homeostasis and plasma membrane H+-ATPase activity in Vicia faba change after extra calcium and potassium supply under salinity. Plant Physiol. Biochem. 2014, 82, 244–253. [Google Scholar] [CrossRef]
- Gupta, A.; Shaw, B.P.; Sahu, B.B. Post-translational regulation of the membrane transporters contributing to salt tolerance in plants. Funct. Plant Biol. 2021, 48, 1199–1212. [Google Scholar] [CrossRef]
- Geilfus, C.M.; Mühling, K.H. Microscopic and macroscopic monitoring of adaxial-abaxial pH gradients in the leaf apoplast of Vicia faba L. as primed by NaCl stress at the roots. Plant Sci. 2014, 223, 109–115. [Google Scholar] [CrossRef]
- Geilfus, C.M.; Mühling, K.H. Transient alkalinization in the leaf apoplast of Vicia faba L. depends on NaCl stress intensity: An in situ ratio imaging study. Plant. Cell Environ. 2012, 35, 578–587. [Google Scholar] [CrossRef]
- Sun, H.; Sun, X.; Wang, H.; Ma, X. Advances in salt tolerance molecular mechanism in tobacco plants. Hereditas 2020, 157, 5. [Google Scholar] [CrossRef]
- Jaarsma, R.; de Vries, R.S.M.; de Boer, A.H. Effect of Salt Stress on Growth, Na+ Accumulation and Proline Metabolism in Potato (Solanum tuberosum) Cultivars. PLoS ONE 2013, 8, e60183. [Google Scholar] [CrossRef]
- Peng, Z.; He, S.; Sun, J.; Pan, Z.; Gong, W.; Lu, Y.; Du, X. Na+ compartmentalization related to salinity stress tolerance in upland cotton (Gossypium hirsutum) seedlings. Sci. Rep. 2016, 6, srep34548. [Google Scholar] [CrossRef] [PubMed]
- Chen, S.; Li, J.; Wang, S.; Hüttermann, A.; Altman, A. Salt, nutrient uptake and transport, and ABA of Populus euphratica; a hybrid in response to increasing soil NaCl. Trees Struct. Funct. 2001, 15, 186–194. [Google Scholar] [CrossRef]
- Kolomeichuk, L.V.; Efimova, M.V.; Zlobin, I.E.; Kreslavski, V.D.; Murgan, O.K.; Kovtun, I.S.; Khripach, V.A.; Kuznetsov, V.V.; Allakhverdiev, S.I. 24-Epibrassinolide alleviates the toxic effects of NaCl on photosynthetic processes in potato plants. Photosynth. Res. 2020, 146, 151–163. [Google Scholar] [CrossRef] [PubMed]
- Yan, K.; Wu, C.; Zhang, L.; Chen, X. Contrasting photosynthesis and photoinhibition in tetraploid and its autodiploid honeysuckle (Lonicera japonica thunb.) under salt stress. Front. Plant Sci. 2015, 6, 1–9. [Google Scholar] [CrossRef]
- Maxwell, K.; Johnson, G.N. Chlorophyll fluorescence-a practical guide. J. Exp. Bot. 2000, 51, 659–668. [Google Scholar] [CrossRef]
- Shabala, S.N.; Shabala, S.I.; Martynenko, A.I.; Babourina, O.; Newman, I.A. Salinity effect on bioelectric activity, growth, Na+ accumulation and chlorophyll fluorescence of maize leaves: A comparative survey and prospects for screening. Aust. J. Plant Physiol. 1998, 25, 609–616. [Google Scholar] [CrossRef]
- Aharon, R.; Shahak, Y.; Wininger, S.; Bendov, R.; Kapulnik, Y.; Galili, G. Overexpression of a plasma membrane aquaporin in transgenic tobacco improves plant vigor under favorable growth conditions but not under drought or salt stress. Plant Cell 2003, 15, 439–447. [Google Scholar] [CrossRef]
- Takahashi, S.; Murata, N. Interruption of the Calvin cycle inhibits the repair of Photosystem II from photodamage. Biochim. Biophys. Acta Bioenerg. 2005, 1708, 352–361. [Google Scholar] [CrossRef]
- Yang, X.; Liang, Z.; Wen, X.; Lu, C. Genetic engineering of the biosynthesis of glycinebetaine leads to increased tolerance of photosynthesis to salt stress in transgenic tobacco plants. Plant Mol. Biol. 2008, 66, 73–86. [Google Scholar] [CrossRef]
- Kang, G.; Li, G.; Zheng, B.; Han, Q.; Wang, C.; Zhu, Y.; Guo, T. Proteomic analysis on salicylic acid-induced salt tolerance in common wheat seedlings (Triticum aestivum L.). Biochim. Biophys. Acta Protein. Proteom. 2012, 1824, 1324–1333. [Google Scholar] [CrossRef]
- Tavakkoli, E.; Rengasamy, P.; McDonald, G.K. High concentrations of Na+ and Cl- ions in soil solution have simultaneous detrimental effects on growth of faba bean under salinity stress. J. Exp. Bot. 2010, 61, 4449–4459. [Google Scholar] [CrossRef] [PubMed]
- Wang, L.; Xu, J.Y.; Jia, W.; Chen, Z.; Xu, Z.C. Chloride salinity in a chloride-sensitive plant: Focusing on photosynthesis, hormone synthesis and transduction in tobacco. Plant Physiol. Biochem. 2020, 153, 119–130. [Google Scholar] [CrossRef] [PubMed]
- Geilfus, C.M. Review on the significance of chlorine for crop yield and quality. Plant Sci. 2018, 270, 114–122. [Google Scholar] [CrossRef] [PubMed]
- Wang, M.; Zheng, Q.; Shen, Q.; Guo, S. The critical role of potassium in plant stress response. Int. J. Mol. Sci. 2013, 14, 7370–7390. [Google Scholar] [CrossRef] [PubMed]
- Tighe-Neira, R.; Alberdi, M.; Arce-Johnson, P.; Romero, J.; Reyes, M.; Rengel, Z. Inostroza-Blancheteau Role of potassium in governing photosynthetic processes and plant yield. In Plant Nutrients and Abiotic Stress Tolerance; Springer: Singapore, 2018; pp. 191–203. [Google Scholar] [CrossRef]
- Sarkar, R.K.; Mahata, K.R.; Singh, D.P. Differential responses of antioxidant system and photosynthetic characteristics in four rice cultivars differing in sensitivity to sodium chloride stress. Acta Physiol. Plant 2013, 35, 2915–2926. [Google Scholar] [CrossRef]
- Gao, Y.; Lu, Y.; Wu, M.; Liang, E.; Li., Y.; Zhang, D.; Yin, Z.; Ren, X.; Dai, Y.; Deng, D.; et al. Ability to remove Na+ and retain K+ correlates with salt tolerance in two maize inbred lines seedlings. Front. Plant Sci. 2016, 7, 1716. [Google Scholar] [CrossRef] [PubMed]
- Hnilickova, H.; Kraus, K.; Vachova, P.; Hnilicka, F. Salinity stress affects photosynthesis, malondialdehyde formation, and proline content in portulaca oleracea L. Plants 2021, 10, 845. [Google Scholar] [CrossRef]
- Lopez-Lopez, R.; Arteaga, R.; Sanchez-Cohen, I.; Ojeda, W.; Gonzalez-Lauck, V. Evapotranspiration and Crop Water Stress Index in Mexican Husk Tomatoes (Physalis ixocarpa Brot) In Evapotranspiration—From Measurements to Agricultural and Environmental Applications; InTech: London, UK, 2011. [Google Scholar] [CrossRef]
- Tian, F.; Hou, M.; Qiu, Y.; Zhang, T.; Yuan, Y. Salinity stress effects on transpiration and plant growth under different salinity soil levels based on thermal infrared remote (TIR) technique. Geoderma 2020, 357, 113961. [Google Scholar] [CrossRef]
- Zhu, X.; Hong, X.; Liu, X.; Li, S.; Yang, J.; Wang, F.; Yue, Y.; Zhang, N.; Si, H. Calcium-dependent protein kinase 32 gene maintains photosynthesis and tolerance of potato in response to salt stress. Sci. Hortic. 2021, 285, 110179. [Google Scholar] [CrossRef]
- Flexas, J.; Ribas-Carbó, M.; Diaz-Espejo, A.; Galmés, J.; Medrano, H. Mesophyll conductance to CO2: Current knowledge and future prospects. Plant Cell Environ. 2008, 31, 602–621. [Google Scholar] [CrossRef]
- Palmieri, F.; Rieder, B.; Ventrella, A.; Blanco, E.; Do, P.T.; Nunes-Nesi, A.; Trauth, A.U.; Flermonte, G.; Tjaden, J.; Angrimi, G.; et al. Molecular identification and functional characterization of Arabidopsis thaliana mitochondrial and chloroplastic NAD+ carrier proteins. J. Biol. Chem. 2009, 284, 31249–31259. [Google Scholar] [CrossRef]
- Hashida, S.N.; Kawai-Yamada, M. Inter-Organelle NAD Metabolism Underpinning Light Responsive NADP Dynamics in Plants. Front. Plant Sci. 2019, 10, 960. [Google Scholar] [CrossRef] [PubMed]
- Mano, J.; Miyatake, F.; Hiraoka, E.; Tamoi, M. Evaluation of the toxicity of stress-related aldehydes to photosynthesis in chloroplasts. Planta 2009, 230, 639–648. [Google Scholar] [CrossRef] [PubMed]
- Kader, M.; Lindberg, S. Cytosolic calcium and pH signaling in plants under salinity stress. Plant Signal. Behav. 2010, 5, 233–238. [Google Scholar] [CrossRef] [PubMed]
- Gao, D.; Knight, M.R.; Trewavas, A.J.; Sattelmacher, B.; Plieth, C. Self-reporting arabidopsis expressing pH and [Ca2+] indicators unveil ion dynamics in the cytoplasm and in the apoplast under abiotic stress. Plant Physiol. 2004, 134, 898–908. [Google Scholar] [CrossRef]
- Pitann, B.; Kranz, T.; Mühling, K.H. The apoplastic pH and its significance in adaptation to salinity in maize (Zea mays L.): Comparison of fluorescence microscopy and pH-sensitive microelectrodes. Plant Sci. 2009, 176, 497–504. [Google Scholar] [CrossRef]
- Felle, H.H. pH Signal and Messenger in Plant Cells. Plant Biol. 2001, 3, 577–591. [Google Scholar] [CrossRef]
- Katsuhara, M.; Yazaki, Y.; Sakano, K.; Kawasaki, T. Intracellular pH and Proton-Transport in Barley Root Cells under Salt Stress: In Vivo 31 P-NMR Study. Plant Cell Physiol. 1997, 38, 155–160. [Google Scholar] [CrossRef]
- Schulte, A.; Lorenzen, I.; Böttcher, M.; Plieth, C. A novel fluorescent pH probe for expression in plants. Plant Methods 2006, 2, 7. [Google Scholar] [CrossRef]
- Oh, D.H.; Lee, S.Y.; Bressan, R.A.; Yun, D.J.; Bohnert, H.J. Intracellular consequences of SOS1 deficiency during salt stress. J. Exp. Bot. 2010, 61, 1205–1213. [Google Scholar] [CrossRef]
- Bose, J.; Xie, Y.; Shen, W.; Shabala, S. Haem oxygenase modifies salinity tolerance in Arabidopsis by controlling K+ retention via regulation of the plasma membrane H+-ATPase and by altering SOS1 transcript levels in roots. J. Exp. Bot. 2013, 64, 471–481. [Google Scholar] [CrossRef] [PubMed]
- Jayakannan, M.; Bose, J.; Babourina, O.; Rengel, Z.; Shabala, S. Salicylic acid improves salinity tolerance in Arabidopsis by restoring membrane potential and preventing salt-induced K+ loss via a GORK channel. J. Exp. Bot. 2013, 64, 2255–2268. [Google Scholar] [CrossRef] [PubMed]
- Tu, Y.; Jiang, A.; Gan, L.; Hossain, M.; Zhang, J.; Peng, B.; Xiong, Y.; Song, Z.; Cai, D.; Xu, W.; et al. Genome duplication improves rice root resistance to salt stress. Rice 2014, 7, 15. [Google Scholar] [CrossRef] [PubMed]
- Geilfus, C.M.; Mühling, K.H.; Kaiser, H.; Plieth, C. Bacterially produced Pt-GFP as ratiometric dual-excitation sensor for in planta mapping of leaf apoplastic pH in intact Avena sativa and Vicia faba. Plant Method 2014, 10, 31. [Google Scholar] [CrossRef] [PubMed]
- Morgan, S.H.; Lindberg, S.; Maity, P.J.; Geilfus, C.M.; Plieth, C.; Mühling, K.H. Calcium improves apoplastic-cytosolic ion homeostasis in salt-stressed Vicia faba leaves. Funct. Plant Biol. 2017, 44, 515–524. [Google Scholar] [CrossRef]
- Fuglsang, A.T.; Gao, Y.; Cuin, T.A.; Qiu, Q.; Song, C.; Kristiansen, K.A.; Bych, K.; Schilz, A.; Shabala, S.; Schumaker, K.S.; et al. Arabidopsis protein kinase PKS5 inhibits the plasma membrane H+-ATPase by preventing interaction with 14-3-3 protein. Plant Cell 2007, 19, 1617–1634. [Google Scholar] [CrossRef] [PubMed]
- De Nisi, P.; Dell’Orto, M.; Pirovano, L.; Zocchi, G. Calcium-dependent phosphorylation regulates the plasma membrane H+-ATPase activity of maize (Zea mays L.) roots. Planta 1999, 209, 187–194. [Google Scholar] [CrossRef]
- Demidchik, V.; Cuin, T.A.; Svistunenko, D.; Smith, S.J.; Miller, A.J.; Shabala, S.; Sokolik, A.; Yurin, V. Arabidopsis root K+-efflux conductance activated by hydroxyl radicals: Single-channel properties, genetic basis and involvement in stress-induced cell death. J. Cell Sci. 2010, 123, 1468–1479. [Google Scholar] [CrossRef]
- Blumwald, E. Sodium transport and salt tolerance in plants. Curr. Opin. Cell Biol. 2000, 12, 431–434. [Google Scholar] [CrossRef]
- Yamaguchi, T.; Apse, M.P.; Shi, H.; Blumwald, E. Topological analysis of a plant vacuolar Na+/H+ antiporter reveals a luminal C terminus that regulates antiporter cation selectivity. Proc. Natl. Acad. Sci. USA 2003, 100, 12510–12515. [Google Scholar] [CrossRef]
- Jiang, Z.; Zhou, X.; Tao, M.; Yuan, F.; Liu, L.; Wu, F.; Wu, X.; Xiang, Y.; Niu, Y.; Liu, F.; et al. Plant cell-surface GIPC sphingolipids sense salt to trigger Ca2+ influx. Nature 2019, 572, 341–346. [Google Scholar] [CrossRef] [PubMed]
- Ismail, A.; El-Sharkawy, I.; Sherif, S. Salt stress signals on demand: Cellular events in the right context. Intern. J. Mol. Sci. 2020, 21, 3918. [Google Scholar] [CrossRef] [PubMed]
- Wang, R.; Chen, S.; Zhou, X.; Shen, X.; Deng, L.; Zhu, H.; Shao, J.; Shi, Y.; Dai, S.; Fritz, E.; et al. Ionic homeostasis and reactive oxygen species control in leaves and xylem sap of two poplars subjected to NaCl stress. Physiology 2008, 28, 947–957. [Google Scholar] [CrossRef] [PubMed]
- Bose, J.; Rodrigo-Moreno, A.; Lai, D.; Xie, Y.; Shen, W.; Shabala, S. Rapid regulation of the plasma membrane H+-ATPase activity is essential to salinity tolerance in two halophyte species, Atriplex lentiformis and Chenopodium quinoa. Ann. Bot. 2015, 115, 481–494. [Google Scholar] [CrossRef]
- Khanna-Chopra, R. Leaf senescence and abiotic stresses share reactive oxygen species-mediated chloroplast degradation. Protoplasma 2012, 249, 469–481. [Google Scholar] [CrossRef]
- Mayta, M.L.; Hajirezaei, M.R.; Carrillo, N.; Lodeyro, A.F. Leaf senescence: The chloroplast connection comes of age. Plants 2019, 8, 495. [Google Scholar] [CrossRef]
- Ruberti, C.; Barizza, E.; Bodher, M.; la Rocca, N.; de Michelle, R.; Carimi, F.; lo Schiavo, F.; Zottini, M. Mitochondria change dynamics and morphology during grapevine leaf senescence. PLoS ONE 2014, 9, e102012. [Google Scholar] [CrossRef]
- Liu, J.; Ji, Y.; Zhou, J.; Xing, D. Phosphatidylinositol 3-kinase promotes V-ATPase activation and vacuolar acidification and delays methyl jasmonate-induced leaf senescence. Plant Physiol. 2016, 170, 1714–1731. [Google Scholar] [CrossRef]
- Gitelson, A.A.; Gritz, Y.; Merzlyak, M.N. Relationships between leaf chlorophyll content and spectral reflectance and algorithms for non-destructive chlorophyll assessment in higher plant leaves. J. Plant Physiol. 2003, 160, 271–282. [Google Scholar] [CrossRef]
- Pecherina, A.; Grinberg, M.; Ageyeva, M.; Zdobnova, T.; Ladeynova, M.; Yudintsev, A.; Vodeneev, V.; Brilkina, A. Whole-plant measure of temperature-induced changes in the cytosolic ph of potato plants using genetically encoded fluorescent sensor Pt-GFP. Agriculture 2021, 11, 1131. [Google Scholar] [CrossRef]
- Schindelin, J.; Arganda-Carreras, I.; Frise, E.; Kaynig, V.; Longair, M.; Pietzsch, T.; Preibisch, S.; Rueden, C.; Saalfeld, S.; Schmid, B.; et al. Fiji: An open-source platform for biological-image analysis. Nat. Method 2012, 9, 676–682. [Google Scholar] [CrossRef] [PubMed]
- Jackson, R.D.; Idso, S.B.; Reginato, R.J.; Pinter, P.J. Canopy temperature as a crop water stress indicator. Water Resour. Res. 1981, 17, 1133–1138. [Google Scholar] [CrossRef]


Disclaimer/Publisher’s Note: The statements, opinions and data contained in all publications are solely those of the individual author(s) and contributor(s) and not of MDPI and/or the editor(s). MDPI and/or the editor(s) disclaim responsibility for any injury to people or property resulting from any ideas, methods, instructions or products referred to in the content. |
© 2022 by the authors. Licensee MDPI, Basel, Switzerland. This article is an open access article distributed under the terms and conditions of the Creative Commons Attribution (CC BY) license (https://creativecommons.org/licenses/by/4.0/).
Share and Cite
Pecherina, A.; Grinberg, M.; Ageyeva, M.; Zanegina, D.; Akinchits, E.; Brilkina, A.; Vodeneev, V. Salt-Induced Changes in Cytosolic pH and Photosynthesis in Tobacco and Potato Leaves. Int. J. Mol. Sci. 2023, 24, 491. https://doi.org/10.3390/ijms24010491
Pecherina A, Grinberg M, Ageyeva M, Zanegina D, Akinchits E, Brilkina A, Vodeneev V. Salt-Induced Changes in Cytosolic pH and Photosynthesis in Tobacco and Potato Leaves. International Journal of Molecular Sciences. 2023; 24(1):491. https://doi.org/10.3390/ijms24010491
Chicago/Turabian StylePecherina, Anna, Marina Grinberg, Maria Ageyeva, Daria Zanegina, Elena Akinchits, Anna Brilkina, and Vladimir Vodeneev. 2023. "Salt-Induced Changes in Cytosolic pH and Photosynthesis in Tobacco and Potato Leaves" International Journal of Molecular Sciences 24, no. 1: 491. https://doi.org/10.3390/ijms24010491
APA StylePecherina, A., Grinberg, M., Ageyeva, M., Zanegina, D., Akinchits, E., Brilkina, A., & Vodeneev, V. (2023). Salt-Induced Changes in Cytosolic pH and Photosynthesis in Tobacco and Potato Leaves. International Journal of Molecular Sciences, 24(1), 491. https://doi.org/10.3390/ijms24010491