
Novel Antibacterial Copolymers Based on Quaternary Ammonium Urethane-Dimethacrylate Analogues and Triethylene Glycol Dimethacrylate


Abstract
1. Introduction
2. Results
2.1. Properties of Liquid Monomer Compositions
2.2. Properties of Copolymers
2.2.1. Physicochemical Properties
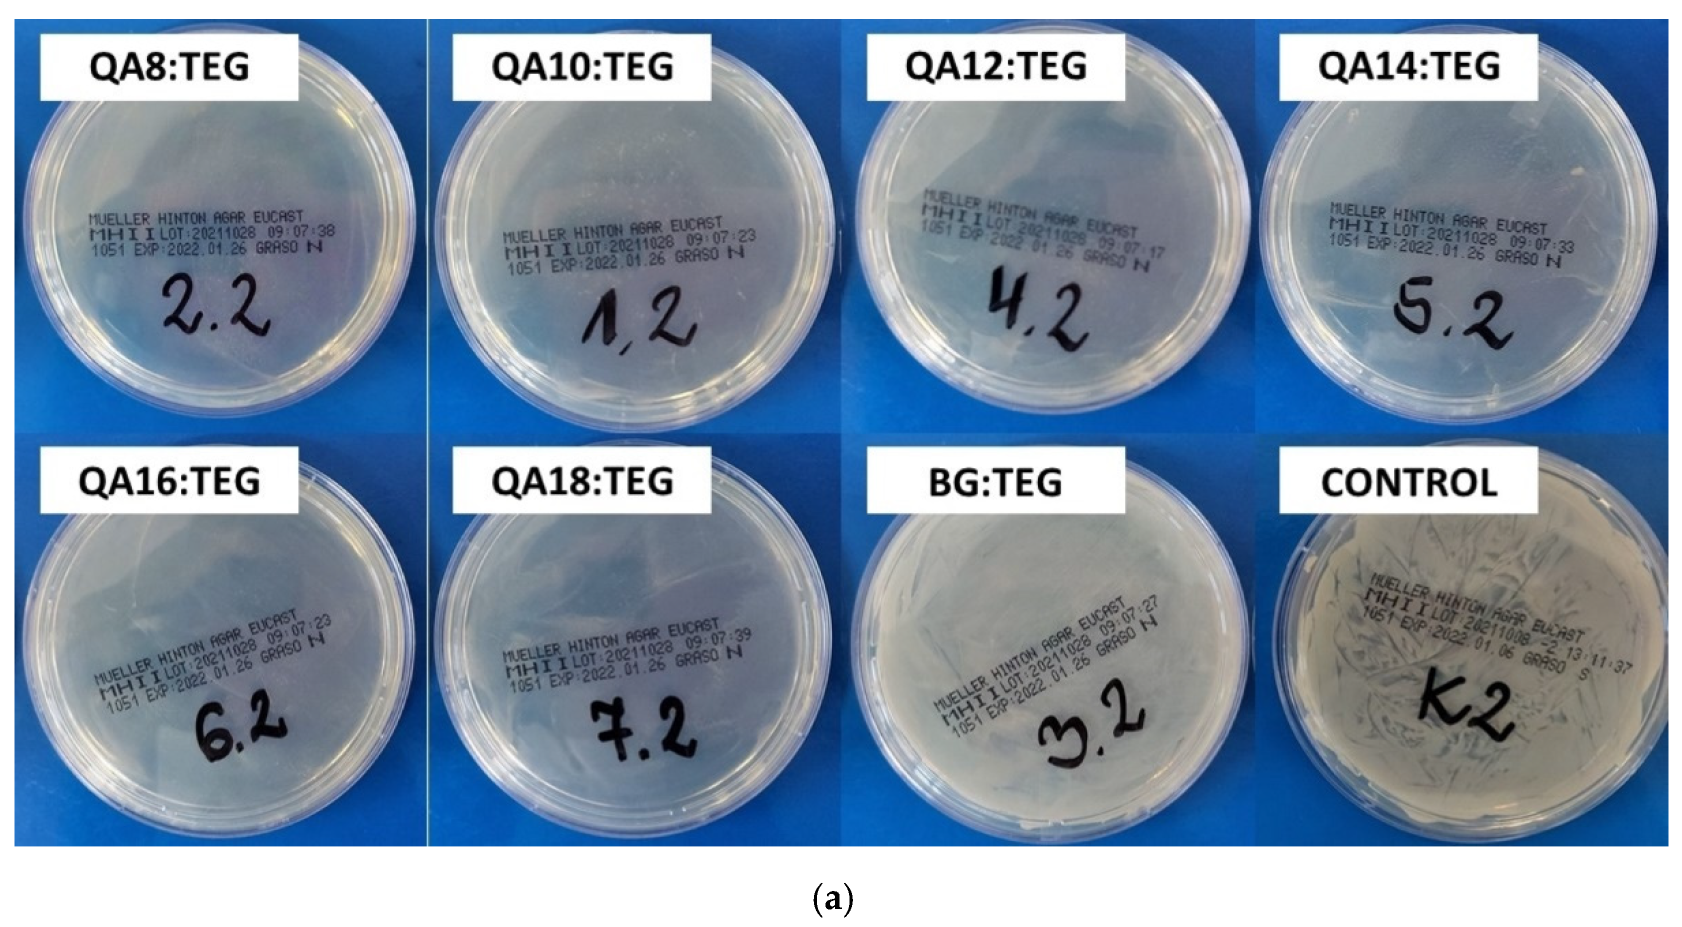
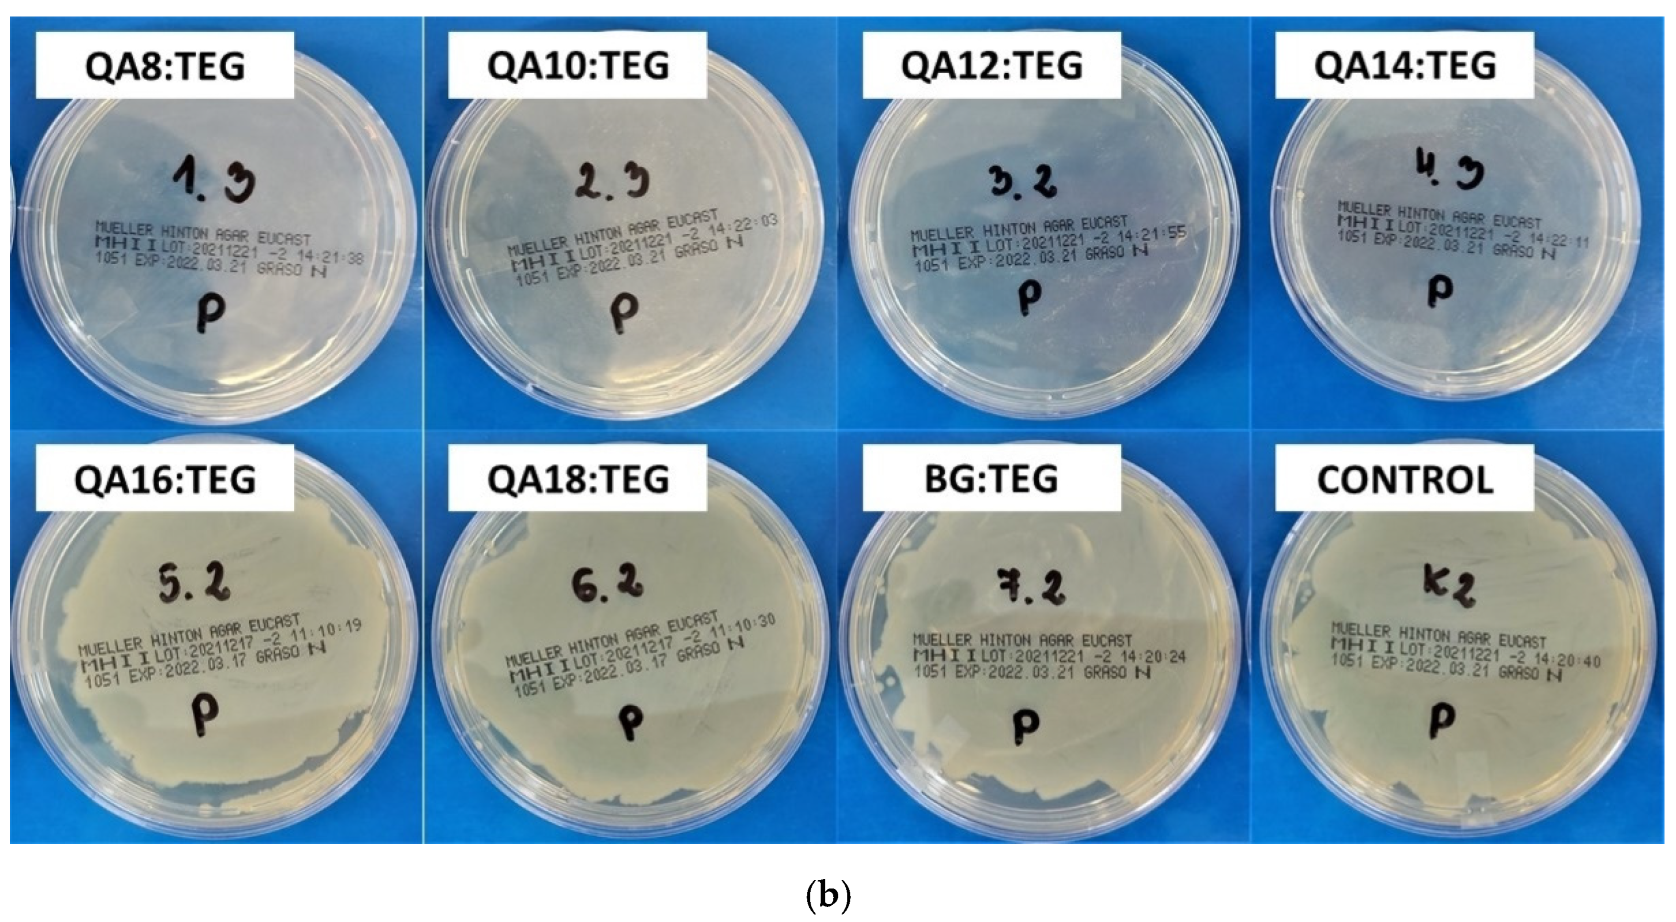
2.2.2. Antibacterial Properties
3. Discussion
3.1. Properties of Liquid Monomer Compositions
3.2. Properties of Copolymers
3.2.1. Physicochemical Properties
3.2.2. Antibacterial Properties
4. Materials and Methods
4.1. Chemicals and Reagents
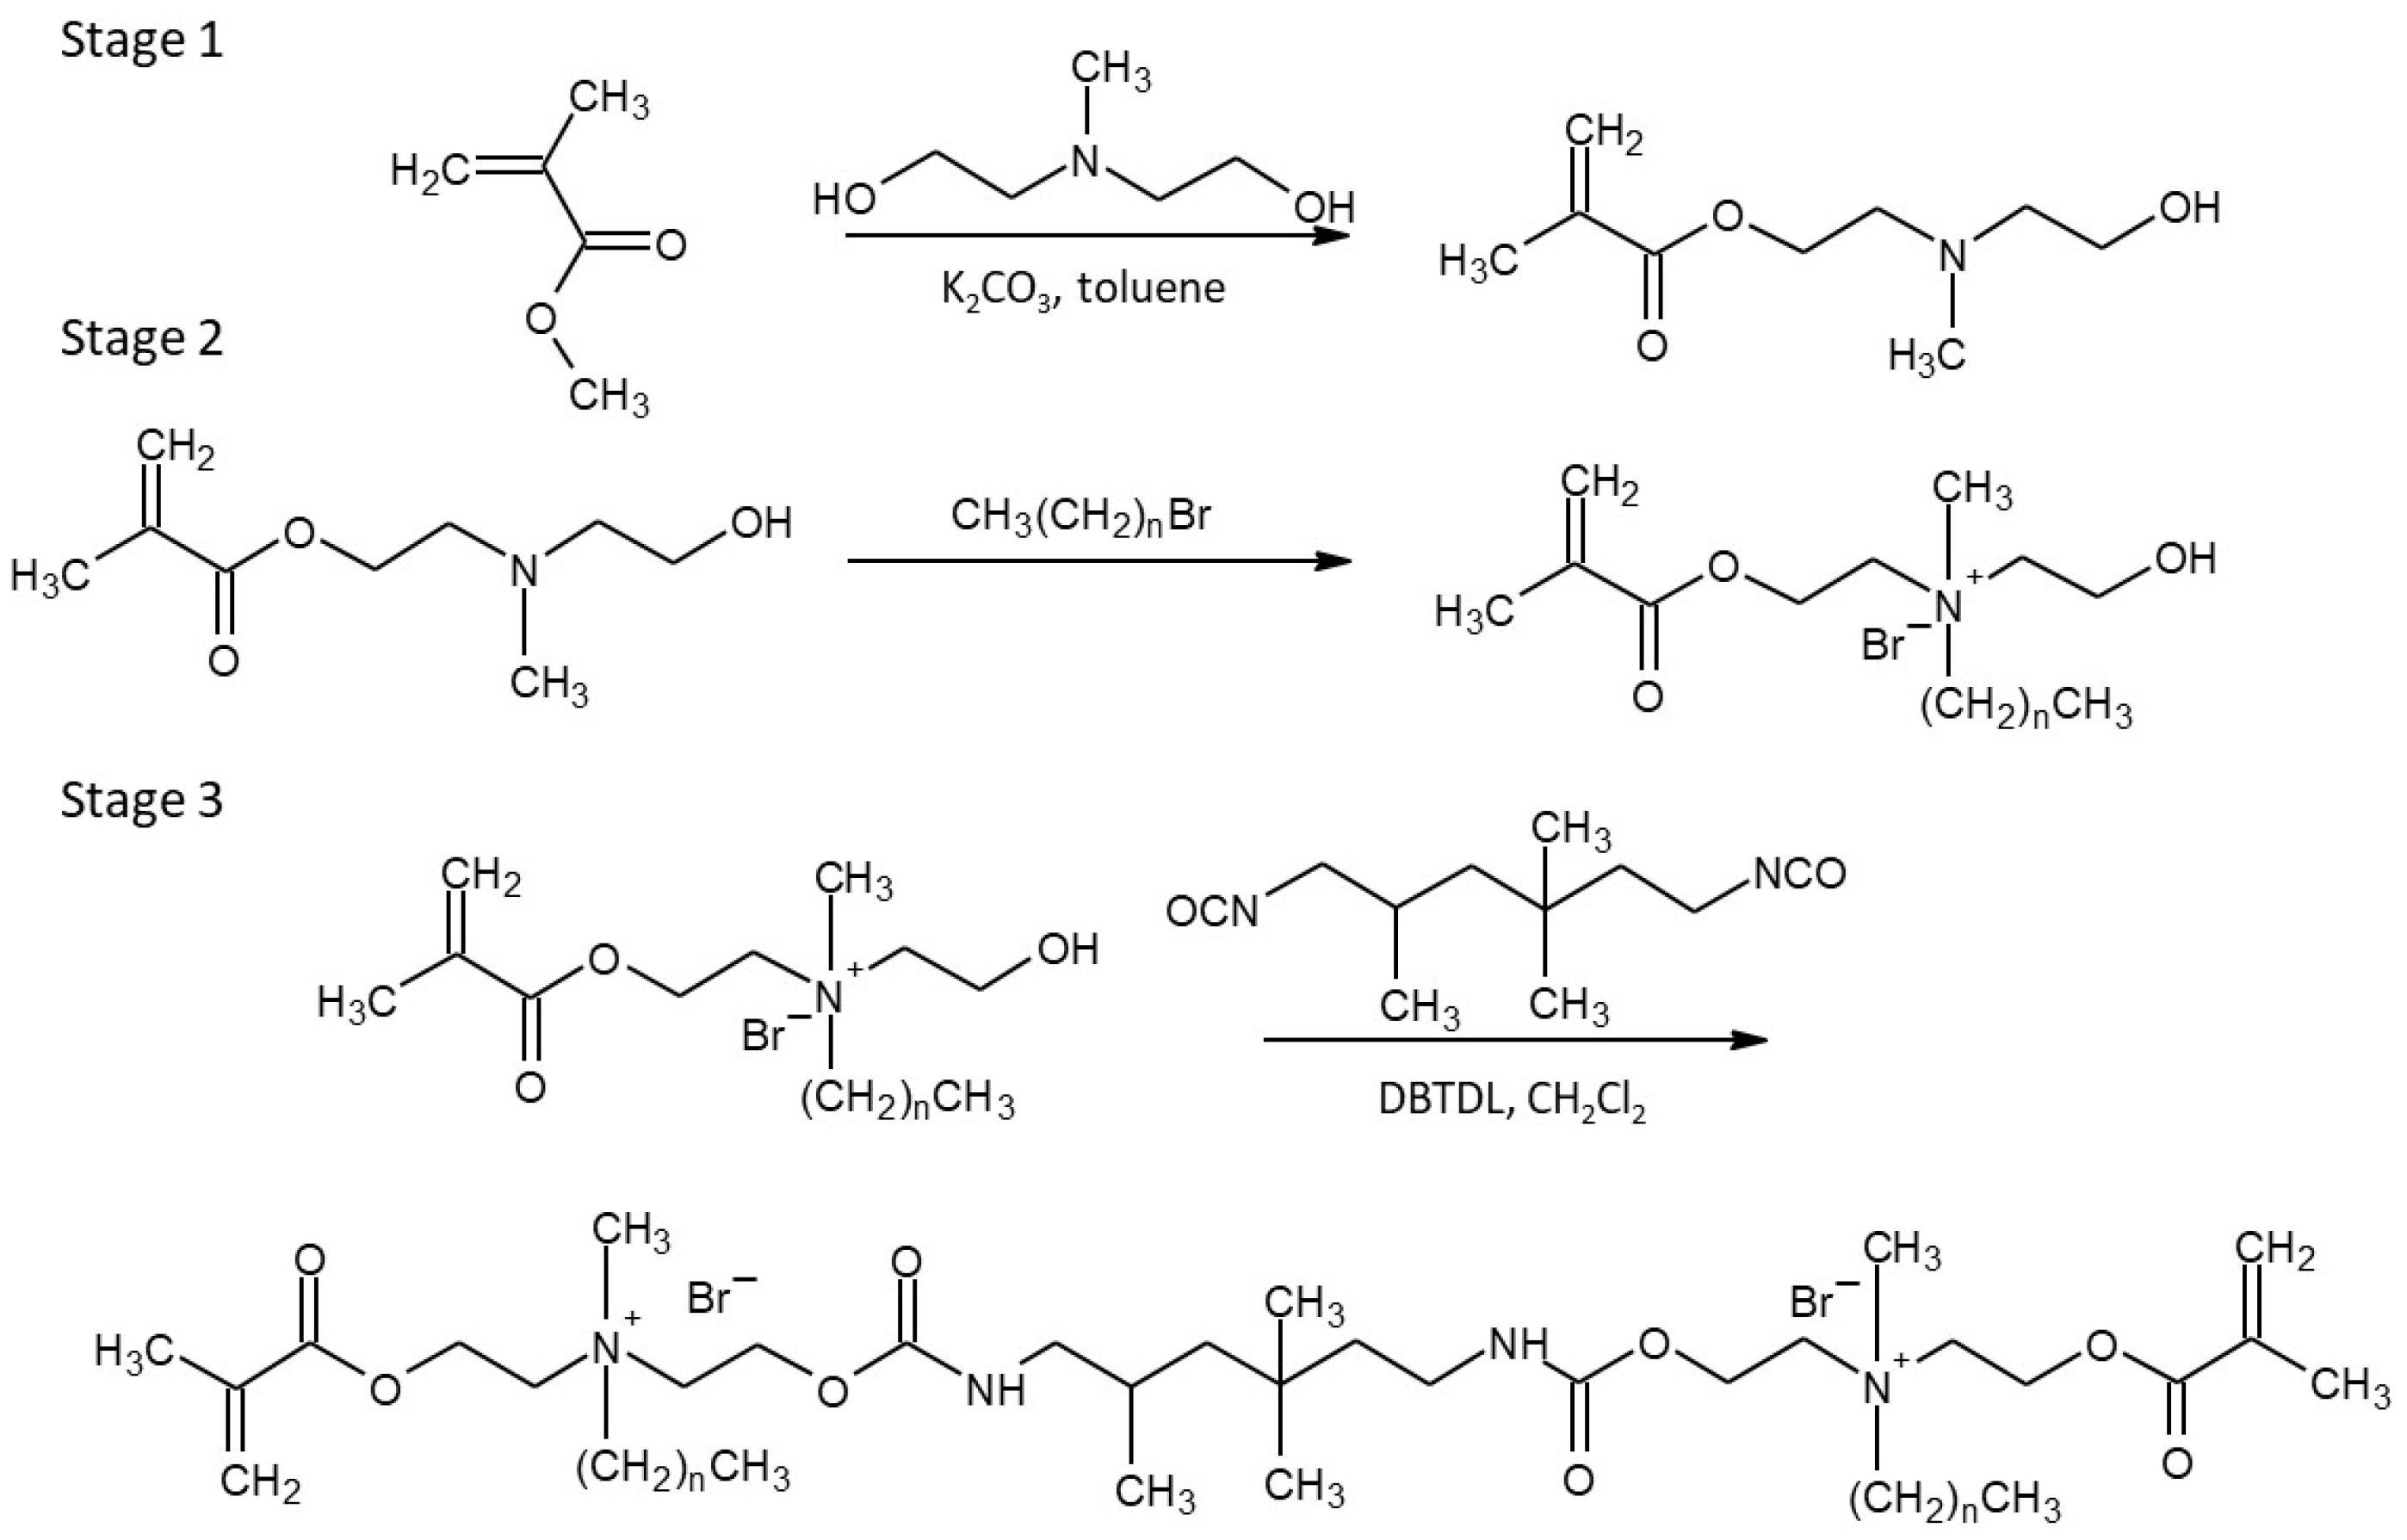
4.2. Monomers Synthesis
4.3. Sample Preparation
- Square-shaped glass molds (90 mm × 90 mm × 4 mm (length × width × thickness));
- Disc-like Teflon molds (15 mm × 1.5 mm (diameter × thickness));
- Disc-like Teflon molds (10 mm × 3 mm (diameter × thickness)).
4.4. Physicochemical Properties
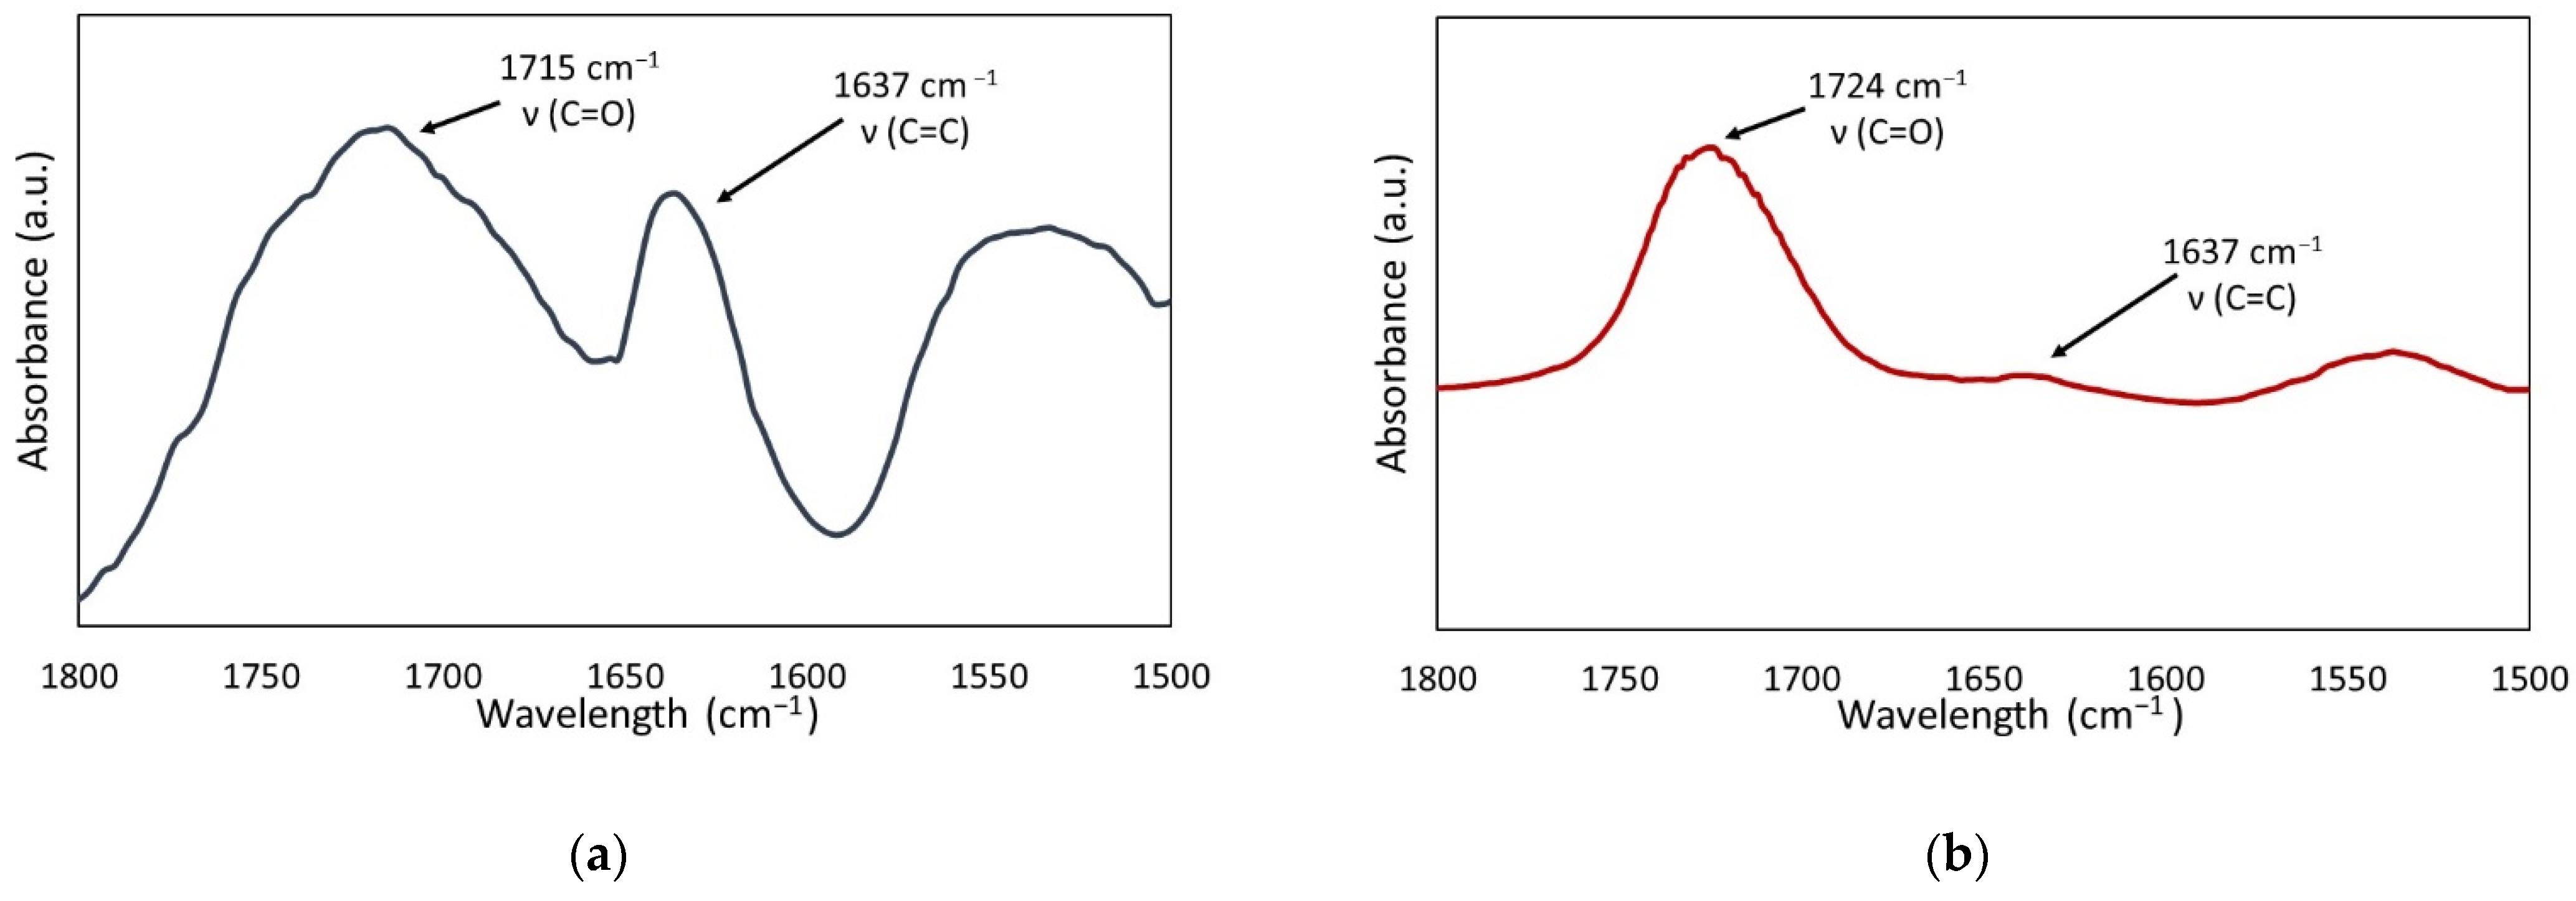
4.4.1. Degree of Conversion
- AC=C—the absorption intensity of the band, corresponding to the carbon-carbon double bond stretching vibrations, at 1637 cm−1,
- AC=O—the absorption intensity of the band, corresponding to the carbonyl group stretching vibrations, at 1715 cm−1.
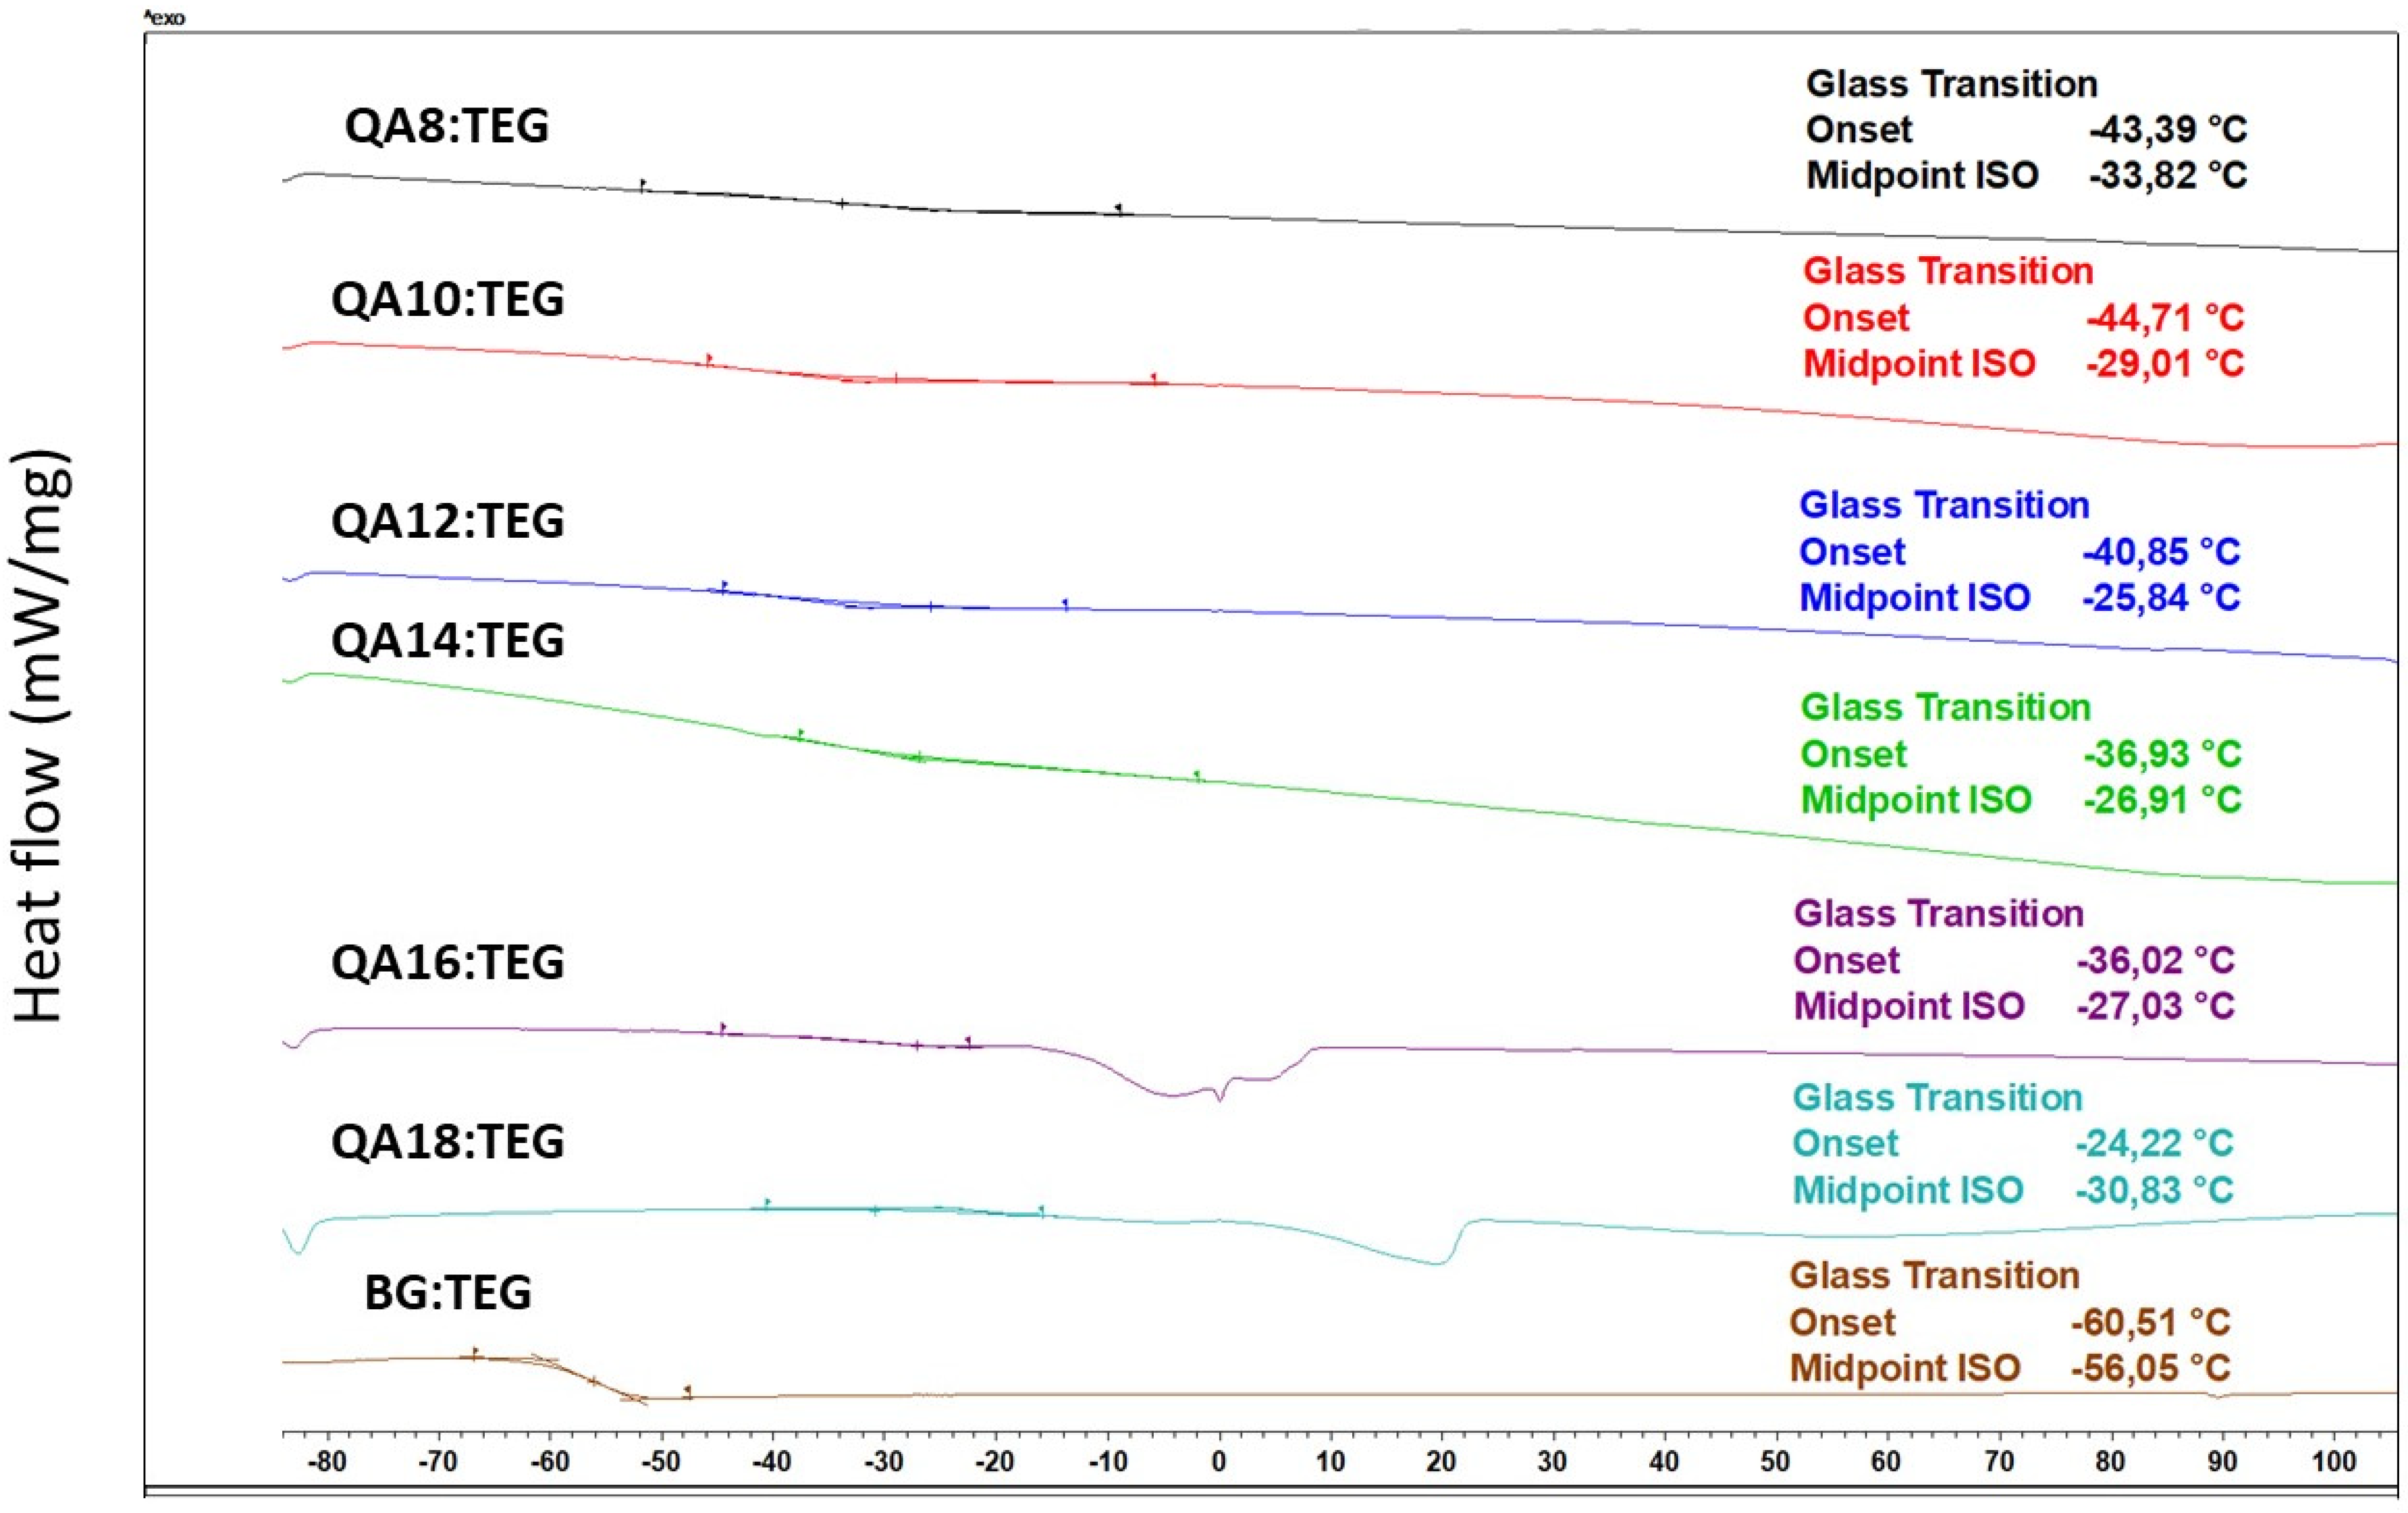
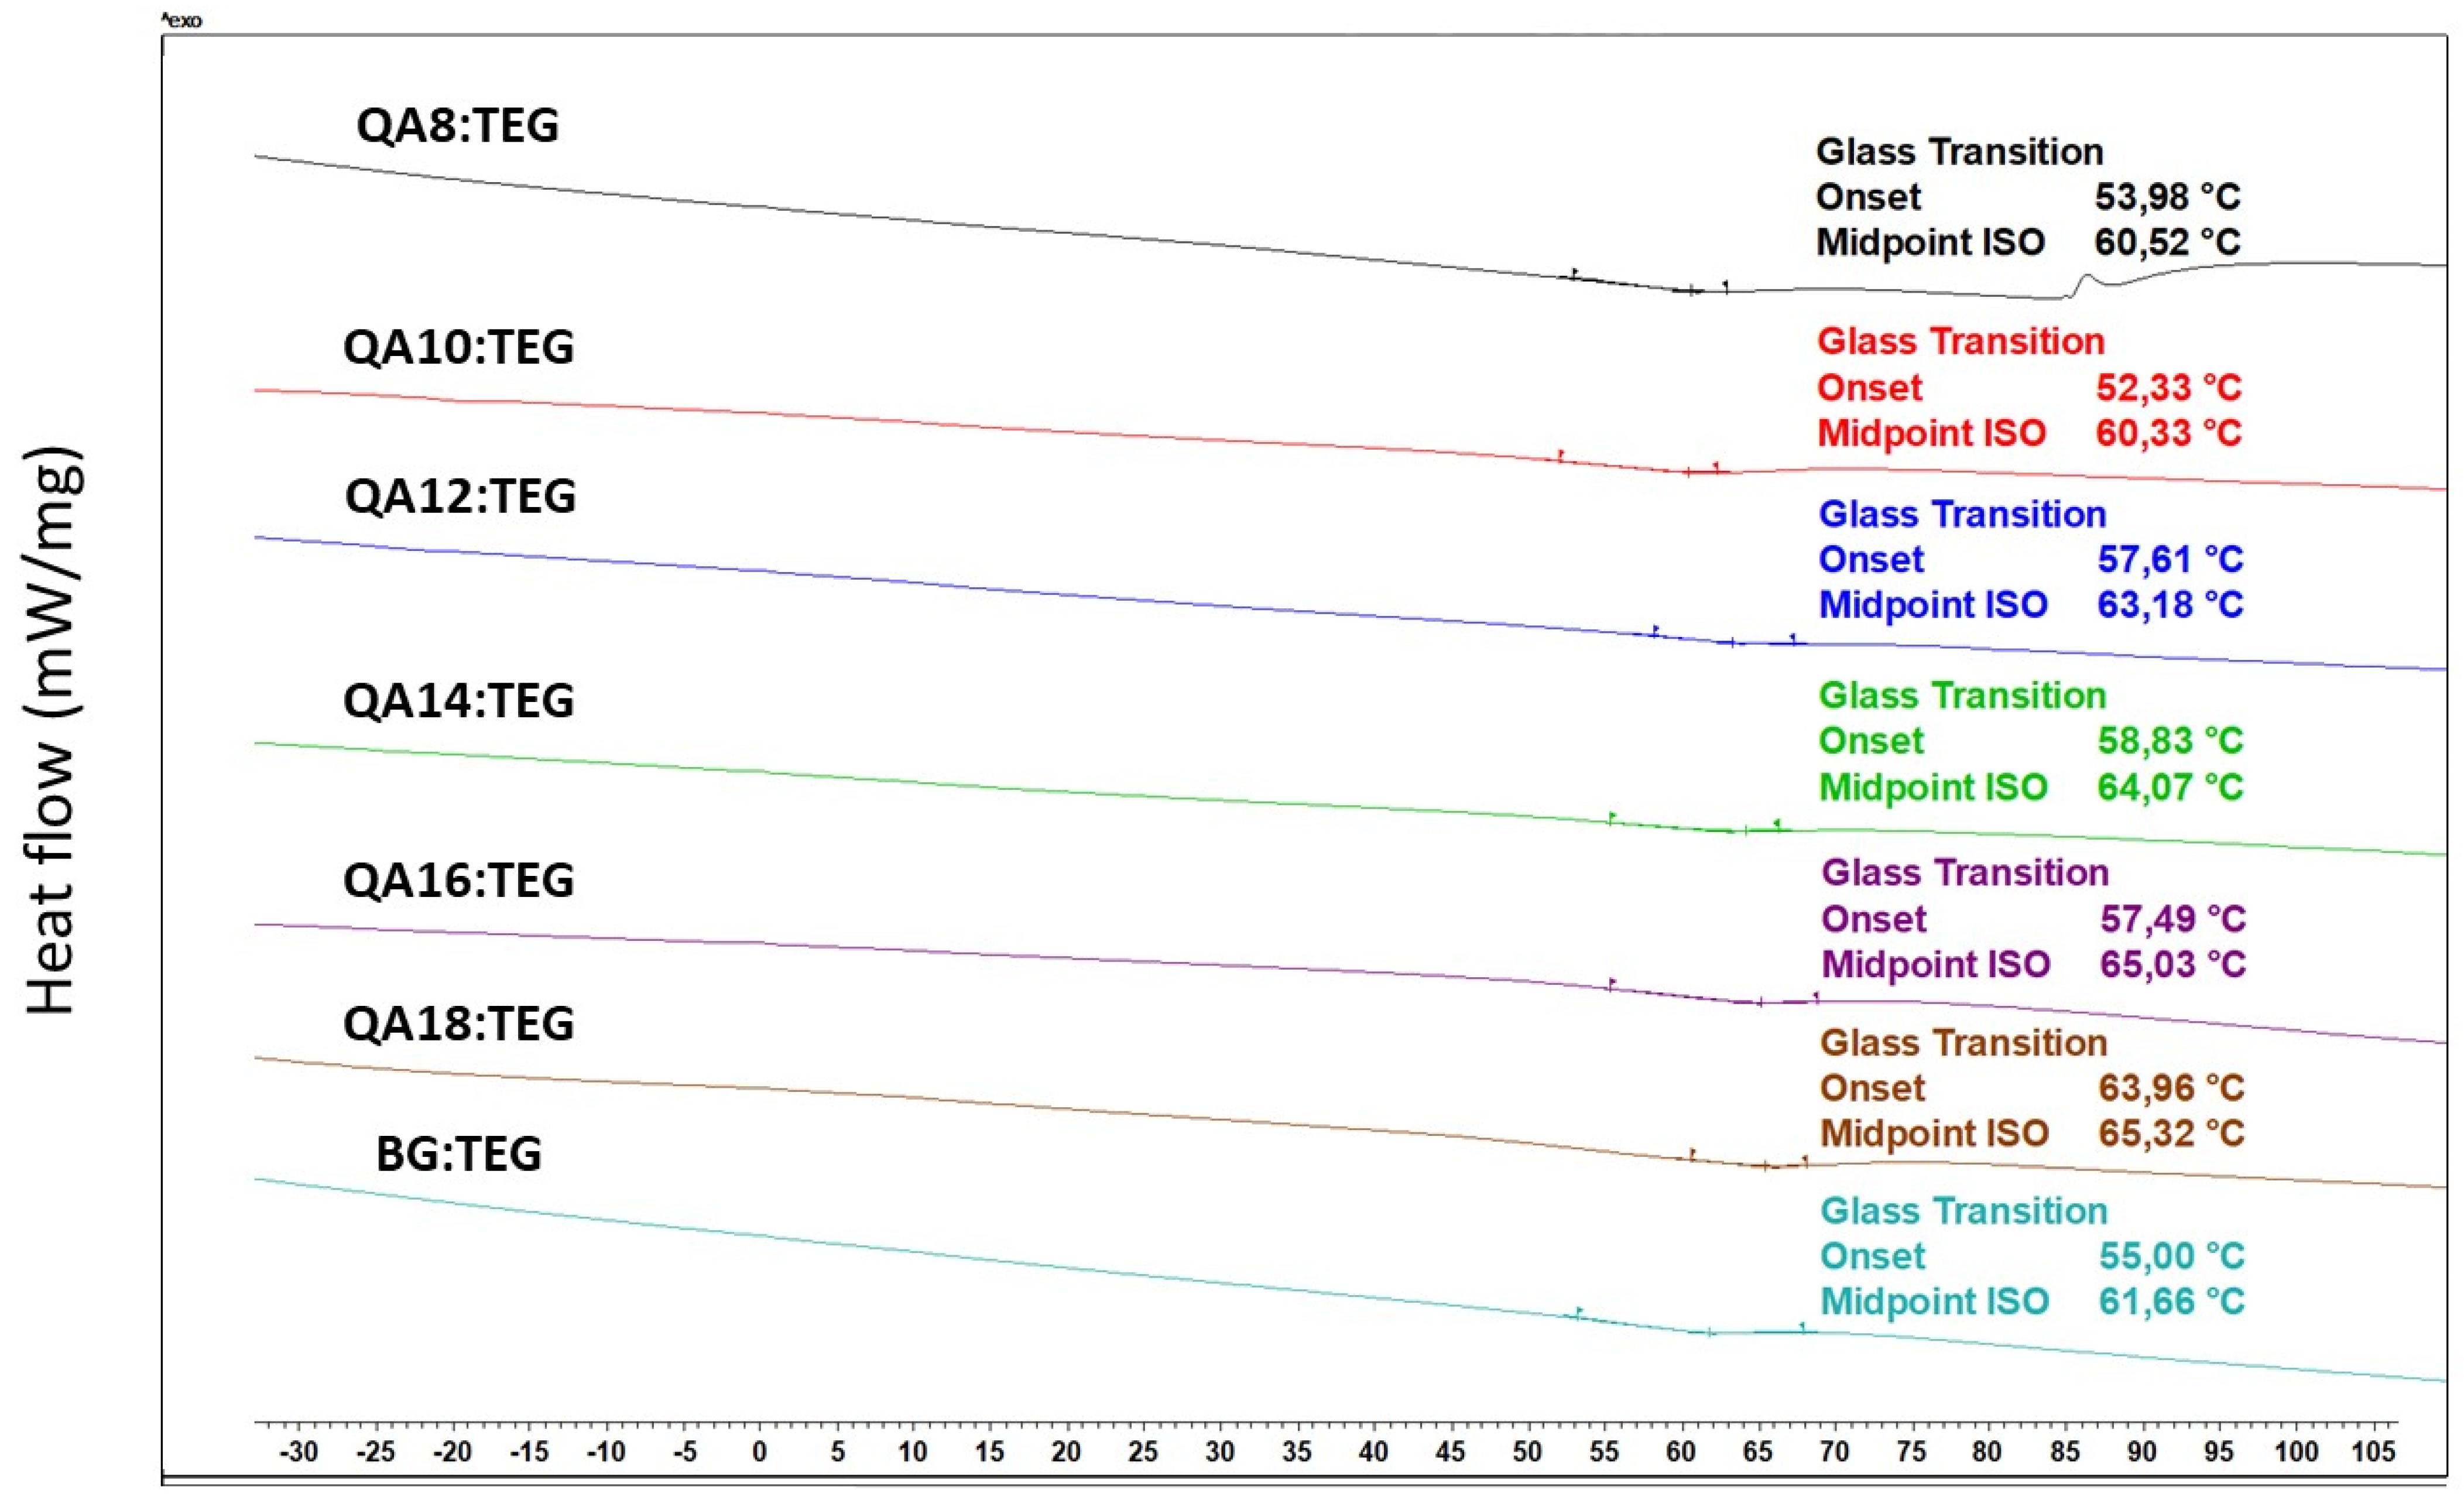
4.4.2. Glass Transition Temperature
4.4.3. Density and Polymerization Shrinkage
- dm—the liquid monomer composition density,
- dp—the copolymer density.
- MW—the molecular weight of liquid monomer composition,
- dm—the liquid monomer composition density,
- ΔV—the decrease in molar volume of one methacrylate group due to its polymerization (ΔV = 22.5 cm3/mol [3]),
- f—the number of methacrylate groups in the monomer molecule (f = 2).
4.4.4. Refractive Index
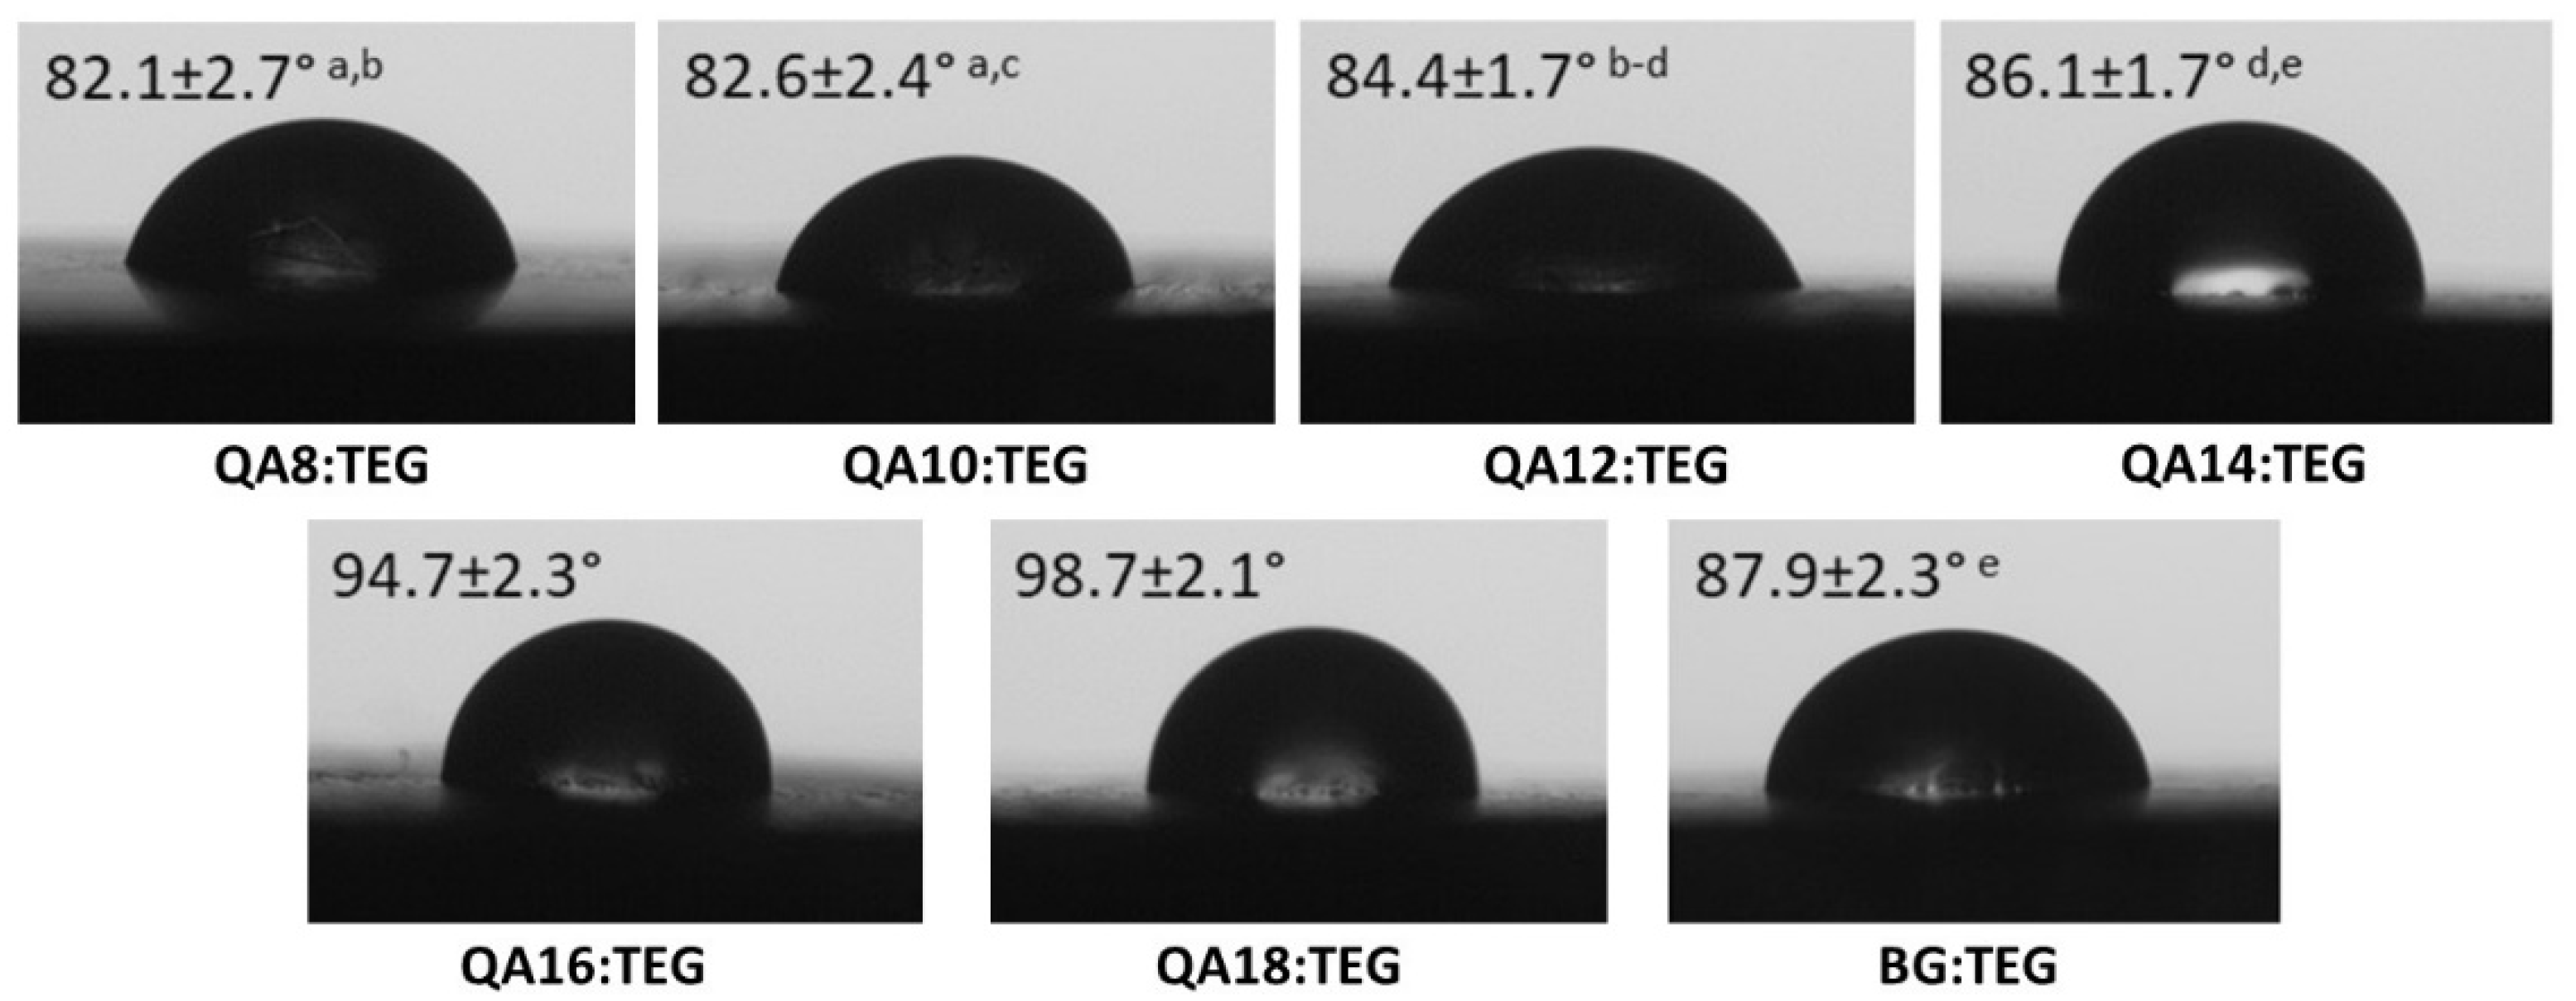
4.4.5. Water Contact Angle
4.5. Antibacterial Properties
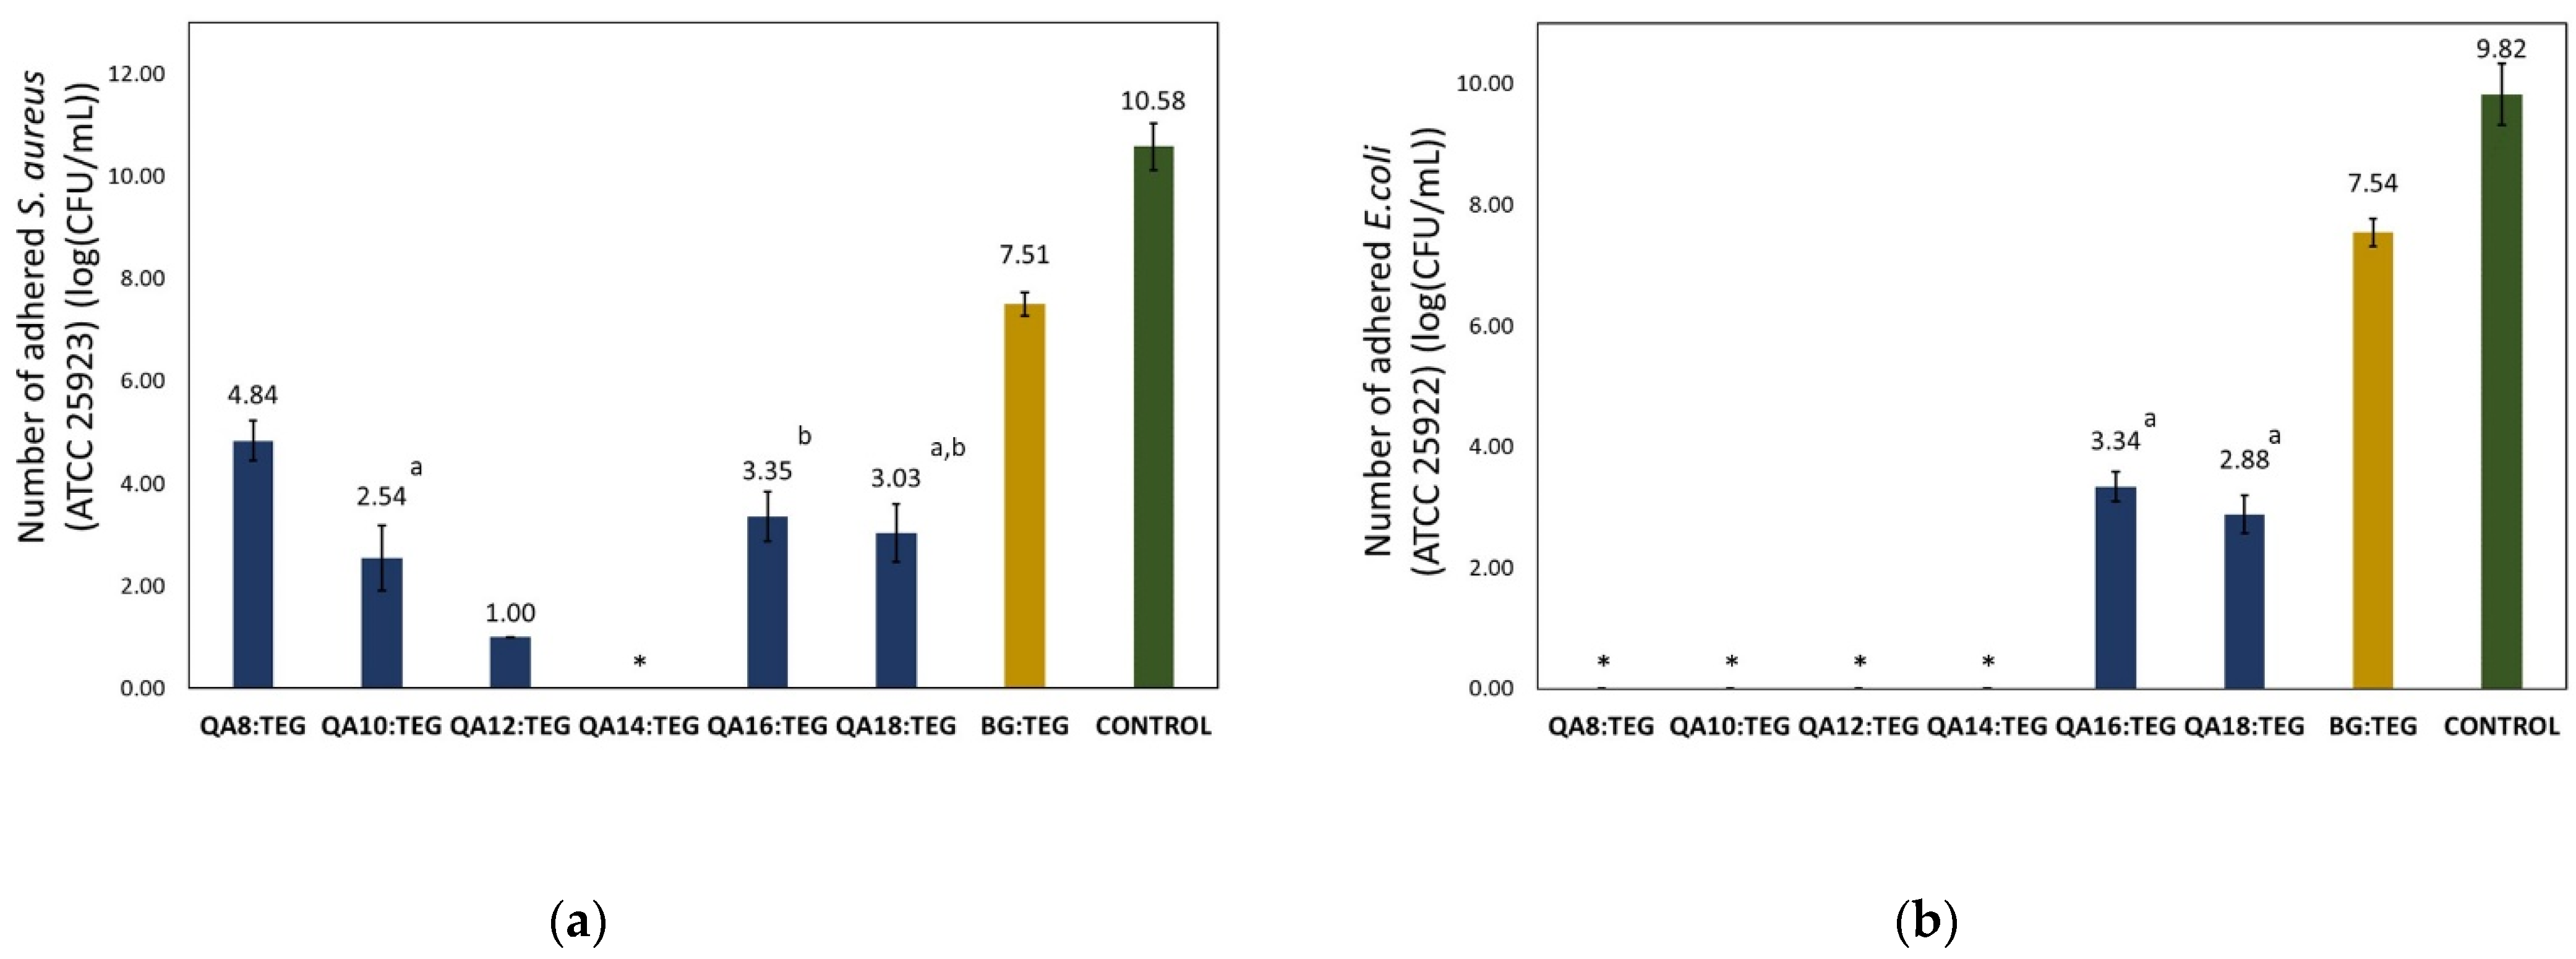
4.5.1. Bacterial Adhesion
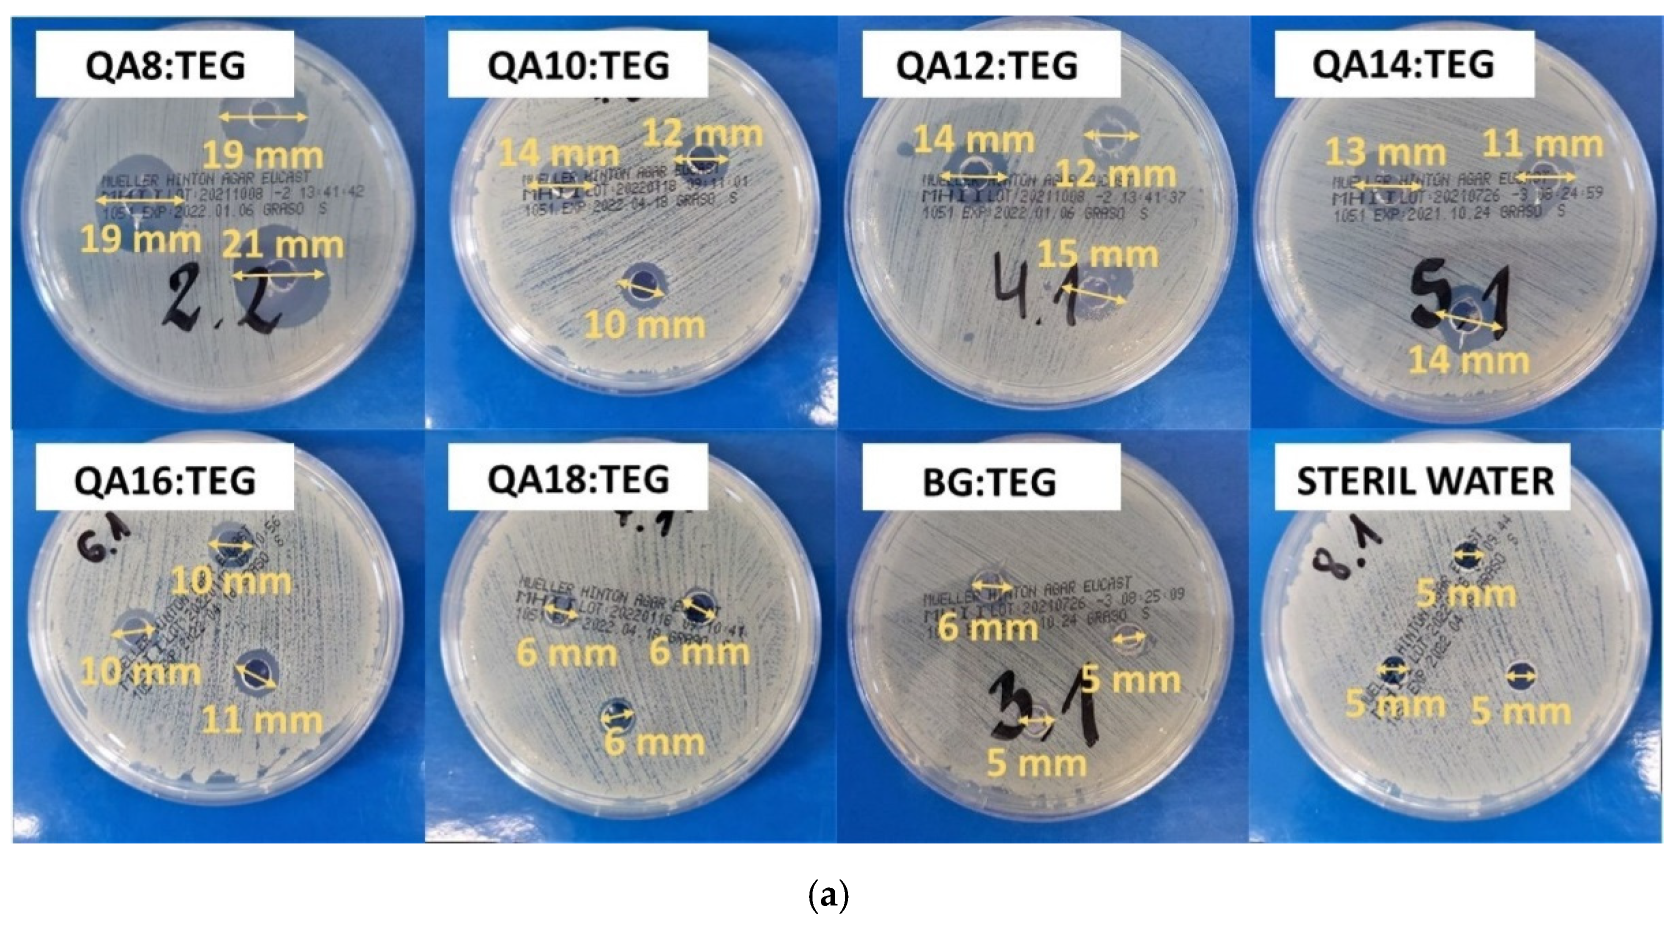
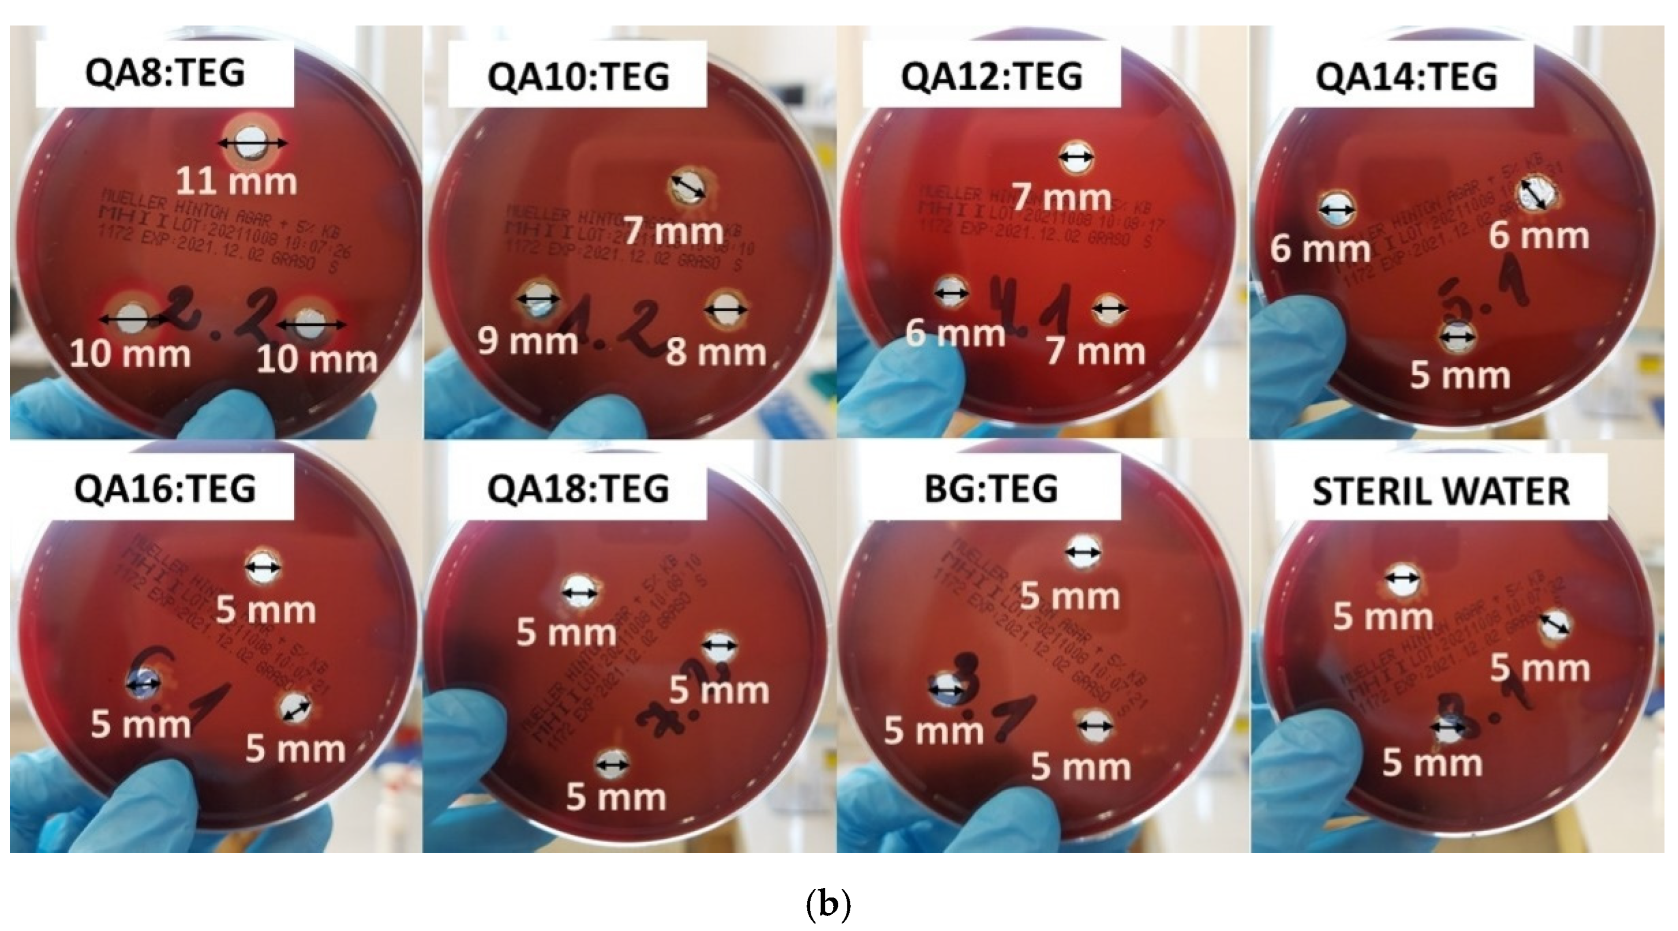
4.5.2. Inhibition Zone
4.5.3. Bacterial Cell Proliferation
4.6. Statistical Analysis
5. Conclusions
Author Contributions
Funding
Institutional Review Board Statement
Informed Consent Statement
Data Availability Statement
Conflicts of Interest
References
- Bowen, R.L. Dental Filling Material Comprising Vinyl Silane Treated Fused Silica and a Binder Consisting of the Reaction Product of Bis Phenol and Glycidyl Acrylate. U.S. Patent 3,066,112A, 26 June 1692. [Google Scholar]
- Dursun, E.; Fron-Chabouis, H.; Attal, J.P.; Raskin, A. Bisphenol A Release: Survey of the Composition of Dental Composite Resins. Open Dent. J. 2016, 10, 446–453. [Google Scholar] [CrossRef] [PubMed]
- Watts, D.C. Adhesives and Sealants. In Biomaterials Science: An Introduction to Materials, 3rd ed.; Ratner, B., Hoffman, A., Schoen, F., Lemons, J., Eds.; Elsevier Inc.: Amsterdam, The Netherlands, 2013; pp. 889–904. [Google Scholar]
- Lin, G.S.S.; Abdul Ghani, N.R.N.; Ismail, N.H.; Singbal, K.P.; Yusuff, N.M.M. Polymerization Shrinkage and Degree of Conversion of New Zirconia-Reinforced Rice Husk Nanohybrid Composite. Eur. J. Dent. 2020, 14, 448–455. [Google Scholar] [CrossRef] [PubMed]
- Pratap, B.; Gupta, R.K.; Bhardwaj, B.; Nag, M. Resin Based Restorative Dental Materials: Characteristics and Future Perspectives. Jpn. Dent. Sci. Rev. 2019, 55, 126–138. [Google Scholar] [CrossRef] [PubMed]
- Hamama, H.H. Recent Advances in Posterior Resin Composite Restorations. In Applications of Nanocomposite Materials in Dentistry; Asiri, A.M., Inamuddin, M.A., Eds.; Elsevier Inc.: Amsterdam, The Netherlands, 2018; pp. 319–336. [Google Scholar]
- Pałka, K.; Janiczuk, P.; Kleczewska, J. Polymerization Shrinkage of Resin Mixtures Used in Dental Composites. Eng. Biomater. 2020, 154, 16–21. [Google Scholar] [CrossRef]
- Delaviz, Y.; Finer, Y.; Santerre, J.P. Biodegradation of Resin Composites and Adhesives by Oral Bacteria and Saliva: A Rationale for New Material Designs That Consider the Clinical Environment and Treatment Challenges. Dent. Mater. 2014, 30, 16–32. [Google Scholar] [CrossRef] [PubMed]
- Spencer, P.; Ye, Q.; Misra, A.; Goncalves, S.E.P.; Laurence, J.S. Proteins, Pathogens, and Failure at the Composite-Tooth Interface. J. Dent. Res. 2014, 93, 1243–1249. [Google Scholar] [CrossRef] [PubMed]
- Ali, S.; Sangi, L.; Kumar, N.; Kumar, B.; Khurshid, Z.; Zafar, M.S. Evaluating Antibacterial and Surface Mechanical Properties of Chitosan Modified Dental Resin Composites. Technol. Health Care 2020, 28, 165–173. [Google Scholar] [CrossRef] [PubMed]
- Bourbia, M.; Ma, D.; Cvitkovitch, D.G.; Santerre, J.P.; Finer, Y. Cariogenic Bacteria Degrade Dental Resin Composites and Adhesives. J. Dent. Res. 2013, 92, 989–994. [Google Scholar] [CrossRef]
- Kuper, N.K.; Van De Sande, F.H.; Opdam, N.J.M.; Bronkhorst, E.M.; De Soet, J.J.; Cenci, M.S.; Huysmans, M.C.D.J.N.M. Restoration Materials and Secondary Caries Using an in Vitro Biofilm Model. J. Dent. Res. 2015, 94, 62–68. [Google Scholar] [CrossRef]
- Zhang, N.; Melo, M.A.S.; Weir, M.D.; Reynolds, M.A.; Bai, Y.; Xu, H.H.K. Do Dental Resin Composites Accumulate More Oral Biofilms and Plaque than Amalgam and Glass Ionomer Materials? Materials 2016, 9, 888. [Google Scholar] [CrossRef]
- Forssten, S.D.; Björklund, M.; Ouwehand, A.C. Streptococcus Mutans, Caries and Simulation Models. Nutrients 2010, 2, 290–298. [Google Scholar] [CrossRef]
- Halpin, R.M.; O’Connor, M.M.; McMahon, A.; Boughton, C.; O’Riordan, E.D.; O’Sullivan, M.; Brady, D.B. Role of Streptococcus Mutans in Human Dental Decay. Eur. Food Res. Technol. 2008, 227, 353–380. [Google Scholar] [CrossRef][Green Version]
- Ghazal, T.S.; Levy, S.M.; Childers, N.K.; Carter, K.D.; Caplan, D.J.; Warren, J.J.; Cavanaugh, J.E.; Kolker, J. Mutans Streptococci and Dental Caries: A New Statistical Modeling Approach. Caries Res. 2018, 52, 246–252. [Google Scholar] [CrossRef]
- Fan, D.Y.; Yi, Z.; Feng, X.; Tian, W.Z.; Xu, D.K.; Valentino, A.M.C.; Wang, Q.; Sun, H.C. Antibacterial property of a gradient Cu-bearing titanium alloy by laser additive manufacturing. Rare Met. 2022, 41, 580–593. [Google Scholar] [CrossRef]
- Ferracane, J.L. Resin-Based Composite Performance: Are There Some Things We Can’t Predict? Dent. Mater. 2013, 29, 51–58. [Google Scholar] [CrossRef]
- Nedeljkovic, I.; De Munck, J.; Vanloy, A.; Declerck, D.; Lambrechts, P.; Peumans, M.; Teughels, W.; Van Meerbeek, B.; Van Landuyt, K.L. Secondary Caries: Prevalence, Characteristics, and Approach. Clin. Oral Investig. 2020, 24, 683–691. [Google Scholar] [CrossRef]
- DeRouen, T.A.; Martin, M.D.; Leroux, B.G.; Townes, B.D.; Woods, J.S.; Leitão, J.; Castro-Caldas, A.; Luis, H.; Bernardo, M.; Rosenbaum, G.; et al. Neurobehavioral Effects of Dental Amalgam in Children. Jama 2006, 295, 1784. [Google Scholar] [CrossRef]
- Huang, L.; Xiao, Y.H.; Xing, X.D.; Li, F.; Ma, S.; Qi, L.L.; Chen, J.H. Antibacterial Activity and Cytotoxicity of Two Novel Cross-Linking Antibacterial Monomers on Oral Pathogens. Arch. Oral Biol. 2011, 56, 367–373. [Google Scholar] [CrossRef]
- Imazato, S.; Kinomoto, Y.; Tarumi, H.; Torii, M.; Russell, R.R.B.; McCabe, J.F. Incorporation of Antibacterial Monomer MDPB into Dentin Primer. J. Dent. Res. 1997, 76, 768–772. [Google Scholar] [CrossRef]
- Imazato, S.; Kinomoto, Y.; Tarumi, H.; Ebisu, S.; Tay, F.R. Antibacterial Activity and Bonding Characteristics of an Adhesive Resin Containing Antibacterial Monomer MDPB. Dent. Mater. 2003, 19, 313–319. [Google Scholar] [CrossRef]
- Li, F.; Weir, M.D.; Xu, H.H.K. Effects of Quaternary Ammonium Chain Length on Antibacterial Bonding Agents. J. Dent. Res. 2013, 92, 932–938. [Google Scholar] [CrossRef]
- Vidal, M.L.; Rego, G.F.; Viana, G.M.; Cabral, L.M.; Souza, J.P.B.; Silikas, N.; Schneider, L.F.; Cavalcante, L.M. Physical and Chemical Properties of Model Composites Containing Quaternary Ammonium Methacrylates. Dent. Mater. 2018, 34, 143–151. [Google Scholar] [CrossRef]
- Cherchali, F.Z.; Mouzali, M.; Tommasino, J.B.; Decoret, D.; Attik, N.; Aboulleil, H.; Seux, D.; Grosgogeat, B. Effectiveness of the DHMAI Monomer in the Development of an Antibacterial Dental Composite. Dent. Mater. 2017, 33, 1381–1391. [Google Scholar] [CrossRef]
- He, J.; Söderling, E.; Österblad, M.; Vallittu, P.K.; Lassila, L.V.J. Synthesis of Methacrylate Monomers with Antibacterial Effects against S. Mutans. Molecules 2011, 16, 9755–9763. [Google Scholar] [CrossRef]
- Li, F.; Li, F.; Wu, D.; Ma, S.; Gao, J.; Li, Y.; Xiao, Y.; Chen, J. The Effect of an Antibacterial Monomer on the Antibacterial Activity and Mechanical Properties of a Pit-and-Fissure Sealant. J. Am. Dent. Assoc. 2011, 142, 184–193. [Google Scholar] [CrossRef]
- Huang, L.; Yu, F.; Sun, X.; Dong, Y.; Lin, P.T.; Yu, H.H.; Xiao, Y.H.; Chai, Z.G.; Xing, X.D.; Chen, J.H. Antibacterial Activity of a Modified Unfilled Resin Containing a Novel Polymerizable Quaternary Ammonium Salt MAE-HB. Sci. Rep. 2016, 6, 33858. [Google Scholar] [CrossRef]
- Yanwei, Y.; Li, H.; Yan, D.; Hongchen, Z.; Wei, Z.; Jinghao, B.; Jingjing, W.; Yan, L.; Jing, G.; Jihua, C. In Vitro Antibacterial Activity of a Novel Resin-Based Pulp Capping Material Containing the Quaternary Ammonium Salt MAE-DB and Portland Cement. PLoS ONE 2014, 9, e112549. [Google Scholar] [CrossRef]
- Antonucci, J.M.; Zeiger, D.N.; Tang, K.; Lin-Gibson, S.; Fowler, B.O.; Lin, N.J. Synthesis and Characterization of Dimethacrylates Containing Quaternary Ammonium Functionalities for Dental Applications. Dent. Mater. 2012, 28, 219–228. [Google Scholar] [CrossRef] [PubMed]
- Li, F.; Weir, M.D.; Chen, J.; Xu, H.H.K. Comparison of Quaternary Ammonium-Containing with Nano-Silver-Containing Adhesive in Antibacterial Properties and Cytotoxicity. Dent. Mater. 2013, 29, 450–461. [Google Scholar] [CrossRef] [PubMed]
- Liang, X.; Huang, Q.; Liu, F.; He, J.; Lin, Z. Synthesis of Novel Antibacterial Monomers (UDMQA) and Their Potential Application in Dental Resin. J. Appl. Polym. Sci. 2013, 129, 3373–3381. [Google Scholar] [CrossRef]
- Huang, Q.; Lin, Z.; Liang, X.; Liu, F.; He, J. Preparation and Characterization of Antibacterial Dental Resin with UDMQA-12. Adv. Polym. Technol. 2014, 33, 21395. [Google Scholar] [CrossRef]
- Liang, X.; Söderling, E.; Liu, F.; He, J.; Lassila, L.V.J.; Vallittu, P.K. Optimizing the Concentration of Quaternary Ammonium Dimethacrylate Monomer in Bis-GMA/TEGDMA Dental Resin System for Antibacterial Activity and Mechanical Properties. J. Mater. Sci. Mater. Med. 2014, 25, 1387–1393. [Google Scholar] [CrossRef]
- Huang, Q.T.; He, J.W.; Lin, Z.M.; Liu, F.; Lassila, L.V.J.; Vallittu, P.K. Physical and Chemical Properties of an Antimicrobial Bis-GMA Free Dental Resin with Quaternary Ammonium Dimethacrylate Monomer. J. Mech. Behav. Biomed. Mater. 2016, 56, 68–76. [Google Scholar] [CrossRef]
- Manouchehri, F.; Sadeghi, B.; Najafi, F.; Mosslemin, M.H.; Niakan, M. Synthesis and Characterization of Novel Polymerizable Bis-Quaternary Ammonium Dimethacrylate Monomers with Antibacterial Activity as an Efficient Adhesive System for Dental Restoration. Polym. Bull. 2019, 76, 1295–1315. [Google Scholar] [CrossRef]
- Makvandi, P.; Ghaemy, M.; Mohseni, M. Synthesis and Characterization of Photo-Curable Bis-Quaternary Ammonium Dimethacrylate with Antimicrobial Activity for Dental Restoration Materials. Eur. Polym. J. 2016, 74, 81–90. [Google Scholar] [CrossRef]
- Huang, J.; Koepsel, R.R.; Murata, H.; Wu, W.; Lee, S.B.; Kowalewski, T.; Russell, A.J.; Matyjaszewski, K. Nonleaching Antibacterial Glass Surfaces via “Grafting onto”: The Effect of the Number of Quaternary Ammonium Groups on Biocidal Activity. Langmuir 2008, 24, 6785–6795. [Google Scholar] [CrossRef]
- Chrószcz, M.W.; Barszczewska-Rybarek, I.M. Synthesis and Characterization of Novel Quaternary Ammonium Urethane-Dimethacrylate Monomers—A Pilot Study. Int. J. Mol. Sci. 2021, 22, 8842. [Google Scholar] [CrossRef]
- Hassan, R.; Khan, M.U.A.; Abdullah, A.M.; Razak, S.I.A. A Review on Current Trends of Polymers in Orthodontics: Bpa-Free and Smart Materials. Polymers 2021, 13, 1409. [Google Scholar] [CrossRef]
- Manappallil, J.J. Basic Dental Materials, 4th ed.; Jaypee Brothers Medical Publishers: New Delhi, India, 2015. [Google Scholar]
- Sideridou, I.; Tserki, V.; Papanastasiou, G. Effect of Chemical Structure on Degree of Conversion in Light-Cured Dimethacrylate-Based Dental Resins. Biomaterials 2002, 23, 1819–1829. [Google Scholar] [CrossRef]
- Roudaut, G.; Simatos, D.; Champion, D.; Contreras-Lopez, E.; Le Meste, M. Molecular Mobility around the Glass Transition Temperature: A Mini Review. Innov. Food Sci. Emerg. Technol. 2004, 5, 127–134. [Google Scholar] [CrossRef]
- Moraes, J.C.S.; Sostena, M.M.D.S.; Grandini, C.R. The Glass Transition Temperature in Dental Composites. In Metal, Ceramic and Polymeric Composites for Various Uses; Cuppoletti, J., Ed.; IntechOpen: London, UK, 2011. [Google Scholar] [CrossRef]
- Mackowiak, P.A.; Chervenak, F.A.; Grünebaum, A. Defining Fever. Open Forum Infect. Dis. 2021, 8, ofab161. [Google Scholar] [CrossRef] [PubMed]
- Barszczewska-Rybarek, I.M. A guide through the dental dimethacrylate polymer network structural characterization and interpretation of physico-mechanical properties. Materials 2019, 12, 4057. [Google Scholar] [CrossRef] [PubMed]
- Commentary, G. Definitions for Hydrophilicity, Hydrophobicity, and Superhydrophobicity: Getting the Basics Right. J. Phys. Chem. Lett. 2014, 5, 686–688. [Google Scholar] [CrossRef]
- Förch, R.; Schönherr, H.; Jenkins, A.T.A. Surface Design: Applications in Bioscience and Nanotechnology, 3rd ed.; Wiley-VCH: Weinheim, Germany, 2009; pp. 471–473. [Google Scholar]
- Tashiro, T. Antibacterial and Bacterium Adsorbing Macromolecules. Macromol. Mater. Eng. 2001, 286, 63–87. [Google Scholar] [CrossRef]
- Kwaśniewska, D.; Chen, Y.L.; Wieczorek, D. Biological Activity of Quaternary Ammonium Salts and Their Derivatives. Pathogens 2020, 9, 459. [Google Scholar] [CrossRef]
- Balgavý, P.; Devínsky, F. Cut-off Effects in Biological Activities of Surfactants. Adv. Colloid Interface Sci. 1996, 66, 23–63. [Google Scholar] [CrossRef]
- Barszczewska-Rybarek, I.M.; Chrószcz, M.W.; Chladek, G. Novel Urethane-Dimethacrylate Monomers and Compositions for Use as Matrices in Dental Restorative Materials. Int. J. Mol. Sci. 2020, 21, 2644. [Google Scholar] [CrossRef]
- ISO 11357–2:2020; Scanning Calorimetry (DSC)—Part. 2: Determination of Glass Transition Temperature and Step Height. International Standard Organisation: London, UK, 2020.
- ISO 1675:1985; Plastics—Liquid Resins—Determination of Density by the Pyknometer Method. International Standard Organisation: London, UK, 1985.
- ISO 489:1999; Plastics—Determination of Refractive Index. International Standard Organisation: London, UK, 1999.


| Sample Name | Composition | ||||||||
|---|---|---|---|---|---|---|---|---|---|
| QA8 | QA10 | QA12 | QA14 | QA16 | QA18 | BG | TEG | ||
| QA8:TEG | wt. % | 60 | 40 | ||||||
| mol% | 30.7 | 69.3 | |||||||
| QA10:TEG | wt. % | 60 | 40 | ||||||
| mol% | 29.5 | 70.5 | |||||||
| QA12:TEG | wt. % | 60 | 40 | ||||||
| mol% | 28.4 | 71.6 | |||||||
| QA14:TEG | wt. % | 60 | 40 | ||||||
| mol% | 27.4 | 72.6 | |||||||
| QA16:TEG | wt. % | 60 | 40 | ||||||
| mol% | 26.4 | 73.6 | |||||||
| QA18:TEG | wt. % | 60 | 40 | ||||||
| mol% | 25.5 | 74.5 | |||||||
| BG:TEG | wt. % | 60 | 40 | ||||||
| mol% | 45.6 | 54.4 | |||||||
| Sample Name | MW (g/mol) | xDB (mol/kg) | RI1 | dm (g/cm3) | Tgm (°C) | ||
|---|---|---|---|---|---|---|---|
| Average | SD | Average | SD | ||||
| QA8:TEG | 496 | 4.03 | 1.5001 | 1.15 | 0.00 | −33.82 a | 1.34 |
| QA10:TEG | 505 | 3.96 | 1.4914 a | 1.13 a | 0.00 | −29.01 b–e | 2.13 |
| QA12:TEG | 512 | 3.90 | 1.4912 a | 1.11 b,c | 0.01 | −25.84 b,f–h | 3.12 |
| QA14:TEG | 520 | 3.85 | 1.4932 | 1.09 d | 0.01 | −26.91 c,f,i | 3.06 |
| QA16:TEG | 526 | 3.80 | 1.4895 | 1.08 b,d,e | 0.01 | −27.03 d,g,i,j | 1.36 |
| QA18:TEG | 533 | 3.75 | 1.4919 | 1.07 e | 0.01 | −30.83 a,e,h,j | 3.73 |
| BG:TEG | 389 | 5.14 | 1.5129 | 1.11 a,c | 0.01 | −56.05 | 5.87 |
| Sample Name | dp (g/cm3) | St (%) | Se (%) | DC (%) | Tgp (°C) | ||||
|---|---|---|---|---|---|---|---|---|---|
| Average | SD | Average | SD | Average | SD | Average | SD | ||
| QA8:TEG | 1.23 a–e | 0.01 | 10.4 | 6.6 a | 0.3 | 84.2 a–f | 1.2 | 60.52 a–d | 0.79 |
| QA10:TEG | 1.20 a,f–i | 0.00 | 10.0 | 6.4 b | 0.3 | 84.0 a,g–k | 0.9 | 60.33 e–h | 1.37 |
| QA12:TEG | 1.18 b,f,j–l | 0.01 | 9.7 | 6.5 c | 0.6 | 86.0 b,g,l,m | 1.2 | 63.18 a,e,i | 1.43 |
| QA14:TEG | 1.17 c,g,m–o | 0.00 | 9.4 | 6.9 d | 0.6 | 88.7 c,h,n | 1.4 | 64.07 b,f,j,k | 1.15 |
| QA16:TEG | 1.16 d,h,j,m,p,q | 0.00 | 9.2 | 6.5 e | 1.0 | 87.1 d,i,l,o | 1.1 | 65.03 c,g,l | 0.73 |
| QA18:TEG | 1.14 e,i,k,n,p,r | 0.01 | 9.0 | 6.5 f | 0.9 | 87.1 e,j,p | 0.9 | 66.32 d,h–j,m | 1.23 |
| BG:TEG | 1.22 f,l,o,q,r | 0.01 | 12.9 | 8.4 a–f | 0.6 | 64.8 f,k,m–p | 1.6 | 61.66 k–m | 0.58 |
| Sample Name | Inhibition Zone (mm) | |||
|---|---|---|---|---|
| S. aureus (ATCC 25923) | E. coli (ATCC 25922) | |||
| Average | SD | Average | SD | |
| QA8:TEG | 19 | 1 | 10 | 1 |
| QA10:TEG | 12 a,b | 1 | 8 | 1 |
| QA12:TEG | 13 a,c | 2 | 7 a | 1 |
| QA14:TEG | 13 b,c | 2 | 6 a–e | 1 |
| QA16:TEG | 10 | 1 | 5 b,f–h | 0 |
| QA18:TEG | 6 d,e | 1 | 5 c,f,i,j | 0 |
| BG:TEG | 6 d,f | 1 | 5 d,g,i,k | 0 |
| STERILE WATER | 5 e,f | 0 | 5 e,h,j,k | 0 |
Publisher’s Note: MDPI stays neutral with regard to jurisdictional claims in published maps and institutional affiliations. |
© 2022 by the authors. Licensee MDPI, Basel, Switzerland. This article is an open access article distributed under the terms and conditions of the Creative Commons Attribution (CC BY) license (https://creativecommons.org/licenses/by/4.0/).
Share and Cite
Chrószcz, M.W.; Barszczewska-Rybarek, I.M.; Kazek-Kęsik, A. Novel Antibacterial Copolymers Based on Quaternary Ammonium Urethane-Dimethacrylate Analogues and Triethylene Glycol Dimethacrylate. Int. J. Mol. Sci. 2022, 23, 4954. https://doi.org/10.3390/ijms23094954
Chrószcz MW, Barszczewska-Rybarek IM, Kazek-Kęsik A. Novel Antibacterial Copolymers Based on Quaternary Ammonium Urethane-Dimethacrylate Analogues and Triethylene Glycol Dimethacrylate. International Journal of Molecular Sciences. 2022; 23(9):4954. https://doi.org/10.3390/ijms23094954
Chicago/Turabian StyleChrószcz, Marta W., Izabela M. Barszczewska-Rybarek, and Alicja Kazek-Kęsik. 2022. "Novel Antibacterial Copolymers Based on Quaternary Ammonium Urethane-Dimethacrylate Analogues and Triethylene Glycol Dimethacrylate" International Journal of Molecular Sciences 23, no. 9: 4954. https://doi.org/10.3390/ijms23094954
APA StyleChrószcz, M. W., Barszczewska-Rybarek, I. M., & Kazek-Kęsik, A. (2022). Novel Antibacterial Copolymers Based on Quaternary Ammonium Urethane-Dimethacrylate Analogues and Triethylene Glycol Dimethacrylate. International Journal of Molecular Sciences, 23(9), 4954. https://doi.org/10.3390/ijms23094954