
Modulation of Mismatch Repair and the SOCS1/p53 Axis by microRNA-155 in the Colon of Patients with Primary Sclerosing Cholangitis


Abstract
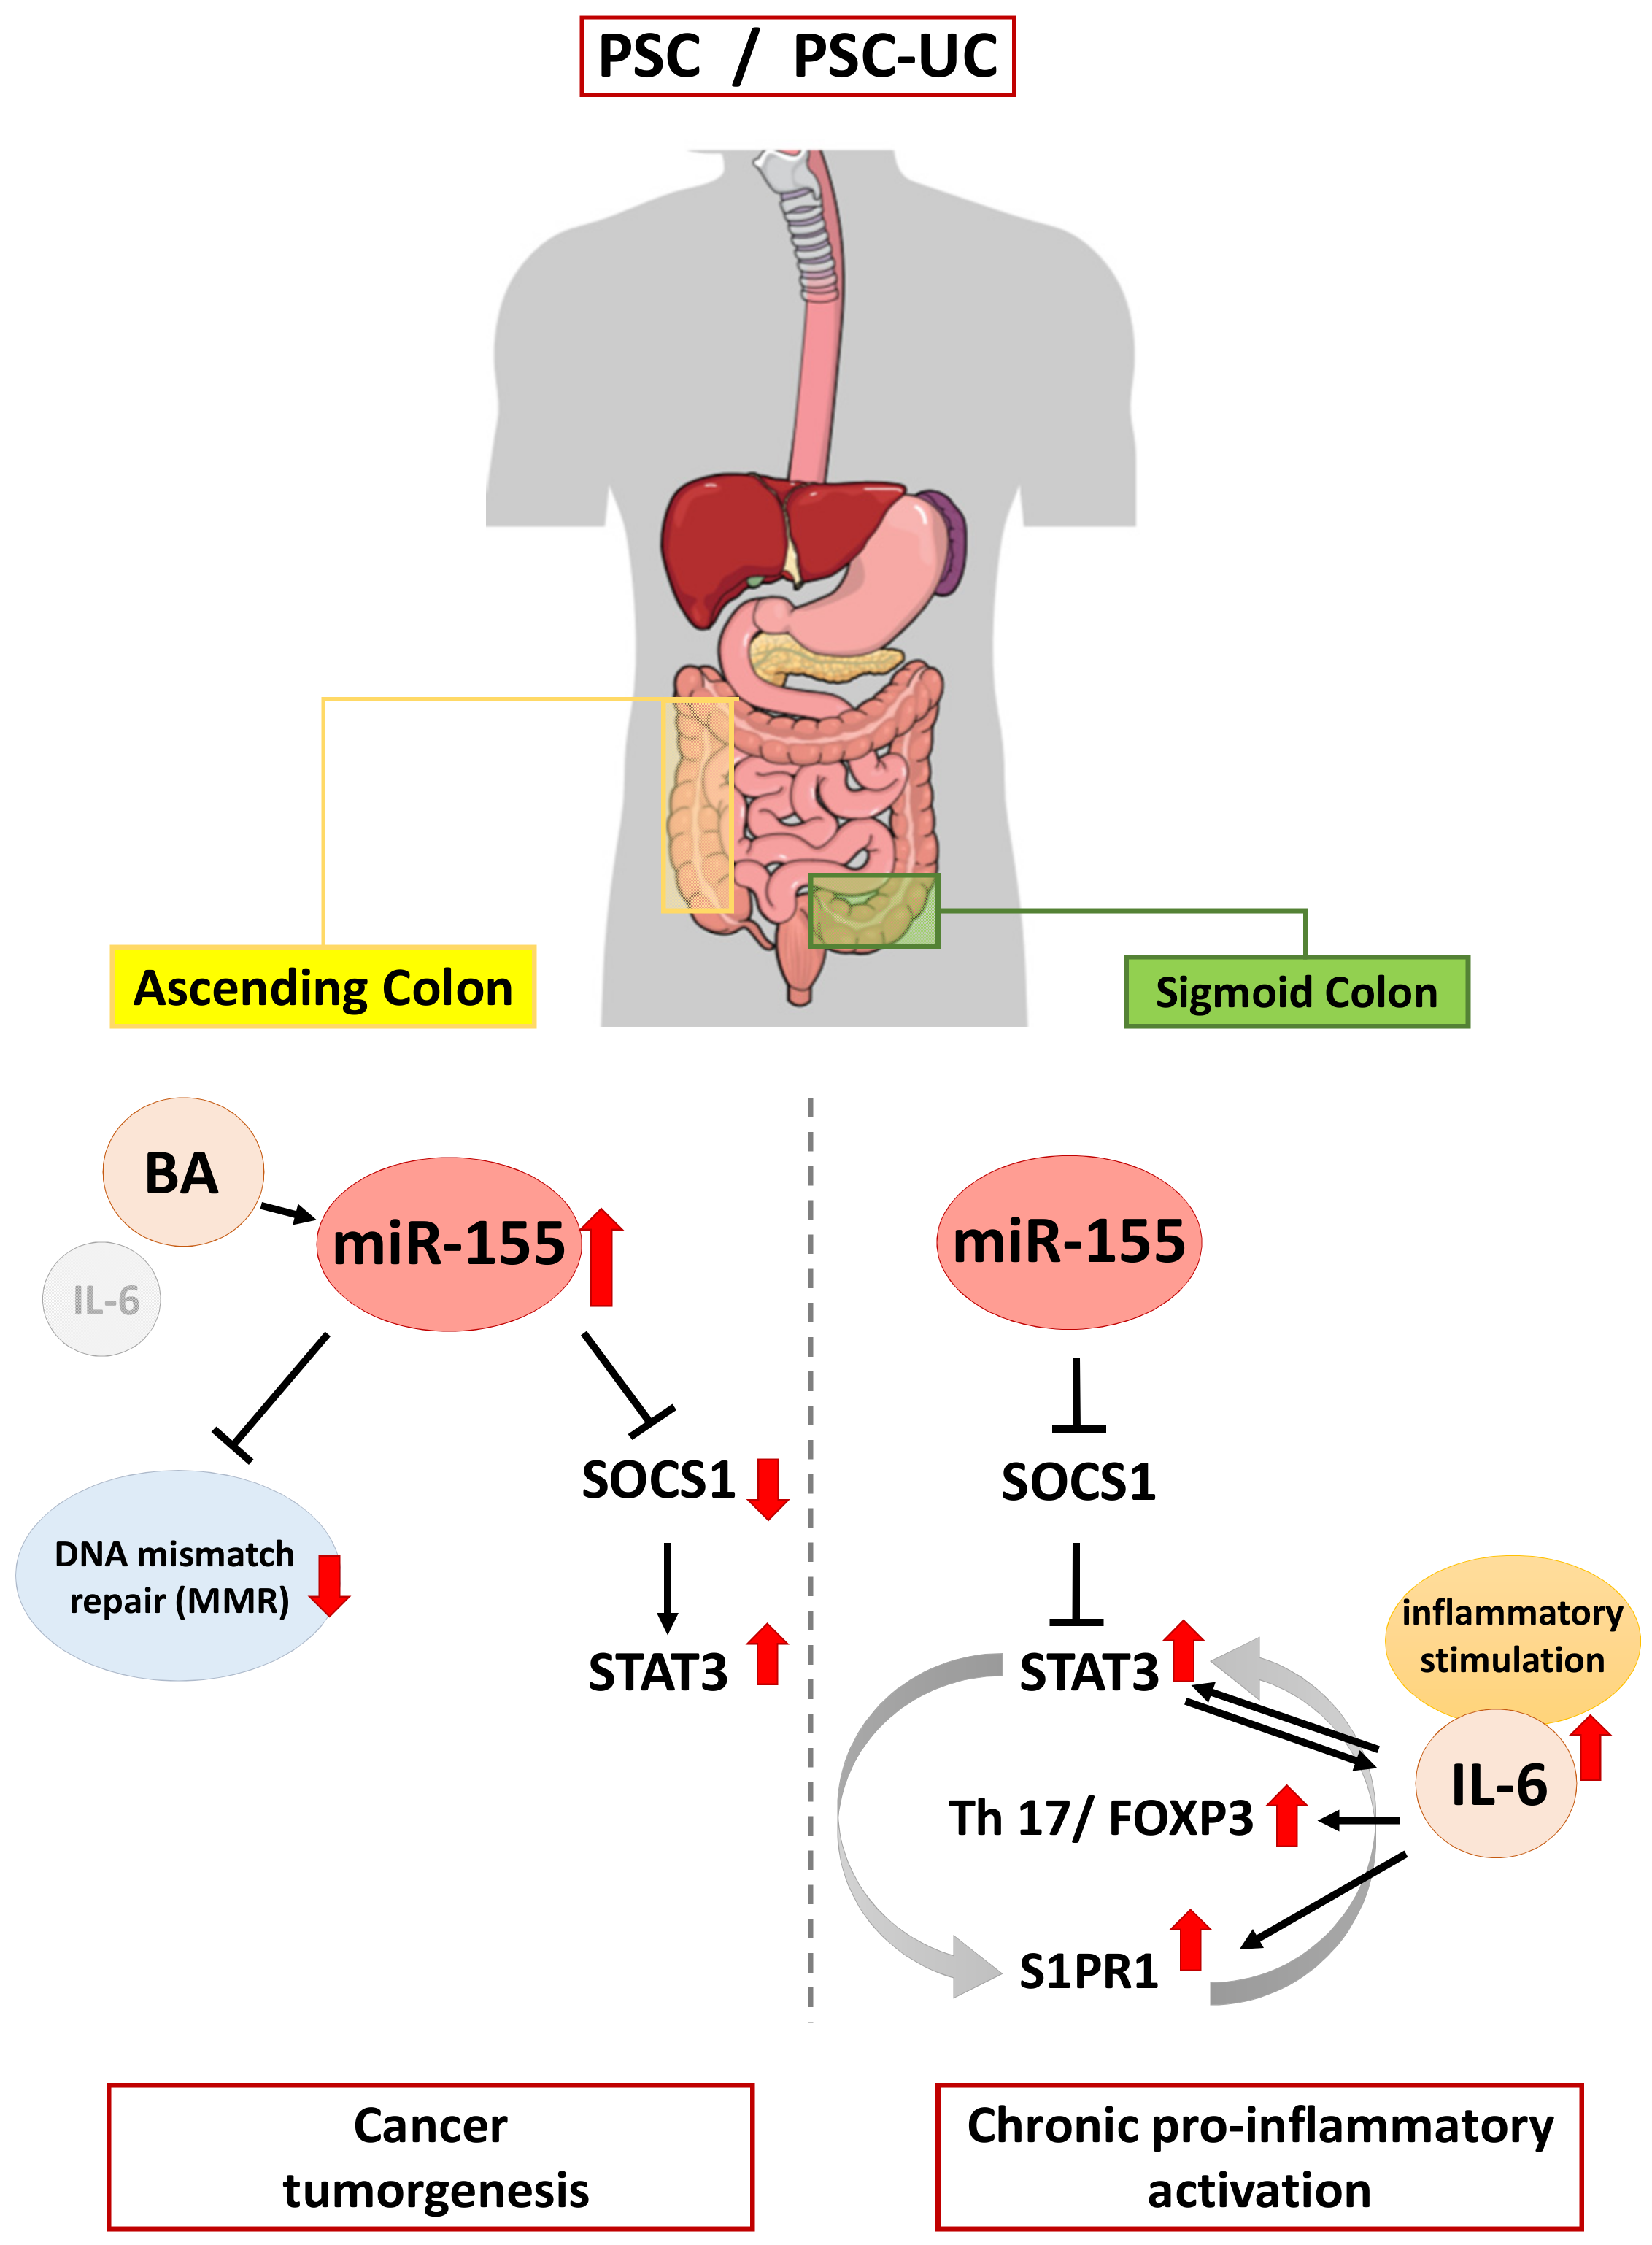
:1. Introduction
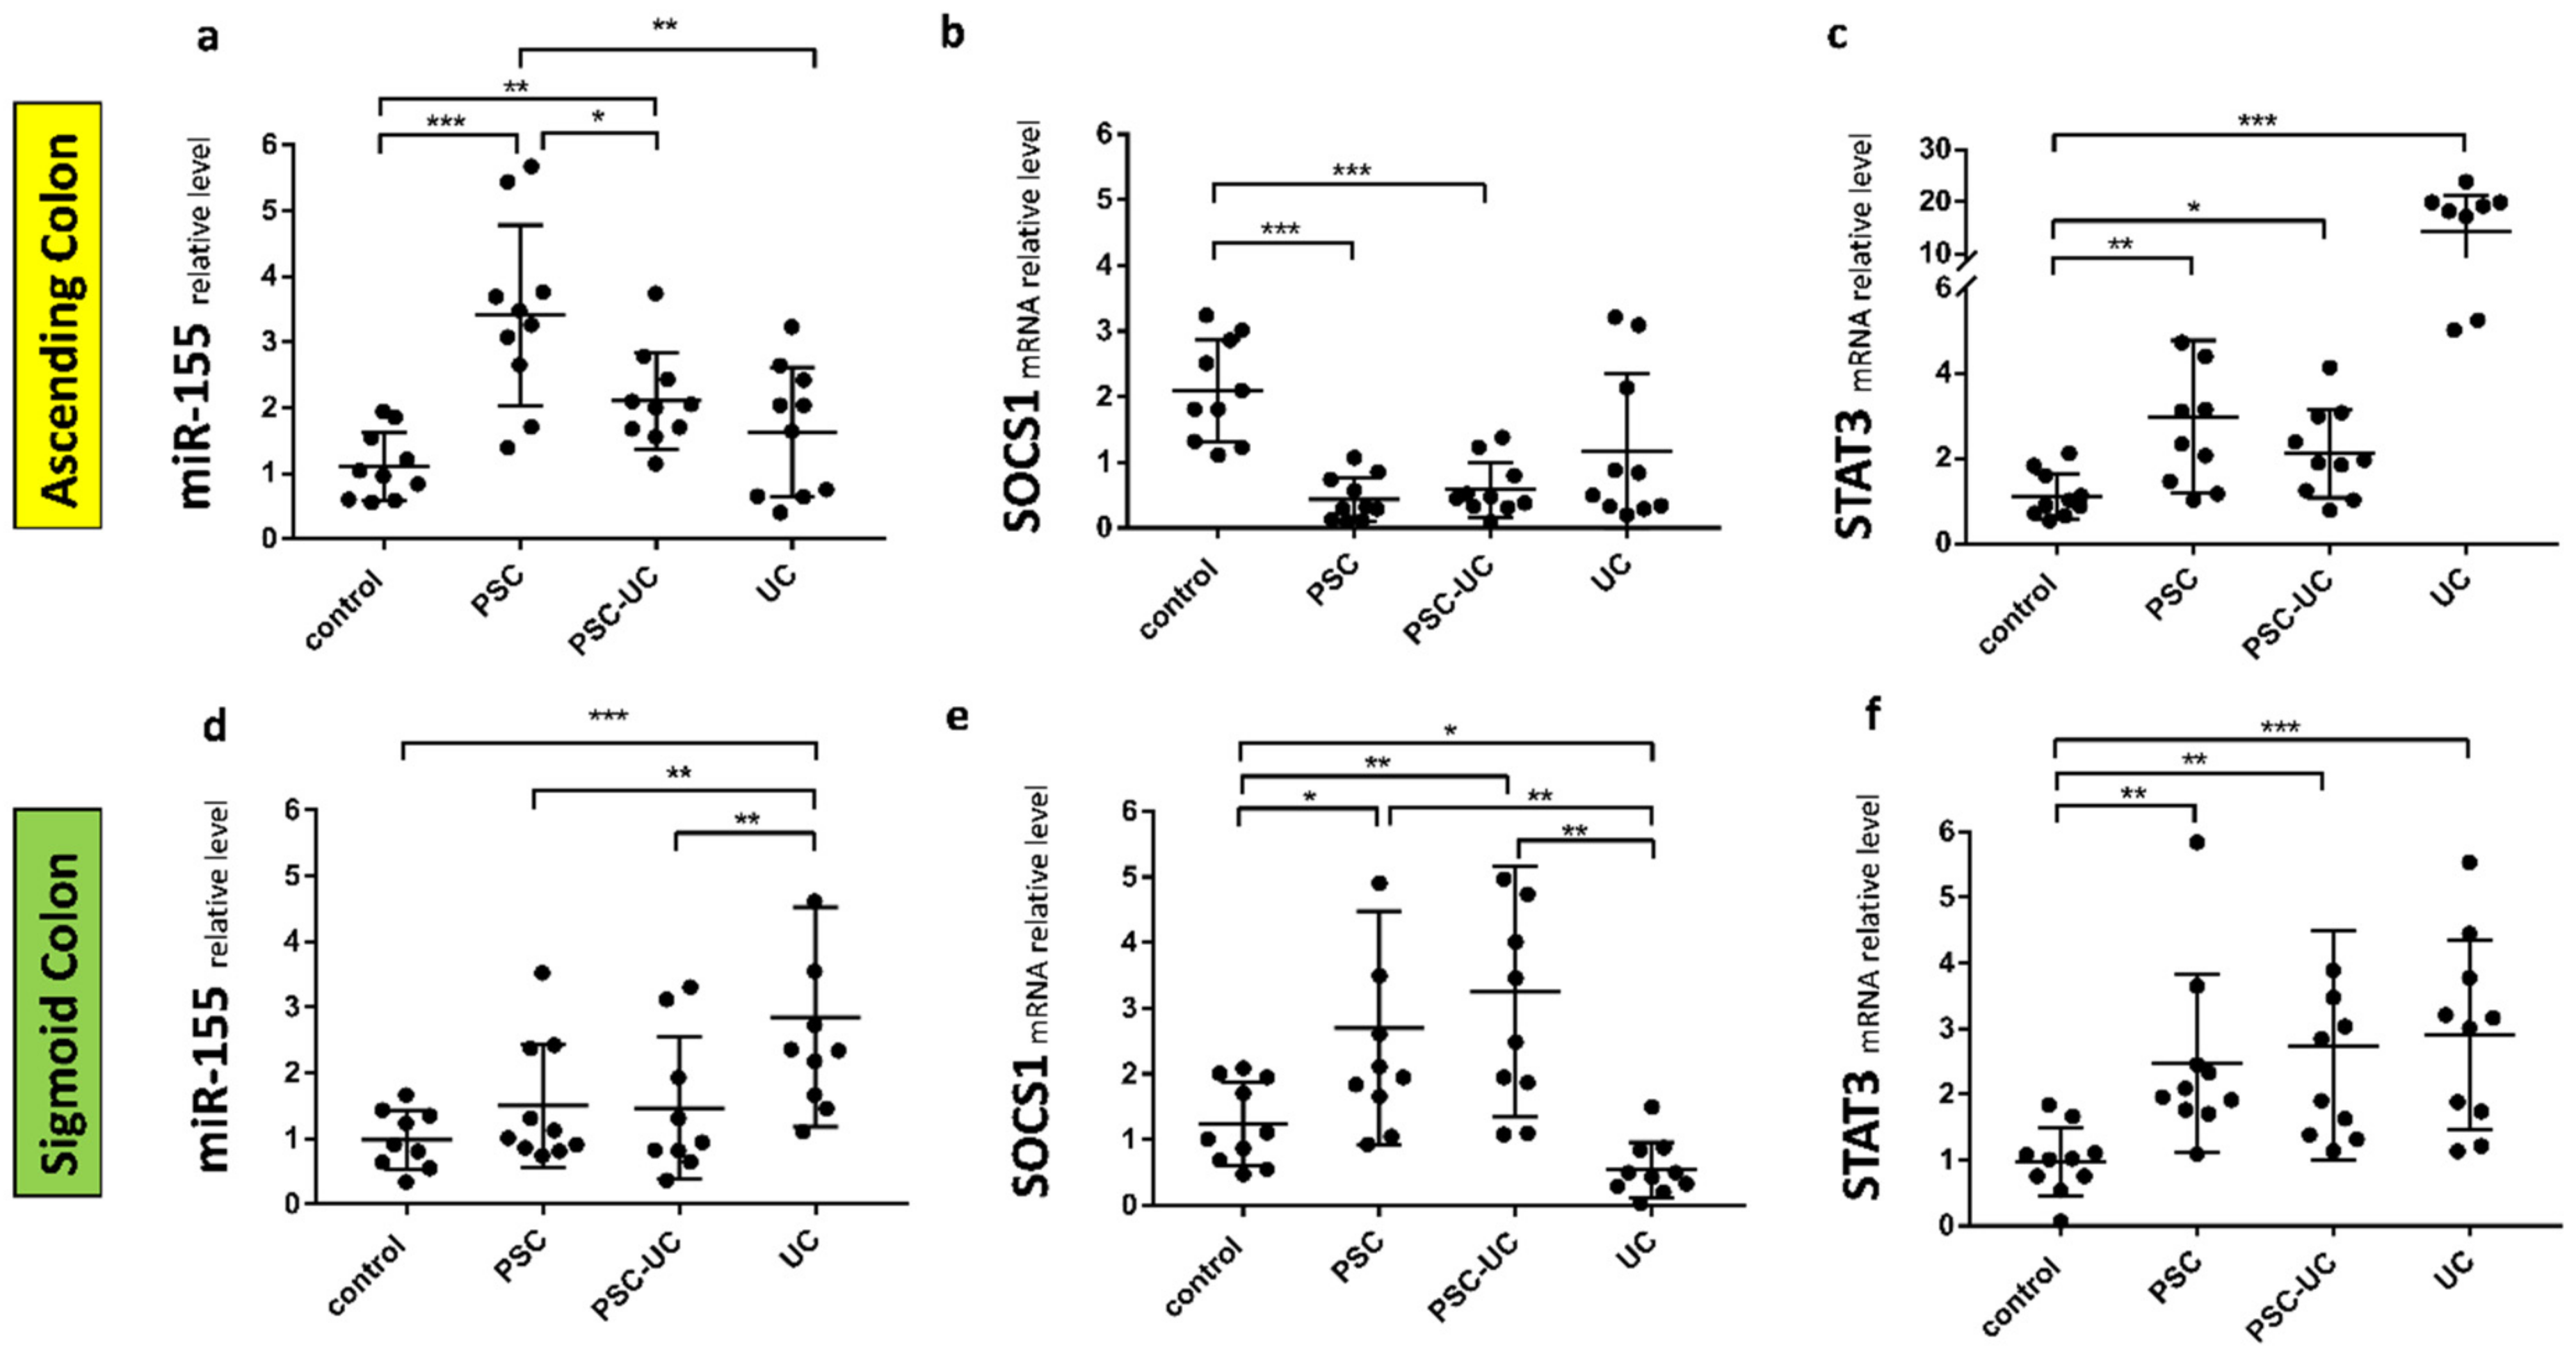
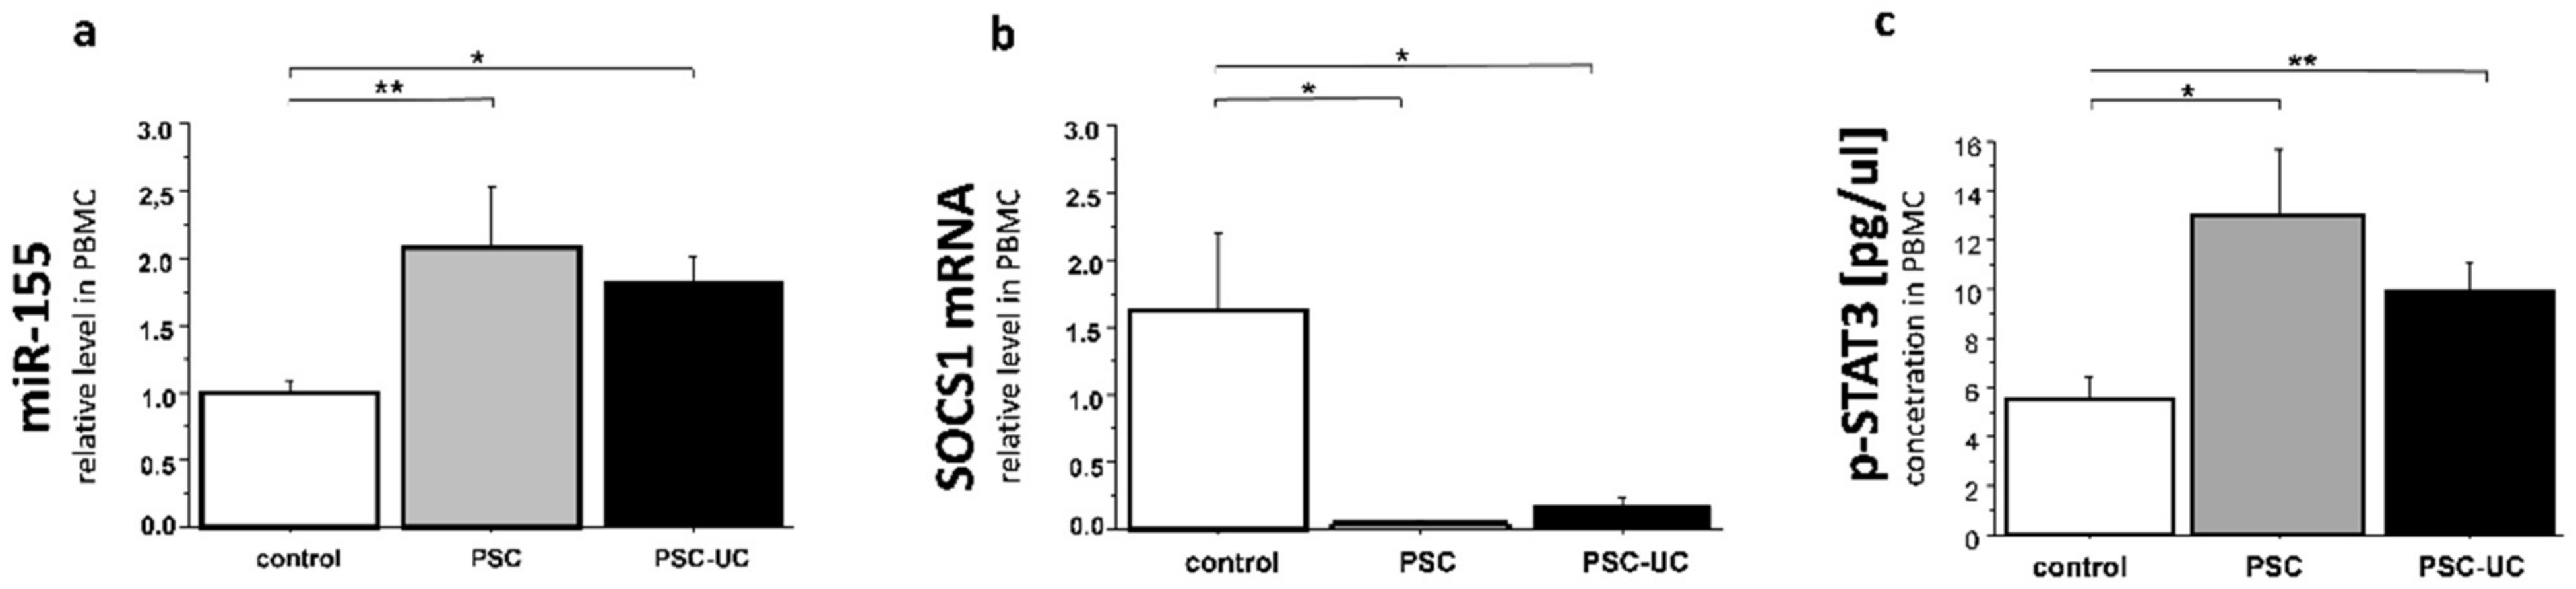
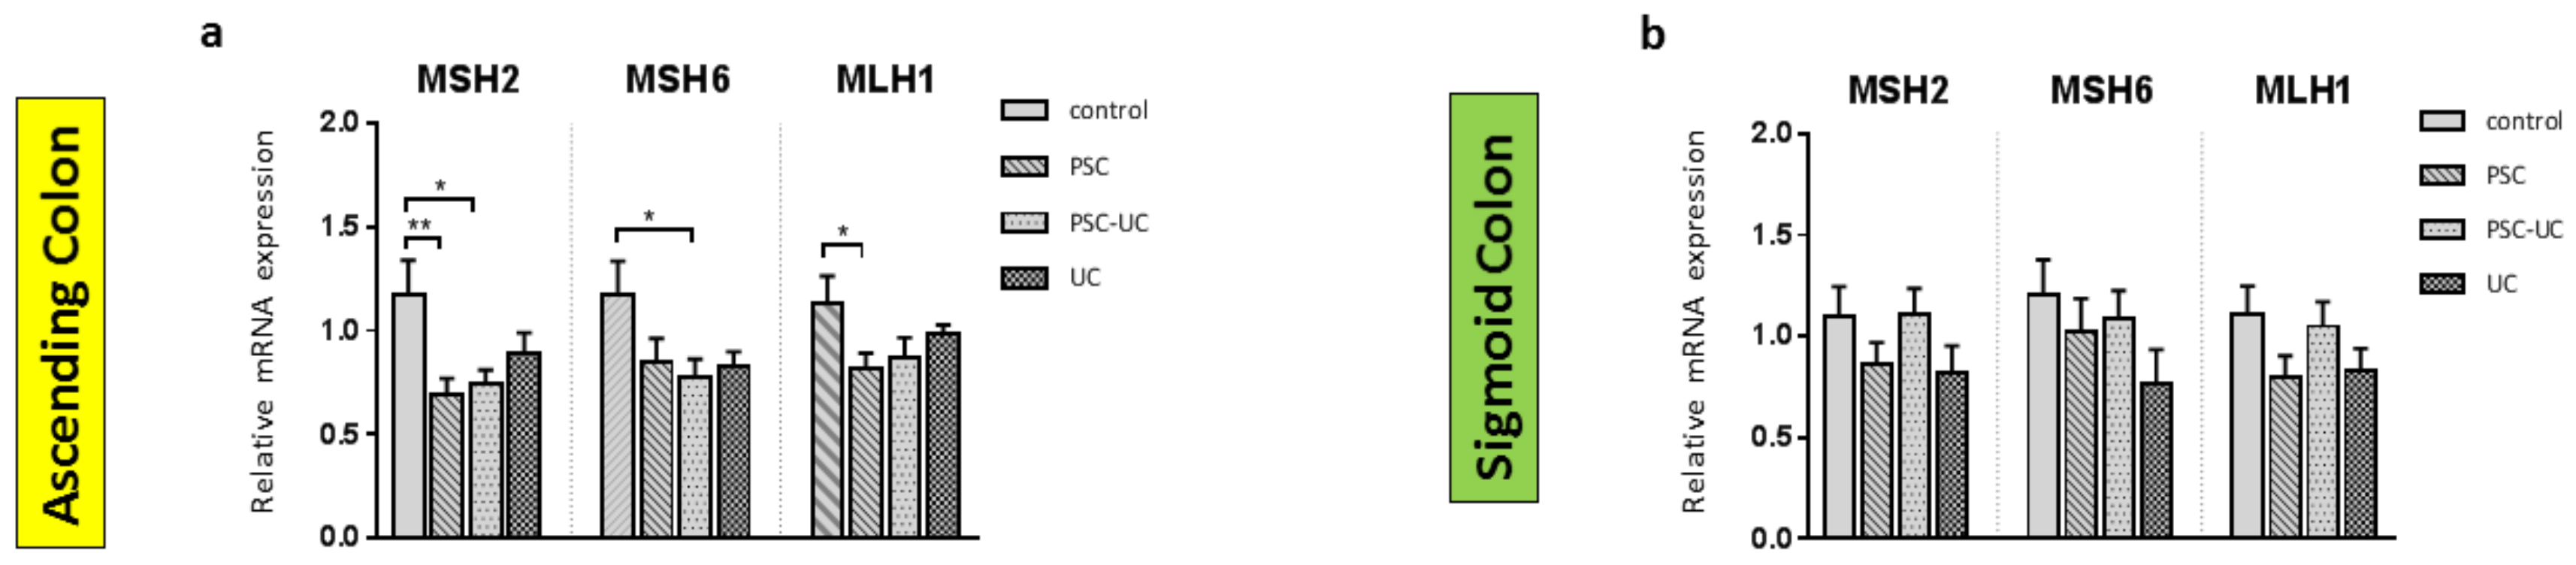
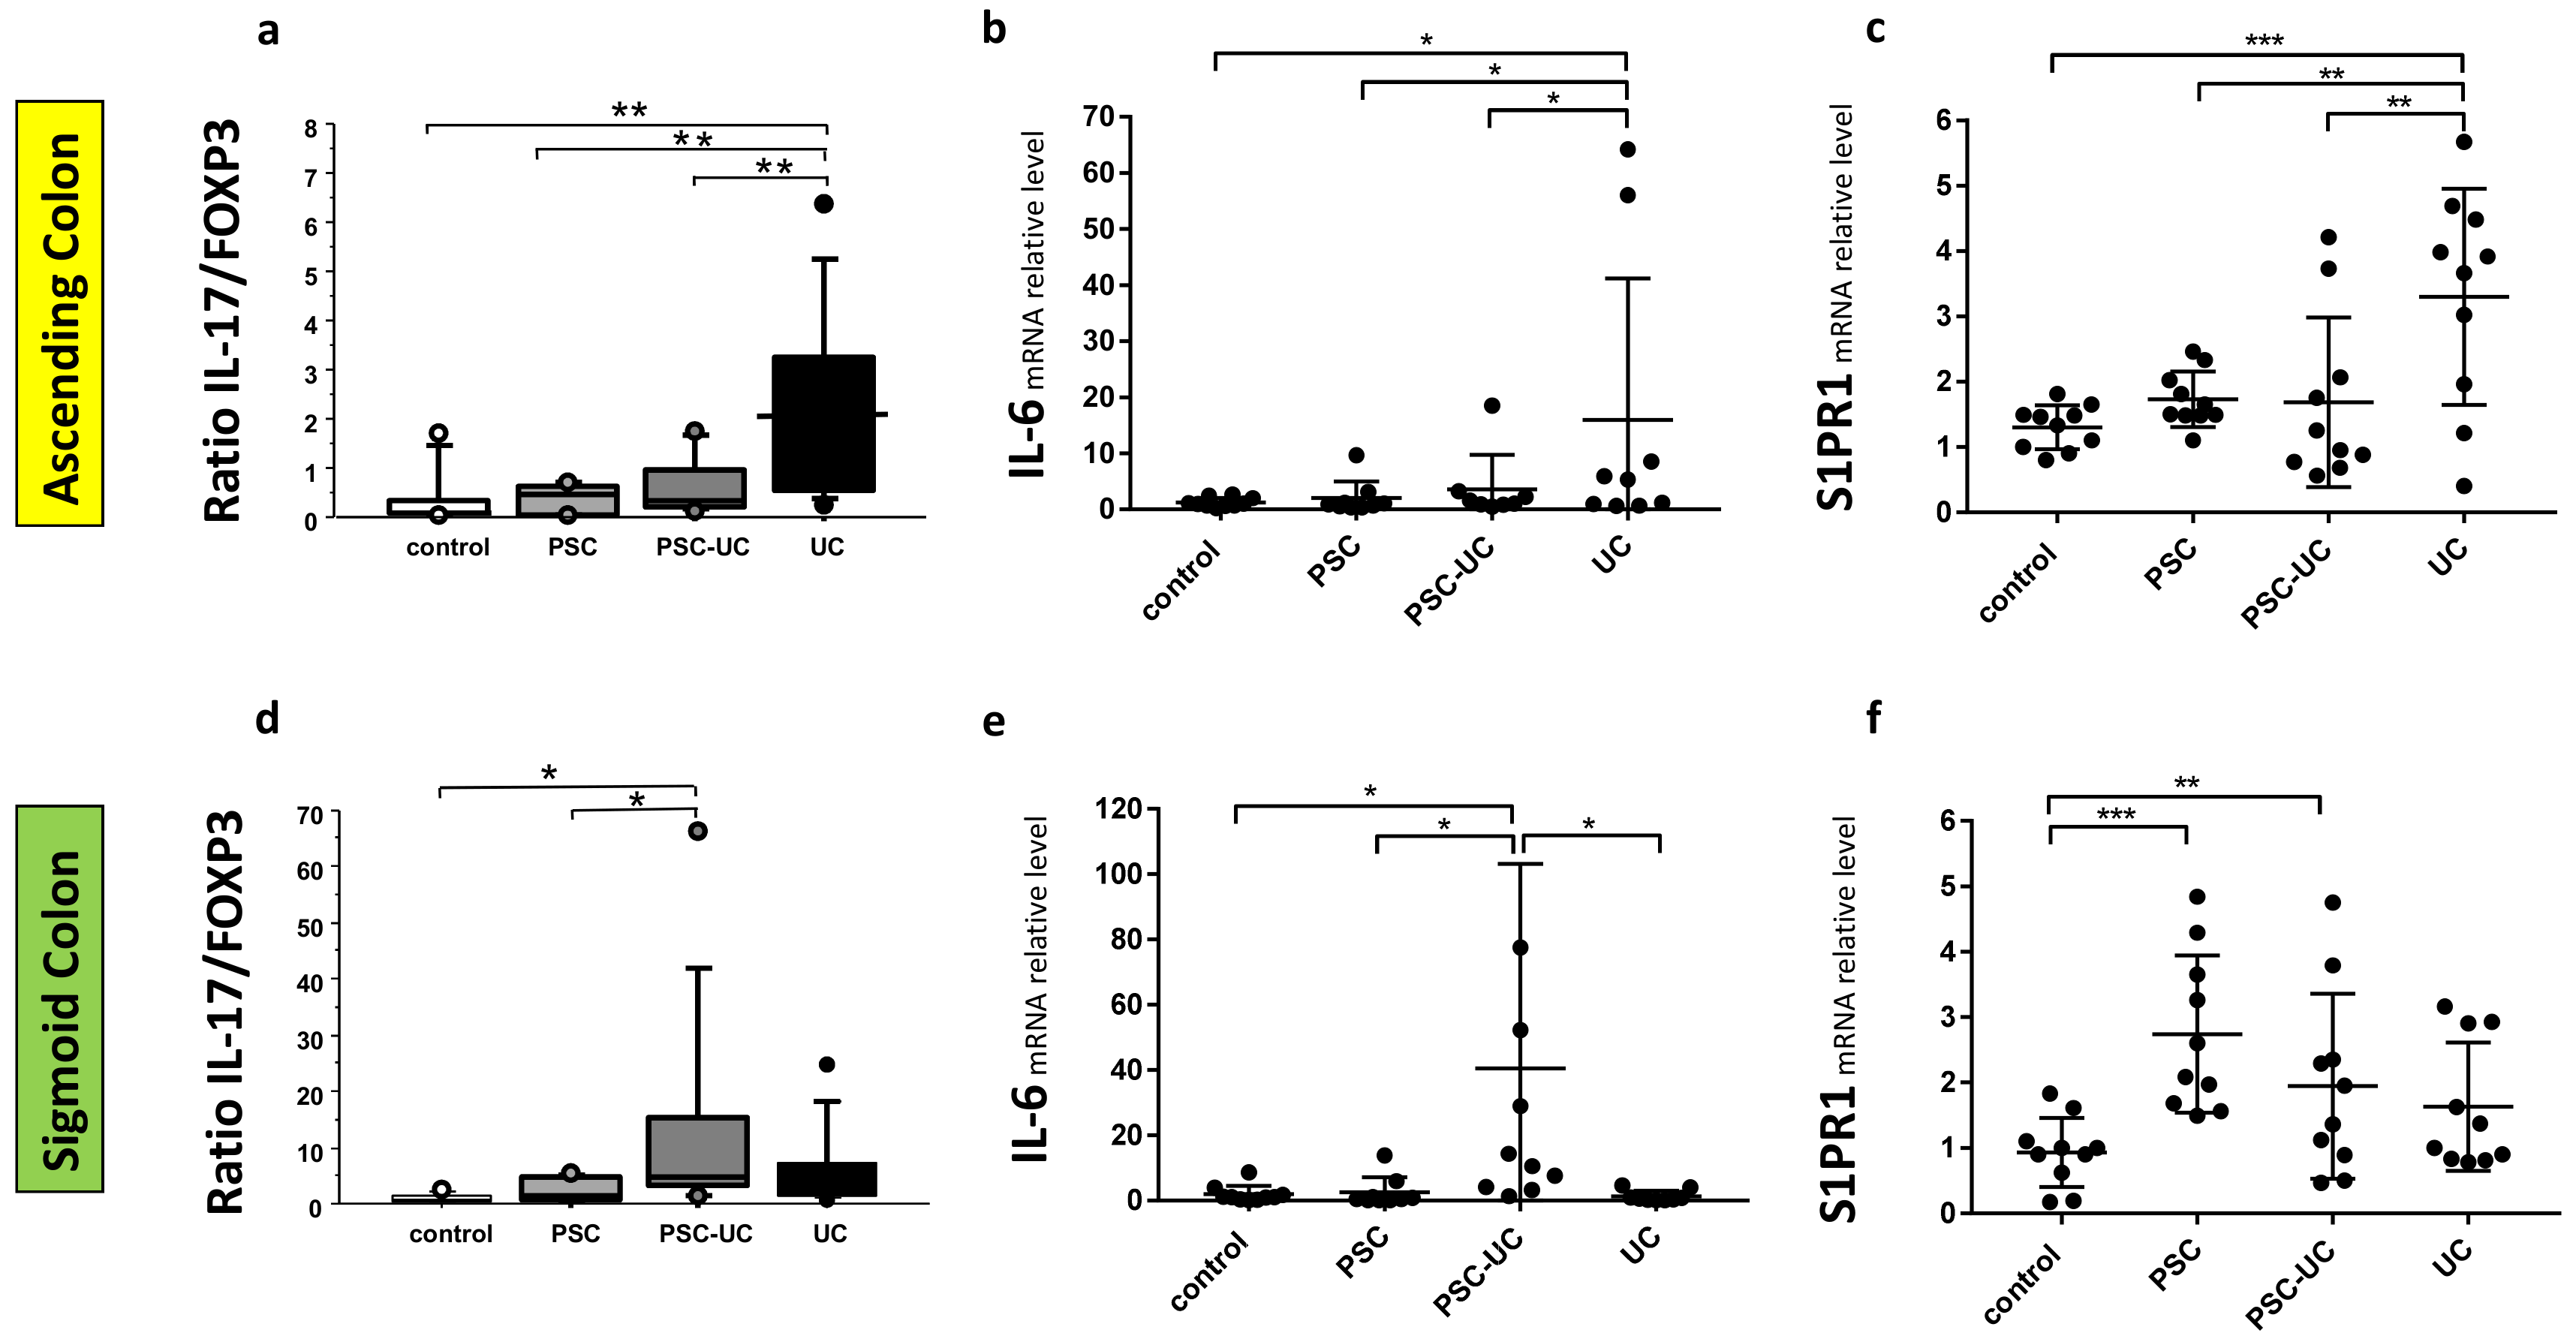
2. Results
3. Discussion
4. Materials and Methods
4.1. Subjects
4.2. RNA and miRNA Expression Analysis
4.3. PBMCs
4.4. ELISA
4.5. Cell Culture, Transfection and Treatments
4.6. Statistics
5. Conclusions
Author Contributions
Funding
Institutional Review Board Statement
Informed Consent Statement
Data Availability Statement
Conflicts of Interest
References
- Hirschfield, G.M.; Karlsen, T.H.; Lindor, K.D.; Adams, D.H. Primary sclerosing cholangitis. Lancet 2013, 382, 1587–1599. [Google Scholar] [CrossRef]
- Torres, J.; Pineton de Chambrun, G.; Itzkowitz, S.; Sachar, D.B.; Colombel, J.F. Review article: Colorectal neoplasia in patients with primary sclerosing cholangitis and inflammatory bowel disease. Aliment. Pharm. Ther. 2011, 34, 497–508. [Google Scholar] [CrossRef] [PubMed]
- Soetikno, R.M.; Lin, O.S.; Heidenreich, P.A.; Young, H.S.; Blackstone, M.O. Increased risk of colorectal neoplasia in patients with primary sclerosing cholangitis and ulcerative colitis: A meta-analysis. Gastrointest. Endosc. 2002, 56, 48–54. [Google Scholar] [CrossRef] [PubMed]
- Broomé, U.; Lindberg, G.; Löfberg, R. Primary sclerosing cholangitis in ulcerative colitis—A risk factor for the development of dysplasia and DNA aneuploidy? Gastroenterology 1992, 102, 1877–1880. [Google Scholar] [CrossRef]
- Valeri, N.; Gasparini, P.; Fabbri, M.; Braconi, C.; Veronese, A.; Lovat, F.; Adair, B.; Vannini, I.; Fanini, F.; Bottoni, A.; et al. Modulation of mismatch repair and genomic stability by miR-155. Proc. Natl. Acad. Sci. USA 2010, 107, 6982–6987. [Google Scholar] [CrossRef] [Green Version]
- Ionov, Y.; Peinado, M.A.; Malkhosyan, S.; Shibata, D.; Perucho, M. Ubiquitous somatic mutations in simple repeated sequences reveal a new mechanism for colonic carcinogenesis. Nature 1993, 363, 558–561. [Google Scholar] [CrossRef]
- Aaltonen, L.A.; Peltomäki, P.; Leach, F.S.; Sistonen, P.; Pylkkänen, L.; Mecklin, J.P.; Järvinen, H.; Powell, S.M.; Jen, J.; Hamilton, S.R.; et al. Clues to the pathogenesis of familial colorectal cancer. Science 1993, 260, 812–816. [Google Scholar] [CrossRef]
- Thibodeau, S.N.; Bren, G.; Schaid, D. Microsatellite instability in cancer of the proximal colon. Science 1993, 260, 816–819. [Google Scholar] [CrossRef]
- Mallette, F.A.; Calabrese, V.; Ilangumaran, S.; Ferbeyre, G. SOCS1, a novel interaction partner of p53 controlling oncogene-induced senescence. Aging 2010, 2, 445–452. [Google Scholar] [CrossRef] [Green Version]
- Kempinska-Podhorodecka, A.; Milkiewicz, M.; Wasik, U.; Ligocka, J.; Zawadzki, M.; Krawczyk, M.; Milkiewicz, P. Decreased Expression of Vitamin D Receptor Affects an Immune Response in Primary Biliary Cholangitis via the VDR-miRNA155-SOCS1 Pathway. Int. J. Mol. Sci. 2017, 18, 289. [Google Scholar] [CrossRef] [Green Version]
- Tamiya, T.; Kashiwagi, I.; Takahashi, R.; Yasukawa, H.; Yoshimura, A. Suppressors of cytokine signaling (SOCS) proteins and JAK/STAT pathways: Regulation of T-cell inflammation by SOCS1 and SOCS3. Arter. Thromb. Vasc. Biol. 2011, 31, 980–985. [Google Scholar] [CrossRef] [Green Version]
- Yoshimura, A. Regulation of cytokine signaling by the SOCS and Spred family proteins. Keio J. Med. 2009, 58, 73–83. [Google Scholar] [CrossRef] [Green Version]
- O’Connell, R.M.; Kahn, D.; Gibson, W.S.; Round, J.L.; Scholz, R.L.; Chaudhuri, A.A.; Kahn, M.E.; Rao, D.S.; Baltimore, D. MicroRNA-155 promotes autoimmune inflammation by enhancing inflammatory T cell development. Immunity 2010, 33, 607–619. [Google Scholar] [CrossRef] [Green Version]
- Xin, Q.; Li, J.; Dang, J.; Bian, X.; Shan, S.; Yuan, J.; Qian, Y.; Liu, Z.; Liu, G.; Yuan, Q.; et al. miR-155 Deficiency Ameliorates Autoimmune Inflammation of Systemic Lupus Erythematosus by Targeting S1pr1 in Faslpr/lpr Mice. J. Immunol. 2015, 194, 5437–5445. [Google Scholar] [CrossRef] [Green Version]
- Pham, T.H.; Okada, T.; Matloubian, M.; Lo, C.G.; Cyster, J.G. S1P1 receptor signaling overrides retention mediated by G alpha i-coupled receptors to promote T cell egress. Immunity 2008, 28, 122–133. [Google Scholar] [CrossRef] [Green Version]
- Zhao, S.; Adebiyi, M.G.; Zhang, Y.; Couturier, J.P.; Fan, X.; Zhang, H.; Kellems, R.E.; Lewis, D.E.; Xia, Y. Sphingosine-1-phosphate receptor 1 mediates elevated IL-6 signaling to promote chronic inflammation and multitissue damage in sickle cell disease. FASEB J. 2018, 32, 2855–2865. [Google Scholar] [CrossRef] [Green Version]
- Lee, H.; Deng, J.; Kujawski, M.; Yang, C.; Liu, Y.; Herrmann, A.; Kortylewski, M.; Horne, D.; Somlo, G.; Forman, S.; et al. STAT3-induced S1PR1 expression is crucial for persistent STAT3 activation in tumors. Nat. Med. 2010, 16, 1421–1428. [Google Scholar] [CrossRef] [Green Version]
- Pathak, S.; Grillo, A.R.; Scarpa, M.; Brun, P.; D’Incà, R.; Nai, L.; Banerjee, A.; Cavallo, D.; Barzon, L.; Palù, G.; et al. MiR-155 modulates the inflammatory phenotype of intestinal myofibroblasts by targeting SOCS1 in ulcerative colitis. Exp. Mol. Med. 2015, 47, e164. [Google Scholar] [CrossRef] [Green Version]
- Xiao, B.; Liu, Z.; Li, B.S.; Tang, B.; Li, W.; Guo, G.; Shi, Y.; Wang, F.; Wu, Y.; Tong, W.D.; et al. Induction of microRNA-155 during Helicobacter pylori infection and its negative regulatory role in the inflammatory response. J. Infect. Dis. 2009, 200, 916–925. [Google Scholar] [CrossRef] [Green Version]
- Arif, K.M.T.; Elliott, E.K.; Haupt, L.M.; Griffiths, L.R. Regulatory Mechanisms of Epigenetic miRNA Relationships in Human Cancer and Potential as Therapeutic Targets. Cancers 2020, 12, 2922. [Google Scholar] [CrossRef]
- Cao, H.; Huang, S.; Liu, A.; Chen, Z. Up-regulated expression of miR-155 in human colonic cancer. J. Cancer Res. Ther. 2018, 14, 604–607. [Google Scholar] [PubMed]
- Wang, D.; Tang, M.; Zong, P.; Liu, H.; Zhang, T.; Liu, Y.; Zhao, Y. MiRNA-155 Regulates the Th17/Treg Ratio by Targeting SOCS1 in Severe Acute Pancreatitis. Front. Physiol. 2018, 9, 686. [Google Scholar] [CrossRef] [PubMed] [Green Version]
- Escobar, T.; Yu, C.R.; Muljo, S.A.; Egwuagu, C.E. STAT3 activates miR-155 in Th17 cells and acts in concert to promote experimental autoimmune uveitis. Investig. Ophthalmol. Vis. Sci. 2013, 54, 4017–4025. [Google Scholar] [CrossRef] [PubMed] [Green Version]
- Adamowicz, M.; Milkiewicz, P.; Kempinska-Podhorodecka, A. 5-aminosalicylic acid inhibits the expression of oncomiRs and pro-inflammatory microRNAs: An in vitro study. J. Physiol. Pharm. 2021, 72, 529–535. [Google Scholar] [CrossRef]
- Furrie, E.; Macfarlane, S.; Thomson, G.; Macfarlane, G.T. Toll-like receptors-2, -3 and -4 expression patterns on human colon and their regulation by mucosal-associated bacteria. Immunology 2005, 115, 565–574. [Google Scholar] [CrossRef]
- Tili, E.; Michaille, J.J.; Croce, C.M. MicroRNAs play a central role in molecular dysfunctions linking inflammation with cancer. Immunol. Rev. 2013, 253, 167–184. [Google Scholar] [CrossRef]
- Ajouz, H.; Mukherji, D.; Shamseddine, A. Secondary bile acids: An underrecognized cause of colon cancer. World J. Surg. Oncol. 2014, 12, 164. [Google Scholar] [CrossRef] [Green Version]
- Iborra, M.; Bernuzzi, F.; Invernizzi, P.; Danese, S. MicroRNAs in autoimmunity and inflammatory bowel disease: Crucial regulators in immune response. Autoimmun. Rev. 2012, 11, 305–314. [Google Scholar] [CrossRef]
- Pekow, J.R.; Kwon, J.H. MicroRNAs in inflammatory bowel disease. Inflamm. Bowel Dis. 2012, 18, 187–193. [Google Scholar] [CrossRef]
- Vigorito, E.; Kohlhaas, S.; Lu, D.; Leyland, R. miR-155: An ancient regulator of the immune system. Immunol. Rev. 2013, 253, 146–157. [Google Scholar] [CrossRef]
- Horino, J.; Fujimoto, M.; Terabe, F.; Serada, S.; Takahashi, T.; Soma, Y.; Tanaka, K.; Chinen, T.; Yoshimura, A.; Nomura, S.; et al. Suppressor of cytokine signaling-1 ameliorates dextran sulfate sodium-induced colitis in mice. Int. Immunol. 2008, 20, 753–762. [Google Scholar] [CrossRef] [Green Version]
- Claessen, M.M.; Lutgens, M.W.; van Buuren, H.R.; Oldenburg, B.; Stokkers, P.C.; van der Woude, C.J.; Hommes, D.W.; de Jong, D.J.; Dijkstra, G.; van Bodegraven, A.A.; et al. More right-sided IBD-associated colorectal cancer in patients with primary sclerosing cholangitis. Inflamm. Bowel Dis. 2009, 15, 1331–1336. [Google Scholar] [CrossRef]
- Bala, S.; Marcos, M.; Kodys, K.; Csak, T.; Catalano, D.; Mandrekar, P.; Szabo, G. Up-regulation of microRNA-155 in macrophages contributes to increased tumor necrosis factor {alpha} (TNF{alpha}) production via increased mRNA half-life in alcoholic liver disease. J. Biol. Chem. 2011, 286, 1436–1444. [Google Scholar] [CrossRef] [Green Version]
- Sharma, A.R.; Sharma, G.; Lee, S.S.; Chakraborty, C. miRNA-Regulated Key Components of Cytokine Signaling Pathways and Inflammation in Rheumatoid Arthritis. Med. Res. Rev. 2016, 36, 425–439. [Google Scholar] [CrossRef]
- Churov, A.V.; Oleinik, E.K.; Knip, M. MicroRNAs in rheumatoid arthritis: Altered expression and diagnostic potential. Autoimmun. Rev. 2015, 14, 1029–1037. [Google Scholar] [CrossRef]
- Kempinska-Podhorodecka, A.; Blatkiewicz, M.; Wunsch, E.; Krupa, L.; Gutkowski, K.; Milkiewicz, P.; Milkiewicz, M. Oncomir MicroRNA-346 Is Upregulated in Colons of Patients with Primary Sclerosing Cholangitis. Clin. Transl. Gastroenterol. 2020, 11, e00112. [Google Scholar] [CrossRef]
- Judit, B.N. Role of altered expression of miR-146a, miR-155, and miR-122 in pediatric patients with inflammatory bowel disease. Inflamm. Bowel Dis. 2016, 22, 327–335. [Google Scholar]
- Alexander, W.S.; Hilton, D.J. The role of suppressors of cytokine signaling (SOCS) proteins in regulation of the immune response. Annu. Rev. Immunol. 2004, 22, 503–529. [Google Scholar] [CrossRef]
- Tye, H.; Kennedy, C.L.; Najdovska, M.; McLeod, L.; McCormack, W.; Hughes, N.; Dev, A.; Sievert, W.; Ooi, C.H.; Ishikawa, T.O.; et al. STAT3-driven upregulation of TLR2 promotes gastric tumorigenesis independent of tumor inflammation. Cancer Cell 2012, 22, 466–478. [Google Scholar] [CrossRef] [Green Version]
- Chen, S.H.; Murphy, D.A.; Lassoued, W.; Thurston, G.; Feldman, M.D.; Lee, W.M. Activated STAT3 is a mediator and biomarker of VEGF endothelial activation. Cancer Biol. Ther. 2008, 7, 1994–2003. [Google Scholar] [CrossRef] [Green Version]
- Laudisi, F.; Cherubini, F.; Monteleone, G.; Stolfi, C. STAT3 Interactors as Potential Therapeutic Targets for Cancer Treatment. Int. J. Mol. Sci. 2018, 19, 1787. [Google Scholar] [CrossRef] [PubMed] [Green Version]
- Boland, C.R.; Thibodeau, S.N.; Hamilton, S.R.; Sidransky, D.; Eshleman, J.R.; Burt, R.W.; Meltzer, S.J.; Rodriguez-Bigas, M.A.; Fodde, R.; Ranzani, G.N.; et al. A National Cancer Institute Workshop on Microsatellite Instability for cancer detection and familial predisposition: Development of international criteria for the determination of microsatellite instability in colorectal cancer. Cancer Res. 1998, 58, 5248–5257. [Google Scholar] [PubMed]
- Gryfe, R.; Kim, H.; Hsieh, E.T.; Aronson, M.D.; Holowaty, E.J.; Bull, S.B.; Redston, M.; Gallinger, S. Tumor microsatellite instability and clinical outcome in young patients with colorectal cancer. N. Engl. J. Med. 2000, 342, 69–77. [Google Scholar] [CrossRef] [PubMed]
- Popat, S.; Hubner, R.; Houlston, R.S. Systematic review of microsatellite instability and colorectal cancer prognosis. J. Clin. Oncol. 2005, 23, 609–618. [Google Scholar] [CrossRef]
- Carethers, J.M.; Smith, E.J.; Behling, C.A.; Nguyen, L.; Tajima, A.; Doctolero, R.T.; Cabrera, B.L.; Goel, A.; Arnold, C.A.; Miyai, K.; et al. Use of 5-fluorouracil and survival in patients with microsatellite-unstable colorectal cancer. Gastroenterology 2004, 126, 394–401. [Google Scholar] [CrossRef]
- Ribic, C.M.; Sargent, D.J.; Moore, M.J.; Thibodeau, S.N.; French, A.J.; Goldberg, R.M.; Hamilton, S.R.; Laurent-Puig, P.; Gryfe, R.; Shepherd, L.E.; et al. Tumor microsatellite-instability status as a predictor of benefit from fluorouracil-based adjuvant chemotherapy for colon cancer. N. Engl. J. Med. 2003, 349, 247–257. [Google Scholar] [CrossRef] [Green Version]
- Jover, R.; Zapater, P.; Castells, A.; Llor, X.; Andreu, M.; Cubiella, J.; Piñol, V.; Xicola, R.M.; Bujanda, L.; Reñé, J.M.; et al. Mismatch repair status in the prediction of benefit from adjuvant fluorouracil chemotherapy in colorectal cancer. Gut 2005, 55, 848–855. [Google Scholar] [CrossRef] [Green Version]
- Ozaki, K.; Nagasaka, T.; Notohara, K.; Kambara, T.; Takeda, M.; Sasamoto, H.; Jass, J.R.; Tanaka, N.; Matsubara, N. Heterogeneous microsatellite instability observed within epithelium of ulcerative colitis. Int. J. Cancer 2006, 119, 2513–2519. [Google Scholar] [CrossRef] [Green Version]
- Yagishita, H.; Yoshida, T.; Ishiguro, K.; Numata, Y.; Okayasu, I. Epithelial and stromal genetic instability linked to tumor suppressor genes in ulcerative colitis-associated tumorigenesis. Scand. J. Gastroenterol. 2008, 43, 559–566. [Google Scholar] [CrossRef]
- Kempinska-Podhorodecka, A.; Adamowicz, M.; Ostrycharz, E.; Chmielarz, M.; Wojcicki, M.; Milkiewicz, P.; Milkiewicz, M. Role of miR-506 in ulcerative colitis associated with primary sclerosing cholangitis. Sci. Rep. 2021, 11, 10134. [Google Scholar] [CrossRef]
- Ryan, K.M.; Phillips, A.C.; Vousden, K.H. Regulation and function of the p53 tumor suppressor protein. Curr. Opin. Cell Biol. 2001, 13, 332–337. [Google Scholar] [CrossRef]
- Lashner, B.A.; Silverstein, M.D.; Hanauer, S.B. Hazard rates for dysplasia and cancer in ulcerative colitis. Results from a surveillance program. Dig. Dis. Sci. 1989, 34, 1536–1541. [Google Scholar] [CrossRef]
- Gyde, S.N.; Prior, P.; Allan, R.N.; Stevens, A.; Jewell, D.P.; Truelove, S.C.; Lofberg, R.; Brostrom, O.; Hellers, G. Colorectal cancer in ulcerative colitis: A cohort study of primary referrals from three centres. Gut 1988, 29, 206–217. [Google Scholar] [CrossRef]
- Isbell, G.; Levin, B. Ulcerative Colitis and Colon Cancer. Gastroenterol. Clin. N. Am. 1988, 17, 773–791. [Google Scholar] [CrossRef]
- Riddell, R.H.; Goldman, H.; Ransohoff, D.F.; Appelman, H.D.; Fenoglio, C.M.; Haggitt, R.C.; Ahren, C.; Correa, P.; Hamilton, S.R.; Morson, B.C.; et al. Dysplasia in inflammatory bowel disease: Standardized classification with provisional clinical applications. Hum. Pathol. 1983, 14, 931–968. [Google Scholar] [CrossRef]
- Marei, H.E.; Althani, A.; Afifi, N.; Hasan, A.; Caceci, T.; Pozzoli, G.; Morrione, A.; Giordano, A.; Cenciarelli, C. p53 signaling in cancer progression and therapy. Cancer Cell Int. 2021, 21, 703. [Google Scholar] [CrossRef]
- Bettelli, E.; Carrier, Y.; Gao, W.; Korn, T.; Strom, T.B.; Oukka, M.; Weiner, H.L.; Kuchroo, V.K. Reciprocal developmental pathways for the generation of pathogenic effector TH17 and regulatory T cells. Nature 2006, 441, 235–238. [Google Scholar] [CrossRef]
- Chen, W.; Jin, W.; Hardegen, N.; Lei, K.J.; Li, L.; Marinos, N.; McGrady, G.; Wahl, S.M. Conversion of peripheral CD4 + CD25- naive T cells to CD4 + CD25+ regulatory T cells by TGF-beta induction of transcription factor Foxp3. J. Exp. Med. 2003, 198, 1875–1886. [Google Scholar] [CrossRef]
- Wing, K.; Sakaguchi, S. Regulatory T cells exert checks and balances on self tolerance and autoimmunity. Nat. Immunol. 2010, 11, 7–13. [Google Scholar] [CrossRef]
- Hu, W.; Troutman, T.D.; Edukulla, R.; Pasare, C. Priming microenvironments dictate cytokine requirements for T helper 17 cell lineage commitment. Immunity 2011, 35, 1010–1022. [Google Scholar] [CrossRef] [Green Version]
- Kimura, A.; Kishimoto, T. IL-6: Regulator of Treg/Th17 balance. Eur. J. Immunol. 2010, 40, 1830–1835. [Google Scholar] [CrossRef] [PubMed]
- Tzartos, J.S.; Friese, M.A.; Craner, M.J.; Palace, J.; Newcombe, J.; Esiri, M.M.; Fugger, L. Interleukin-17 production in central nervous system-infiltrating T cells and glial cells is associated with active disease in multiple sclerosis. Am. J. Pathol. 2008, 172, 146–155. [Google Scholar] [CrossRef] [PubMed] [Green Version]
- Jamshidian, A.; Kazemi, M.; Shaygannejad, V.; Salehi, M. The Effect of Plasma Exchange on the Expression of FOXP3 and RORC2 in Relapsed Multiple Sclerosis Patients. Iran. J. Immunol. 2015, 12, 311–318. [Google Scholar] [PubMed]
- Jamshidian, A.; Shaygannejad, V.; Pourazar, A.; Zarkesh-Esfahani, S.H.; Gharagozloo, M. Biased Treg/Th17 balance away from regulatory toward inflammatory phenotype in relapsed multiple sclerosis and its correlation with severity of symptoms. J. Neuroimmunol. 2013, 262, 106–112. [Google Scholar] [CrossRef]
- Lochner, M.; Wang, Z.; Sparwasser, T. The Special Relationship in the Development and Function of T Helper 17 and Regulatory T Cells. Prog. Mol. Biol. Transl. Sci. 2015, 136, 99–129. [Google Scholar]
- Venkatesha, S.H.; Dudics, S.; Weingartner, E.; So, E.C.; Pedra, J.; Moudgil, K.D. Altered Th17/Treg balance and dysregulated IL-1beta response influence susceptibility/resistance to experimental autoimmune arthritis. Int. J. Immunopathol. Pharmacol. 2015, 28, 318–328. [Google Scholar] [CrossRef]
- Pappu, R.; Rutz, S.; Ouyang, W. Regulation of epithelial immunity by IL-17 family cytokines. Trends Immunol. 2012, 33, 343–349. [Google Scholar] [CrossRef]
- Makita, S.; Kanai, T.; Oshima, S.; Uraushihara, K.; Totsuka, T.; Sawada, T.; Nakamura, T.; Koganei, K.; Fukushima, T.; Watanabe, M. CD4+CD25bright T cells in human intestinal lamina propria as regulatory cells. J. Immunol. 2004, 173, 3119–3130. [Google Scholar] [CrossRef] [Green Version]
- Yu, Q.T.; Saruta, M.; Avanesyan, A.; Fleshner, P.R.; Banham, A.H.; Papadakis, K.A. Expression and functional characterization of FOXP3 + CD4+ regulatory T cells in ulcerative colitis. Inflamm. Bowel Dis. 2007, 13, 191–199. [Google Scholar] [CrossRef]
- Yamamoto, M.; Kondo, E.; Takeuchi, M.; Harashima, A.; Otani, T.; Tsuji-Takayama, K.; Yamasaki, F.; Kumon, H.; Kibata, M.; Nakamura, S. miR-155, a Modulator of FOXO3a Protein Expression, Is Underexpressed and Cannot Be Upregulated by Stimulation of HOZOT, a Line of Multifunctional Treg. PLoS ONE 2011, 6, e16841. [Google Scholar] [CrossRef]
- Wildin, R.S.; Ramsdell, F.; Peake, J.; Faravelli, F.; Casanova, J.L.; Buist, N.; Levy-Lahad, E.; Mazzella, M.; Goulet, O.; Perroni, L.; et al. X-linked neonatal diabetes mellitus, enteropathy and endocrinopathy syndrome is the human equivalent of mouse scurfy. Nat. Genet. 2001, 27, 18–20. [Google Scholar] [CrossRef]
- Bennett, C.L.; Christie, J.; Ramsdell, F.; Brunkow, M.E.; Ferguson, P.J.; Whitesell, L.; Kelly, T.E.; Saulsbury, F.T.; Chance, P.F.; Ochs, H.D. The immune dysregulation, polyendocrinopathy, enteropathy, X-linked syndrome (IPEX) is caused by mutations of FOXP3. Nat. Genet. 2001, 27, 20–21. [Google Scholar] [CrossRef]
- Brunkow, M.E.; Jeffery, E.W.; Hjerrild, K.A.; Paeper, B.; Clark, L.B.; Yasayko, S.A.; Wilkinson, J.E.; Galas, D.; Ziegler, S.F.; Ramsdell, F. Disruption of a new forkhead/winged-helix protein, scurfin, results in the fatal lymphoproliferative disorder of the scurfy mouse. Nat. Genet. 2001, 27, 68–73. [Google Scholar] [CrossRef]
- Grivennikov, S.; Karin, E.; Terzic, J.; Mucida, D.; Yu, G.Y.; Vallabhapurapu, S.; Scheller, J.; Rose-John, S.; Cheroutre, H.; Eckmann, L.; et al. IL-6 and Stat3 are required for survival of intestinal epithelial cells and development of colitis-associated cancer. Cancer Cell 2009, 15, 103–113. [Google Scholar] [CrossRef] [Green Version]
- Nguyen, A.V.; Wu, Y.-Y.; Lin, E.Y. STAT3 and sphingosine-1-phosphate in inflammation-associated colorectal cancer. World J. Gastroenterol. 2014, 20, 10279–10287. [Google Scholar] [CrossRef]
- Garris, C.S.; Wu, L.; Acharya, S.; Arac, A.; Blaho, V.A.; Huang, Y.; Moon, B.S.; Axtell, R.C.; Ho, P.P.; Steinberg, G.K.; et al. Defective sphingosine 1-phosphate receptor 1 (S1P1) phosphorylation exacerbates TH17-mediated autoimmune neuroinflammation. Nat. Immunol. 2013, 14, 1166–1172. [Google Scholar] [CrossRef] [Green Version]
- Battista, K.D.; Shearn, C.T.; Alexeev, E.E.; Glover, L.E.; Petersen, D.R.; Colgan, S.P.; Fennimore, B.P. A Novel Murine Model of Primary Sclerosing Cholangitis Associated Inflammatory Bowel Disease. FASEB J. 2017, 31, 469.1. [Google Scholar]
- Fickert, P.; Pollheimer, M.J.; Beuers, U.; Lackner, C.; Hirschfield, G.; Housset, C.; Keitel, V.; Schramm, C.; Marschall, H.-U.; Karlsen, T.H.; et al. Characterization of animal models for primary sclerosing cholangitis (PSC). J. Hepatol. 2014, 60, 1290–1303. [Google Scholar] [CrossRef] [Green Version]


| Control (n = 10) | PSC (n = 10) | PSC-UC (n = 10) | UC (n = 10) | |
|---|---|---|---|---|
| Gender (Male/Female) | 6/4 | 8/2 | 8/2 | 2/8 |
| Age (years) | 50 ± 4 | 28 ± 10 | 34 ± 15 | 43 ± 17 |
| Hb (mg/dl, normal M: 14–18, F: 12–16) | ND | 15 ± 0.8 | 16. ± 1.7 | ND |
| Bilirubin (mg/dl, normal < 1.1) | ND | 1.2 ± 0.4 | 2.6 ± 0.7 | 0.4 ± 0.2 |
| ALP (IU/l, normal 30–120) | ND | 304 ± 241 | 381 ± 277 | 80 ± 24 |
| GGTP (IU/l, normal M < 100, F < 66) | ND | 325 ± 310 | 484 ± 232 | 17 ± 13.3 |
| ALT (IU/l, normal < 40) | ND | 103 ± 72 | 104 ± 23 | 15 ± 8.4 |
| Cirrhosis (yes/no) | N/A | 4/6 | 4/6 | N/A |
Publisher’s Note: MDPI stays neutral with regard to jurisdictional claims in published maps and institutional affiliations. |
© 2022 by the authors. Licensee MDPI, Basel, Switzerland. This article is an open access article distributed under the terms and conditions of the Creative Commons Attribution (CC BY) license (https://creativecommons.org/licenses/by/4.0/).
Share and Cite
Adamowicz, M.; Stukan, I.; Milkiewicz, P.; Bialek, A.; Milkiewicz, M.; Kempinska-Podhorodecka, A. Modulation of Mismatch Repair and the SOCS1/p53 Axis by microRNA-155 in the Colon of Patients with Primary Sclerosing Cholangitis. Int. J. Mol. Sci. 2022, 23, 4905. https://doi.org/10.3390/ijms23094905
Adamowicz M, Stukan I, Milkiewicz P, Bialek A, Milkiewicz M, Kempinska-Podhorodecka A. Modulation of Mismatch Repair and the SOCS1/p53 Axis by microRNA-155 in the Colon of Patients with Primary Sclerosing Cholangitis. International Journal of Molecular Sciences. 2022; 23(9):4905. https://doi.org/10.3390/ijms23094905
Chicago/Turabian StyleAdamowicz, Monika, Iga Stukan, Piotr Milkiewicz, Andrzej Bialek, Malgorzata Milkiewicz, and Agnieszka Kempinska-Podhorodecka. 2022. "Modulation of Mismatch Repair and the SOCS1/p53 Axis by microRNA-155 in the Colon of Patients with Primary Sclerosing Cholangitis" International Journal of Molecular Sciences 23, no. 9: 4905. https://doi.org/10.3390/ijms23094905
APA StyleAdamowicz, M., Stukan, I., Milkiewicz, P., Bialek, A., Milkiewicz, M., & Kempinska-Podhorodecka, A. (2022). Modulation of Mismatch Repair and the SOCS1/p53 Axis by microRNA-155 in the Colon of Patients with Primary Sclerosing Cholangitis. International Journal of Molecular Sciences, 23(9), 4905. https://doi.org/10.3390/ijms23094905