
Electron Transfer in a Bio-Photoelectrode Based on Photosystem I Multilayer Immobilized on the Conducting Glass

 ,
,  and
and
Abstract
1. Introduction
2. Materials and Methods
2.1. Preparation of PSI Particles
2.2. Electrodeposition of PSI on FTO Conducting Glass and Steady-State Absorption Measurements
2.3. Photocurrent Measurements
2.4. Time-Resolved Absorption Measurements
3. Results and Discussion
3.1. Photocurrent Measurements
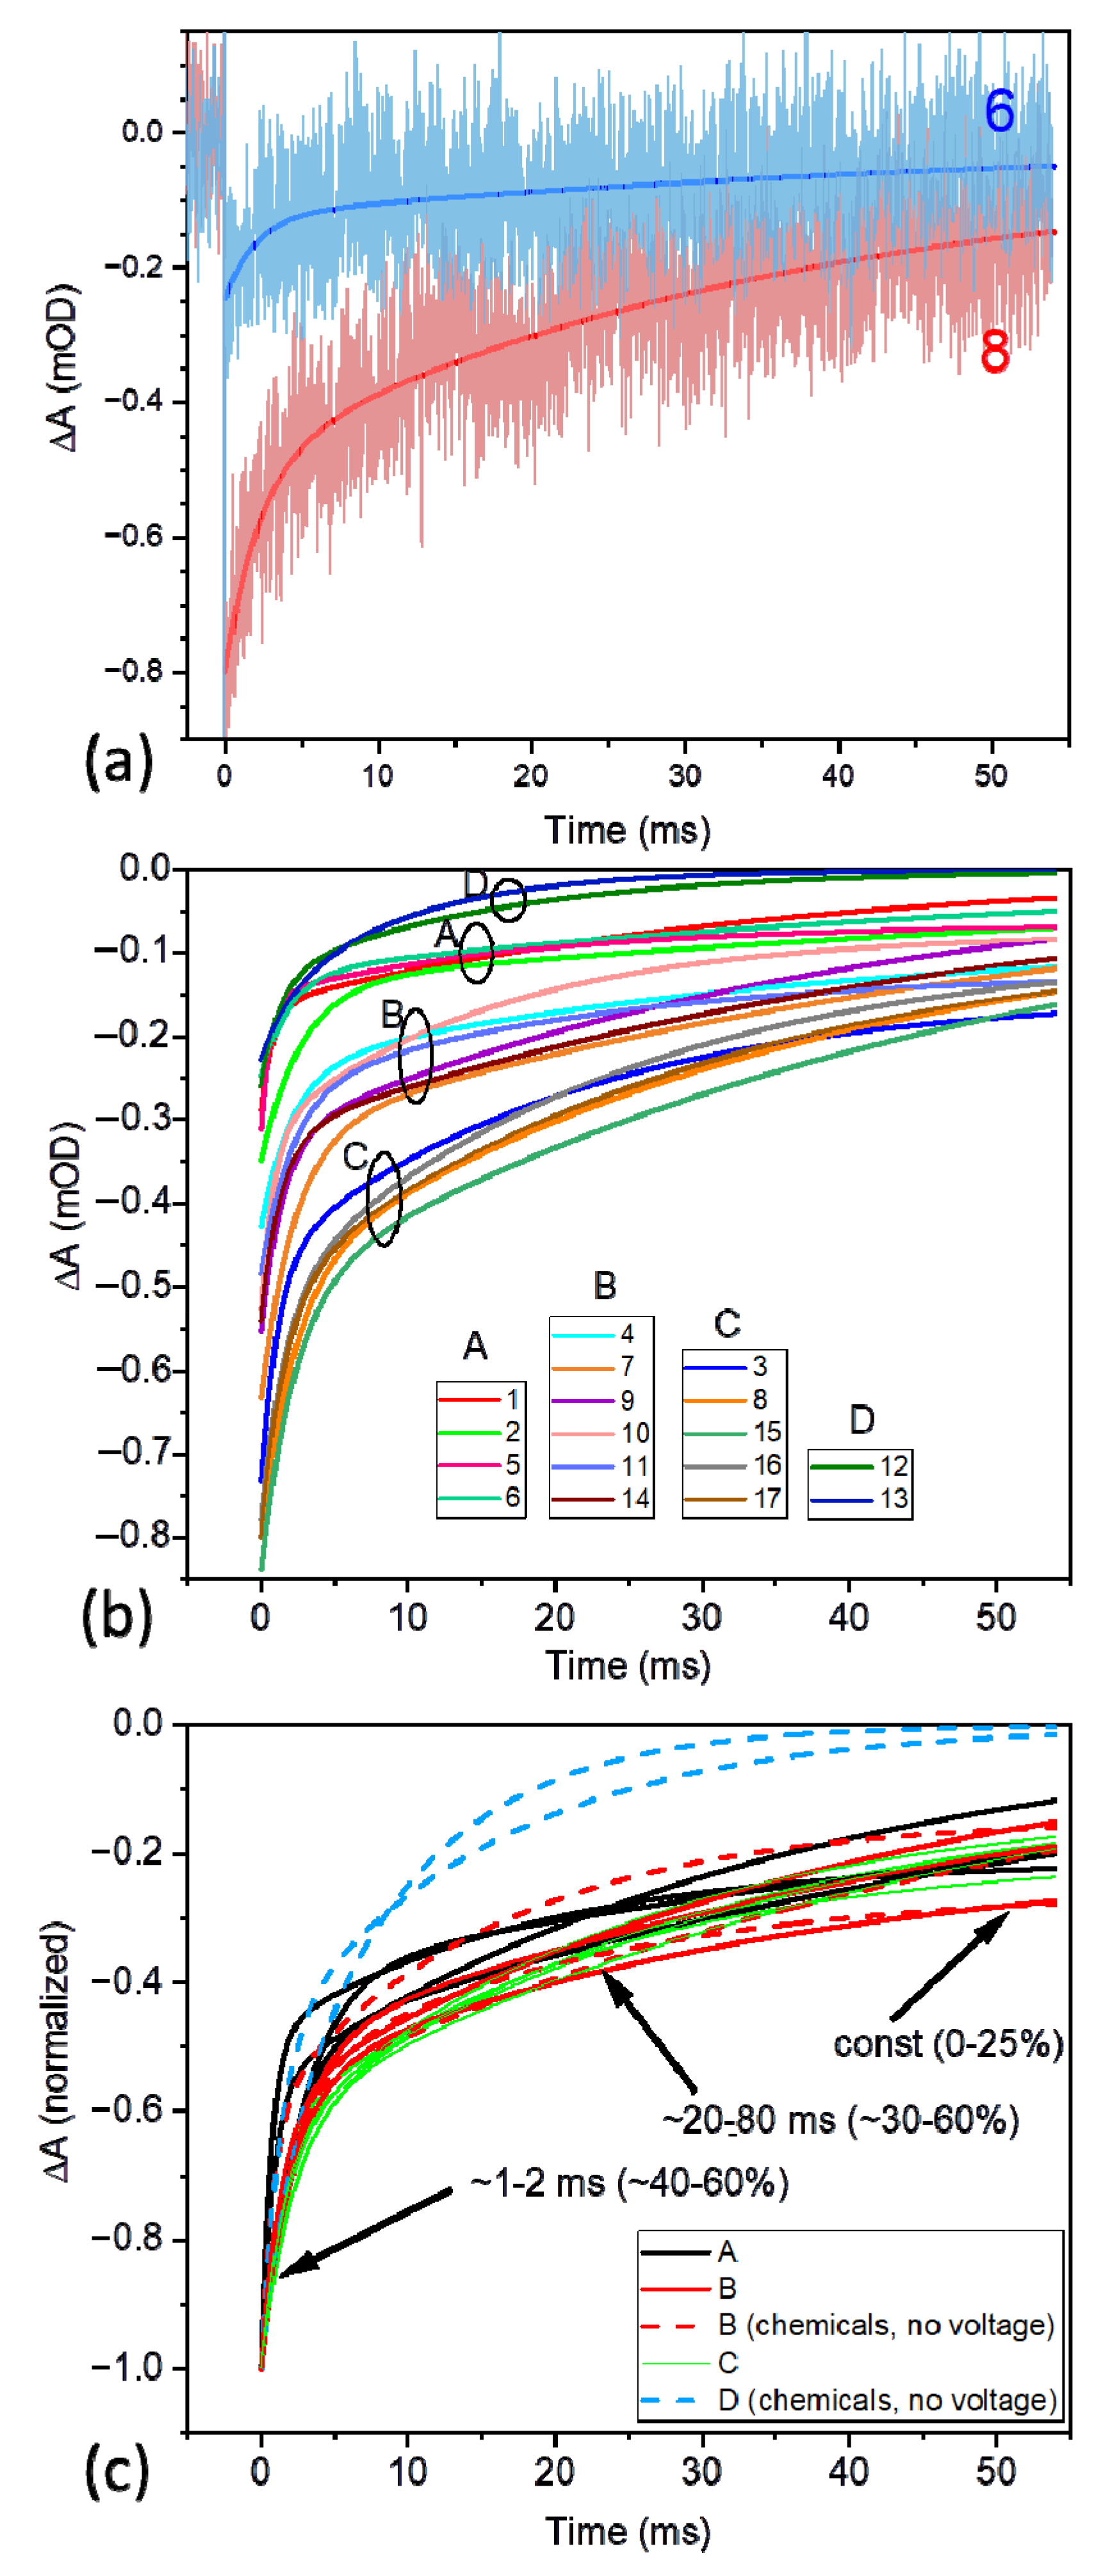
3.2. Time-Resolved Absorption Measurements
3.2.1. General Comments on the Kinetics of the P+ ΔA Signal
3.2.2. Initial P+ Photobleaching Signal as a Function of Voltage Applied to the PSI-FTO Electrode in the Absence of the Redox Compounds
3.2.3. Kinetics of the P+ Photobleaching Signal at Different Voltages Applied to the PSI-FTO Electrode in the Absence of the Redox Compounds
3.2.4. Kinetics of the P+ Photobleaching Signal in the Presence of the Redox Compounds
3.3. Comparison of the Time-Resolved Absorption and Photocurrent Results
4. Summary and Conclusions
Author Contributions
Funding
Institutional Review Board Statement
Informed Consent Statement
Data Availability Statement
Acknowledgments
Conflicts of Interest
References
- Carmeli, I.; Frolov, L.; Carmeli, C.; Richter, S. Photovoltaic Activity of Photosystem I-Based Self-Assembled Monolayer. J. Am. Chem. Soc. 2007, 129, 12353. [Google Scholar] [CrossRef] [PubMed]
- Gordiichuk, P.I.; Wetzelaer, G.A.H.; Rimmerman, D.; Gruszka, A.; de Vries, J.W.; Saller, M.; Gautier, D.A.; Catarci, S.; Pesce, D.; Richter, S.; et al. Solid-State Biophotovoltaic Cells Containing Photosystem I. Adv. Mater. 2014, 26, 4863–4869. [Google Scholar] [CrossRef] [PubMed]
- Nguyen, K.; Bruce, B.D. Growing green electricity: Progress and strategies for use of Photosystem I for sustainable photovoltaic energy conversion. Biochim. Biophys. Acta Bioenerg. 2013, 9, 1553–1566. [Google Scholar] [CrossRef] [PubMed]
- Gizzie, E.A.; LeBlanc, G.; Jennings, G.K.; Cliffel, D.E. Electrochemical preparation of Photosystem I-polyaniline composite films for biohybrid solar energy conversion. ACS Appl. Mater. Interfaces 2015, 7, 9328–9335. [Google Scholar] [CrossRef]
- Wolfe, K.D.; Dervishogullari, D.; Passantino, J.M.; Stachurski, C.D.; Jennings, G.K.; Cliffel, D.E. Improving the stability of photosystem I–based bioelectrodes for solar energy conversion. Curr. Opin. Electrochem. 2020, 19, 27–34. [Google Scholar] [CrossRef]
- Teodor, A.H.; Bruce, B.D. Putting Photosystem I to work: Truly green energy. Trends Biotechnol. 2020, 38, 1329–1342. [Google Scholar] [CrossRef]
- Torabi, N.; Qiu, X.; López-Ortiz, M.; Loznik, M.; Hermann, A.; Kermanpur, A.; Ashrafi, A.; Chiechi, R.C. Fullerenes Enhance Self-Assembly and Electron Injection of Photosystem I in Biophotovoltaic Devices. Langmuir 2021, 37, 11465–11473. [Google Scholar] [CrossRef]
- Brettel, K. Electron transfer and arrangement of the redox cofactors in photosystem I. Biochim. Biophys. Acta Bioenerg. 1997, 1318, 322–373. [Google Scholar] [CrossRef]
- Brettel, K.; Leibl, W. Electron transfer in Photosystem I. Biochim. Biophys. Acta Bioenerg. 2021, 1507, 100–114. [Google Scholar] [CrossRef]
- Nelson, N.; Junge, W. Structure and energy transfer in photosystems of oxygenic photosynthesis. Annu. Rev. Biochem. 2015, 84, 659–683. [Google Scholar] [CrossRef]
- Blankenship, R.E. Molecular Mechanisms of Photosynthesis; Kluwer Academic Publishers: Norwell, MA, USA, 2021. [Google Scholar]
- Haniewicz, P.; Abram, M.; Nosek, L.; Kirkpatrick, J.; El-Mohsnawy, E.; Olmos, J.D.J.; Kouril, R.; Kargul, J.M. Molecular mechanisms of photoadaptation of photosystem I supercomplex from an evolutionary cyanobacterial/algal intermediate. Plant Physiol. 2018, 176, 1433–1451. [Google Scholar] [CrossRef] [PubMed]
- Bottin, H.; Mathis, P. Interaction of plastocyanin with the photosystem I reaction center: A kinetic study by flash absorption spectroscopy. Biochemistry 1985, 24, 6453–6460. [Google Scholar] [CrossRef]
- Hippler, M.; Drepper, F.; Farah, J.; Rochaix, J.D. Fast electron transfer from cytochrome c6 and plastocyanin to photosystem I of Chlamydomonas reinhardtii requires PsaF. Biochemistry 1997, 36, 6343–6349. [Google Scholar] [CrossRef] [PubMed]
- Delosme, R. Electron transfer from cytochrome f to photosystem I in green algae. Photosynth. Res. 1991, 29, 45–54. [Google Scholar]
- Ramesh, V.M.; Guergova-Kuras, M.; Joliot, P.; Webber, A.N. Electron Transfer from Plastocyanin to the Photosystem I Reaction Center in Mutants with Increased Potential of the Primary Donor in Chlamydomonas Reinhardtii. Biochemistry 2002, 41, 14652–14658. [Google Scholar] [CrossRef]
- Setif, P.; Bottin, H. Laser flash absorption spectroscopy study of ferredoxin reduction by photosystem I in Synechocystis sp. PCC 6803: Evidence for submicrosecond and microsecond kinetics. Biochemistry. 1994, 33, 8495–8504. [Google Scholar] [CrossRef]
- Setif, P.; Bottin, H. Laser £ash absorption spectroscopy study of ferredoxin reduction by photosystem I: Spectral and kinetic evidence for the existence of several photosystem I-ferredoxin complexes. Biochemistry 1995, 34, 9059–9070. [Google Scholar] [CrossRef]
- Fischer, N.; Setif, P.; Rochaix, J.D. Targeted mutations in the psaC gene of Chlamydomonas reinhardtii: Preferential reduction of FB at low temperature is not accompanied by altered electron flow from photosystem I to ferredoxin. Biochemistry 1997, 36, 93–102. [Google Scholar] [CrossRef]
- Fischer, N.; Hippler, M.; Setif, P.; Jacquot, J.P.; Rochaix, J.D. The PsaC subunit of photosystem I provides an essential lysine residue for fast electron transfer to ferredoxin. EMBO J. 1998, 17, 849–858. [Google Scholar] [CrossRef]
- Setif, P. Ferredoxin and flavodoxin reduction by photosystem I. Biochim. Biophys. Acta Bioenerg. 2001, 1507, 161–179. [Google Scholar] [CrossRef]
- Kurashov, V.; Gorka, M.; Milanovsky, G.E.; Johnson, T.W.; Cherepanov, D.A.; Semenov, A.Y.; Golbeck, J.H. Critical evaluation of electron transfer kinetics in P700–FA/FB, P700–FX, and P700–A1 Photosystem I core complexes in liquid and in trehalose glass. Biochim. Biophys. Acta Bioenerg. 2018, 1859, 1288–1301. [Google Scholar] [CrossRef]
- Vassiliev, I.R.; Jung, Y.S.; Mamedov, M.D.; Semenov, A.Y.; Golbeck, J.H. Near-IR absorbance changes and electrogenic reactions in the microsecond-to-second time domain in photosystem I. Biophys J. 1997, 72, 301–315. [Google Scholar] [CrossRef][Green Version]
- Goyal, A.; Szewczyk, S.; Burdziński, G.; Abram, M.; Kargul, J.; Gibasiewicz, K. Competition between intra-protein charge recombination and electron transfer outside photosystem I complexes used for photovoltaic applications. Photochem. Photobiol. Sci. 2022, 21, 319–336. [Google Scholar] [CrossRef]
- Zhao, F.; Wang, P.; Ruff, A.; Hartmann, V.; Zacarias, S.; Pereira, I.A.C.; Nowaczyk, M.; Rogner, M.; Conzuelo, F.; Schuhmann, W. A photosystem I monolayer with anisotropic electron flow enables Z-scheme like photosynthetic water splitting. Energy Environ. Sci. 2019, 12, 3133–3143. [Google Scholar] [CrossRef]
- Stieger, K.R.; Ciornii, D.; Kolsch, A.; Hejazi, M.; Lokstein, H.; Feifel, S.C.; Zouni, A.; Lisdat, F. Engineering of supramolecular photoactive protein architectures: The defined co-assembly of photosystem I and cytochrome c using a nanoscaled DNA-matrix. Nanoscale 2016, 8, 10695–10705. [Google Scholar] [CrossRef]
- Szewczyk, S.; Białek, R.; Burdziński, G.; Gibasiewicz, K. Photovoltaic activity of electrodes based on intact photosystem I electrodeposited on bare conducting glass. Photosynth. Res. 2020, 144, 1–12. [Google Scholar] [CrossRef] [PubMed]
- Ciesielski, P.N.; Faulkner, C.J.; Irwin, M.T.; Gregory, J.M.; Tolk, N.H.; Cliffel, D.E.; Jennings, G.K. Enhanced photocurrent production by photosystem I multilayer assemblies. Adv. Funct. Mat. 2010, 20, 4048–4054. [Google Scholar] [CrossRef]
- Gunther, D.; LeBlanc, G.; Prasai, D.; Zhang, J.R.; Cliffel, D.E.; Bolotin, K.L.; Jennings, G.K. Photosystem I on graphene as a highly transparent, photoactive electrode. Langmuir 2021, 29, 4177–4180. [Google Scholar] [CrossRef]
- Feifel, S.C.; Stieger, K.R.; Lokstein, H.; Lux, H.; Lisdat, F. High photocurrent generation by photosystem I on artificial interfaces composed of π-system-modified graphene. J. Mater. Chem. A 2015, 3, 12188–12196. [Google Scholar] [CrossRef]
- Shah, V.B.; Henson, W.R.; Chadha, T.S.; Lakin, G.; Liu, H.; Blankenship, R.E.; Biswas, P. Linker-free deposition and adhesion of photosystem I onto nanostructured TiO2 for biohybrid photoelectrochemical cells. Langmuir 2015, 31, 1675–1682. [Google Scholar] [CrossRef]
- Wang, P.; Frank, A.; Zhano, F.; Szczesny, J.; Junqueira, J.R.C.; Zacaras, S.; Ruff, A.; Nowaczyk, M.; Pereira, I.A.C.; Rogner, M.; et al. Closing the Gap for Electronic Short-Circuiting: Photosystem I Mixed Monolayers Enable Improved Anisotropic Electron Flow in Biophotovoltaic Devices. Angew. Chem. Int. Ed. 2020, 60, 2000–2006. [Google Scholar] [CrossRef] [PubMed]
- Stieger, K.R.; Feifel, S.C.; Lokstein, H.; Hejazi, M.; Zouni, A.; Lisdat, F. Biohybrid architectures for efficient light-to-current conversion based on photosystem I within scalable 3D mesoporous electrodes. J. Mater. Chem. A 2016, 43, 17009–17017. [Google Scholar] [CrossRef]
- Mershin, A.; Matsumoto, K.; Kaiser, L.; Yu, D.; Vaughn, M.; Nazeeruddin, M.K.; Bruce, B.D.; Graetzel, M.; Zhang, S. Self-assembled photosystem-I biophotovoltaics on nanostructured TiO2 and ZnO. Sci. Rep. 2021, 2, 234. [Google Scholar] [CrossRef] [PubMed]
- Yu, D.; Wang, M.; Zhu, G.; Ge, B.; Liu, S.; Huang, F. Enhanced photocurrent production by bio-dyes of photosynthetic macromolecules on designed TiO2 film. Sci. Rep. 2015, 5, 9375. [Google Scholar] [CrossRef]
- Szewczyk, S.; Giera, W.; D’Haene, S.; van Grondelle, R.; Gibasiewicz, K. Comparison of excitation energy transfer in cyanobacterial photosystem I in solution and immobilized on conducting glass. Photosynth. Res. 2017, 132, 111–126. [Google Scholar] [CrossRef]
- Abram, M.; Białek, R.; Szewczyk, S.; Karolczak, J.; Gibasiewicz, K.; Kargul, J. Remodeling of excitation energy transfer in extremophilic red algal PSI-LHCI complex during light adaptation. Biochim. Biophys. Acta Bioenerg. 2020, 1, 148093. [Google Scholar] [CrossRef]
- Müh, F.; Zouni, A. Extinction coefficients and critical solubilisation concentrations of photosystem I and II from Thermosynechococcus elongatus. Biochim. Biophys. Acta 2005, 1708, 219–228. [Google Scholar] [CrossRef]
- Trubitsin, B.V.; Mamedov, M.D.; Semenov, Y.A.; Tikhonov, A.N. Interaction of ascorbate with Photosystem I. Photosynth. Res. 2014, 122, 215–231. [Google Scholar] [CrossRef]
- Burdzinski, G.; Bayda, M.; Hug, G.; Majchrak, M.; Marciniec, B.; Marciniak, B. Time-resolved studies on the photoisomerization of a phenylene-silylene- vinylene type compound in its first singlet excited state. J. Lumin. 2011, 131, 577–580. [Google Scholar] [CrossRef]
- Kiliszek, M.; Harputlu, E.; Szalkowski, M.; Kowalsa, D.; Unlu, C.G.; Haniewicz, P.; Abram, M.; Wiwatowski, K.; Niedziółka-Jonsson, J.; Maćkowski, S.; et al. Orientation of photosystem I on graphene through cytochrome c533 leads to improvement in photocurrent generation. J. Mater. Chem. A 2018, 6, 18615–18626. [Google Scholar] [CrossRef]
- Izzo, M.; Jacquet, M.; Fujiwara, T.; Harputlu, E.; Mazur, R.; Wróbel, P.; Góral, T.; Unlu, C.G.; Ocakoglu, K.; Miyagishima, S.; et al. Development of a novel nanoarchitecture of the robust photosystem I from a volcanic microalga Cyanidioschyzon merola on single graphene for improved photocurrent generation. Int. J. Mol. Sci. 2021, 22, 8369. [Google Scholar] [CrossRef] [PubMed]
- Szalkowski, M.; Harputlu, E.; Kiliszek, M.; Unlu, C.G.; Maćkowski, S.; Ocakoglu, K.; Kargul, J.; Kowalska, D. Plasmonic enhancement of photocurrent generation in a photosystem I-based hybrid electrode. J. Mater. Chem. C 2020, 8, 5807–5814. [Google Scholar] [CrossRef]
- Nakamura, A.; Suzawa, T.; Watanabe, T. Spectroelectrochemical determination of the redox potential of P700 in spinach with an optically transparent thin-layer electrode. Chem. Lett. 2004, 33, 688–689. [Google Scholar] [CrossRef]
- Zhang, J.Z.; Sokol, K.P.; Paul, N.; Romero, E.; van Grondelle, R.; Reisner, E. Competing charge transfer pathways at the photosystem II-electrode interface. Nat. Chem. Biol. 2016, 12, 1046–1052. [Google Scholar] [CrossRef]
- Ciesielski, P.N.; Hijazi, F.M.; Scott, A.M.; Faulkner, C.J.; Beard, L.; Emmett, K.; Rosenthal, S.J.; Cliffel, D.; Jennings, G.K. Photosystem I—Based biohybrid photoelectrochemical cells. Bioresour. Technol. 2010, 101, 3047–3053. [Google Scholar] [CrossRef] [PubMed]


| Expe-riment Number | Experimental Conditions | Parameters of Kinetic Traces | ||||||||
|---|---|---|---|---|---|---|---|---|---|---|
| Potential (V) | [Asc] (mM) | [DCPIP] (µM) | f (Hz) | −ΔA0 (mOD) | ΔA0,rel (%) | τ1 (ms) A1 | τ2 (ms) A2 | const | τave (ms) | |
| (A) PSI-FTO, A679 = 0.27 | ||||||||||
| (A1) Experiments with variable potential of WE and without redox compounds in electrolyte | ||||||||||
| 1 | 0.22 (2) | - | - | 0.05 | 0.28 | 12 | 0.8 0.44 | 34 0.56 | 0.00 | 19.4 |
| 2 | 0.02 | - | - | 0.05 | 0.35 | 15 | 2.7 0.61 | 81 0.39 | 0.00 | 33.2 |
| 3 | −0.18 | - | - | 0.05 | 0.73 | 31 | 1.1 0.36 | 21 0.44 | 0.20 | - |
| 4 | 0.22 | - | - | 0.05 | 0.43 | 18 | 2.1 0.44 | 34 0.36 | 0.20 | - |
| 5 | 0.42 | - | - | 0.05 | 0.30 | 13 | 0.7 0.53 | 18 0.29 | 0.18 | - |
| 6 | 0.62 | - | - | 0.05 | 0.25 | 10 | 2.0 0.49 | 59 0.50 | 0.01 | 30.5 |
| 7 | −0.18 | - | - | 0.05 | 0.63 | 26 | 2.3 0.50 | 55 0.50 | 0.00 | 28.7 |
| 8 | −0.28 | - | - | 0.05 | 0.80 | 33 | 2.2 0.39 | 35 0.56 | 0.05 | - |
| 9 | 0.02 | - | - | 0.05 | 0.55 | 23 | 1.5 0.42 | 40 0.58 | 0.00 | 23.8 |
| (A2) Experiments with no potential applied to WE and with redox compounds in electrolyte | ||||||||||
| 10 | - | 10 | - | 0.05 | 0.52 | 22 | 0.8 0.41 | 16 0.46 | 0.13 | - |
| 11 | - | 10 | 4 | 0.05 | 0.48 | 20 | 2.1 0.44 | 21 0.31 | 0.25 | - |
| 12 | - | 10 | 40 | 0.5 | 0.26 | 11 | 1.3 0.50 | 15 0.50 | 0.00 | 8.2 |
| 13 | - | 10 | 200 | 0.5 | 0.23 | 10 | 2.0 0.29 | 9.4 0.71 | 0.00 | 7.3 |
| 14 | - | 10 | 200 | 0.05 | 0.54 | 23 | 1.4 0.41 | 49 0.59 | 0.00 | 29.5 |
| (A3) Experiments with negative potentials applied to WE and with redox compounds in electrolyte | ||||||||||
| 15 | −0.4 | 10 | 200 | 0.05 | 0.84 | 35 | 2.2 0.39 | 47 0.61 | 0.00 | 29.5 |
| 16 | −0.4 | 10 | 200 | 0.5 | 0.77 | 32 | 1.6 0.34 | 24 0.55 | 0.11 | - |
| 17 | −0.5 | 10 | 200 | 0.5 | 0.80 | 33 | 1.6 0.36 | 29 0.54 | 0.10 | - |
| (B) PSI in solution, A679 = 0.6 (3) | ||||||||||
| - | 10 | 40 | 0.5 | 5.3 | 100 | 6.3 0.12 | 41 0.86 | 0.02 | 37 | |
| Type of Experiment | Parameter | In Solution (3) | Immobilized on FTO | |||
|---|---|---|---|---|---|---|
| No Redox Compounds Added | +10 mM Ascorbate +200 μM DCPIP | |||||
| @OCP (+115 mV) | @low Potential (−180 mV) | @OCP (+115 mV) | @low Potential (−180 mV) | |||
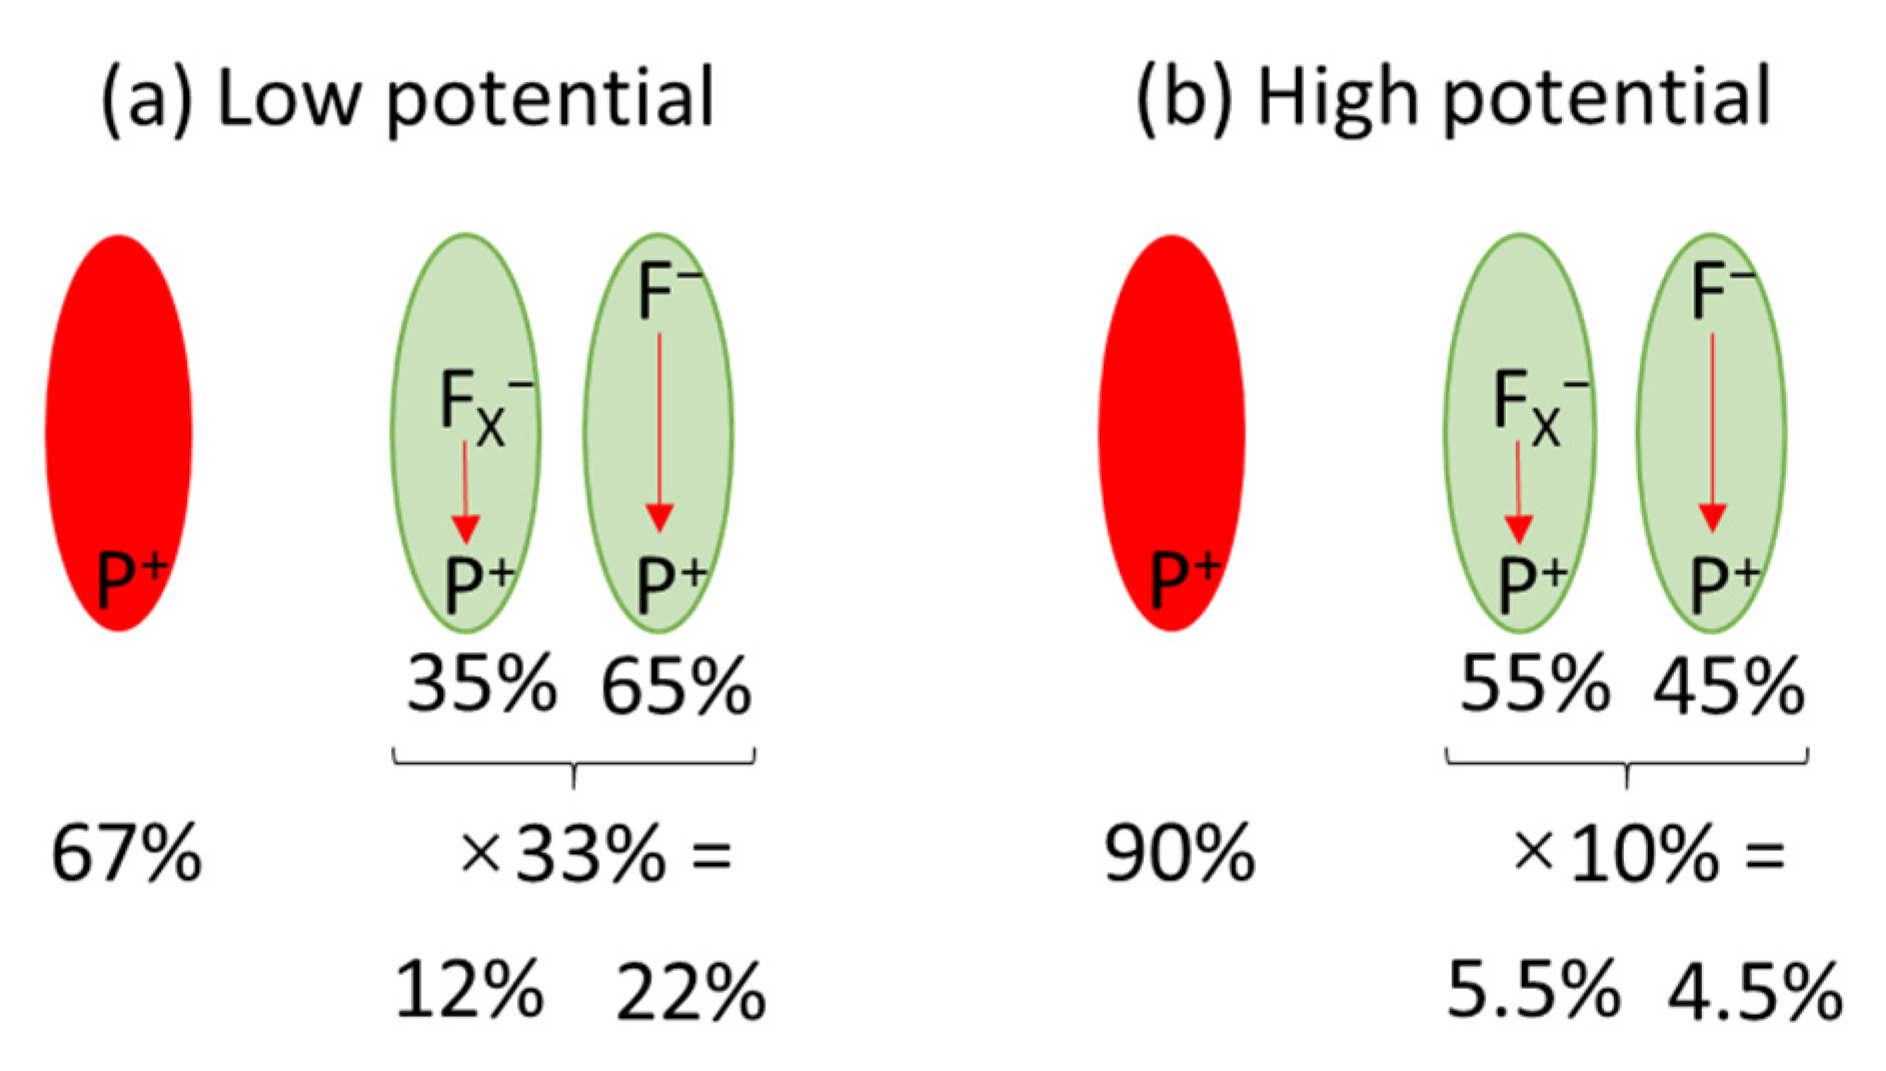
| Time-resolved absorption | Fraction of photoactive PSI (1) | 100% | 20% | 31% | - | 35% |
| Fraction of fully photoactive PSI (2) | ~90% | ~10% | ~20% | - | ~20% | |
| Fraction of PSI showing ET outside PSI | 2% | (0.2%)(4) | (0.4%) (4) | - | (0.4%) (4) | |
| Photocurrent | IQE | - | - | - | 0.073% | 0.47% |
Publisher’s Note: MDPI stays neutral with regard to jurisdictional claims in published maps and institutional affiliations. |
© 2022 by the authors. Licensee MDPI, Basel, Switzerland. This article is an open access article distributed under the terms and conditions of the Creative Commons Attribution (CC BY) license (https://creativecommons.org/licenses/by/4.0/).
Share and Cite
Szewczyk, S.; Goyal, A.; Abram, M.; Burdziński, G.; Kargul, J.; Gibasiewicz, K. Electron Transfer in a Bio-Photoelectrode Based on Photosystem I Multilayer Immobilized on the Conducting Glass. Int. J. Mol. Sci. 2022, 23, 4774. https://doi.org/10.3390/ijms23094774
Szewczyk S, Goyal A, Abram M, Burdziński G, Kargul J, Gibasiewicz K. Electron Transfer in a Bio-Photoelectrode Based on Photosystem I Multilayer Immobilized on the Conducting Glass. International Journal of Molecular Sciences. 2022; 23(9):4774. https://doi.org/10.3390/ijms23094774
Chicago/Turabian StyleSzewczyk, Sebastian, Alice Goyal, Mateusz Abram, Gotard Burdziński, Joanna Kargul, and Krzysztof Gibasiewicz. 2022. "Electron Transfer in a Bio-Photoelectrode Based on Photosystem I Multilayer Immobilized on the Conducting Glass" International Journal of Molecular Sciences 23, no. 9: 4774. https://doi.org/10.3390/ijms23094774
APA StyleSzewczyk, S., Goyal, A., Abram, M., Burdziński, G., Kargul, J., & Gibasiewicz, K. (2022). Electron Transfer in a Bio-Photoelectrode Based on Photosystem I Multilayer Immobilized on the Conducting Glass. International Journal of Molecular Sciences, 23(9), 4774. https://doi.org/10.3390/ijms23094774