Article

Myoglobin Interaction with Lactate Rapidly Releases Oxygen: Studies on Binding Thermodynamics, Spectroscopy, and Oxygen Kinetics

by
Kiran Kumar Adepu
1,2,*,
Dipendra Bhandari
1,
Andriy Anishkin
3,
Sean H. Adams
4,5 and
Sree V. Chintapalli
1,2,*
1
Arkansas Children’s Nutrition Center, Little Rock, AR 72202, USA
2
Department of Pediatrics, University of Arkansas for Medical Sciences, Little Rock, AR 72202, USA
3
Department of Biology, University of Maryland, College Park, MD 20742, USA
4
Department of Surgery, School of Medicine, University of California, Davis, CA 95616, USA
5
Center for Alimentary and Metabolic Science, University of California, Davis, CA 95616, USA
*
Authors to whom correspondence should be addressed.
Int. J. Mol. Sci. 2022, 23(9), 4747; https://doi.org/10.3390/ijms23094747
Submission received: 28 March 2022 / Revised: 22 April 2022 / Accepted: 24 April 2022 / Published: 26 April 2022
(This article belongs to the Collection State-of-the-Art Bioactives and Nutraceuticals in USA)

Abstract

:
Myoglobin (Mb)-mediated oxygen (O2) delivery and dissolved O2 in the cytosol are two major sources that support oxidative phosphorylation. During intense exercise, lactate (LAC) production is elevated in skeletal muscles as a consequence of insufficient intracellular O2 supply. The latter results in diminished mitochondrial oxidative metabolism and an increased reliance on nonoxidative pathways to generate ATP. Whether or not metabolites from these pathways impact Mb-O2 associations remains to be established. In the present study, we employed isothermal titration calorimetry, O2 kinetic studies, and UV-Vis spectroscopy to evaluate the LAC affinity toward Mb (oxy- and deoxy-Mb) and the effect of LAC on O2 release from oxy-Mb in varying pH conditions (pH 6.0–7.0). Our results show that LAC avidly binds to both oxy- and deoxy-Mb (only at acidic pH for the latter). Similarly, in the presence of LAC, increased release of O2 from oxy-Mb was detected. This suggests that with LAC binding to Mb, the structural conformation of the protein (near the heme center) might be altered, which concomitantly triggers the release of O2. Taken together, these novel findings support a mechanism where LAC acts as a regulator of O2 management in Mb-rich tissues and/or influences the putative signaling roles for oxy- and deoxy-Mb, especially under conditions of LAC accumulation and lactic acidosis.

1. Introduction

Lactate (LAC), once solely considered a product of anaerobic glycolysis, is now recognized to be continuously formed even under fully aerobic conditions. LAC from the cytosol enters the mitochondria for further oxidation through intramitochondrial lactate dehydrogenase (mLDH) with the help of the LAC and PYR (pyruvate) transporter present on the outer mitochondrial membrane (identified as monocarboxylic acid transporter 1 [MCT1]), whereas LAC efflux (LAC clearance from cytosol) is carried by MCT4 transporter [1]. In hypoxic conditions, when O2 levels are low and anaerobic glycolysis is more prevalent, PYR is primarily reduced to LAC by cytoplasmic lactate dehydrogenase (cLDH) [2,3,4]. The physiological range of tissue [LAC] is 0.5–20 mM [5]. Compared to resting muscles, the cellular LAC levels are elevated in exercising skeletal muscles, and the LAC/ to PYR ratio reaches ≥80 during intense exercise in humans [6,7]. This highlights that the production of LAC exceeds the rate of oxidative metabolism of PYR under these conditions [8]. With elevated LAC levels, there is a reduction in the intracellular pH from pH 6.8–7.2 to pH 5.0–6.5 [9].
Normal LAC levels in serum are 0.6 to 1.8 mM, with hyperlactatemia levels between 2 to 5 mM [10]. If LAC concentrations are >5 mM, the condition is regarded as severe lactic acidosis, and high mortality rates are seen when the LAC concentrations reach >8 mM [11]. Elevated serum LAC concentrations can be seen in acute cardiac patients, reaching ~45 mM (typically with acute coronary syndrome, cardiogenic shock, or cardiac arrest) [12]. Previous studies demonstrated that LAC produced by active muscle is transported to the liver for conversion back to glucose via gluconeogenesis (via the Cori cycle) [13]. Furthermore, recent results have shown that muscle-derived LAC is transported to the heart and serves as an important fuel source [14]. It is also reported that with increasing exercise intensities, there is a transition from fatty acid oxidation (FAO) to an increased use of glucose as a substrate for ATP generation through glycolysis, thus promoting LAC production [15,16]. Whether or not changes in tissue LAC pools due to the rise and fall of tissue LAC production can modify the activities and functions of metabolically important proteins remains to be explored.
Mb is increasingly appreciated as a metabolite-binding protein with multiple roles. The traditional view of Mb is one of a muscle O2-ferrying protein (most abundant in Type I oxidative “red” fibers and cardiomyocytes). Skeletal and cardiac muscle cell mitochondrial O2 delivery to the cytochrome c oxidase (COX) involves 2 modes, flow of dissolved O2 and Mb-bound O2: at least one third of O2 uptake, work output, and ATP generation is supported by the latter [17,18,19,20,21]. Substantial evidence in recent years has revealed Mb is not just confined to O2 storage and transport but can also be involved in other functions. For instance, Mb (i) is implicated in nitric oxide (NO) scavenging and NO generation [22,23,24,25,26,27], (ii) serves as a fatty acid- and acylcarnitine-binding protein [28,29,30,31,32,33,34,35,36], and (iii) promotes lipid peroxidation [37,38,39,40,41,42]. We have recently proposed that the toggling of oxy- and deoxy-Mb under conditions of changing pO2 regulates gene expression and other adaptive activities in part via changes in NO pools, as part of an O2-sensing signaling system [43]. Rassaf et al. proposed that deoxy-Mb-derived NO downregulates oxidative phosphorylation, which helps dampen mitochondrial O2 consumption when pO2 drops [44]. Immunohistochemical and electron microscopy studies showed that Mb and mitochondria colocalize during the exchange of O2 [45]. Evidence also suggests that, during the exchange of O2 from Mb to mitochondria, oxy-Mb nonspecifically interacts with negatively charged phospholipids of the outer membrane of mitochondria and columbic electrostatics that play a role in its conversion to deoxy-Mb. Furthermore, it was reported that deoxy-Mb more avidly binds to mitochondria than oxy-Mb [46,47,48]. What role, if any, that metabolite binding to Mb plays in modifying these mitochondrial associations is not known.
A growing body of evidence suggests that, in addition to interactions with gases and lipid metabolites, Mb activities could be impacted by LAC. Previous studies have shown that functional properties of both sperm whale and horse Mb are influenced (allosteric modulation) by high LAC concentrations under acidic conditions [49,50]. It was also shown that, depending on the oxygenation state and at varying pH, Mb may have different affinities toward LAC, behaving as a heterotrophic modulator [50]. However, the stoichiometric binding ratio of Mb to LAC could not be clearly defined through the spectrophotometric method used in those studies. To gather more insight into Mb interactions with LAC and its metabolic consequences, we performed isothermal titration calorimetric (ITC) studies, an O2 kinetics evaluation, and time-resolved spectroscopic studies. We hypothesized that the binding of LAC to Mb changes Mb conformation and alters O2 binding kinetics in acidic conditions. The current research will help in understanding Mb’s potential role as a LAC shuttle and will help determine if LAC binding influences Mb’s O2-sensing and signaling activities or O2 delivery to mitochondria.

2. Results and Discussion

Isothermal titration calorimetric (ITC) studies revealed that LAC binds to Mb with equimolar binding stoichiometry, i.e., at a 1:1 molar ratio. Irrespective of a change in pH, the number of binding sites of LAC in Mb was found to be nearly 1 (Table 1). Our results are in agreement with low affinity systems studied through ITC, where c-values in the range of 10 ≤ c ≤ 500 determine the accuracy of curve fitting to obtain Kd and binding stoichiometry [51]. The ITC binding profiles are shown in Figure 1, where the upper panels display raw binding data of measured potential difference (DP in µcal/s) against run time and the lower panels display the processed data of the change in enthalpy (ΔH in kcal/mol) against molar ratio. Furthermore, the binding experiments showed that at neutral pH (pH 7.0), LAC only bound to oxy-Mb (Figure 1a) and not to deoxy-Mb (Figure 1b). The binding interaction between the oxy-Mb and LAC released heat (i.e., exothermic reaction) with large negative enthalpic (∆H) values (Table 1) favoring the overall binding interaction. The exothermic reaction between Mb and LAC is shown with an upward slope (lower panel of Figure 1a). Additionally, signature plot analysis clearly indicates that the binding interaction between oxyMb and LAC at pH 7.0 is predominantly driven by the change in enthalpy (∆H) (Figure S1a). This interaction likely represents hydrophilic interactions that play a major role in stabilizing the Mb+LAC complex. Moreover, a negative ΔG value of −6.2 kcal/mol determined the overall stability of the protein-ligand complex. On the other hand, LAC avidly bound to both oxy- and deoxy-Mb at acidic pH (pH 6.4 and pH 6.0) (Figure 1c–f). Additionally, the binding interaction between Mb and LAC in acidic pH conditions is endothermic, resulting in a downward slope pattern shown in lower panels of Figure 1c–f. The Mb-LAC binding was mostly favored by a change in entropy (ΔS) (Figure S1b–e), primarily representing hydrophobic interactions in stabilizing the Mb+LAC complex. A more negative ΔG value of −6.9 kcal/mol for the oxy-Mb+LAC complex at pH 6.4 and −7.8 kcal/mol for the Mb+LAC complex at pH 6.0 indicated that, these complexes were highly stable when compared to the Mb+LAC complex at pH 7.0 (Table 1). Similarly, the ΔG value for the Mb+LAC complex at pH 6.0 was more negative than for the Mb+LAC complex at pH 6.4, except at pH 7.0 where no binding was observed (Figure S1). Therefore, based on ΔG values, the stability of the Mb+LAC complex(es) are in the order of oxy-Mb+LAC (pH 6.0) > deoxy-Mb+LAC (pH 6.0) > oxy-Mb+LAC (pH 6.4) > deoxy-Mb+LAC (pH 6.4) > oxy-Mb+LAC (pH 7.0). This further confirms that binding LAC to Mb is comparatively more stable at acidic conditions. Studies by Sankaranarayanan [52] revealed that the decrease in buffer pH from pH 7.0 to pH 6.4 marginally changes the secondary structure of Mb with a decrease in the % α-helix (100% at pH 7.0 to 97.2% at pH 6.5). Additional computational and X-ray crystallography studies may warrant detailed insights on the structural and conformational changes in the secondary and tertiary structure of Mb protein with LAC binding in different pH conditions.
ITC studies also revealed the binding affinity (Ka, inverse of Kd) of LAC interaction with oxy- and deoxy-Mb in different pH conditions. Specifically, with the drop in pH from pH 7.0 to pH 6.0, the Ka of LAC for oxy-Mb was increased by ~3-fold, and for deoxy-Mb at pH 6.4, the Ka was ~2-fold higher than pH 6.0 (Table 1). The plausible reason might be due to a change in protonation states of Mb residues (in particular, histidine, His) in acidic pH conditions. Computational analysis revealed that Mb net charge (pKa) was increased with decreasing pH, i.e., pKa of ~2.6, ~6.3, and ~8.9 at pH 7.0, pH 6.4, and pH 6.0, respectively. The protonation states of His residues in Mb were also increased with decreasing pH. At pH 7.0, no His residues were protonated, since the isoelectric pH (pI) of Mb was ~7.8. However, at pH 6.4, His36 was protonated and at pH 6.0, His residues at positions 36, 48, 81, 82, 97, and 226 were found to be protonated (Figure S2). Apart from the protonation sites, another compelling reason might be the change in the binding site of LAC during interaction with Mb in different pH conditions. It was also reported that Mb does not contain any specific binding location for LAC and LAC may act as an allosteric regulator [50]. Molecular docking studies revealed that LAC putatively binds to oxy-Mb at different locations with respect to changes in pH. Nevertheless, LAC binds near the distal His side of the heme center via hydrogen bonding interactions in all conditions, except for oxy-Mb at pH 6.0 (Figure 2). In oxy-Mb, at pH 7.0, LAC is docked near the oxygen binding site (proximal His residue) of the heme center, interacting with the residues K45, D60, and K63 (Figure 2a). However, with the decrease in pH, LAC binds to oxy-Mb away from the heme binding site. At pH 6.4, LAC interacts with residues K41 and K97 near the heme binding site (Figure 2b), whereas at pH 6.0 LAC interacts with residues K56 and E59 away from heme binding center (Figure 2c). Irrespective of pH, LAC is docked near to proximal His side of the heme center of deoxy-Mb interacting with the residues H96 and S92 (Figure 3). No detectable binding of LAC with deoxy-Mb was observed at pH 7.0. Future studies involving molecular dynamics simulation and quantum mechanics will help in calculating the stability and binding energies of LAC interaction with oxy- and deoxy-Mb in various pH conditions to reveal more insights into the structural and conformational changes of all the Mb+LAC complex(es). However, the present ITC binding results and molecular docking predictions strengthen our hypotheses related to different affinities of oxy-Mb toward LAC in varied pH conditions. In parallel, ITC binding experiments were also validated with a control protein, LYZ, that showed no detectable binding with LAC in all the tested pH conditions (Figure S3a–c). Our results contrast with the earlier studies by Giardina et al., in which binding studies were performed at pH 6.5 and showed that LAC had a lower affinity for oxy-Mb than deoxy-Mb (Kd values: 26 × 103 µM vs. 2.5 × 10³ µM, respectively) [50]. However, we found that LAC showed a higher affinity toward oxy-Mb compared to deoxy-Mb at pH 6.4 (~7 µM vs. ~14 µM, respectively; Table 1). One of the reasons for different results between the two studies might be differences in measuring thermodynamic binding. The earlier binding studies were determined spectrophotometrically using tonometry, whereas our binding kinetic studies were performed using an advanced ITC method that precisely reflects protein-ligand stoichiometry. Importantly, both studies concur in identifying LAC as a binding metabolite for Mb.
O2 kinetic studies in sodium phosphate buffer in different pH conditions with the addition of different concentrations of LAC showed that the addition of LAC to oxy-Mb resulted in the release of O2. A representative graph depicting the rapid release of O2 after the addition of LAC to the oxy-Mb solution at pH 6.4 is shown in Figure 4a. Representative graphs showing the release of O2 from oxy-Mb with the addition of LAC and without LAC in different pH conditions are shown in Figure 5a–c. With an increasing incubation time of LAC with oxy-Mb, the rate of O2 release from oxy-Mb was decreased; thus, the rate of O2 release was obtained from the linear portion of the graphs immediately after the addition of LAC to oxy-Mb. Irrespective of pH, with oxy-Mb solution alone (pre-LAC), little to no change in the O2 levels were observed (inset of Figure 4b and Figure 5a–c). This confirms that O2 release from oxy-Mb is only due to the interaction of LAC with oxy-Mb. At more acidic pH levels, rising LAC concentrations increased the rate of release of O2 from oxy-Mb (see grey and yellow bars, Figure 4b), but at pH 7.0, increasing LAC had a marginal effect (see blue bars, Figure 4b). A maximum rate of O2 release (72 nmol/min/g protein) from oxy-Mb was observed with 2.5 mM LAC in pH 6.4 buffer. Additionally, our data is supported by the O2 release rate constants (mM LAC/nM O2 release) of 0.04, 0.029, and 0.537 at pH 6.0, pH 6.4, and pH 7.0, respectively. This further strengths our results on maximum O2 release observed with lower concentrations of LAC at acidic conditions when compared to physiological pH. The complex nature of pH-dependent changes in O2 release from oxy-Mb might be due to (i) changes in the protonation state(s) of Mb with respect to pH or (ii) LAC binding near the O2 exit pathway hindering O2 release. These open questions need further comprehensive investigation. Based on the results, we hypothesize that the abundance of LAC in cells could impinge upon the association of O2 to Mb, especially as pH drops. This, in turn, could impact the availability of O2 from oxy-Mb to support mitochondrial bioenergetics or could alter other Mb activities that depend on the oxygenation state of the protein (e.g., its putative role as an O2-sensor). Considering the emerging role of oxy-Mb as a fatty acid- and long-chain acylcarnitine-binding protein [28,29,30], it is intriguing to speculate that the LAC-induced release of O2 from oxy-Mb could mean that conditions of lower O2 and increased LAC would decrease the binding of lipids that coincide with a transition to deoxy-Mb. If true, this may play a physiological role in terms of regulating fatty acid availability for oxidative and non-oxidative fates. In addition, under this working model, lipotoxicity associated with muscle or myocardial ischemia may partly stem from excessive unbound (free) intracellular pools of FAs and acylcarnitines due to off-loading from Mb as it transitions to deoxy-Mb, an idea we have considered previously [28,29,30].
Freshly prepared oxy-Mb preparations showed the expected absorption maxima at 418 nm, and the β and α bands at 548 and 579 nm, respectively (Figure 6a). Similarly, deoxy-Mb preparations showed the expected absorption maxima at 435 nm and a single broad peak at 557–562 nm (Figure 6b). This confirms that our enriched Mb preparations were uniform without any partial mixture. However, it was reported that complete removal of dissolved O2 from any liquid solution is typically not achievable by purging N2 gas into liquid solutions even for prolonged time periods, and that the presence of minute concentrations of dissolved O2 (<0.1–0.3 ppm) in the N2 purged liquid solutions cannot be ruled out [53]. If any minor amount of dissolved O2 is present in our protein solution preparation, our time-resolved spectroscopy studies showed no change in Mb heme conformation even after prolonged time periods (up to 45 min), similar to the freshly prepared Mb solution as shown in Figure 6a. This confirms that the minor amount of dissolved O2 in our Mb preparations had no interference on all our biochemical experiments, i.e., ITC and O2 kinetics, since the time required to complete each ITC binding experiment was <45 min and the O2 kinetic experiment was <15 min. Similarly, no change in spectral data were observed with LAC-incubated oxy-Mb in all the test pH conditions. However, marginal changes in the heme peak absorbance (435 nm) with a significant decrease in peak absorbance around 300–315 nm (not known) were observed with LAC-incubated deoxy-Mb protein, which may be attributed to ligand-induced conformational changes of protein (data not shown). Further time-resolved circular dichroism studies are warranted to determine detailed structural insights of LAC bound Mb.
Since the LAC binding site of Mb has not been established, several authors have studied the crystal structures of Mb derivatives and predicted possible hydrogen bonding interactions between the anion binding site of Mb with His E7, Arg CD3, and Thr E10 residues (catalytic triad) [54]. A distal histidine group (His E7) placed on the opposite side of the heme also serves as a small molecule binding site (vacant in deoxy-Mb) that holds gaseous ligands such O2, NO, and CO [26,27,54,55,56,57]. Experiments have shown that His-E7 acts as a gate for small molecule access (moving in and out) for the active site even under low pH (pH 4.6–6.5) conditions [58,59,60,61,62,63]. Depending on the open or closed conformation, the entrance of the small apolar diatomic ligands is only possible with the minor rotation of the imidazole side chain of the distal His-E7 channel. Experiments on the crystal structure of sperm whale oxy-Mb incubated with LAC at pH 6.5 do not show a specific LAC-binding pocket [50]. Further investigations using docking studies and molecular dynamics simulations will provide more insight into the possible specific binding sites of LAC near the heme pocket of Mb, which, if present, could impact O2 release with increasing cellular LAC levels and concomitant interconversion of oxygenated forms to deoxygenated forms of Mb.

3. Materials & Methods

3.1. Materials

Horse heart muscle myoglobin (Mb), chicken egg white lysozyme, sodium lactate (LAC), and sodium dithionite were purchased from Sigma Aldrich, St. Louis, MO, USA. All other chemicals used in the experiments are of analytical grade and were also procured from Sigma Aldrich, St. Louis, MO, USA.

3.2. Preparation of Mb

Preparations enriched in oxygenated and deoxygenated forms of Mb were prepared as described by our earlier publication related to Mb interaction with fatty acids and acylcarnitines [30]. Briefly, 500 µM of Mb was dissolved in 50 mM sodium phosphate buffer of desired test pH. To promote conversion of ferric (Fe3+) to ferrous (Fe2+) iron, 3 mM of sodium dithionite was added to the protein solution with gentle mixing. Thereafter, the solution was subjected to a desalting column to remove the reducing agent and to remove the interference, particularly in O2 release kinetics and UV-Vis spectroscopy absorbance peaks. However, ligand binding studies using a Microcal instrument (described later) were performed in the presence of sodium dithionite, as it did not show any effect on binding properties. Thereafter, purging the protein solution enriched in oxy- and deoxy-Mb with either O2 or N2 gas, respectively, was performed continuously for 10 min. Formation of oxy- and deoxy-Mb were confirmed based on their characteristic peaks using UV-visible spectroscopy. All the experiments were performed in three different pH conditions (7.0, 6.4, and 6.0), mimicking intracellular physiological and acidic pH states that would be typically observed in skeletal muscle cells in “rested” and “active” (hyperlactatemia) conditions.

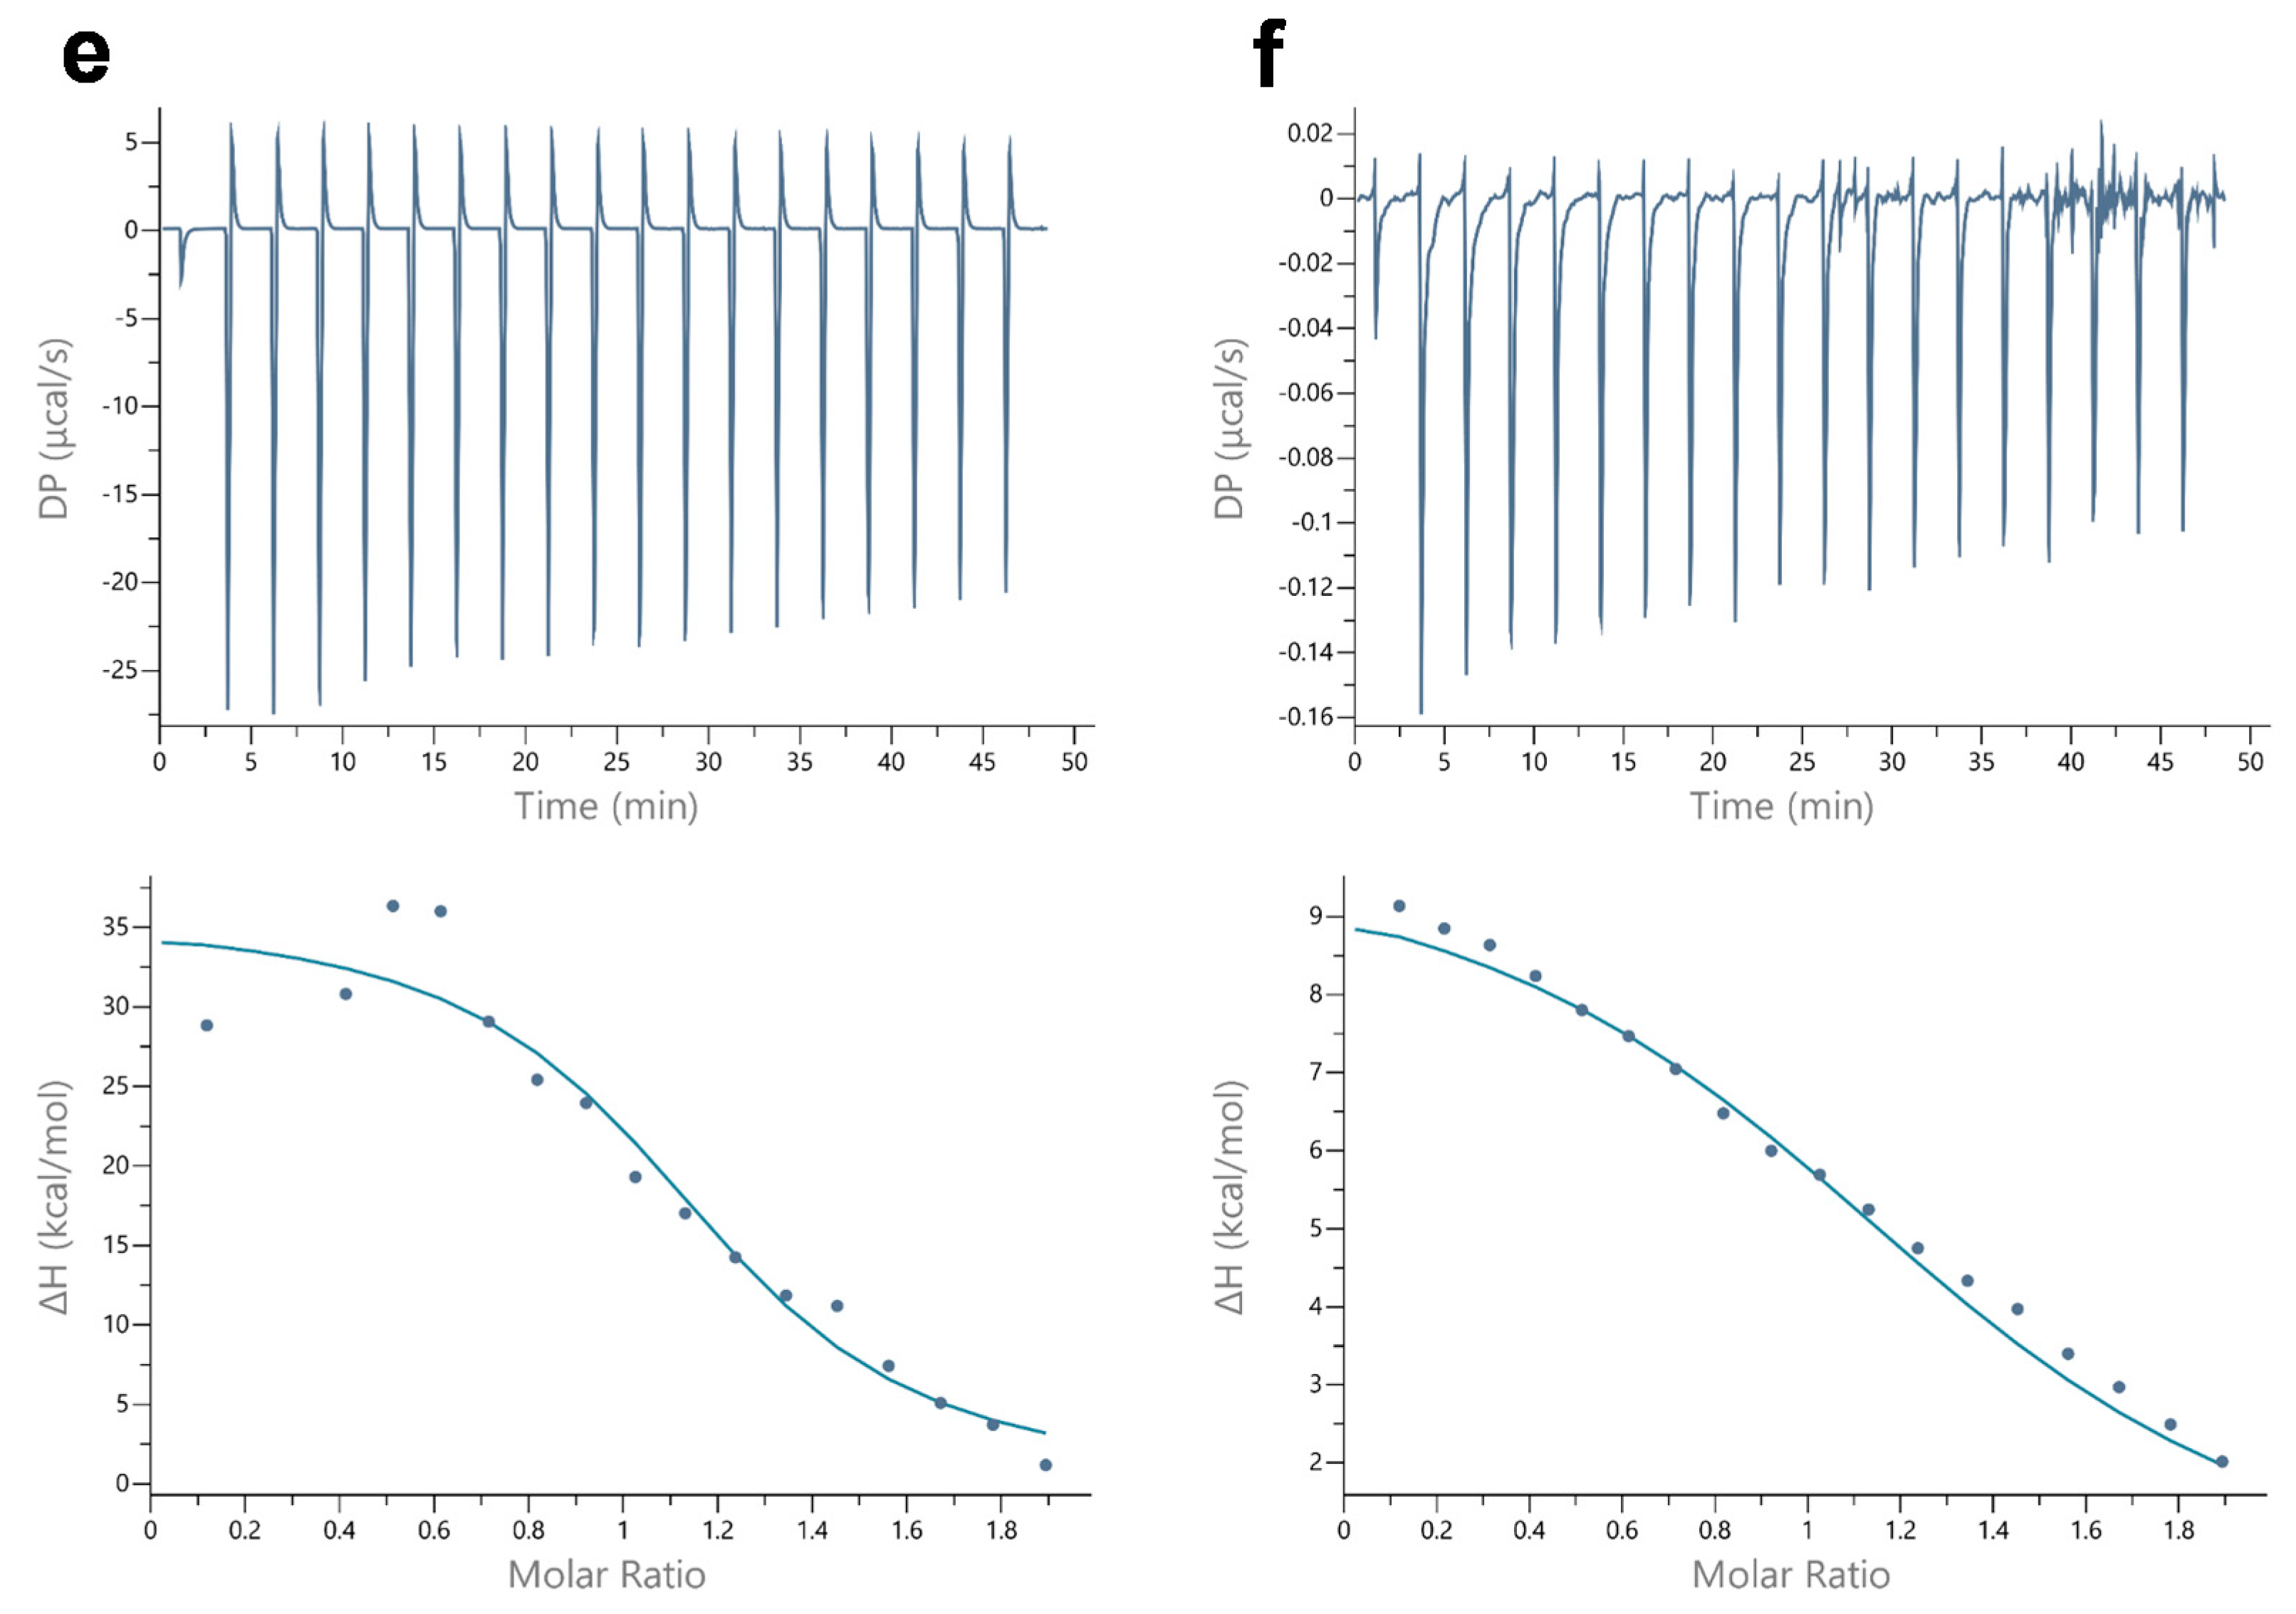
3.3. Ligand Binding Studies

Protein-ligand binding experiments were performed using isothermal titration calorimetry (ITC) (Microcal PEAQ-ITC, Malvern, Chester County, PA, USA). Before starting the experiment, both the ligand solution and the protein solution were purged with either O2 or N2 for 10 min. Both the protein and LAC solutions were thermally equilibrated to 25 °C prior to the start of the titration. LAC was loaded in the reaction cell at an initial concentration of 50 µM and titrated against 500 µM of either oxy- or deoxy-Mb solution, maintaining a 1:10 ratio between ligand and protein. To obtain the working c-value between 10 ≤ c ≤ 500 [51], different protein to ligand molar ratios (1:2, 1:5, 1:10, and 1:20) were tested, and based on the c-value, the molar ratio of 1:10 was selected for all ITC binding studies. A total of 19 injections (2 µL each) from the syringe were used to generate the ITC curves within each experiment. During the experimental run, the samples were mixed thoroughly at a constant stirring rate of 750 rpm. Between each injection, a 150 s gap was maintained to achieve a stable baseline. Data obtained from the ITC experiments were best fit to a one set of binding sites model provided by Microcal PEAQ-ITC software (version 1.40). Heats of dilution and heats caused by potential products formed during the course of the ITC experiments were corrected by performing appropriate blank titrations, consisting of (a) either oxy- or deoxy-Mb in the test buffer solution, (b) test buffer in the LAC, and (c) buffer-buffer solution. Lysozyme was used as a negative control protein in the protein-ligand binding experiments. All the binding experiments were performed 5 times (n = 5) and data obtained from statistical analysis are presented here.
The change in entropy (ΔS) was calculated using the equation:
ΔG = ΔH − TΔS
where ΔG represents the change in Gibbs free energy, ΔH is the change in enthalpy, and T is the absolute temperature.
c values were calculated using the equation:
c = nKa[M]t
where n is the number of binding sites per receptor (macromolecule), [M]t is macromolecule concentration, and Ka is the association constant.

3.4. Oxygen Kinetic Studies

The O2 concentrations (release and binding) during the ligand interactions with Mb in the solution were measured using Oxytherm+ liquid-phase oxygen electrode system (Hansatech Instruments, Norfolk, UK). The Oxytherm+ respirometer is an advanced instrument routinely used for respiration studies.
The measurement of dissolved O2 is calculated at the given temperature and atmospheric pressure according to the following equation [64]:
Cs = 14.16 − (0.394 × T) + (0.007714 × T2) − (0.0000646 × T2)
where Cs is the saturated O2 concentration in ppm and T is the temperature in °C.
1 ppm is equivalent to 1 µg/mL or (1 µg/32 g/mol) = 0.03125 µmol/mL or 31.25 nmol/mL.
The optimum concentration of oxy-Mb was found to be 25 µM, and LAC concentrations were varied from 620 µM to 50 mM. Similarly, deoxy-Mb protein alone (i.e., without LAC) was also tested. All the experiments were carried out at a constant temperature of 25 °C using a Peltier thermostat. The solutions were mixed at 50 rpm using a small magnetic stirring bar placed inside the sample container. Samples were injected into the buffer solution (50 mM sodium phosphate) at varying pH levels (pH 6.0–7.0) using a Hamilton glass syringe (1cc) after achieving equilibrium. Ligand was added to the Mb protein. Appropriate buffer controls voiding either Mb or LAC were used to nullify any artefacts. O2 kinetic experiments were also performed. All the kinetic experiments were performed 3 times (n = 3) and data obtained from statistical analysis are presented here.

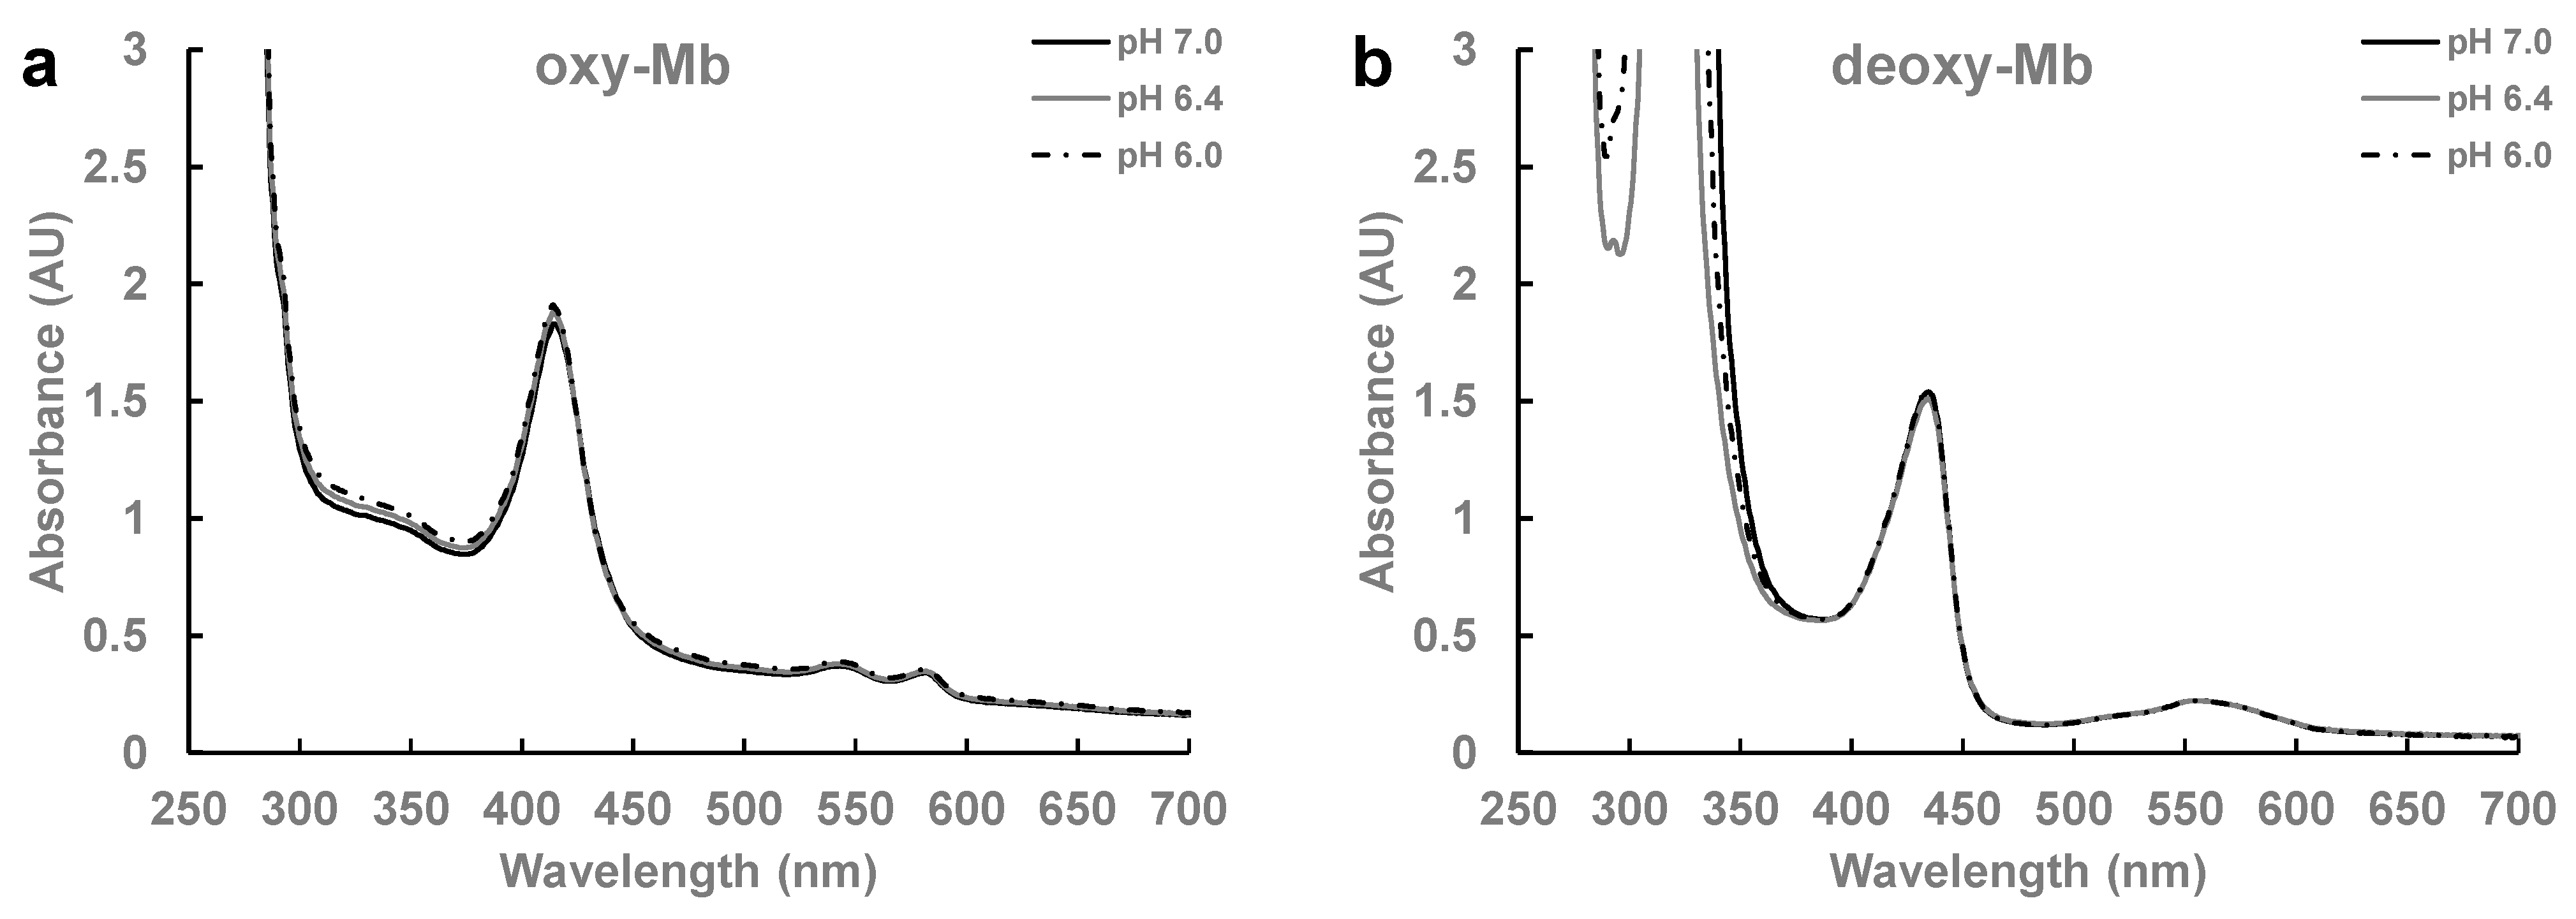
3.5. Time-Resolved Spectroscopic Studies

The change in the spectral characteristics of Mb alone and LAC-bound Mb were recorded using UV-Vis spectroscopy (Polarstar Omega, BMG Labtech, ortenberg, Germany). All the sample preparations and the concentrations used were similar to the ITC experiments. After degassing Mb and LAC samples either with O2 or N2 gas in sealed vials, appropriate volumes of the samples were collected using a Hamilton glass syringe (1cc), mixed in a glass cuvette, and sealed immediately; time-resolved spectra were recorded immediately at 25 °C for a period of 75 min. All spectral data were collected at 5 min time intervals. All the spectral experiments were performed 3 times (n = 3).

3.6. Molecular Docking

Autodock 4.2 [65] was used to dock LAC to the heme binding pocket of deoxy-Mb (PDB: 2V1K). We used the relaxed model of the oxy-Mb structure derived from horse deoxy-Mb (due to the unavailability of the oxy-Mb crystal structure), which is used in our previous studies [29]. A three-dimensional structure of LAC was obtained from PubChem database (https://pubchem.ncbi.nlm.nih.gov/compound/Lactate, accessed on 23 April 2022). The iron ion parameters in the heme group were obtained from Autodoc 4.2 software. The iron ion was selected directly from the Set Map Types within the Grid tab to add iron with default parameters for docking. The protonation state of each titratable residue in Mb at different pH values was set based on pKa estimations by PROPKA [66]. AutoDock Tool was then used to prepare the protein-ligand system by assigning polar hydrogen atoms and Kollman’s partial charges with solvation parameters to the protein. A grid box of search space (70 Å × 70 Å × 70 Å) enclosing the heme group and residues within 5 Å from the heme center with a grid spacing of 0.375 Å was assigned. A Lamarckian genetic algorithm (LGA) was applied with a population size of 300 and 25 million maximum energy evaluations for 150 independent runs. The best docking structure is selected based on the lowest binding energy within the largest cluster of the docking results.

3.7. Statistical Analysis

Statistical analysis was performed using Microcal Origin software via an iterative algorithm for all ITC binding experiments. Similarly, nonlinear regression analysis of the average data points was calculated for each condition. One-way ANOVA was performed to determine the statistically significant differences between the data obtained from the binding studies in different pH conditions with a level of confidence of 95%. Additionally, one-tail and two-tail t-test paired two sample for means was performed. For oxygen kinetic analysis, both one way ANOVA and the Tukey–Kramer post hoc test were performed to determine the statistical significance. All the experimental results data are presented as means ± standard error (SE).

4. Conclusions

The biochemical results presented herein are consistent with a proposed model in which LAC binding to Mb is a dynamic process within Mb-expressing tissues, regulated by a combination of factors including pH, pO2, Mb oxygenation status, and metabolite concentration. Under this model, when LAC concentration is low at neutral pH (pH 7.0), as would be seen in resting muscle, LAC does not interact with deoxy-Mb but is bound to oxy-Mb. However, as the cell slips into acidic conditions and lower pO2 during high energy demand, increased LAC levels would drive interactions with both oxy- and deoxy-Mb and promote the off-loading of O2 from oxy-Mb. If true, this off-loading may be an adaptational response to lowered pO2, in that Mb-bound O2 becomes more available for metabolic processes. LAC binding also may bring a conformational change in the Mb protein, as suggested by spectral changes in the ligand-bound state, and this may influence Mb functions beyond the provision of O2 in support of oxidative phosphorylation. For instance, based on phenotype and gene expression patterns of Mb knockout mice [43,67], we proposed that an important role for Mb is an O2 “sensor” that regulates metabolic and gene expression pathways through mechanisms responsive to toggling between oxy- and deoxy-Mb [43]. It is intriguing to consider that such processes could be impacted by small molecule metabolite binding, including lipid derivatives [28,29,30] and LAC. Furthermore, we speculate that Mb-LAC interactions play a pivotal role in the transport of LAC by deoxy-Mb into the mitochondrial membrane space and ultimately into the matrix. In other words, Mb may serve as a transporter that aids intracellular LAC shuttling into the mitochondria. How changes in Mb and cellular pH influence mitochondrial function and metabolism remains to be fully determined, but there is now a growing body of evidence to suggest that Mb-LAC interactions could play an important role in metabolic regulation.

Supplementary Materials

The following supporting information can be downloaded at: https://www.mdpi.com/article/10.3390/ijms23094747/s1.

Author Contributions

K.K.A. and S.V.C. conceived the project. K.K.A. and D.B. performed ITC binding and oxygen kinetic experiments. K.K.A. performed spectroscopic experiments. K.K.A. and S.V.C. wrote the manuscript. K.K.A., A.A., S.H.A. and S.V.C. interpreted results and edited the manuscript. All authors have read and agreed to the published version of the manuscript.

Funding

This work was supported in part through USDA-ARS project 6026-51000-012-06S, Sturgis Foundation Pilot Grant G1-54750-01, and ACRI-ABI Investigator Initiated Grant Award GR037175-4450S ABI.

Institutional Review Board Statement

Not Applicable.

Informed Consent Statement

Not Applicable.

Data Availability Statement

Not Applicable.

Acknowledgments

The authors are grateful for the support of the University of Arkansas for Medical Sciences Department of Pediatrics and the Arkansas Children’s Nutrition Center. The authors thank James D. Sikes for his support in building the vacuum manifold setup for our spectral and oxytherm+ experiments, and Keith D. Williams, Department of Biostatistics, for his kind input on statistical data analysis.

Conflicts of Interest

The author(s) declare no potential conflict of interest with respect to the research, authorship, and/or publication of this article. S.H.A. is the founder and principal of XenoMed, LLC, which is focused on research and discovery that has no connection to the current project. XenoMed had no part in the research design, funding, results, or writing of the manuscript.

Abbreviations

deoxy-Mbdeoxygenated myoglobin
LACsodium lactate
Mbmyoglobin
oxy-Mboxygenated myoglobin

References

  1. Juel, C.; Halestrap, A.P. Lactate transport in skeletal muscle—role and regulation of the monocarboxylate transporter. J. Physiol. 1999, 517, 633–642. [Google Scholar] [CrossRef]
  2. Voet, D.; Voet, J.G.; Pratt, C.W. Fundamentals of Biochemistry Life at the Molecular Level; Wiley: Hoboken, NJ, USA, 2016. [Google Scholar]
  3. Brooks, G.A. The Science and Translation of Lactate Shuttle Theory. Cell Metab. 2018, 27, 757–785. [Google Scholar] [CrossRef] [PubMed] [Green Version]
  4. Rabinowitz, J.D.; Enerback, S. Lactate: The ugly duckling of energy metabolism. Nat. Metab. 2020, 2, 566–571. [Google Scholar] [CrossRef] [PubMed]
  5. Brooks, G.A. Lactate as a fulcrum of metabolism. Redox Biol. 2020, 35, 101454. [Google Scholar] [CrossRef] [PubMed]
  6. Proia, P.; Di Liegro, C.M.; Schiera, G.; Fricano, A.; Di Liegro, I. Lactate as a Metabolite and a Regulator in the Central Nervous System. Int. J. Mol. Sci. 2016, 17, 1450. [Google Scholar] [CrossRef] [Green Version]
  7. Henderson, G.C.; Horning, M.A.; Wallis, G.A.; Brooks, G.A. Pyruvate metabolism in working human skeletal muscle. Am. J. Physiol. Endocrinol. Metab. 2007, 292, E366. [Google Scholar] [CrossRef]
  8. Rogatzki, M.J.; Ferguson, B.S.; Goodwin, M.L.; Gladden, L.B. Lactate is always the end product of glycolysis. Front. Neurosci. 2015, 9, 22. [Google Scholar] [CrossRef] [PubMed] [Green Version]
  9. Khacho, M.; Tarabay, M.; Patten, D.; Khacho, P.; MacLaurin, J.G.; Guadagno, J.; Bergeron, R.; Cregan, S.P.; Harper, M.E.; Park, D.S.; et al. Acidosis overrides oxygen deprivation to maintain mitochondrial function and cell survival. Nat. Commun. 2014, 5, 3550. [Google Scholar] [CrossRef] [Green Version]
  10. Davis, J.A. Anaerobic threshold: Review of the concept and directions for future research. Med. Sci. Sports Exerc. 1985, 17, 6–21. [Google Scholar] [CrossRef]
  11. Foucher, C.D.; Tubben, R.E. Lactic Acidosis. In StatPearls; StatPearls Publishing: Treasure Island, FL, USA, 2021. [Google Scholar]
  12. Luft, F.C. Lactic acidosis update for critical care clinicians. J. Am. Soc. Nephrol. 2001, 12 (Suppl. 17), S15–S19. [Google Scholar] [CrossRef]
  13. Nelson, D.L.; Cox, M.M. Lehninger Principles of Biochemistry, 7th ed.; W.H. Freeman: New York, NY, USA, 2017. [Google Scholar]
  14. Gertz, E.W.; Wisneski, J.A.; Neese, R.; Bristow, J.D.; Searle, G.L.; Hanlon, J.T. Myocardial lactate metabolism: Evidence of lactate release during net chemical extraction in man. Circulation 1981, 63, 1273–1279. [Google Scholar] [CrossRef] [PubMed] [Green Version]
  15. Diakos, N.A.; Navankasattusas, S.; Abel, E.D.; Rutter, J.; McCreath, L.; Ferrin, P.; McKellar, S.H.; Miller, D.V.; Park, S.Y.; Richardson, R.S.; et al. Evidence of Glycolysis Up-Regulation and Pyruvate Mitochondrial Oxidation Mismatch During Mechanical Unloading of the Failing Human Heart: Implications for Cardiac Reloading and Conditioning. JACC Basic Transl. Sci. 2016, 1, 432–444. [Google Scholar] [CrossRef] [Green Version]
  16. Neubauer, S.; Horn, M.; Cramer, M.; Harre, K.; Newell, J.B.; Peters, W.; Pabst, T.; Ertl, G.; Hahn, D.; Ingwall, J.S.; et al. Myocardial phosphocreatine-to-ATP ratio is a predictor of mortality in patients with dilated cardiomyopathy. Circulation 1997, 96, 2190–2196. [Google Scholar] [CrossRef]
  17. Wittenberg, B.A.; Wittenberg, J.B.; Caldwell, P.R. Role of myoglobin in the oxygen supply to red skeletal muscle. J. Biol. Chem. 1975, 250, 9038–9043. [Google Scholar] [CrossRef]
  18. Cole, R.P. Skeletal muscle function in hypoxia: Effect of alteration of intracellular myoglobin. Respir. Physiol. 1983, 53, 1–14. [Google Scholar] [CrossRef]
  19. Driedzic, W.R. The fish heart as a model system for the study of myoglobin. Comp. Biochem. Physiol. A Comp. Physiol. 1983, 76, 487–493. [Google Scholar] [CrossRef]
  20. Taylor, D.J.; Matthews, P.M.; Radda, G.K. Myoglobin-dependent oxidative metabolism in the hypoxic rat heart. Respir. Physiol. 1986, 63, 275–283. [Google Scholar] [CrossRef]
  21. Wittenberg, B.A.; Wittenberg, J.B. Myoglobin-mediated oxygen delivery to mitochondria of isolated cardiac myocytes. Proc. Natl. Acad. Sci. USA 1987, 84, 7503–7507. [Google Scholar] [CrossRef] [PubMed] [Green Version]
  22. Plotnikov, E.Y.; Chupyrkina, A.A.; Pevzner, I.B.; Isaev, N.K.; Zorov, D.B. Myoglobin causes oxidative stress, increase of NO production and dysfunction of kidney’s mitochondria. Biochim. Biophys. Acta 2009, 1792, 796–803. [Google Scholar] [CrossRef] [Green Version]
  23. Park, J.W.; Piknova, B.; Dey, S.; Noguchi, C.T.; Schechter, A.N. Compensatory mechanisms in myoglobin deficient mice preserve NO homeostasis. Nitric. Oxide 2019, 90, 10–14. [Google Scholar] [CrossRef]
  24. Nakamura, M.; Nakamura, S. Conversion of metmyoglobin to NO myoglobin in the presence of nitrite and reductants. Biochim. Biophys. Acta 1996, 1289, 329–335. [Google Scholar] [CrossRef]
  25. Eich, R.F.; Li, T.; Lemon, D.D.; Doherty, D.H.; Curry, S.R.; Aitken, J.F.; Mathews, A.J.; Johnson, K.A.; Smith, R.D.; Phillips, G.N., Jr.; et al. Mechanism of NO-induced oxidation of myoglobin and hemoglobin. Biochemistry 1996, 35, 6976–6983. [Google Scholar] [CrossRef] [PubMed]
  26. Moller, J.K.; Skibsted, L.H. Nitric oxide and myoglobins. Chem. Rev. 2002, 102, 1167–1178. [Google Scholar] [CrossRef] [PubMed]
  27. Cossins, A.; Berenbrink, M. Physiology: Myoglobin’s new clothes. Nature 2008, 454, 416–417. [Google Scholar] [CrossRef]
  28. Chintapalli, S.V.; Anishkin, A.; Adams, S.H. Exploring the entry route of palmitic acid and palmitoylcarnitine into myoglobin. Arch. Biochem. Biophys. 2018, 655, 56–66. [Google Scholar] [CrossRef]
  29. Chintapalli, S.V.; Bhardwaj, G.; Patel, R.; Shah, N.; Patterson, R.L.; van Rossum, D.B.; Anishkin, A.; Adams, S.H. Molecular dynamic simulations reveal the structural determinants of Fatty Acid binding to oxy-myoglobin. PLoS ONE 2015, 10, e0128496. [Google Scholar] [CrossRef] [Green Version]
  30. Chintapalli, S.V.; Jayanthi, S.; Mallipeddi, P.L.; Gundampati, R.; Suresh Kumar, T.K.; van Rossum, D.B.; Anishkin, A.; Adams, S.H. Novel Molecular Interactions of Acylcarnitines and Fatty Acids with Myoglobin. J. Biol. Chem. 2016, 291, 25133–25143. [Google Scholar] [CrossRef] [PubMed] [Green Version]
  31. Gloster, J.; Harris, P. Fatty acid binding to cytoplasmic proteins of myocardium and red and white skeletal muscle in the rat. A possible new role for myoglobin. Biochem. Biophys. Res. Commun. 1977, 74, 506–513. [Google Scholar] [CrossRef]
  32. Gotz, F.M.; Hertel, M.; Groschel-Stewart, U. Fatty acid binding of myoglobin depends on its oxygenation. Biol. Chem. Hoppe-Seyler 1994, 375, 387–392. [Google Scholar] [CrossRef]
  33. Jue, T.; Shih, L.; Chung, Y. Differential Interaction of Myoglobin with Select Fatty Acids of Carbon Chain Lengths C8 to C16. Lipids 2017, 52, 711–727. [Google Scholar] [CrossRef]
  34. Jue, T.; Simond, G.; Wright, T.J.; Shih, L.; Chung, Y.; Sriram, R.; Kreutzer, U.; Davis, R.W. Effect of fatty acid interaction on myoglobin oxygen affinity and triglyceride metabolism. J. Physiol. Biochem. 2016, 73, 359–370. [Google Scholar] [CrossRef] [PubMed]
  35. Sriram, R.; Kreutzer, U.; Shih, L.; Jue, T. Interaction of fatty acid with myoglobin. FEBS Lett. 2008, 582, 3643–3649. [Google Scholar] [CrossRef] [Green Version]
  36. Schlater, A.E.; De Miranda, M.A., Jr.; Frye, M.A.; Trumble, S.J.; Kanatous, S.B. Changing the paradigm for myoglobin: A novel link between lipids and myoglobin. J. Appl. Physiol. 2014, 117, 307–315. [Google Scholar] [CrossRef] [Green Version]
  37. Tichivangana, J.Z.; Morrissey, P.A. Metmyoglobin and inorganic metals as pro-oxidants in raw and cooked muscle systems. Meat Sci. 1985, 15, 107–116. [Google Scholar] [CrossRef]
  38. Galaris, D.; Sevanian, A.; Cadenas, E.; Hochstein, P. Ferrylmyoglobin-catalyzed linoleic acid peroxidation. Arch. Biochem. Biophys. 1990, 281, 163–169. [Google Scholar] [CrossRef]
  39. Chan, W.K.; Faustman, C.; Yin, M.; Decker, E.A. Lipid oxidation induced by oxymyoglobin and metmyoglobin with involvement of H(2)O(2) and superoxide anion. Meat Sci. 1997, 46, 181–190. [Google Scholar] [CrossRef]
  40. Baron, C.P.; Skibsted, L.H.; Andersen, H.J. Concentration effects in myoglobin-catalyzed peroxidation of linoleate. J. Agric. Food Chem. 2002, 50, 883–888. [Google Scholar] [CrossRef]
  41. Vuletich, J.L.; Osawa, Y.; Aviram, M. Enhanced lipid oxidation by oxidatively modified myoglobin: Role of protein-bound heme. Biochem. Biophys. Res. Commun. 2000, 269, 647–651. [Google Scholar] [CrossRef] [PubMed]
  42. Baron, C.P.; Andersen, H.J. Myoglobin-induced lipid oxidation. A review. J. Agric. Food Chem. 2002, 50, 3887–3897. [Google Scholar] [CrossRef] [PubMed]
  43. Blackburn, M.L.; Wankhade, U.D.; Ono-Moore, K.D.; Chintapalli, S.V.; Fox, R.; Rutkowsky, J.M.; Willis, B.J.; Tolentino, T.; Lloyd, K.C.K.; Adams, S.H. On the potential role of globins in brown adipose tissue: A novel conceptual model and studies in myoglobin knockout mice. Am. J. Physiol. Endocrinol. Metab. 2021, 321, E47–E62. [Google Scholar] [CrossRef] [PubMed]
  44. Rassaf, T.; Flogel, U.; Drexhage, C.; Hendgen-Cotta, U.; Kelm, M.; Schrader, J. Nitrite reductase function of deoxymyoglobin: Oxygen sensor and regulator of cardiac energetics and function. Circ. Res. 2007, 100, 1749–1754. [Google Scholar] [CrossRef] [PubMed]
  45. Yamada, T.; Furuichi, Y.; Takakura, H.; Hashimoto, T.; Hanai, Y.; Jue, T.; Masuda, K. Interaction between myoglobin and mitochondria in rat skeletal muscle. J. Appl. Physiol. 2013, 114, 490–497. [Google Scholar] [CrossRef] [PubMed] [Green Version]
  46. Edwards, D.L.; Criddle, R.S. The interaction of myoglobin with mitochondrial structural protein. Biochemistry 1966, 5, 588–591. [Google Scholar] [CrossRef]
  47. Postnikova, G.B.; Tselikova, S.V.; Shekhovtsova, E.A. Myoglobin and mitochondria: Oxymyoglobin interacts with mitochondrial membrane during deoxygenation. Biochemistry 2009, 74, 1211–1218. [Google Scholar] [CrossRef]
  48. Postnikova, G.B.; Shekhovtsova, E.A. Fluorescence studies on the interaction of myoglobin with mitochondria. Biochemistry 2012, 77, 280–287. [Google Scholar] [CrossRef] [PubMed]
  49. Ascenzi, P.; Bocedi, A.; Bolli, A.; Fasano, M.; Notari, S.; Polticelli, F. Allosteric modulation of monomeric proteins. Biochem. Mol. Biol. Educ. 2005, 33, 169–176. [Google Scholar] [CrossRef] [PubMed]
  50. Giardina, B.; Ascenzi, P.; Clementi, M.E.; De Sanctis, G.; Rizzi, M.; Coletta, M. Functional modulation by lactate of myoglobin. A monomeric allosteric hemoprotein. J. Biol. Chem. 1996, 271, 16999–17001. [Google Scholar] [CrossRef] [Green Version]
  51. Turnbull, W.B.; Daranas, A.H. On the value of c: Can low affinity systems be studied by isothermal titration calorimetry? J. Am. Chem. Soc. 2003, 125, 14859–14866. [Google Scholar] [CrossRef]
  52. Kamatchi, S. Studies on pH-Controlled Transition of Myoglobin Capsules from Hollow to Multilayered Structures. J. Adsorpt. Sci. Technol. 2015, 33, 10. [Google Scholar] [CrossRef]
  53. Butler, I.B.; Schoonen, M.A.; Rickard, D.T. Removal of dissolved oxygen from water: A comparison of four common techniques. Talanta 1994, 41, 211–215. [Google Scholar] [CrossRef]
  54. Phillips, S.E. Structure and refinement of oxymyoglobin at 1.6 A resolution. J. Mol. Biol. 1980, 142, 531–554. [Google Scholar] [CrossRef]
  55. Collman, J.P.; Brauman, J.I.; Doxsee, K.M. Carbon monoxide binding to iron porphyrins. Proc. Natl. Acad. Sci. USA 1979, 76, 6035–6039. [Google Scholar] [CrossRef] [PubMed] [Green Version]
  56. Ansari, A.; Jones, C.M.; Henry, E.R.; Hofrichter, J.; Eaton, W.A. Conformational relaxation and ligand binding in myoglobin. Biochemistry 1994, 33, 5128–5145. [Google Scholar] [CrossRef] [PubMed]
  57. Doyle, M.P.; Hoekstra, J.W. Oxidation of nitrogen oxides by bound dioxygen in hemoproteins. J. Inorg. Biochem. 1981, 14, 351–358. [Google Scholar] [CrossRef]
  58. Olson, J.S.; Mathews, A.J.; Rohlfs, R.J.; Springer, B.A.; Egeberg, K.D.; Sligar, S.G.; Tame, J.; Renaud, J.P.; Nagai, K. The role of the distal histidine in myoglobin and haemoglobin. Nature 1988, 336, 265–266. [Google Scholar] [CrossRef] [PubMed]
  59. Olson, J.S.; Soman, J.; Phillips, G.N., Jr. Ligand pathways in myoglobin: A review of Trp cavity mutations. IUBMB Life 2007, 59, 552–562. [Google Scholar] [CrossRef]
  60. Scott, E.E.; Gibson, Q.H. Ligand migration in sperm whale myoglobin. Biochemistry 1997, 36, 11909–11917. [Google Scholar] [CrossRef]
  61. Scott, E.E.; Gibson, Q.H.; Olson, J.S. Mapping the pathways for O2 entry into and exit from myoglobin. J. Biol. Chem. 2001, 276, 5177–5188. [Google Scholar] [CrossRef] [Green Version]
  62. Tian, W.D.; Sage, J.T.; Champion, P.M. Investigations of ligand association and dissociation rates in the “open” and “closed” states of myoglobin. J. Mol. Biol. 1993, 233, 155–166. [Google Scholar] [CrossRef]
  63. Yang, F.; Phillips, G.N., Jr. Crystal structures of CO-, deoxy- and met-myoglobins at various pH values. J. Mol. Biol. 1996, 256, 762–774. [Google Scholar] [CrossRef]
  64. Tuesdale, G.A.; Downing, A.L. Solubility of oxygen in water. Nature 1954, 173, 1236. [Google Scholar] [CrossRef]
  65. Morris, G.M.; Huey, R.; Lindstrom, W.; Sanner, M.F.; Belew, R.K.; Goodsell, D.S.; Olson, A.J. AutoDock4 and AutoDockTools4: Automated docking with selective receptor flexibility. J. Comput. Chem. 2009, 30, 2785–2791. [Google Scholar] [CrossRef] [PubMed] [Green Version]
  66. Olsson, M.H.; Sondergaard, C.R.; Rostkowski, M.; Jensen, J.H. PROPKA3: Consistent Treatment of Internal and Surface Residues in Empirical pKa Predictions. J. Chem. Theory Comput. 2011, 7, 525–537. [Google Scholar] [CrossRef] [PubMed]
  67. Ono-Moore, K.D.; Olfert, I.M.; Rutkowsky, J.M.; Chintapalli, S.V.; Willis, B.J.; Blackburn, M.L.; Williams, D.K.; O’Reilly, J.; Tolentino, T.; Lloyd, K.C.K.; et al. Metabolic physiology and skeletal muscle phenotypes in male and female myoglobin knockout mice. Am. J. Physiology. Endocrinol. Metab. 2021, 321, E63–E79. [Google Scholar] [CrossRef] [PubMed]
Figure 1. Representative ITC plots of binding of LAC with (a) oxy-Mb at pH 7.0, (b) deoxy-Mb at pH 7.0, (c) oxy-Mb at pH 6.4, (d) deoxy-Mb at pH 6.4, (e) oxy-Mb at pH 6.0, and (f) deoxy-Mb at pH 6.0. Raw data (upper panels) and integrated data (lower panels) represent titration of reactants with time (min) or molar ratios on the x-axis and the energy released or absorbed per injection on the y-axis. The solid lines in the bottom panels represent the best fit of experimental data using a one set of binding sites model provided by the manufacturer’s software (Microcal PEAQ-ITC software). The lower graphs clearly differentiate that at pH 7.0, Mb-LAC binding was predominantly exothermic (downward slope) driven by hydrophilic interactions with large negative enthalpic (∆H) values (details are given in Results and Discussion). In contrast, at acidic pH (pH 6.4 and pH 6.0), the Mb-LAC binding was endothermic (upward slopes) and is mostly favored by hydrophobic interactions and positive ∆H values. All the ITC experiments were repeated 5 times (n = 5) to obtain the thermodynamic properties. We have only shown one representative dataset from a single experiment per condition. Statistical analysis was performed with one-tail and two-tail t-test paired two sample for means. All statistical differences in the test data are displayed in superscripts.
Ijms 23 04747 g001aIjms 23 04747 g001b
Figure 2. Autodock results displaying LAC interaction with oxy-Mb residues at (a) pH 7.0, (b) pH 6.4, and (c) pH 6.0. At pH 7.0, LAC shows interaction with residues K45, K63, and D60, while at pH 6.4, LAC shows interaction with residues K41, H96, and K97, and at pH 6.0, LAC shows interaction with residues K56 and E59. LAC (brown), heme center (pink), and the residues (green) interacting with LAC are displayed as sticks. Mb protein (cyan) is displayed as ribbon structure an oxygen (red) in spheres. Possible hydrogen bond interactions between side chains of residues and LAC are displayed as dashed yellow lines with bond length.
Ijms 23 04747 g002
Figure 3. Autodock results displaying LAC interaction with deoxy-Mb residues. Irrespective of the change in acidic pH (pH 6.4 and pH 6.0), LAC is docked near to proximal His side of heme center of deoxy-Mb, interacting with the residues H96 and S92, except at pH 7.0, where no LAC binding was observed. LAC (brown), heme center (pink), and the residues (green) interacting with LAC are displayed as sticks. Mb protein (cyan) is displayed as ribbon structure. Possible hydrogen bond interactions between side chains of residues and LAC are displayed as dashed yellow lines with bond length.
Ijms 23 04747 g003
Figure 4. Effect of lactate binding to oxy-Mb and O2 release kinetics. Oxygen kinetics is studied using Oxytherm+ respirometer. All experiments were performed with 50 mM sodium phosphate buffer (pH 7.0, pH 6.4, and pH 6.0) containing 150 µM equine oxy-Mb and varying concentrations of lactate (0.625 mM to 2.5 mM) and oxy-Mb alone as a control. (a) A representative graph showing addition of lactate eliciting a rapid release of O2 from oxy-Mb at pH 6.4. Arrows in the figure indicate the point of addition of oxy-Mb and LAC into buffer during the run. (b) Rate of release of O2 from Mb against lactate concentrations with buffers (pH 7.0, pH 6.4, and pH 6.0). Inlet chart displays rate of release of O2 from deoxy-Mb alone (pre-LAC) conditions. All O2 kinetic experiments were repeated 3 times (n = 3). Statistical analysis was performed using one-way ANOVA and the Tukey–Kramer post hoc test. Statistical analysis revealed no significant difference in O2 release from oxy-Mb alone (without LAC) at pH 7.0 and pH 6.0. Additionally, no significant difference in O2 release was observed at pH 7.0 and pH 6.0 with 1.25 mM LAC condition. Moreover, with the addition of 0.625 mM LAC to oxy-Mb at pH 6.0, no significance difference in O2 release was observed when compared to oxy-Mb alone at pH 6.0. Among all the test groups, only statistically not significant groups are shown with horizontal lines and two asterisks.
Ijms 23 04747 g004
Figure 5. The O2 release at varying concentrations (0.0 mM, 0.625 mM, 1.25 mM, and 2.5 mM) of LAC at (a) pH 7.0, (b) pH 6.4, and (c) pH 6.0. The rate of O2 release was calculated from the linear portion of the graphs immediately after addition of LAC to oxy-Mb. Representative data from a single experiment per condition are shown here. All O2 kinetic experiments were repeated 3 times (n = 3).
Ijms 23 04747 g005
Figure 6. A representative UV-Vis spectra of freshly prepared (a) oxy-Mb and (b) deoxy-Mb samples each at pH 7.0, pH 6.4, and pH 6.0. Preparation of protein samples is detailed in the Materials and Methods section. All the spectra were repeated 3 times (n = 3).
Ijms 23 04747 g006
Table 1. Thermodynamic binding properties of lactate titrated against equine deoxy-Mb and oxy-Mb in ITC experiments in different pH conditions. Dissociation constant (Kd), association constant (Ka), the ratio of the receptor concentration, and the dissociation constant are determined by c value. Change in enthalpy (ΔH°) and change in entropy (ΔS°) are shown in the table. All the ITC experiments were repeated 5 times (n = 5) to obtain the thermodynamic properties. Statistical analysis was performed using one-way ANOVA and both one-tail and two-tail t-test paired two sample for means for each parameter, separately between oxy-Mb and deoxy-Mb at each pH condition.
Thermal PropertiespH 7.0pH 6.4pH 6.0
oxy-Mbdeoxy-Mboxy-Mbdeoxy-Mboxy-Mbdeoxy-Mb
Kd (µM)20.7 ± 2.7 a*-6.9± 1.1 b113.7± 1.6 c1*1.9 ± 0.2 d26.4 ± 0.2 b1
Ka (µM)0.05 ± 0.0 a*-0.2 ± 0.03 b10.1± 0.0 c1*0.5 ± 0.04 d20.15 ± 0.0 b1
c value22.4 ± 1.4 a-67.5 ± 15.5 b130.4 ± 4.6 c1*267.9 ± 30.4 d261.2 ± 0.9 b1
ΔH° (kcal mol−1)−53.1 ± 0.3 a*-151.5 ± 18.5 b1149.5 ± 13.0 b134 ± 3.5 c212.6 ± 0.4 d3
ΔS° (cal mol−1 K−1)−0.15 ± 0.01 a*-0.5 ± 0.06 b10.55 ± 0.03 b10.14 ± 0.01 c20.1 ± 0.0 d3
No. of binding sites0.9 ± 0.7 b*NDB0.8 ± 0.03 a10.8 ± 0.03 a11.0 ± 0.06 a20.8 ± 0.02 a2
NDB: no detectable binding; superscript displays the statistical differences among the experimental results; lower-case alphabets in superscript denotes one-tail t-test and numerical values and asterisk symbol in superscript denotes two-tail t-test.
Publisher’s Note: MDPI stays neutral with regard to jurisdictional claims in published maps and institutional affiliations.

