
New Cases of Hypochromic Microcytic Anemia Due to Mutations in the SLC11A2 Gene and Functional Characterization of the G75R Mutation

 , , , , ,
Abstract
:1. Introduction
2. Results
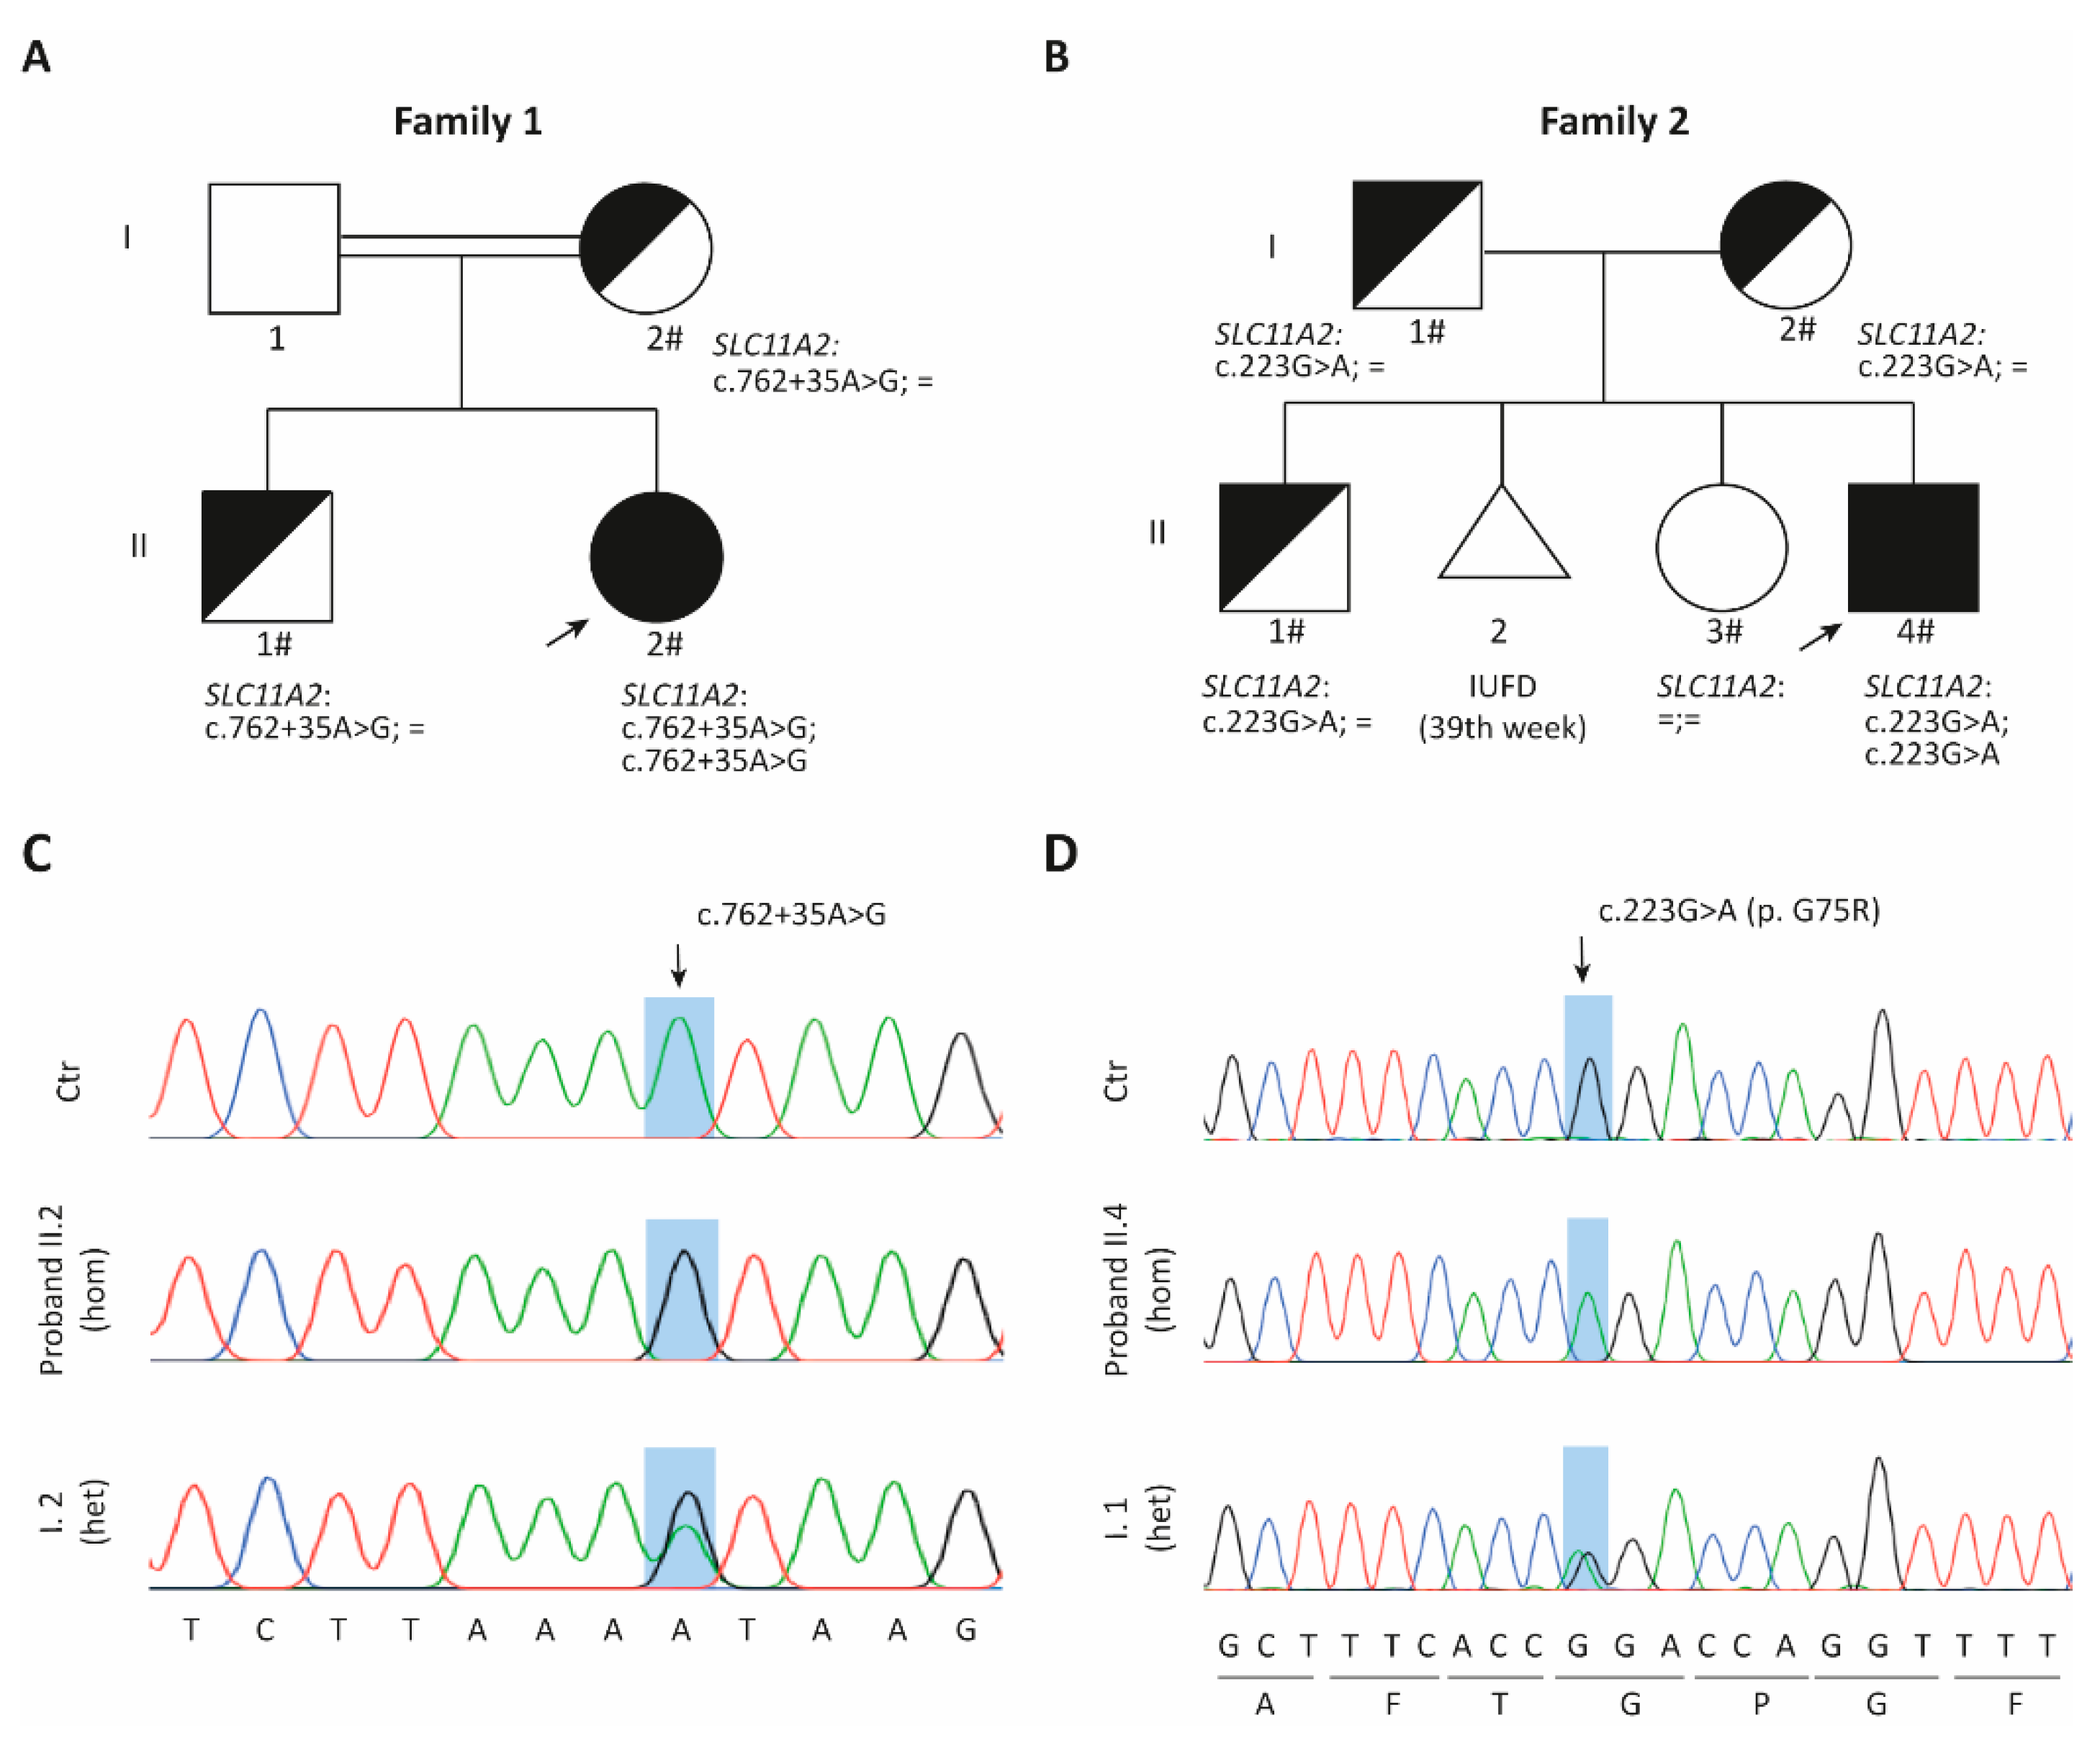
2.1. Family 1
2.1.1. Clinical Data
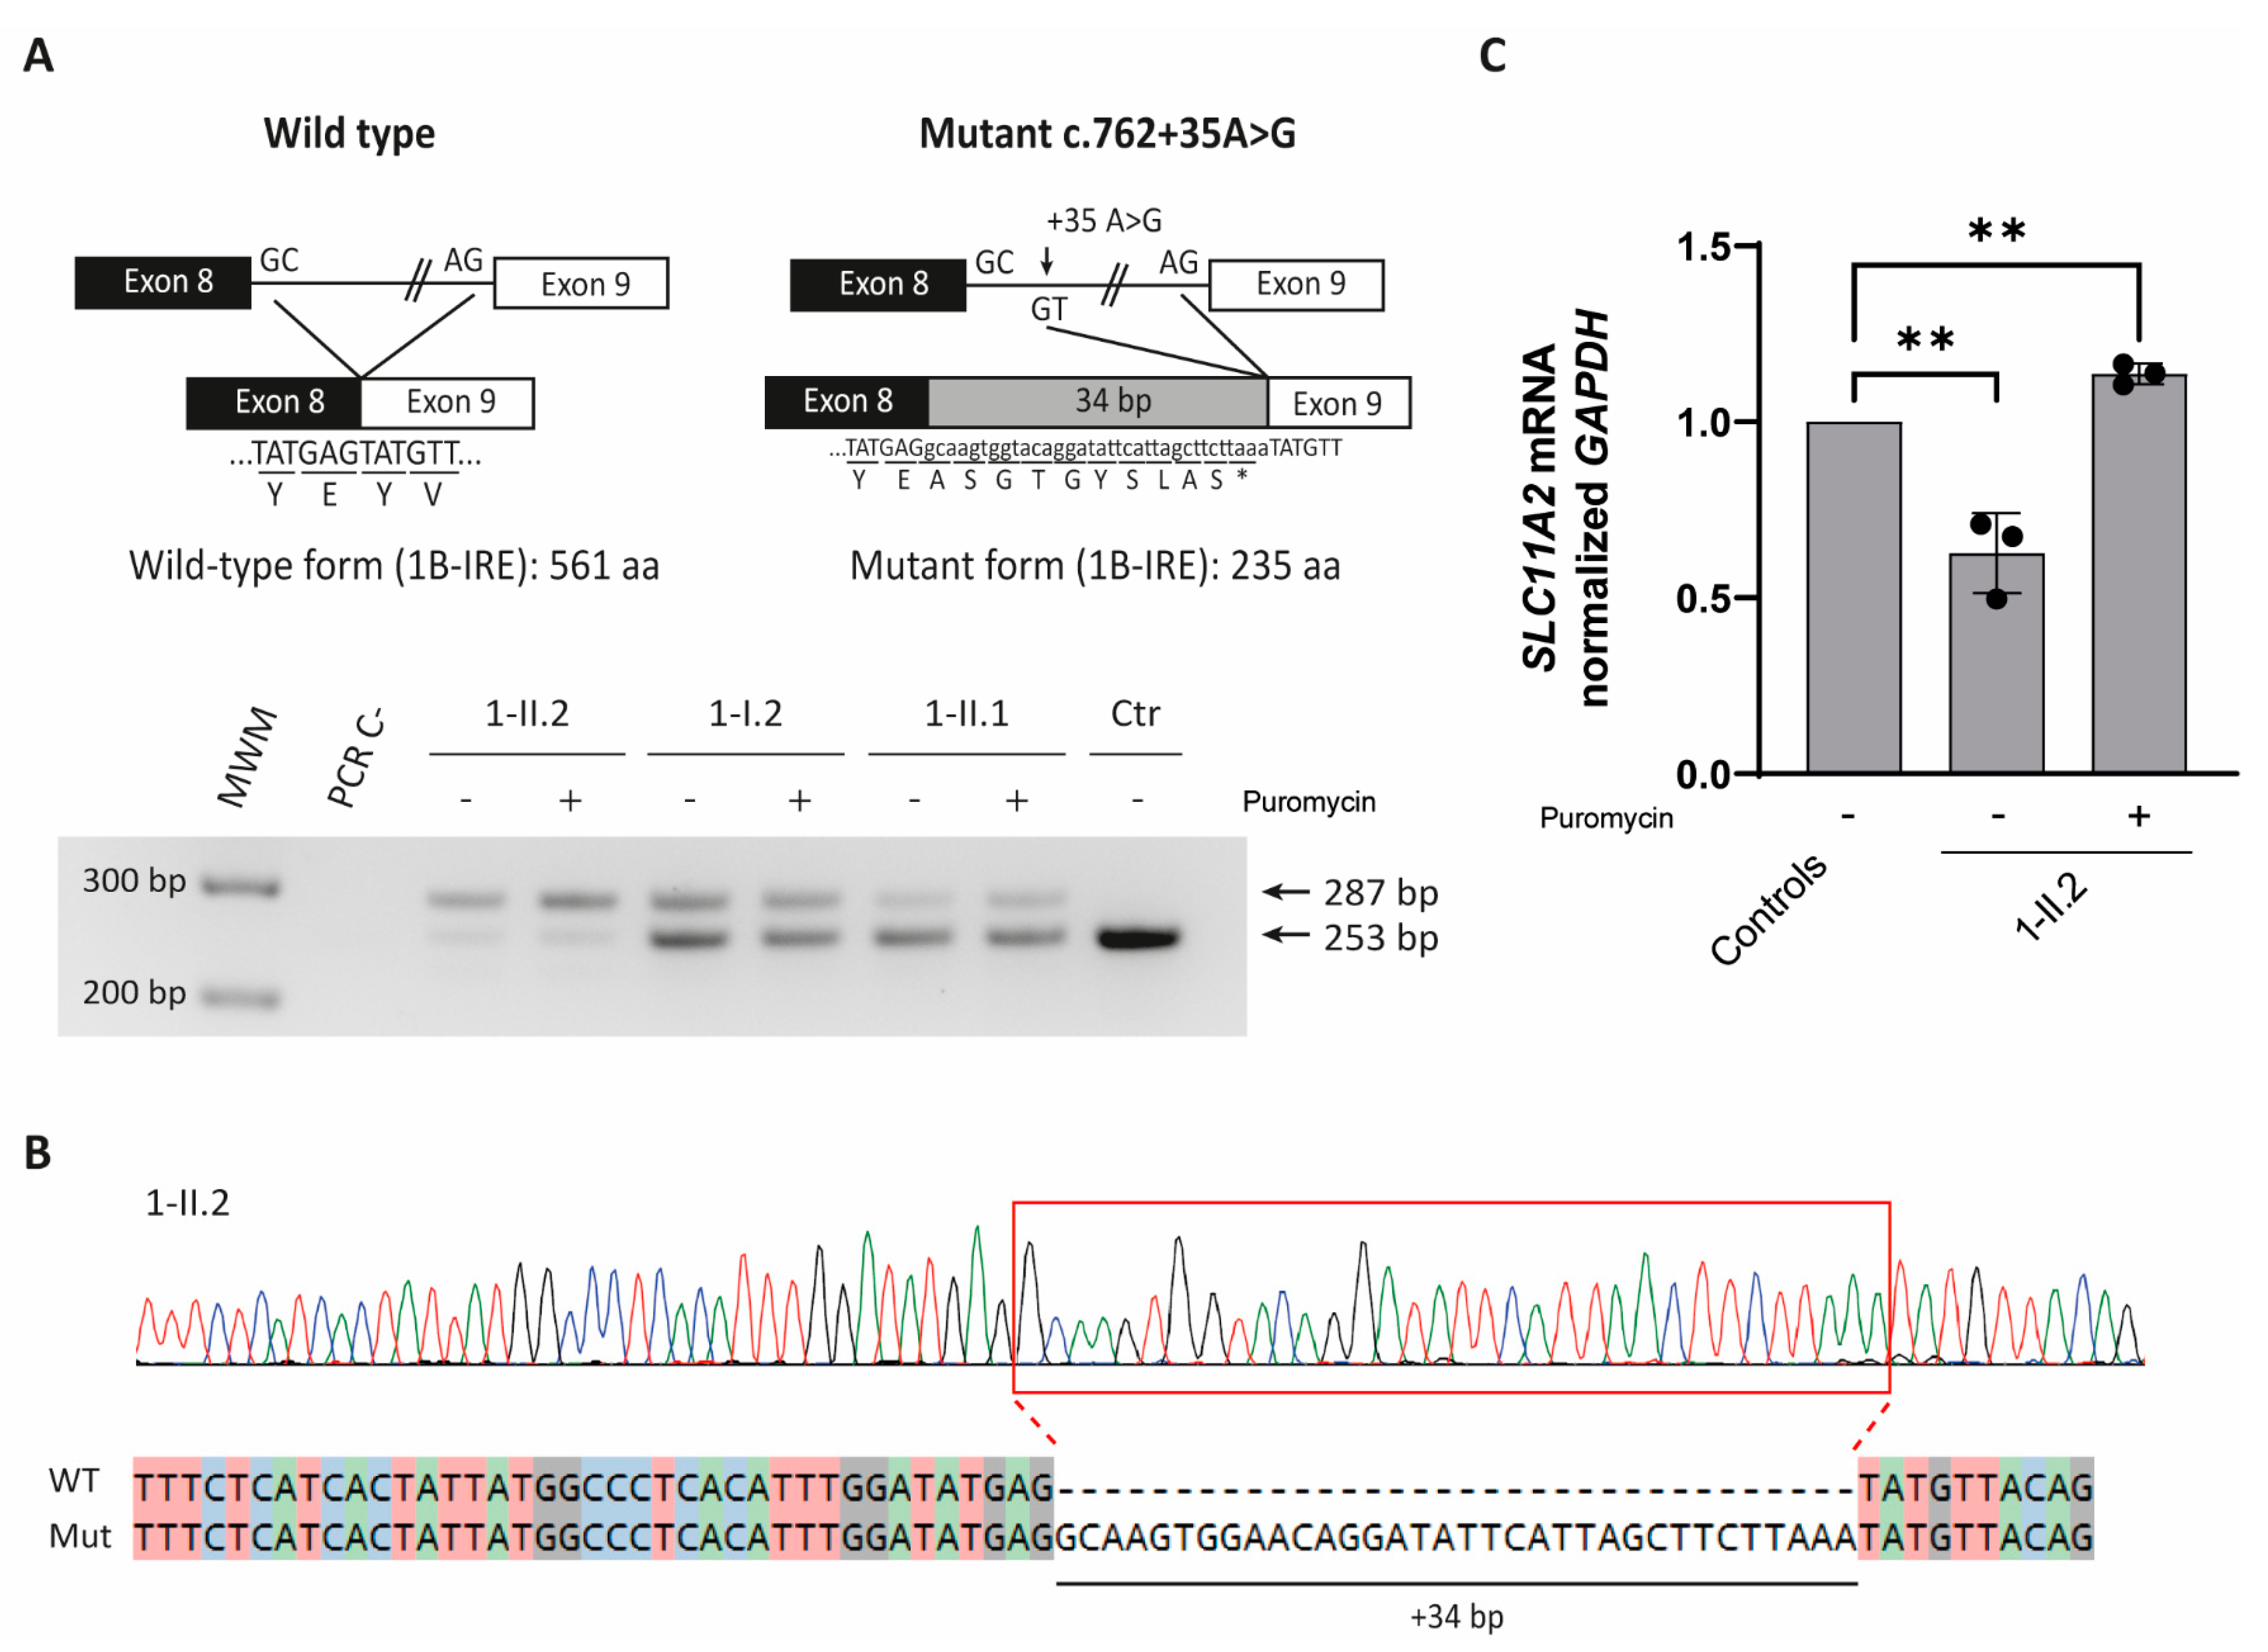
2.1.2. SLC11A2 c.[762 + 35A > G] Variant Causes Aberrant Splicing
2.2. Family 2
2.2.1. Clinical Data
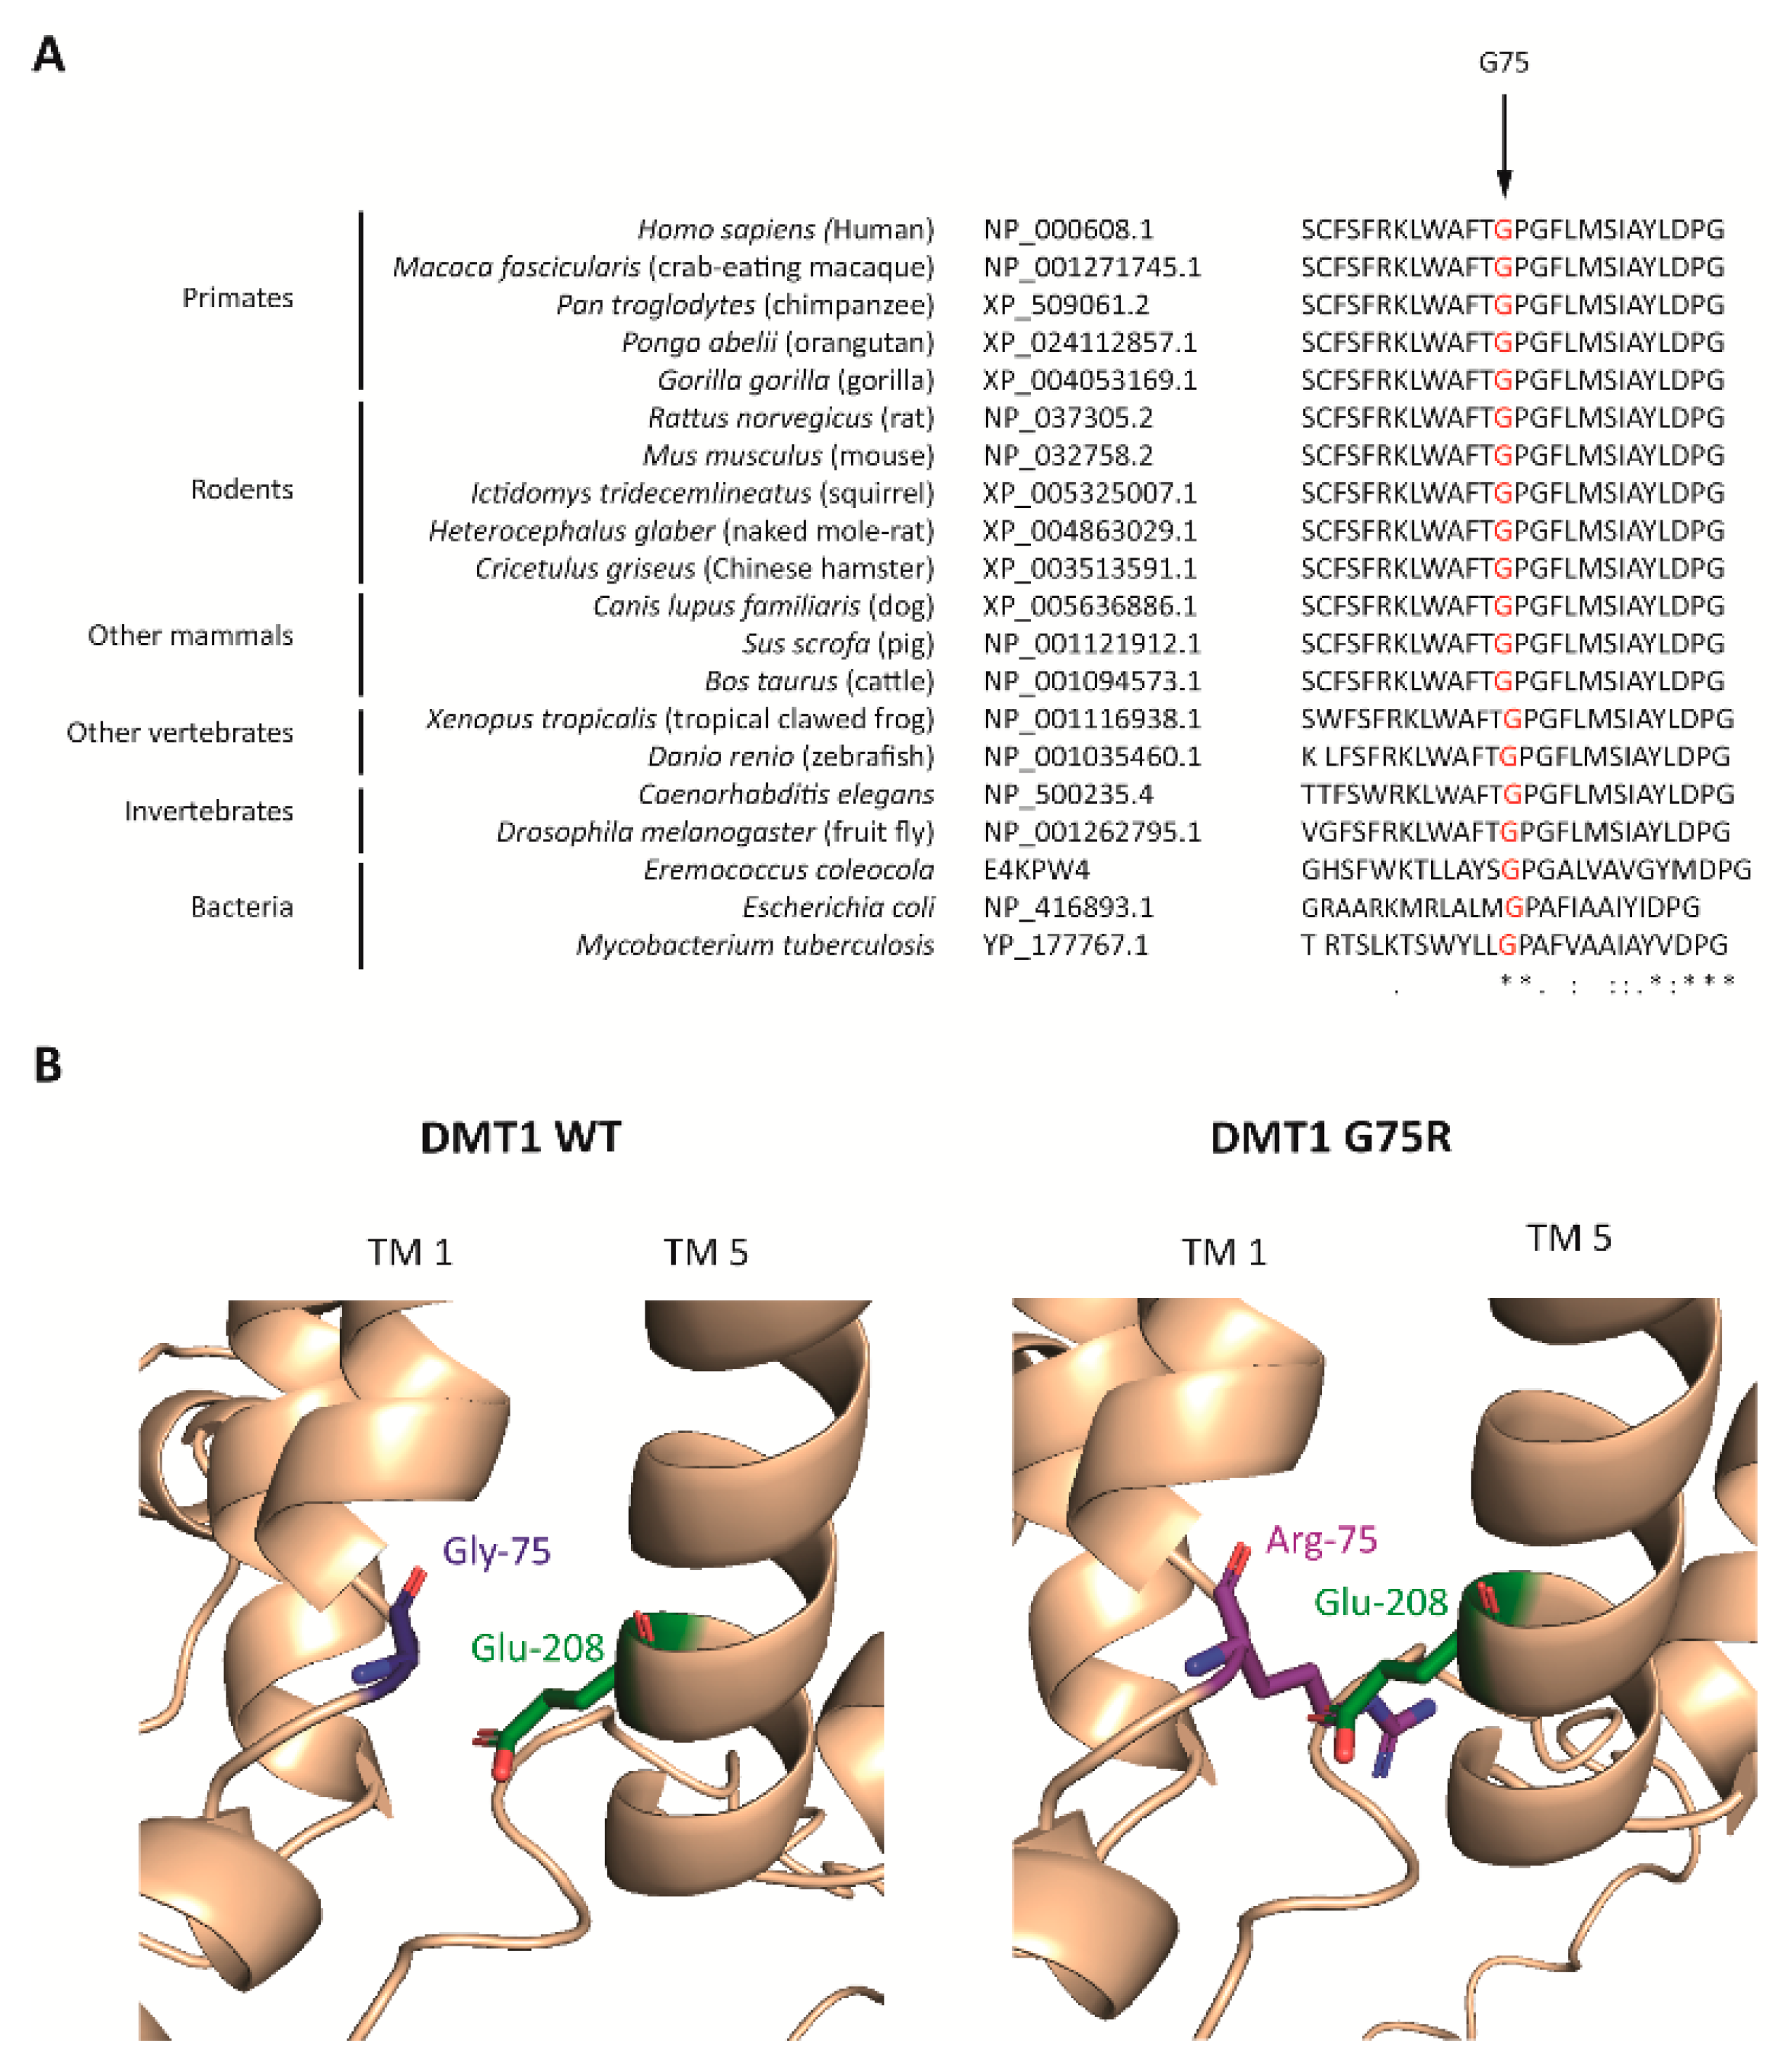
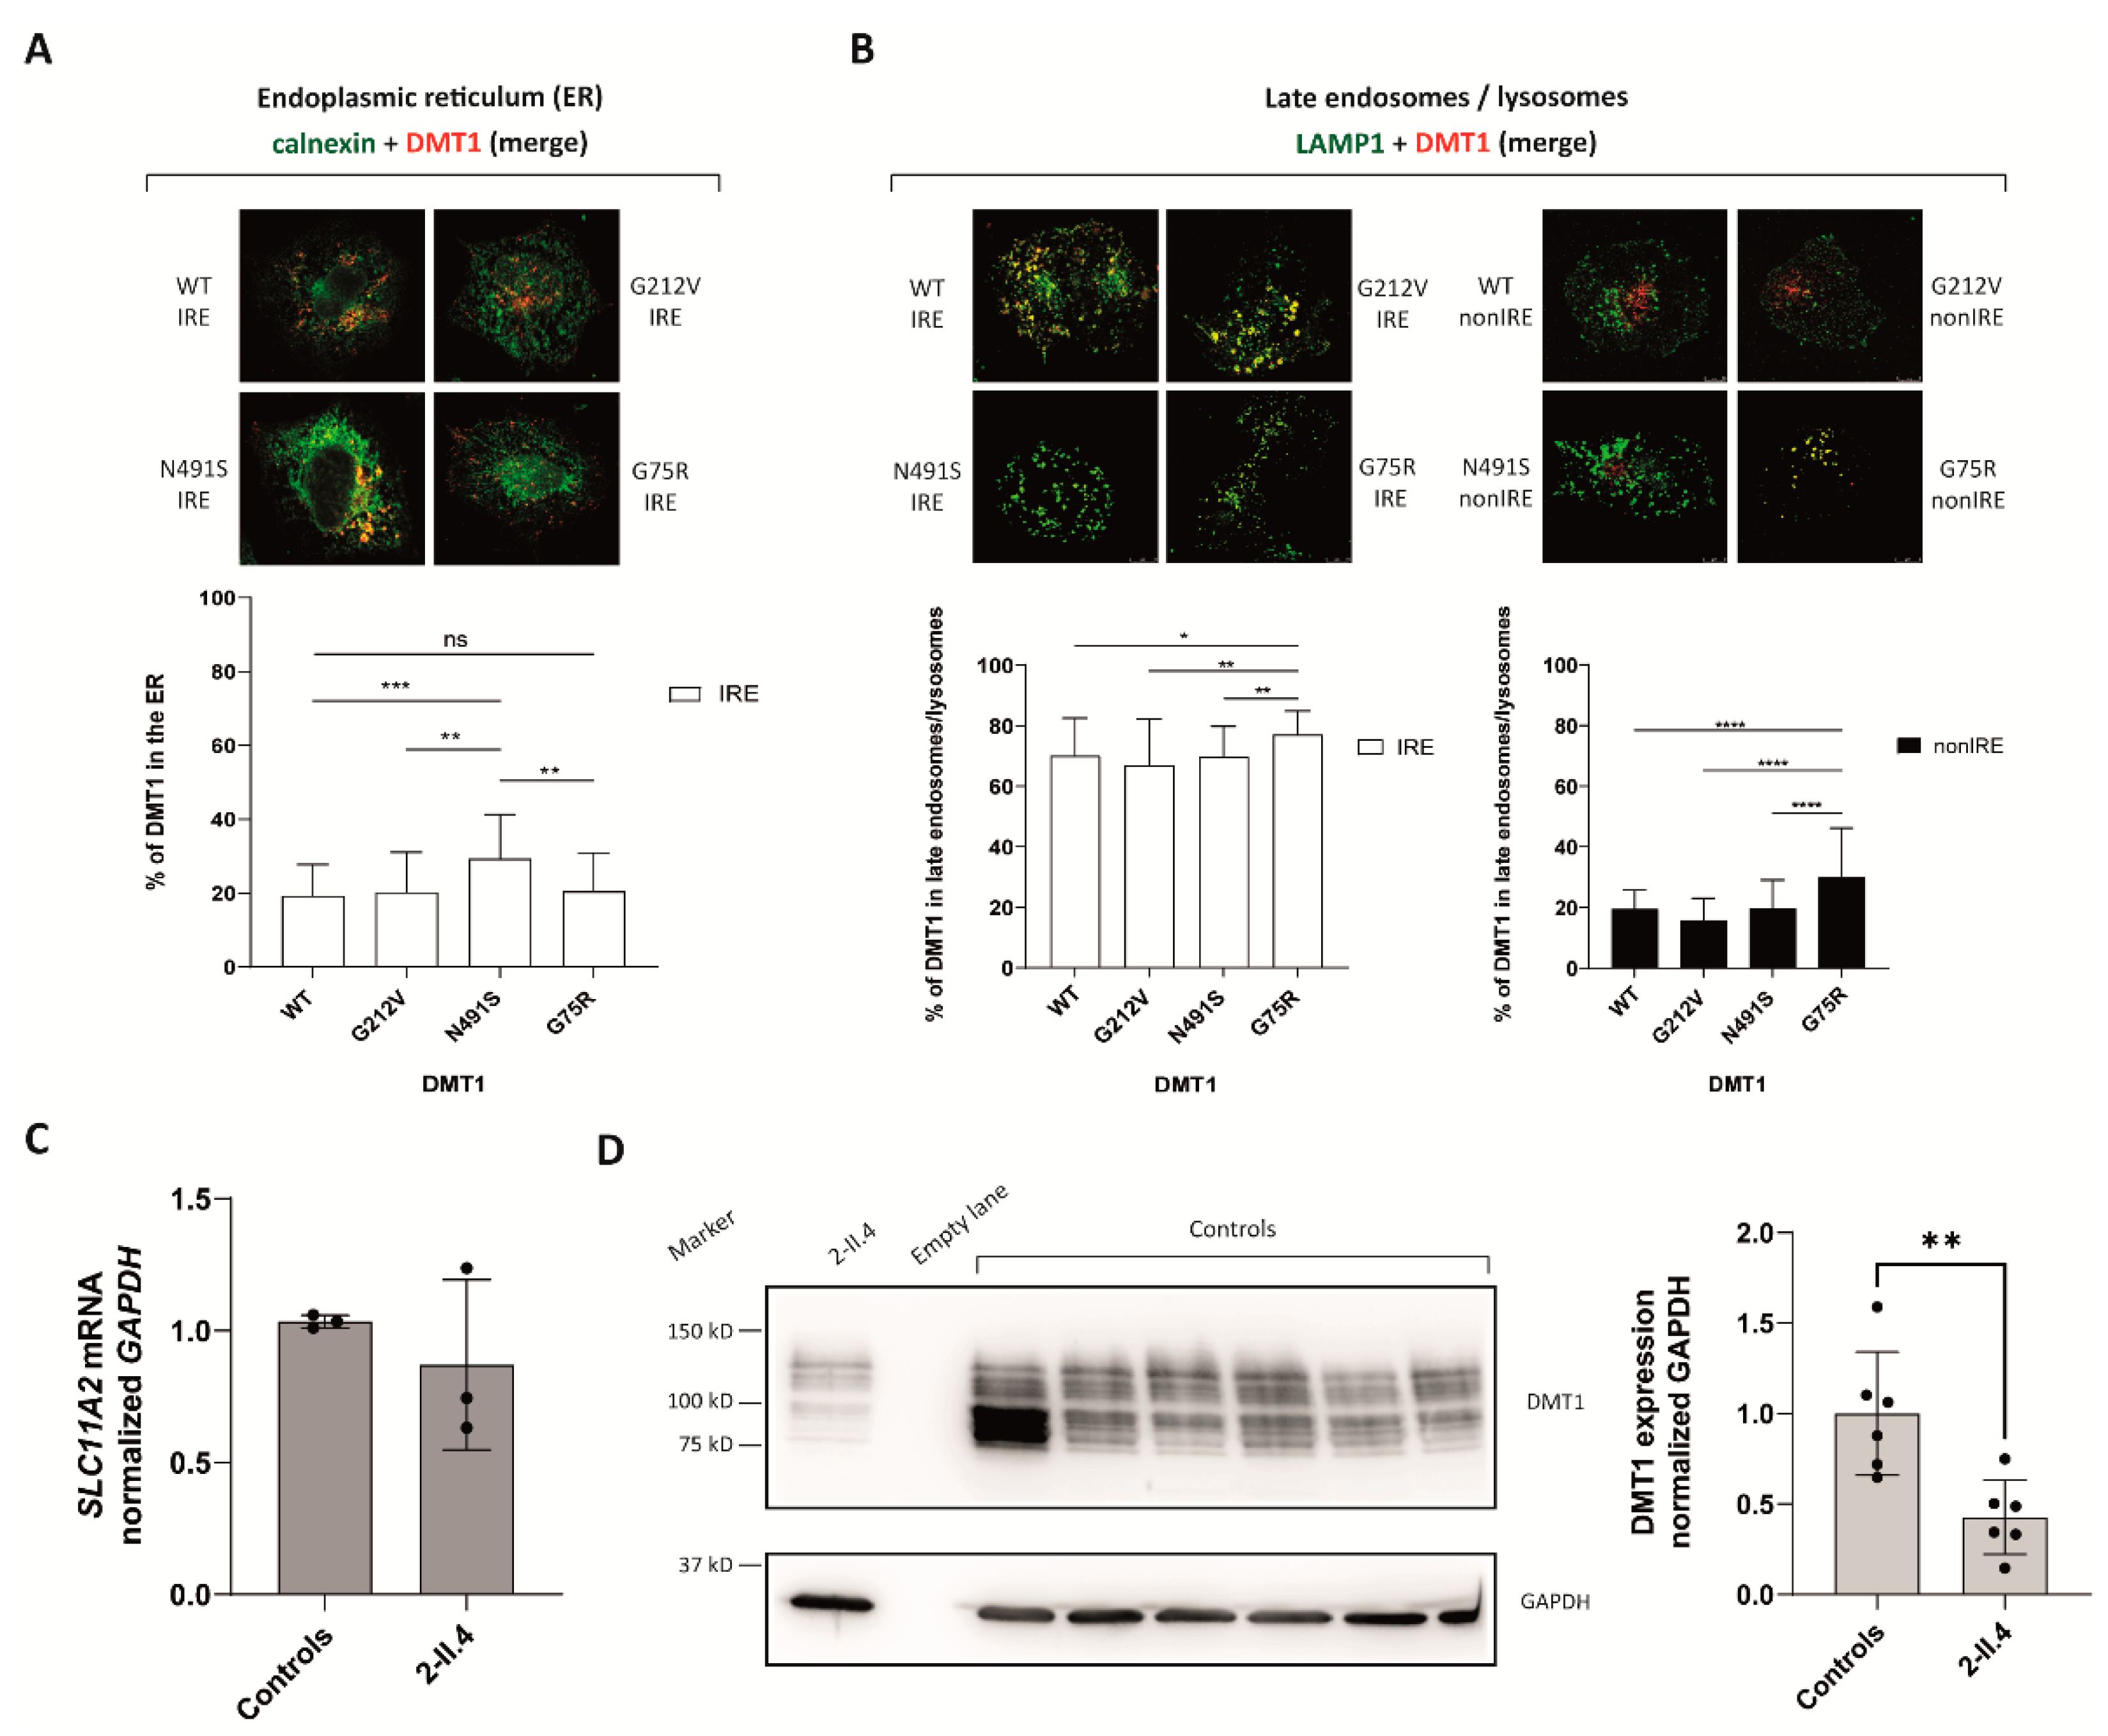
2.2.2. DMT1 Is Destabilized by the G75R Mutation
2.2.3. G75R Mutation Causes DMT1 Accumulation in the Lysosomes
3. Materials and Methods
3.1. DNA Extraction, PCR Amplification and DNA Sequencing
3.2. Bioinformatics and Computational Analysis
3.3. Plasmids and Mutagenesis
3.4. Cells and Cell Lines
3.5. RNA Extraction, Reverse Transcription and qPCR
3.6. Splicing Studies
3.7. Immunofluorescence
3.8. Confocal Microscopy
3.9. Immunoblotting
3.10. Statistical Analysis
Supplementary Materials
Author Contributions
Funding
Institutional Review Board Statement
Informed Consent Statement
Data Availability Statement
Acknowledgments
Conflicts of Interest
References
- Gunshin, H.; Mackenzie, B.; Berger, U.V.; Gunshin, Y.; Romero, M.F.; Boron, W.F.; Nussberger, S.; Gollan, J.L.; Hediger, M.A. Cloning and characterization of a mammalian proton-coupled metal-ion transporter. Nature 1997, 388, 482–487. [Google Scholar] [CrossRef] [PubMed]
- Hubert, N.; Hentze, M.W. Previously uncharacterized isoforms of divalent metal transporter (DMT)-1: Implications for regulation and cellular function. Proc. Natl. Acad. Sci. USA 2002, 99, 12345–12350. [Google Scholar] [CrossRef] [PubMed] [Green Version]
- Lam-Yuk-Tseung, S.; Gros, P. Distinct targeting and recycling properties of two isoforms of the iron transporter DMT1 (NRAMP2, Slc11A2). Biochemistry 2006, 45, 2294–2301. [Google Scholar] [CrossRef] [PubMed]
- Mims, M.P.; Guan, Y.; Pospisilova, D.; Priwitzerova, M.; Indrak, K.; Ponka, P.; Divoky, V.; Prchal, J.T. Identification of a human mutation of DMT1 in a patient with microcytic anemia and iron overload. Blood 2005, 105, 1337–1342. [Google Scholar] [CrossRef] [PubMed]
- Pospisilova, D.; Mims, M.P.; Nemeth, E.; Ganz, T.; Prchal, J.T. DMT1 mutation: Response of anemia to darbepoetin administration and implications for iron homeostasis. Blood 2006, 108, 404. [Google Scholar] [CrossRef] [Green Version]
- Iolascon, A.; D’Apolito, M.; Servedio, V.; Cimmino, F.; Piga, A.; Camaschella, C. Microcytic anemia and hepatic iron overload in a child with compound heterozygous mutations in DMT1 (SCL11A2). Blood 2006, 107, 349–354. [Google Scholar] [CrossRef] [Green Version]
- Beaumont, C.; Delaunay, J.; Hetet, G.; Grandchamp, B.; De Montalembert, M.; Tchernia, G. Two new human DMT1 gene mutations in a patient with microcytic anemia, low ferritinemia, and liver iron overload. Blood 2006, 107, 4168–4170. [Google Scholar] [CrossRef]
- Blanco, E.; Kannengiesser, C.; Grandchamp, B.; Tasso, M.; Beaumont, C. Not all DMT1 mutations lead to iron overload. Blood Cells Mol. Dis. 2009, 43, 199–201. [Google Scholar] [CrossRef]
- Bardou-Jacquet, E.; Island, M.-L.; Jouanolle, A.-M.; Détivaud, L.; Fatih, N.; Ropert, M.; Brissot, E.; Mosser, A.; Maisonneuve, H.; Brissot, P.; et al. A novel N491S mutation in the human SLC11A2 gene impairs protein trafficking and in association with the G212V mutation leads to microcytic anemia and liver iron overload. Blood Cells Mol. Dis. 2011, 47, 243–248. [Google Scholar] [CrossRef]
- De Falco, L.; Bruno, M.; Andolfo, I.; David, B.P.; Girelli, D.; Di Noce, F.; Camaschella, C.; Iolascon, A. Identification and characterization of the first SLC11A2 isoform 1a mutation causing a defect in splicing process and an hypomorphic allele expression of the SLC11A2 gene. Br. J. Haematol. 2012, 159, 492–495. [Google Scholar] [CrossRef]
- Barrios, M.; Moreno-Carralero, M.I.; Cuadrado-Grande, N.; Baro, M.; Vivanco, J.L.; Morán-Jiménez, M.J. The homozygous mutation G75R in the human SLC11A2 gene leads to microcytic anaemia and iron overload. Br. J. Haematol. 2012, 157, 514–516. [Google Scholar] [CrossRef] [PubMed] [Green Version]
- Casale, M.; Borriello, A.; Scianguetta, S.; Roberti, D.; Caiazza, M.; Bencivenga, D.; Tartaglione, I.; Ladogana, S.; Maruzzi, M.; Della Ragione, F.; et al. Hereditary hypochromic microcytic anemia associated with loss-of-function DMT1 gene mutations and absence of liver iron overload. Am. J. Hematol. 2018, 93, E58–E60. [Google Scholar] [CrossRef] [PubMed] [Green Version]
- Canonne-Hergaux, F.; Fleming, M.D.; Levy, J.E.; Gauthier, S.; Ralph, T.; Picard, V.; Andrews, N.C.; Gros, P. The Nramp2/DMT1 iron transporter is induced in the duodenum of microcytic anemia mk mice but is not properly targeted to the intestinal brush border. Blood 2000, 96, 3964–3970. [Google Scholar] [PubMed]
- Nickless, A.; Bailis, J.M.; You, Z. Control of gene expression through the nonsense-mediated RNA decay pathway. Cell Biosci. 2017, 7, 26. [Google Scholar] [CrossRef]
- Partridge, A.W.; Therien, A.G.; Deber, C.M. Missense mutations in transmembrane domains of proteins: Phenotypic propensity of polar residues for human disease. Proteins Struct. Funct. Bioinform. 2004, 54, 648–656. [Google Scholar] [CrossRef]
- Morgan, E.H.; Oates, P.S. Mechanisms and regulation of intestinal iron absorption. Blood Cells Mol. Dis. 2002, 29, 384–399. [Google Scholar] [CrossRef]
- Garrick, M.; Scott, D.; Walpole, S.; Finkelstein, E.; Whitbred, J.; Chopra, S.; Trivikram, L.; Mayes, D.; Rhodes, D.; Cabbagestalk, K.; et al. Iron supplementation moderates but does not cure the Belgrade anemia. Biometals 1997, 10, 65–76. [Google Scholar] [CrossRef]
- Fleming, M.D.; Romano, M.A.; Maureen, A.S.U.; Garrick, L.M.; Garrick, M.D.; Andrews, N.C. Nramp2 is mutated in the anemic Belgrade (b) rat: Evidence of a role for Nramp2 in endosomal iron transport. Proc. Natl. Acad. Sci. USA 1998, 95, 1148–1153. [Google Scholar] [CrossRef] [Green Version]
- Liuzzi, J.P.; Aydemir, F.; Nam, H.; Knutson, M.D.; Cousins, R.J. Zip14 (Slc39a14) mediates non-transferrin-bound iron uptake into cells. Proc. Natl. Acad. Sci. USA 2006, 103, 13612–13617. [Google Scholar] [CrossRef] [Green Version]
- Cuenca, M.V.; Marchi, G.; Barqué, A.; Esteban-Jurado, C.; Marchetto, A.; Giorgetti, A.; Chelban, V.; Houlden, H.; Wood, N.W.; Piubelli, C.; et al. Genetic and Clinical Heterogeneity in Thirteen New Cases with Aceruloplasminemia. Atypical Anemia as a Clue for an Early Diagnosis. Int. J. Mol. Sci. 2020, 21, 2374. [Google Scholar] [CrossRef] [Green Version]
- Kopanos, C.; Tsiolkas, V.; Kouris, A.; Chappel, C.E.; Aguilera, M.A.; Meyer, R.; Massouras, A. VarSome: The Human Genomic Variant Search Engine. Bioinformatics 2019, 35, 1978–1980. [Google Scholar] [CrossRef] [PubMed]
- Schwarz, J.M.; Cooper, D.N.; Schuelke, M.; Seelow, D. MutationTaster2: Mutation prediction for the deep-sequencing age. Nat. Methods 2014, 11, 361–362. [Google Scholar] [CrossRef] [PubMed]
- Jumper, J.; Evans, R.; Pritzel, A.; Green, T.; Figurnov, M.; Ronneberger, O.; Tunyasuvunakool, K.; Bates, R.; Žídek, A.; Potapenko, A.; et al. Highly accurate protein structure prediction with AlphaFold. Nature 2021, 596, 583–589. [Google Scholar] [CrossRef] [PubMed]
- Varadi, M.; Anyango, S.; Deshpande, M.; Nair, S.; Natassia, C.; Yordanova, G.; Yuan, D.; Stroe, O.; Wood, G.; Laydon, A.; et al. AlphaFold Protein Structure Database: Massively expanding the structural coverage of protein-sequence space with high-accuracy models. Nucleic Acids Res. 2022, 50, D439–D444. [Google Scholar] [CrossRef] [PubMed]
- TMHMM Server (RRID:SCR_014935)-DTU Health Tech. Available online: https://services.healthtech.dtu.dk/service.php?TMHMM-2.0 (accessed on 20 October 2020).
- Protocols-UNC Lineberger. Available online: https://unclineberger.org/tissueculture/protocols/ (accessed on 15 January 2021).
- Casas, M.; Fadó, R.; Domínguez, J.L.; Roig, A.; Kaku, M.; Chohnan, S.; Solé, M.; Unzeta, M.; Miñano-Molina, A.J.; Rodríguez-Álvarez, J.; et al. Sensing of nutrients by CPT1C controls SAC1 activity to regulate AMPA receptor trafficking. J. Cell Biol. 2020, 219, e201912045. [Google Scholar] [CrossRef] [PubMed]

| Case | Gender | Anemia Onset | Liver Iron Overload (Age) | Treatment with rEPO | Serum Ferritin | Mutations in SLC11A2/DMT1 | Reference |
|---|---|---|---|---|---|---|---|
| 1 | F | At 3 m/o | Yes (19) | Initiation age n.a. | Normal to slightly elevated | E399D + E399D; exon 12 skipping | [4,5] |
| 2 | M | At birth | Yes (5) | Initiated at 3 m/o | Elevated; normalized with rEPO treatment | c.310-3-5delCTT + R416C | [6] |
| 3 | F | At birth | Yes (6) | No | Low; normalized with iron supplements | G212V + delV114 | [7] |
| 4 | M | At birth | No (7) | No | Low | G75R + G75R | [8] |
| No (19) | n.a. | n.a. | Data provided by Dr. Tasso | ||||
| 5 | F | At 13 y/o | Yes (27) | No | Elevated | G212V + N491S | [9] |
| 6 | F | Infancy | Yes (25) | No | Elevated | G212V + IVS1A + 3A > T | [10] |
| 7 | M | At birth | Yes (9) | No | Normal | G75R + G75R | [11] |
| 8 | F | At birth | No (11) | Initiated at 3 y/o | Normal | R477W + IVS4 + 1G/C | [12] |
| 9 | F | At birth | NT | No | Normal | c.762 + 35A > G + c.762 + 35A > G | This study |
| 10 | M | Fetal | ID | Initiated at 2.5 y/o | Normal | G75R + G75R | This study |
| at Birth | 6 m/o | 1 y/o | 1.5 and 3 y/o | |||||||||
|---|---|---|---|---|---|---|---|---|---|---|---|---|
| 1-II.2 | 2-II.4 | Ref. | 1-II.2 | 2-II.4 | Ref. | 1-II.2 | 2-II.4 | Ref. | 1-II.2 | 2-II.4 | Ref. | |
| RBC (×106/µL) | 3 | 6.2 | 4.6–6 | 4.1 | 4.5 | 4.6–6 | 5.5 | n.a. | 4.6–6 | 4.6 | 5.6 | 4.6–6 |
| Hb (g/dL) | 4.4 | 14.3 | 14–16.6 | 7.6 | 6.5 | 9.5–13.5 | 9.8 | n.a. | 10.5–13.5 | 8.6 | 8.5 | 10.5–13.5 |
| MCV (fl) | 72.3 | 72.1 | 106–118 | 58.8 | 48.5 | 74–108 | 61.2 | n.a. | 70–86 | 58.6 | 52.5 | 70–86 |
| MCH (pg) | 14.3 | 23 | 34–38.4 | 18.4 | 14.5 | 25–35 | 17.8 | n.a. | 24–30 | 18.5 | 15.3 | 24–30 |
| Reticulocytes (%) | 6.99 | 4.3 | 5–25 | 1 | 0.4 | 5–25 | 2 | n.a. | 5–25 | 1.4 | 0.53 | 5–25 |
| Serum iron (µg/dL) | 213 | n.a. | 32.6–192.7 | n.a. | 196 | 32.6–192.7 | 249 | 185 | 32.6–192.7 | 244 | 206 | 32.6–192.7 |
| Ferritin (ng/mL) | 20 | n.a. | 25–200 | 97 | 52 | 7–140 | 22 | 36 | 7–140 | 15 | 81 | 7–140 |
| Transferrin (mg/dL) | 200 | n.a. | 200–360 | n.a. | 236 | 200–360 | 223 | 208 | 200–360 | 209 | 171 | 200–360 |
| Transferrin sat (%) | 74.9 | n.a. | 20–45 | n.a. | 58.2 | 20–45 | 77.7 | 62.3 | 20–45 | 81.7 | 84.2 | 20–45 |
| Hepcidin (ng/mL) | n.a. | n.a. | 28.5–45.7 | n.a. | n.a. | 28.5–45.7 | 2.9 | 18.3 | 28.5–45.7 | n.a. | n.a. | 28.5–45.7 |
Publisher’s Note: MDPI stays neutral with regard to jurisdictional claims in published maps and institutional affiliations. |
© 2022 by the authors. Licensee MDPI, Basel, Switzerland. This article is an open access article distributed under the terms and conditions of the Creative Commons Attribution (CC BY) license (https://creativecommons.org/licenses/by/4.0/).
Share and Cite
Romero-Cortadellas, L.; Hernández, G.; Ferrer-Cortès, X.; Zalba-Jadraque, L.; Fuster, J.L.; Bermúdez-Cortés, M.; Galera-Miñarro, A.M.; Pérez-Montero, S.; Tornador, C.; Sánchez, M. New Cases of Hypochromic Microcytic Anemia Due to Mutations in the SLC11A2 Gene and Functional Characterization of the G75R Mutation. Int. J. Mol. Sci. 2022, 23, 4406. https://doi.org/10.3390/ijms23084406
Romero-Cortadellas L, Hernández G, Ferrer-Cortès X, Zalba-Jadraque L, Fuster JL, Bermúdez-Cortés M, Galera-Miñarro AM, Pérez-Montero S, Tornador C, Sánchez M. New Cases of Hypochromic Microcytic Anemia Due to Mutations in the SLC11A2 Gene and Functional Characterization of the G75R Mutation. International Journal of Molecular Sciences. 2022; 23(8):4406. https://doi.org/10.3390/ijms23084406
Chicago/Turabian StyleRomero-Cortadellas, Lídia, Gonzalo Hernández, Xènia Ferrer-Cortès, Laura Zalba-Jadraque, José Luis Fuster, Mar Bermúdez-Cortés, Ana María Galera-Miñarro, Santiago Pérez-Montero, Cristian Tornador, and Mayka Sánchez. 2022. "New Cases of Hypochromic Microcytic Anemia Due to Mutations in the SLC11A2 Gene and Functional Characterization of the G75R Mutation" International Journal of Molecular Sciences 23, no. 8: 4406. https://doi.org/10.3390/ijms23084406
APA StyleRomero-Cortadellas, L., Hernández, G., Ferrer-Cortès, X., Zalba-Jadraque, L., Fuster, J. L., Bermúdez-Cortés, M., Galera-Miñarro, A. M., Pérez-Montero, S., Tornador, C., & Sánchez, M. (2022). New Cases of Hypochromic Microcytic Anemia Due to Mutations in the SLC11A2 Gene and Functional Characterization of the G75R Mutation. International Journal of Molecular Sciences, 23(8), 4406. https://doi.org/10.3390/ijms23084406