Article

Molecular Traits and Functional Exploration of BES1 Gene Family in Plants

1
Zhengzhou Research Base, State Key Laboratory of Cotton Biology, School of Agricultural Sciences, Zhengzhou University, Zhengzhou 450001, China
2
Suzhou Academy of Agricultural Science, Suzhou 234000, China
3
Shenzhen Branch, Guangdong Laboratory for Lingnan Modern Agriculture, Genome Analysis Laboratory of the Ministry of Agriculture, Agricultural Genomics Institute at Shenzhen, Chinese Academy of Agricultural Sciences, Shenzhen 518120, China
4
State Key Laboratory of Cotton Biology, Institute of Cotton Research, Chinese Academy of Agricultural Sciences, Anyang 455000, China
*
Authors to whom correspondence should be addressed.
These authors contributed equally to this work.
Int. J. Mol. Sci. 2022, 23(8), 4242; https://doi.org/10.3390/ijms23084242
Submission received: 3 March 2022 / Revised: 3 April 2022 / Accepted: 5 April 2022 / Published: 11 April 2022
(This article belongs to the Section Molecular Genetics and Genomics)

Abstract

:
The BES1 (BRI1-EMSSUPPRESSOR1) gene family is a unique class of transcription factors that play dynamic roles in the Brassinosteroids (BRs) signaling pathway. The published genome sequences of a large number of plants provide an opportunity to identify and perform a comprehensive functional study on the BES1 gene family for their potential roles in developmental processes and stress responses. A total of 135 BES1 genes in 27 plant species were recognized and characterized, which were divided into five well-conserved subfamilies. BES1 was not found in lower plants, such as Cyanophora paradoxa and Galdieria sulphuraria. The spatial expression profiles of BES1s in Arabidopsis, rice, and cotton, as well as their response to abiotic stresses, were analyzed. The overexpression of two rice BES1 genes, i.e., OsBES1-3 and OsBES1-5, promotes root growth under drought stress. The overexpression of GhBES1-4 from cotton enhanced the salt tolerance in Arabidopsis. Five protein interaction networks were constructed and numerous genes co-expressed with GhBES1-4 were characterized in transgenic Arabidopsis. BES1 may have evolved in the ancestors of the first land plants following its divergence from algae. Our results lay the foundation for understanding the complex mechanisms of BES1-mediated developmental processes and abiotic stress tolerance.

1. Introduction

Plant development is synergistically controlled using various gene complex networks. The steroid hormones brassinosteroids (BRs) play important roles in regulating diverse plant processes such as cell elongation, photomorphogenesis, and reproduction, as well as both abiotic and biotic stress responses. BRI1-EMSSUPPRESSOR1 (BES1), as a new plant-specific transcription factor (TF), plays a significant role in modulating BR-regulated gene expression [1,2]. The BES1 protein comprises three domains including the BRASSINOSTEROID INSENSITIVE 2 (BIN2) phosphorylation domain (P), amino-terminal domain (N), and carboxyl-terminal domain [3]. It was reported that the N-terminal domain comprises a conserved motif and a nuclear localized sequence that combine and assist as a DNA binding structure to unite with the basic helix-loop-helix (bHLH) domains of BES1-interacting Myc-like 1 (BIM1). The P domain is well known as a target of the BIN2 kinase, but little is known about its biological functions [4].
Regulation of BES1 occurs in multiple routes, among which the phosphorylation of BES1 proteins is well studied. BIN2 acts as an inhibitor of BR signaling through interaction with BES1 to regulate BR signal transduction via its phosphorylation and dephosphorylation in Arabidopsis (Arabidopsis thaliana) [5]. When BRs are at low levels, BIN2 phosphorylates BES1 and prevents its nuclear localization, suppresses its DNA binding activity, and/or promotes its degradation [6]. BES1 and BRASSINAZOLE RESISTANT1 (BZR1) contain two conserved lysine residues, K280 and K320, which serve as the conjugation sites of small ubiquitin-like modifier (SUMO), which modifies BES1 post-translationally and alters its functionality [7]. A previous study indicated that BES1 is a major factor that contributes either transcriptional activation or repression to several target genes in Arabidopsis. BES1, coupled with BZR1, binds to the promoter of AGAMOUS-LIKE15 (AGL15), directly repressing its transcription, thereby maintaining its low level of expression that is necessary in the seed maturation program during the seed-to-seedling transition [8]. It also repressed the expression of CIRCADIAN CLOCK-ASSOCIATED 1 (CCA1) and LATE ELONGATED HYPOCOTYL (LHY) in the dark phase of the diurnal cycle by binding to their promoters, through its interaction with TOPLESS (TPL) [9]. In apple, BES1 positively regulated the expression of MYB88 under pathogen attack. The downregulation of MdMYB88 in the plants overexpressing MdBES1 decreased the resistance to a pathogen and C-REPEAT BINDING FACTOR1 expression [10]. BES1 regulates a number of genes involved in various physiological processes. The sensitivity of the AtBES1 mutant was related to the reduction in photochemical efficiency of PSII and increased the content of tocopherol and lipid hydrogen peroxide, namely, the increased photoinhibition and photooxidation stress during heat stress. BES1 can interact with ABSCISIC ACID INSENSITIVE5 (ABI5) and significantly downregulates the expression of the downstream regulatory genes by inhibiting the binding of ABI5 to the promoter regions of these genes, which promotes seed germination [11]. In maize, BES1/BZR1-5 positively regulates kernel size. The overexpression of ZmBES1/BZR1-5 significantly increased the seed size and weight in maize, which was verified in the Mu transposon insertion mutant that produces smaller kernels [12]. TINY (encodes a member of the DREB subfamily A-4 of ERF/AP2 transcription factor family), an APETALA2/ETHYLENE RESPONSIVE FACTOR TF that is inducible by drought stress, antagonizes BES1, leading to the inhibition of BR-regulated growth and the enhancement of drought-responsive gene expression [13]. Strigolactones (SLs) are a class of terpenoid phytohormones, which has been found to regulate shoot branching in both rice and Arabidopsis, in addition to the aforementioned roles in BR signaling [14].
With the rapid progress in whole genome sequencing, which has been completed in a great number of plants, BES1 genes have been profiled in numerous plant species [15,16,17]. However, the advancement of the comprehensive understanding of the BES1 family genes in the plant kingdom is clearly lacking. This study aimed to carry out a comprehensive investigation of the BES1 gene family in algae, bryophytes, lycophytes, and vascular plants. The distribution, phylogenetic tree, gene structure, and collinearity of the BES1 gene family were analyzed to understand the evolutionary history of BES1 in plants. The spatial gene expression patterns of BES1, together with their responses to various abiotic stresses, were also analyzed in Arabidopsis, rice, and cotton. Furthermore, co-expression and transgenic research were examined in some BES1 members. The outcome of this study may shed more light on the functionality and functional networks of the BES1 gene family and lay a solid foundation for the future exploration of its potential applications in biological research and agricultural production.

2. Results

2.1. Identification of BES1 Gene Family in Plantae

The examination and characterization of the BES1 gene family in 27 species in the Plantae Kingdom, signifying nine main plant families including rhodophytes, chlorophytes, glaucophytes, bryophytes, gymnosperms, lycophytes, basal angiosperms, eudicots, and monocots, were chosen for this investigation (Table 1). A total number of 135 BES1 genes, following filtering, were identified, and the breakdown of the numbers per specie is shown in Table 1. No BES1 gene was identified in the Cyanophora paradoxa, Galdieria sulphuraria, Cyanidioschyzon merolae, and 7 Chlorophytes species. The recognized BES1 genes presented deviated molecular features with protein lengths ranging from 158 to 801 amino acid residues. They are randomly distributed on the chromosomes in each species (Table S1). There is no correlation between the number of BES1 genes and genome size of the plant species. For example, there are 4 BES1 genes in Selaginella moellendorffii that has a genome size of 100 Mb, whereas there are a similar number of BES1 genes in Picea abies that has a genome size of 19,600 Mb. As a tetraploid, G. hirsutum (Gossypium hirsutum) contains the most BES1 genes (22), being the sum of the number of BES1 genes identified in its two diploid progenitors, i.e., G. arboreum (Gossypium arboreum) and G. raimondii (Gossypium raimondii) (11).

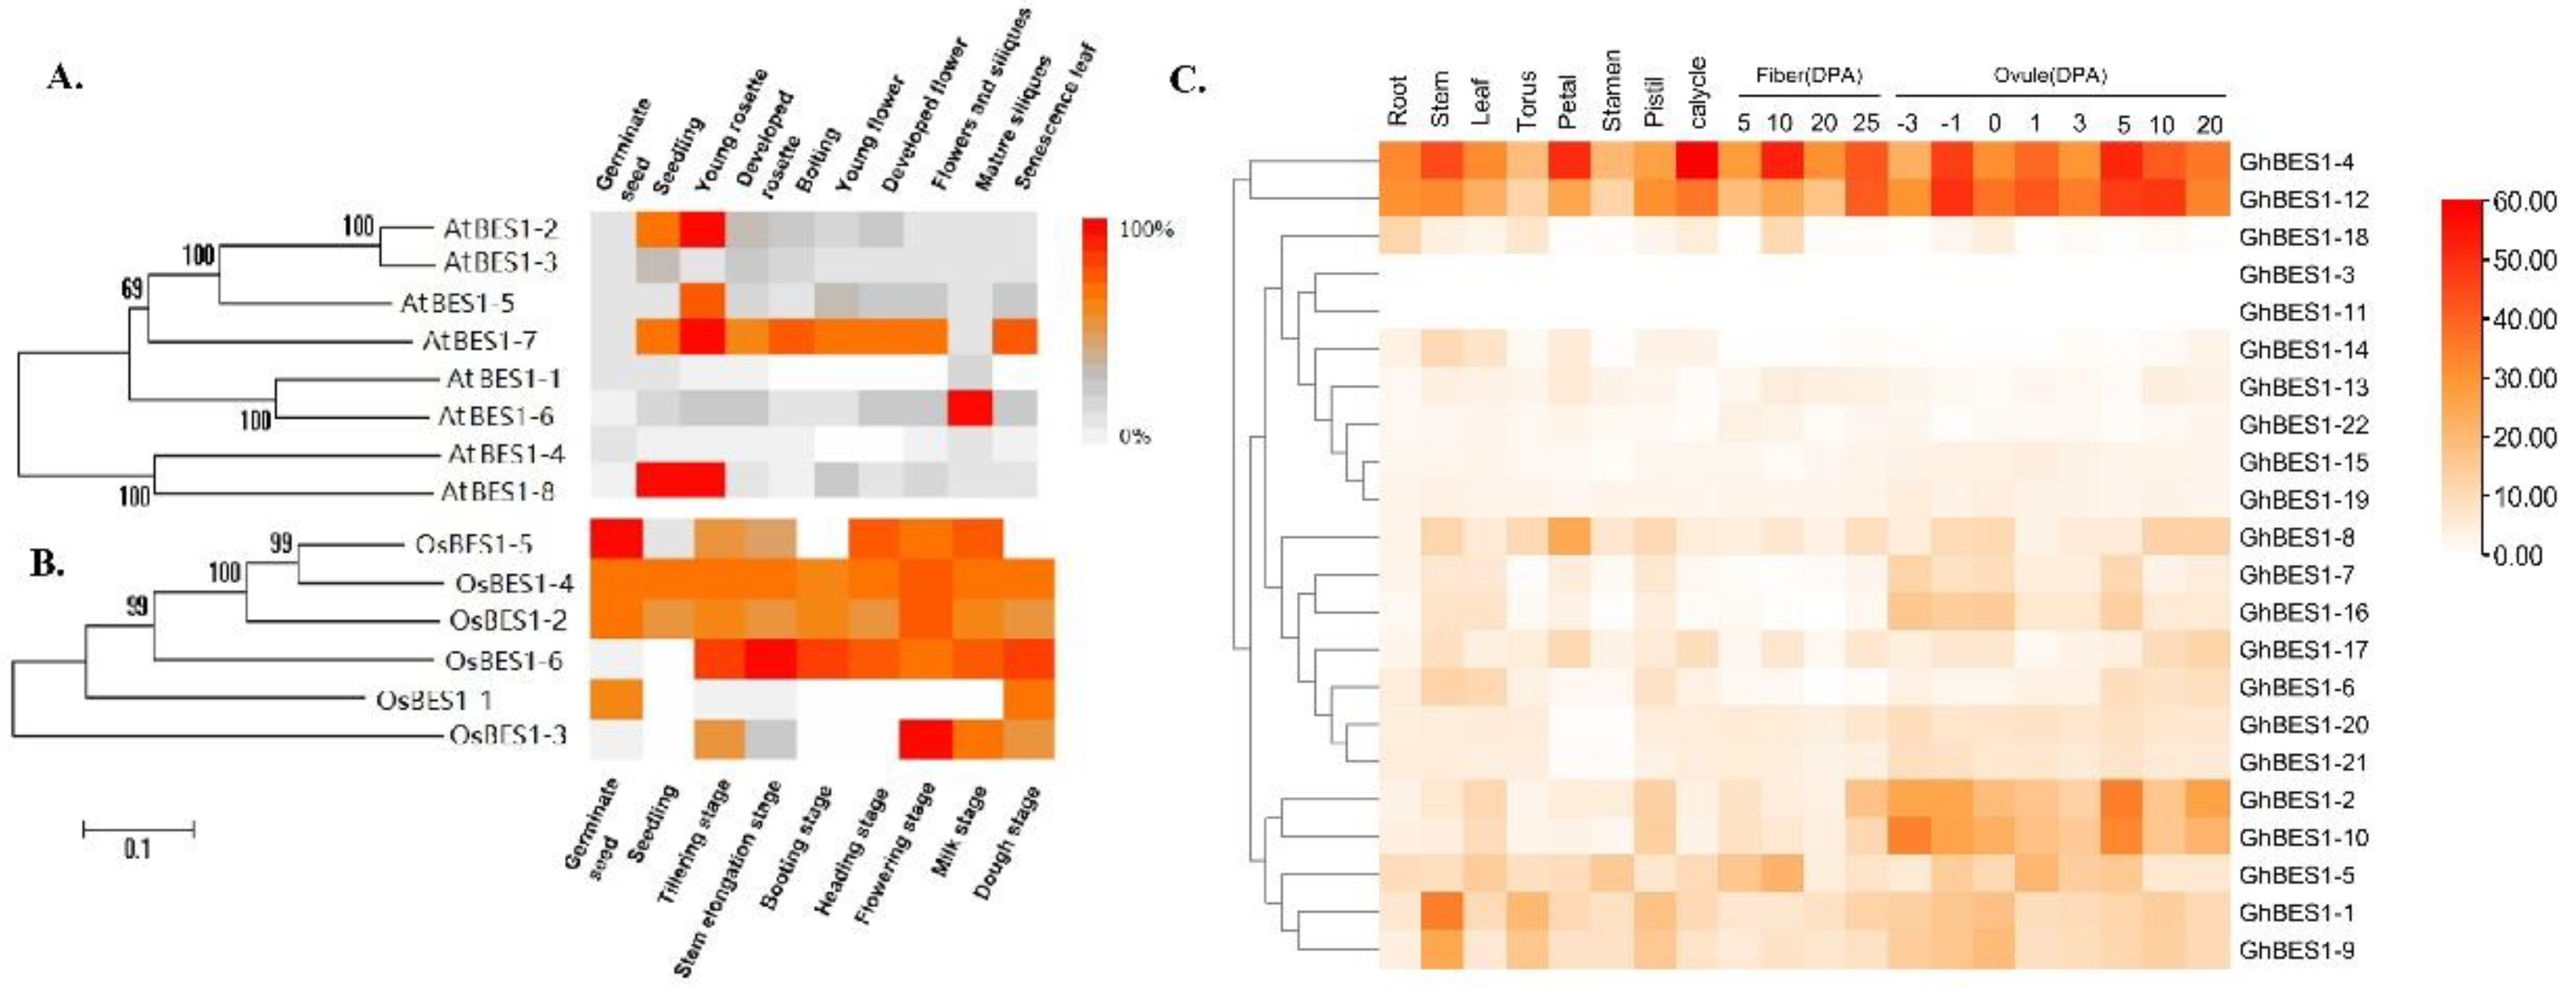
2.2. Phylogenetic Analysis, Conserved Motif, and Protein Characteristics

To uncover whether and when natural selection had acted on the evolution of the BES1 gene family, we aligned the 135 identified BES1 protein sequences and constructed a phylogenetic tree. These genes were grouped into five clades (Figure 1A). All the BES1s in the Bryophytes and Lycophytes were assigned into Sub II and III. None of the angiosperm BES1s were detected in Sub III, suggesting that the genes of Sub III might have experienced an evolutionary divergence in structure or function. Sub I, IV, and V contained 33, 30, and 37 proteins, respectively, which were mainly from the higher terrestrial plant species belonging to monocotyledonary and dicotyledonary plants. There was only one BES1 in the basal angiosperm (Amborella trichopoda) in Sub I and IV, and two BES1 in Gymnosperms (Picea sitchensis) in Sub V.
The ratio of Ka/Ks can be used to determine whether there is a selective pressure acting on this protein-coding gene. In P. patens, M. polymorpha, S. moellendorffii, A. trichopoda, Arabidopsis, and three cotton species, the Ka/Ks values were calculated for 80 gene pairs (Figure 1B), but none in P. patens, M. polymorpha, and S. moellendorffii. Among other species, the Ka/Ks values of 75 gene pairs were less than 0.5, whereas those of four gene pairs were between 0.5 and 1.0, suggesting that strong purifying selection pressure might have occurred in these species. There was one gene pair that showed a Ka/Ks value greater than 1.0, suggesting directional selection.
BES1 contains a highly basic region that is very similar to the basic regions of other bHLH proteins. The Glu-13Arg-16 pair and two leucine residues are also present in all the BES1 family members. Although every protein can form a helix-loop-helix structure as predicted, variation exists in five subgroups (Figure 1C). We selected one BES1 gene in each subgroup to understand the physicochemical properties, among which GhBES1-19, XP_024375445.1, ADE77805.1, GhBES1-4, and GhBES1-1 were selected from Sub I to Sub V. All these proteins possess hydrophilic features. The disordered structure of GhBES1-19 and XP_024375445.1 accounted for a large proportion (about 40%), while the disordered structure of ADE77805.1, GhBES1-4, and GhBES1-1 accounted for 74–79%. The Alpha helix of GhBES1-19, XP_024375445.1, ADE77805.1, GhBES1-4, and GhBES1-1 was 36%, 38%, 14%, 13%, and 18%, respectively (Figure S2).

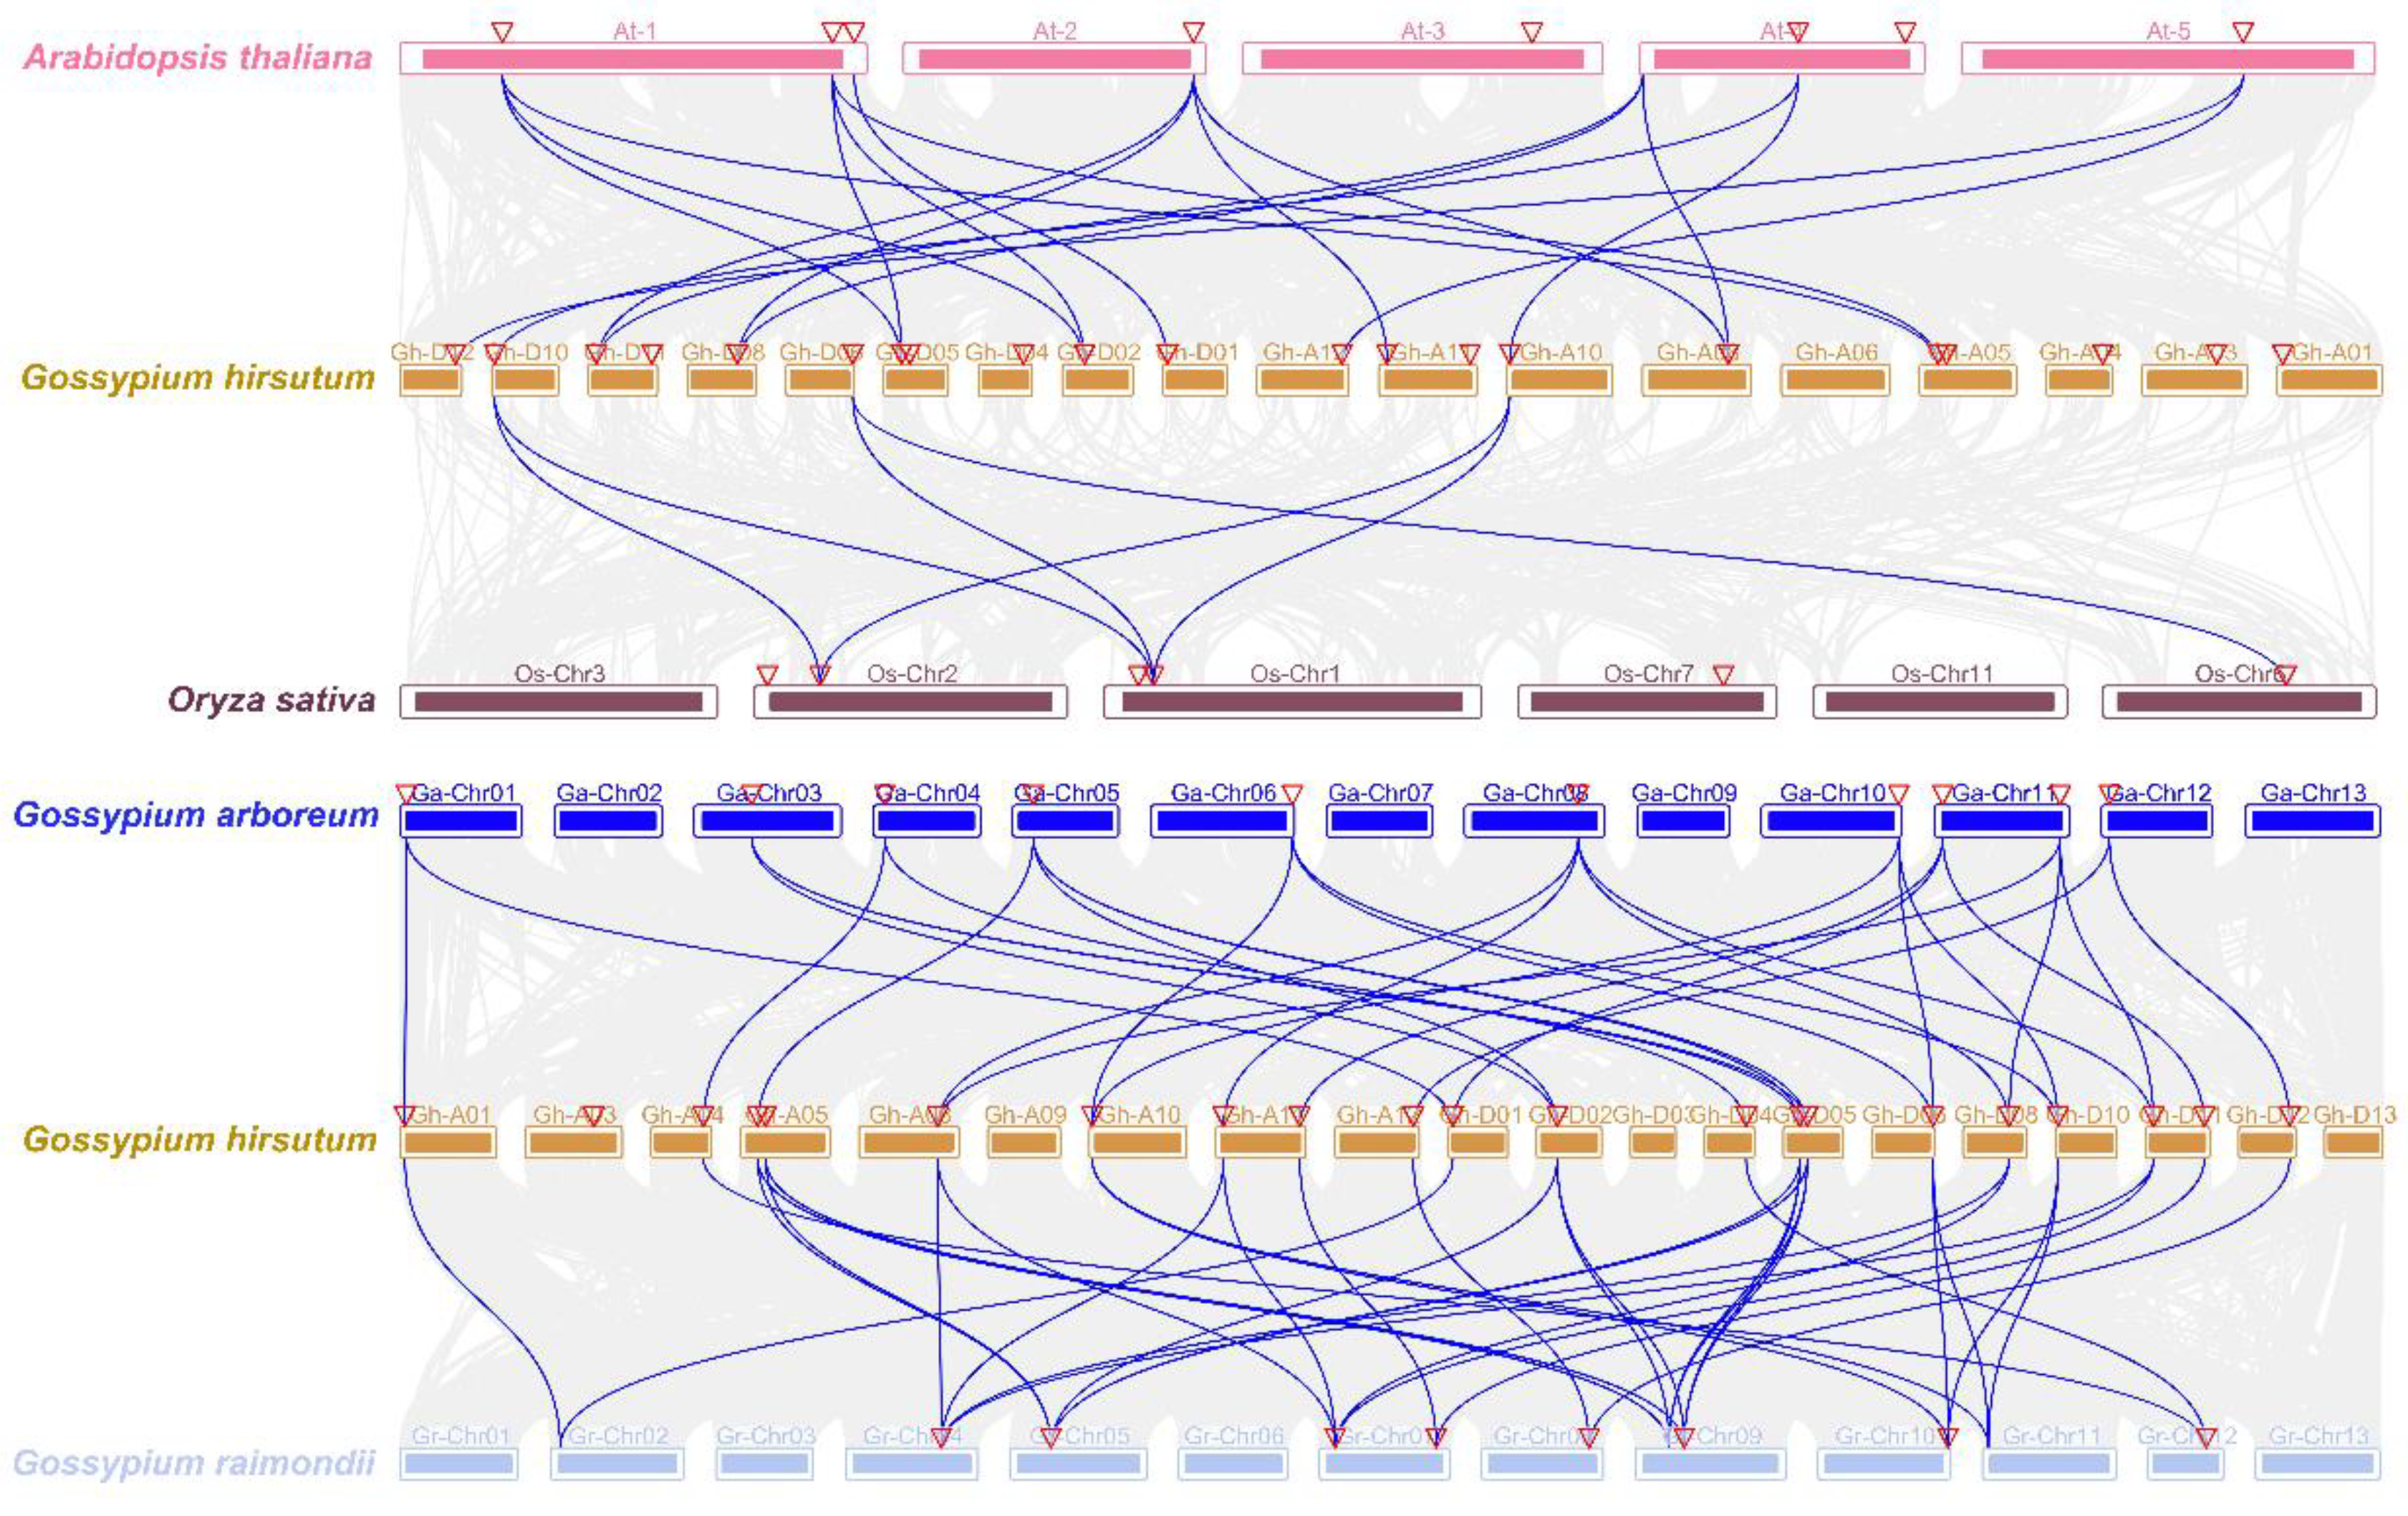
2.3. Structure, Collinearity, and Cis-Acting Elements Analysis

The exon/intron structure of paralogous genes is highly conserved, which could be used to elucidate the evolutionary relationships between species [4]. The variation and diversity in the BES1 gene structural features in plant species and their underlying molecular mechanism are summarized in Figure S1. Interestingly, BES1 family participants shared a parallel gene structure even within the same subfamily according to the number of intron and intron phases except Sub I within which four family members have only one exon, six members have two exons, and the other members have nine exons. This is in contrast to the most members in Sub II, III, IV, and V, which contain two exons.
The collinearity analysis of BES1 genes in Arabidopsis, rice, and cotton showed that seven AtBES1 genes were correlated with twelve GhBES1 genes, and three OsBES1 genes were correlated with three GhBES1 genes (Figure 2). Among them, six AtBES1 and two OsBES1 genes were related to at least two cotton BES1 genes. The collinearity between the three cotton species (G. arboretum, G. raimondii, and G. hirsutum) was also established (Figure 2), showing that G. hirsutum formed 23 and 35 homologous gene pairs with G. arboretum and G. raimondii, respectively. GhBES1 genes had a collinear relationship with multiple GaBES1 and GrBES1 genes, indicating that the increase in number of GhBES1 gene was not only due to the increase in genome size, but also the splicing and replication that have occurred between chromosomes.
Cis-acting elements play an important role in the regulation of gene transcription initiation. In this study, all of the BES1 genes showed a light response. A total of 17 genes are relevant to the production of salicylic acid. In addition, numerous elements in response to abscisic acid, auxin, defense and stress, gibberellin, and MeJA have been recognized, implying their regulation in hormones or stress responses (Figure S3).

2.4. Expression Analysis of BES1 Family Genes in Arabidopsis, Rice, and Cotton

To detect the functional divergence, the spatial and temporal expression patterns of the BES1 genes were investigated in Arabidopsis, rice, and cotton. In Figure 3, the transcriptomic levels of AtBES1, OsBES1, and GhBES1 genes were evaluated in both the vegetative and reproductive tissues, which showed clear tissue-specificities. In Arabidopsis, AtBES1-7 showed the highest expression level in the largest number of tissues and developmental phases of plants than its paralogues. AtBES1-2 and AtBES1-8 were mainly expressed in the seedlings and young rosettes, whereas AtBES1-3 was significantly articulated in the young rosette. The rest of the AtBES1 family genes showed relatively low expression levels in most tissues/developmental stages. In rice, OsBES1-5, OsBBES1-4, OsBES1-2, and OsBES1-6 transcripts showed higher expression levels compared to OsBES1-1 in almost all plant tissues and developmental phases, despite the variation in expression patterns. The variation in expression of OsBES1-3 was only discernible at the reproductive stages.
Among the cotton GhBES1 genes, GhBES1-4 and GhBES1-12 were highly expressed in all plant tissues, in contrast to GhBES1-3 and GhBES1-11 that were not detected in any of the examined tissues. The expression of GhBES1-6, -7, -13, -14, -16, and -22 was barely discernible during fiber development. It is known that the transcript abundance of a gene in a specific plant tissue establishes the important clues for its biological functions. For instance, GhBES1-4 and GhBES1-12 were gene paralogues dominantly expressed during ovule development, advising that they may share a conserved functional role in seed development.

2.5. Expression Profiles of BES1 Family Genes under Abiotic Stresses

The mRNA levels of AtBES1, OsBES1, and GhBES1 genes were induced by abiotic stresses. In brief, cold and heat stresses significantly up-regulated the transcription levels of AtBES1-2, AtBES1-1, AtBES1-3, and AtBES1-4, but showed nonsignificant effects on the expression of AtBES1-5, AtBES1-7, AtBES1-6, AtBES1-8. PEG treatment markedly up-regulated the transcription of all the AtBES1 genes, especially AtBES1-6 and AtBES1-8. NaCl treatment greatly up-regulated the transcriptions of AtBES1-2 and AtBES1-1, and down-regulated those of AtBES1-5, AtBES1-7, AtBES1-6, and AtBES1-8, without discernible effects on the expressions of AtBES1-3 and AtBES1-4 (Figure 4A).
The expression patterns of OsBES1 family gene members displayed a clear temporal and spatial diversification (Figure 4B). Under cold and PEG stresses, almost all the OsBES1 genes were significantly up-regulated in both the roots and shoots following a period of 12 h of treatment, except OsBES1-4 that showed relatively moderate up-regulation in response to these stresses. Under 12 h of heat treatment, OsBES1-6, OsBES1-5, OsBES1-3, and OsBES1-2 were up-regulated in shoots but the expressions of OsBES1-4 and OsBES1-1 were not affected. In roots, all the OsBES1 genes maintained moderate changes at 12 h of heat treatment. Under 12 h of NaCl treatment, significantly higher levels of mRNA transcripts were observed from all of the OsBES1 family genes in shoots, but not in roots. It should be noticed that the expression patterns of both AtBES1 and OsBES1 genes did no show distinct subfamily characteristics under the treatment of these environmental stresses.
Figure 4C represents the heat map analysis of the GhBES1 family genes’ responses to the environmental stresses such as cold, hot, dehydration, and salinity. GhBES1-3 and -11 were barely discernible under all the four stress treatments. Under low-temperature treatment, GhBES1-1, -2, -4, -5, -7, -8, -9, -10, -12, -13, -15, and -17 showed an initial low expression before raising to high levels, which is opposite to the trend of responsiveness to cold treatment by GhBES1-6, -14, and -16. Under high-temperature treatment, GhBES1-1, -2, -5, -7, -8, -9, -10, -13, and -16 displayed an initial increase before a reduction in expression, but GhBES1-4, -12, -14, -15, -17, -18, -19, -20, and -21 showed a constant reduction trend. Under PEG treatment, the expressions of GhBES1-1, -2, -8, -9, -13, and -19 were increased, but the opposite was true to GhBES1-4, -10, -14, -15, and -16. In response to salinity treatment, the expressions of GhBES1-1, -2, -5, -7, -8, -9, -10, -18, and -19 showed a trend of increase, but GhBES1-4, -6, -14, -15, -16, -17, and -22 showed a trend of reduction. Furthermore, the expression of GhBES1-1 and -4 was rapidly increased to very high levels in response to different stress treatments, suggesting their potentially crucial roles in managing abiotic stresses. Nine GhBES1 genes were selected for qRT-PCR analysis, which showed consistent expression patterns and verified the transcriptome analysis (Figures S4 and S5).

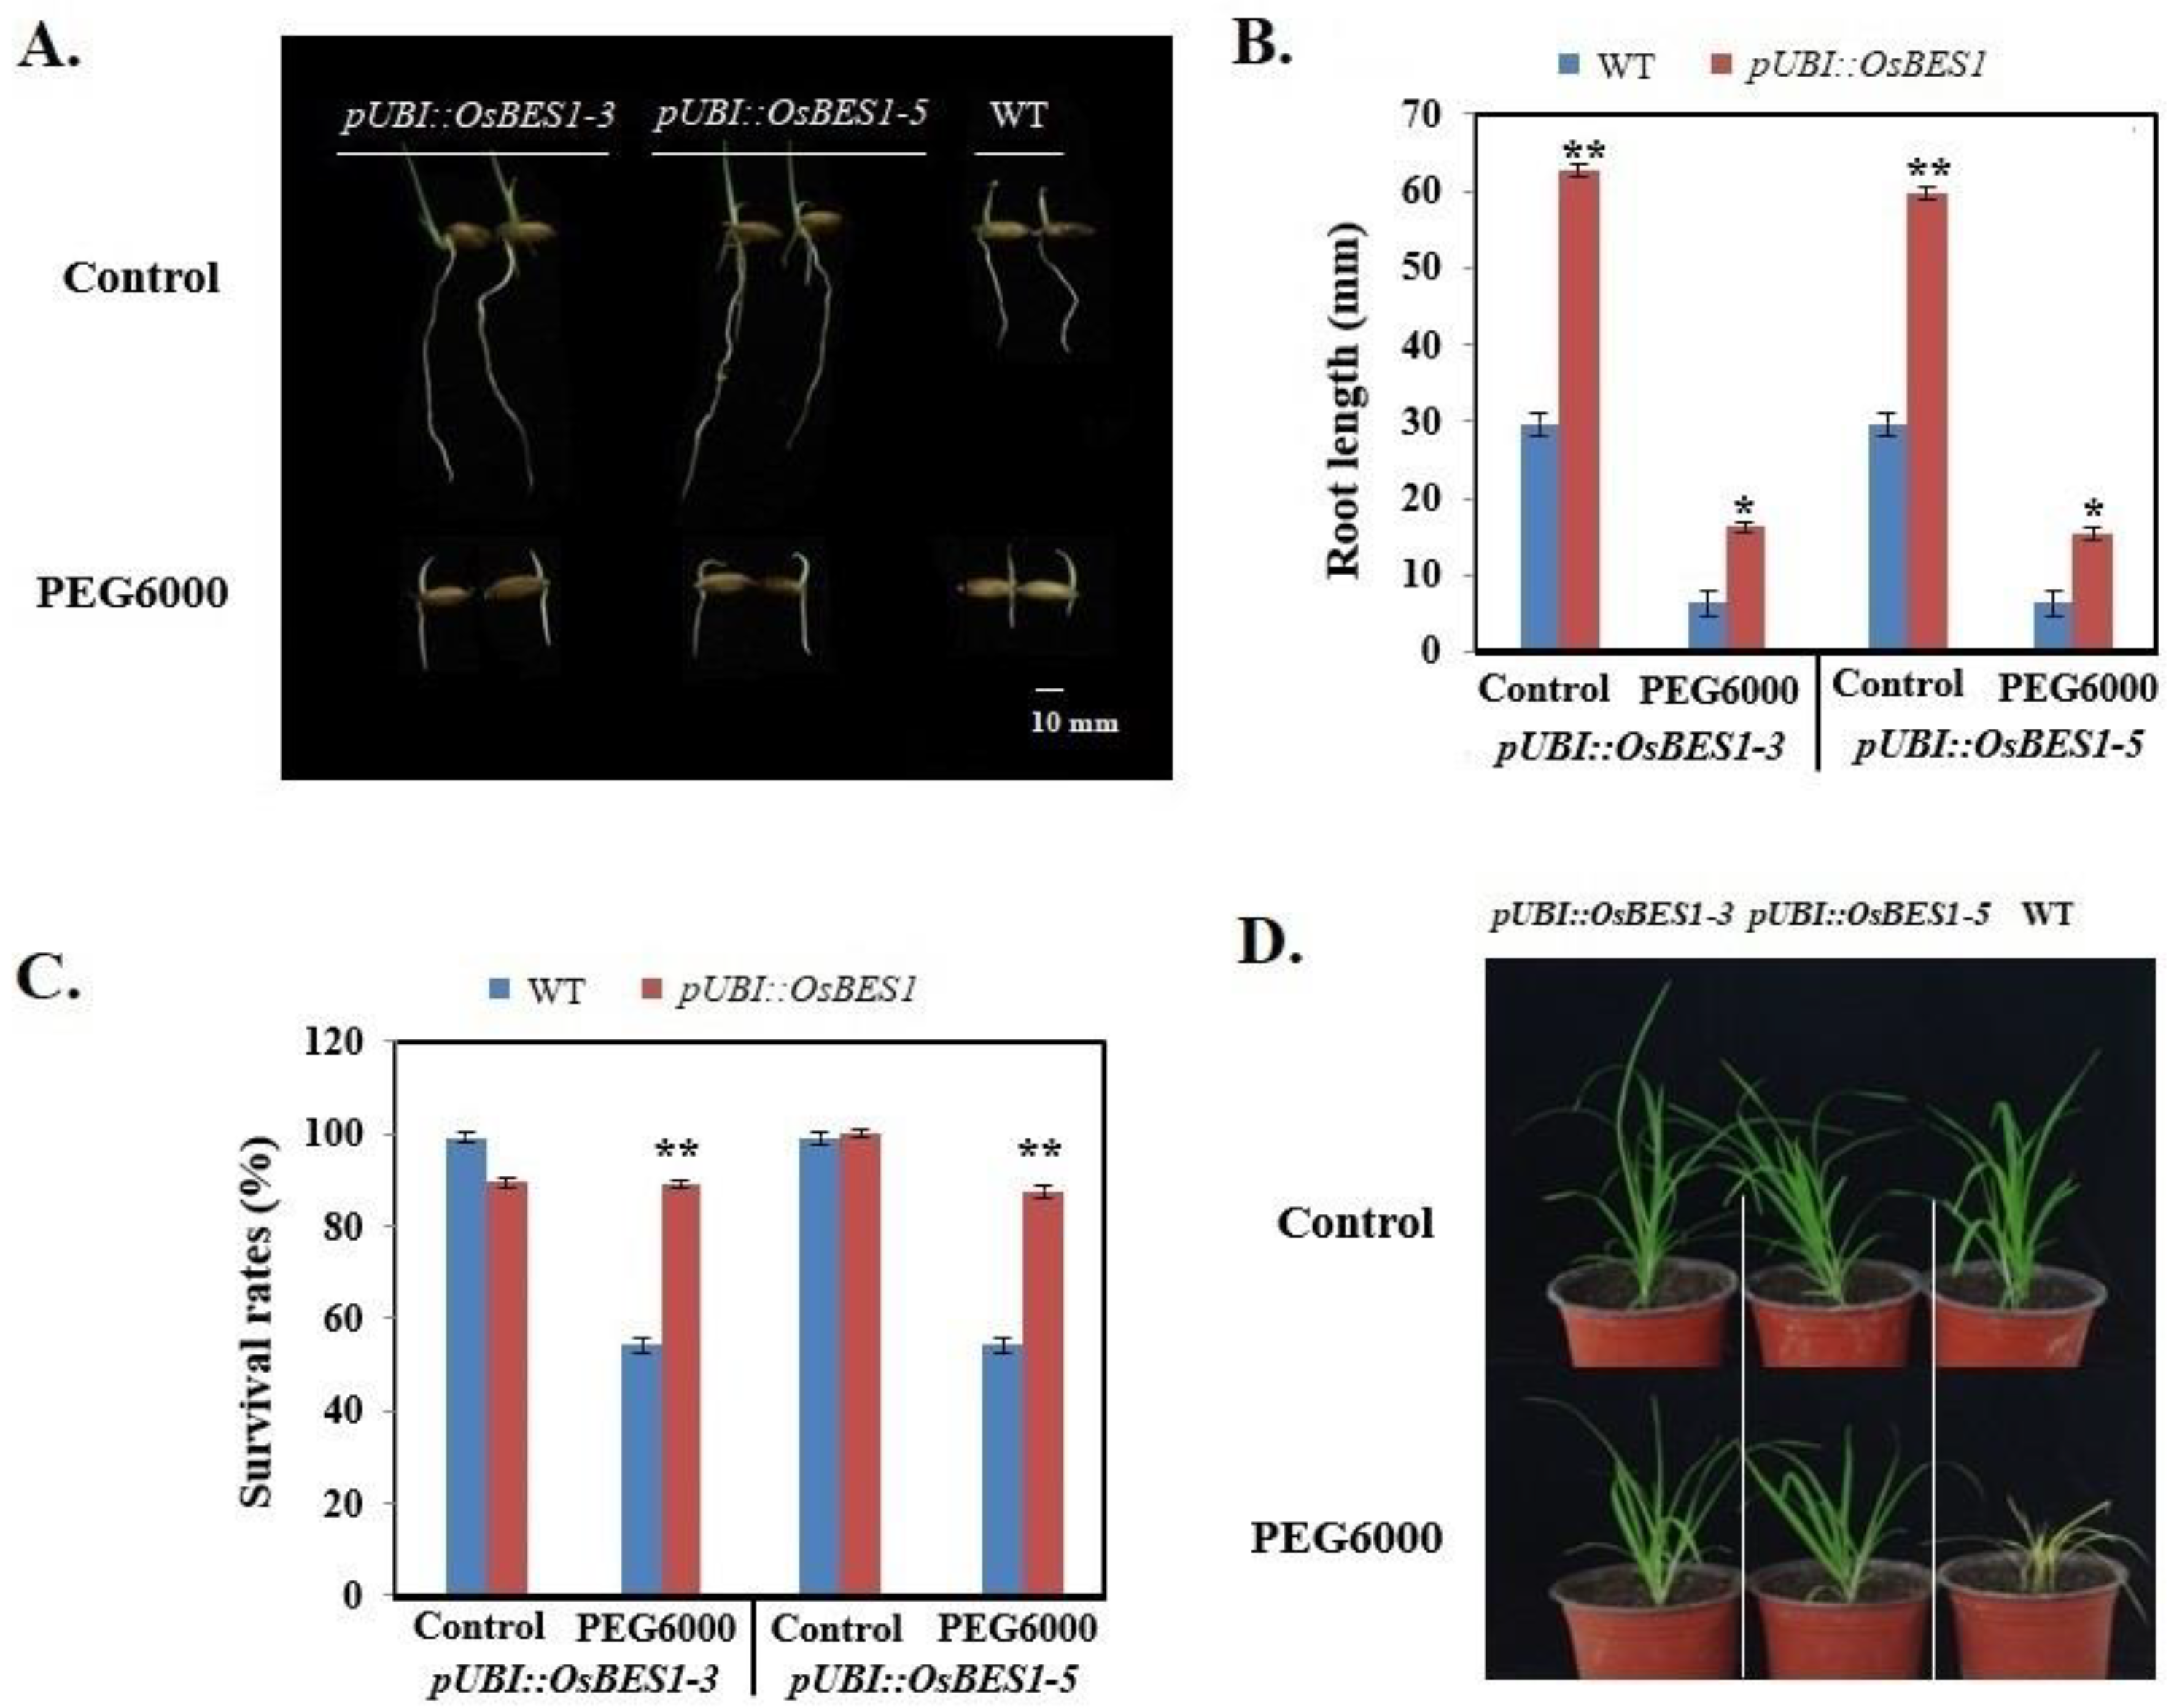
2.6. Functional Verification of Transgenic Plants

Both OsBES1-3 and OsBES1-5 showed the response against drought both in shoots and roots. To further examine their functions, transgenic rice overexpressing these two genes (pUBI::OsBES1-3 and pUBI::OsBES1-5) were generated for the stress tolerance test. To determine the gene’s effects on osmotic tolerance, the seeds of the transgenic rice overexpressing OsBES1-3 or OsBES1-5 rice, together with the WT control, were germinated on plates, followed by treatments with 20% PEG6000. All the transgenic plants were able to overcome the inhibition of PEG6000 to some extent, and showed significantly longer root lengths than WT plants did (Figure 5A,B). The seedlings were cultured in plastic pots for 4 weeks and then treated with 20% PEG6000. After the treatment for one week, most of the WT seedlings were wilting and yellow (Figure 5D), and the survival rate of the WT plants was only 54.3%, whereas the transgenic rice plants remained green and survived (Figure 5C).
To investigate GhBES1′s potential functional role in NaCl stress tolerance, GhBES1-4 was chosen to be overexpressed due to its relatively high expression level in developmental stages and during the abiotic stresses. When the seeds were treated with 175 mM NaCl for about ten days, transgenic GhBES1-4 Arabidopsis could grow and form roots normally, in sharp contrast to WT that barely grew with only a few seedlings having short roots (Figure 6A). Under salt stress, WT and GhBES1-4(OE) showed a significant difference in survival rate (Figure 6B). As shown in Figure 6C, the fully grown transgenic plants also displayed considerable resistance to salt stress relative to WT.
GhBES1-4 was also transiently expressed in N. benthamiana (Nicotiana benthamiana) leaf, which displayed a higher resistance to salt stress than the empty vector with the control (Figure S6A). Following the treatment with 250 mM NaCl for about ten days, the leaves of transiently expressing GhBES1-4 maintained a significantly higher level of chlorophyll (88.5%) as compared to the control (Figure S6B). In contrast, the control leaves contained less chlorophyll under the salinity treatment, with 58.7% of its water control.

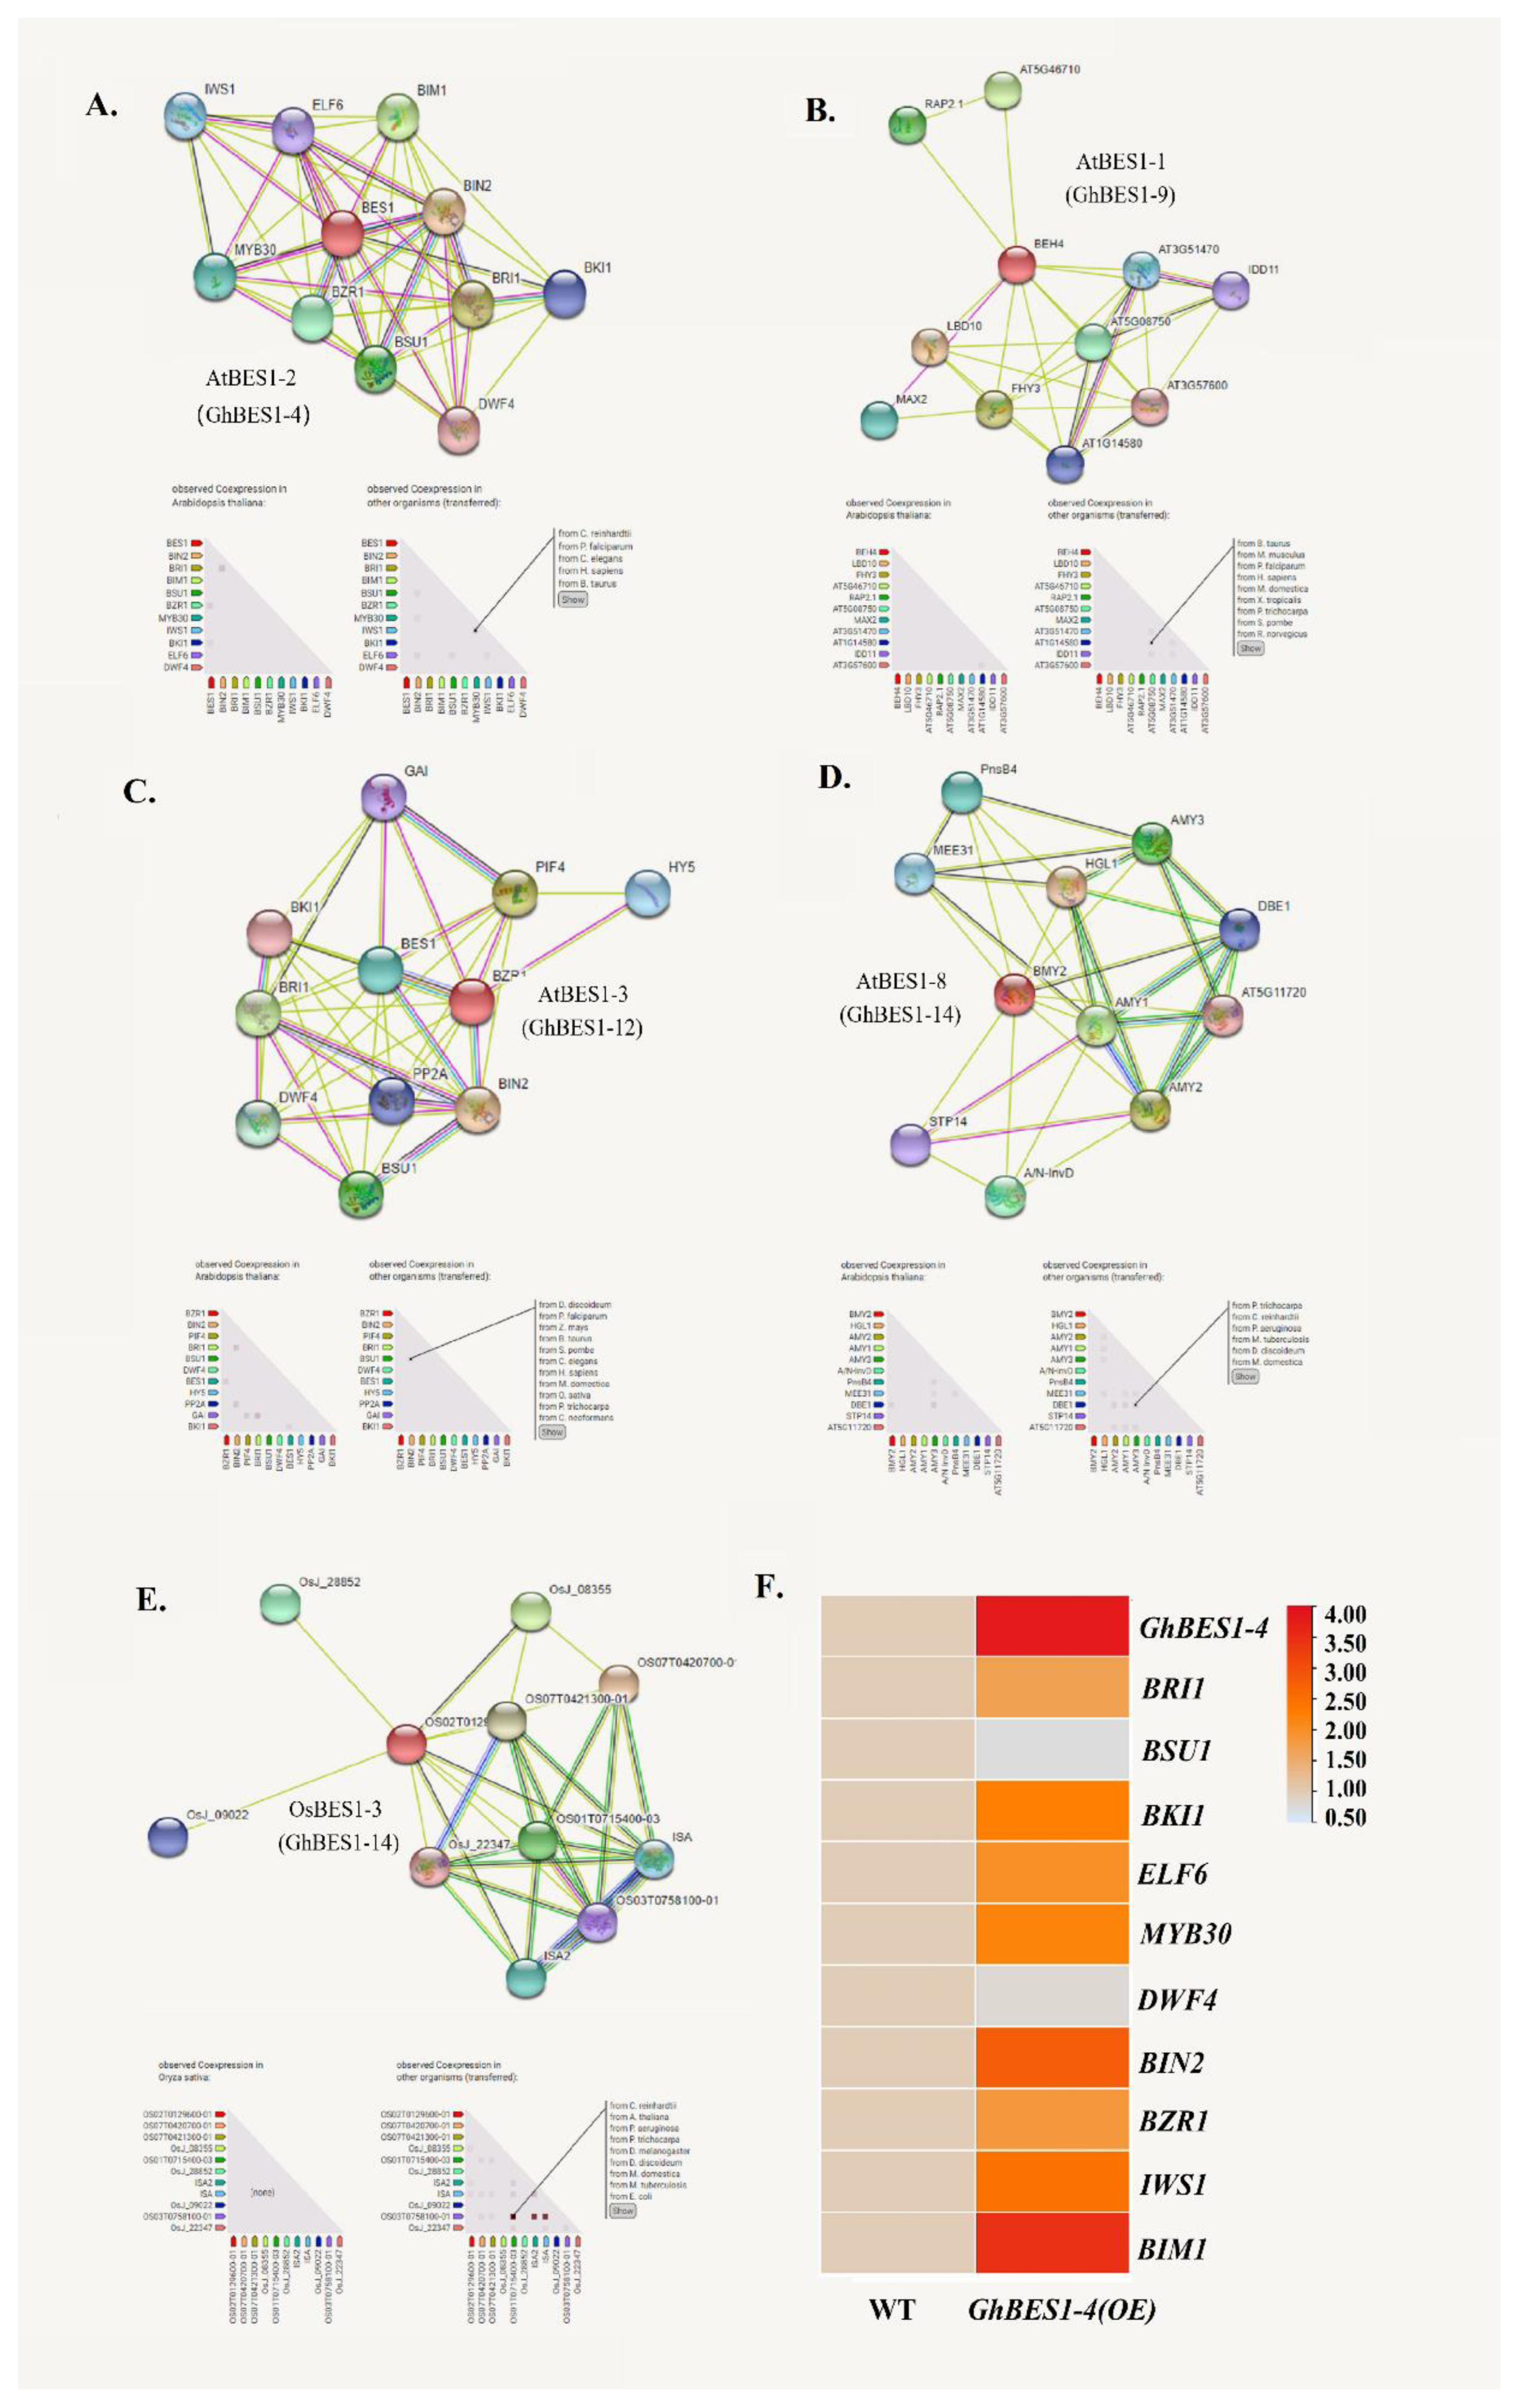
2.7. Construction of Protein Interaction Network and Gene Co-Expression

Investigation of the protein interaction networks is an effective way to understand protein interactions and regulatory relationships (Figure 7A–E). Four BES1 proteins in Arabidopsis (AtBES1-2, AtBES1-1, AtBES1-3, and AtBES1-8) and one BES1 protein in rice (OsBES1-3) were randomly selected to predict their interaction network. These BES1 proteins corresponded to the five BES1s in G. hirsutum (GhBES1-4, GhBES1-9, GhBES1-12, GhBES1-14, and GhBES1-20), all of which were found to interact with ten other proteins, as exemplified by the AtBES1-2 and AtBES1-3 that were interacting with DWF4, BZR1, BIN2, and BRI1.
In cotton leaves, GhBES1-4 exhibited a significant up-regulation under salt stress based on iTRAQ data. The absolute fold-change of ’Salt/CK’ was 1.25. The value of ’Ratio Salt/CK’ of the three replicates was 1.180|1.464|1.103. The expression patterns of the ten interactive genes were analyzed in transgenic Arabidopsis overexpressing GhBES1-4 under the treatment with 175 mM NaCl. A total of eight genes including IWS1 (Interacts with SUPT6H 1), ELF6 (Early Flowering 6), BIM1, MYB30, BZR1, BIN2, BRI1, and BKI1 showed up-regulated expressions in transgenic plants relative to WT plants, whereas the other two genes, i.e., BSU1 and DWF4, were down-regulated (Figure 7F).

3. Discussion

The plant-specific transcription factors BES1 displayed key roles in the BR signaling network, but a systematic study in plantae is clearly lacking [18]. Overall, 135 BES1 genes were obtained from the representing nine major plant lineages (Table 1), while it was not identified in the Cyanophora paradoxa, Galdieria sulphuraria, Cyanidioschyzon merolae, and 7 Chlorophytes species. Amborellales and Nymphaeales belong to the so-called ANA-grade of angiosperms, which are extant representatives of lineages that diverged the earliest from the lineage leading to the extant angiosperms. Both A. trichopoda and N. colorata have nine BES1 genes, without a difference in the average number of BES1 genes from monocots and eudicots. These results suggested that there was no spread presence of BES1 genes within the early-diverging flowering plants than previously anticipated. The variation in the average number of BES1 genes among the nine main plant families manifests that the genetic mechanism underlying the evolution of these genes was distinct in each group. Although the number of BES1 genes in G. hirsutum was twice as many as in its two diploid progenitors, G. arboreum and G. raimondii, not every GaBES1 and GrBES1 is associated with the GhBES1 gene. This indicated that the number of GhBES1 genes does not simply reflect the expansion with their shared genome duplication event (Figure 2).
The BES1 gene family could be separated into five groups numbered from Sub I to V in accordance with the topology and the deep duplication nodes (Figure 1). Sub II and III contain all BES1 proteins from Bryophytes and Lycophytes, indicating that these two subfamilies, especially Sub II, are the oldest of the five subfamilies. The BES1 family members from the higher plant species were clustered into other subfamilies, demonstrating that the BES1 family initiated after the separation of algae and the ancestors of land plants. BES1 genes from the same lineage inclined to be grouped together in the phylogenetic tree, suggesting their common ancestry and duplications after speciation. Genetic structure analysis showed that most of the members have an intron except Sub I. In addition, tandem repeat events cause the increase in the number of introns and the generation of new genes [19]. Sub I has more introns compared to others, suggesting functional divergence.
The upstream sequences of the BES1 gene harbors a variety of cis-acting elements (Figure S3), including stress, hormone, and light response elements, indicating its potential involvements in a variety of stress and hormone response processes as a mechanism in promoting plant growth and development and stress tolerance. During the plant life cycle or in different plant tissues, the expressions of BES1 genes show different patterns even in the same subfamilies. In Sub V, the BES1 genes in rice (OsBES1-2 and OsBES1-4) showed consistent expression throughout the plant phases. In contrast, AtBES1 genes in Sub V were only abundantly expressed at certain stages (Figure 3A,B). In Sub IV, GhBES1-4 and GhBES1-12 were constitutively expressed at very high levels in all tissues tested, indicating the significant regulatory roles they may play during multiple developmental stages. GhBES1-2 and -12, also belonging to Sub IV, were highly expressed only in the ovule and fiber (Figure 3C). A number of recent studies have demonstrated that the BES1 TFs regulate plant architecture, root development, and promotion of cell elongation [20,21]. Here, the OsBES1-1, -2, -3, and -4 showed increased expression in the shoot, but decreased expression levels in the root under heat stress. In addition, OsBES1s exhibited upregulated levels in the shoot but no changes in the root under salt stress. It suggested that the expression of OsBES1s was probably tissue-specific or abiotic stress-response-specific. The mRNA of GhBES1-4 and -12 was highly expressed in roots, suggesting that they may also play key roles in cotton root development. The complete molecular mechanism and functions of these genes in root development required further exploration. The GhBES1 family genes exhibited expression variations in response to one or more stress treatments. The transcript levels of GhBES1-1, -4, and -12 were highly influenced by cold, hot, PEG, and salt stress compared to other BES1 genes in cotton (Figure 4C). The overexpression of GhBES1-4 in transgenic Arabidopsis and transient expression in N. benthamiana also showed a better growth state than WT under salt stress (Figure 6 and Figure S6). The GhBES1-4 had a closer genetic relationship with AtBES1-2 and AtBES1-3. Studies showed that AtBES1-2 and AtBES1-3 each had three homologous genes in Chinese cabbage [4,22], and their homologous genes were up-regulated under cold, heat, and PEG stress, with the highest expression level shown upon a treatment period of 12 h. Similarly enhanced expression patterns were observed in Arabidopsis, rice, and cotton, inferring their conserved roles in stress tolerance in different plant species.
The protein interaction network reveals the regulatory relationships between proteins (Figure 7). Most of the proteins in the BES1 protein interaction network are related to BR metabolic pathways. For example, DWARF4 and CPD (CONSTITUTIVE PHOTOMORPHOGENESIS AND DWARFISM) are considered to encode rate-limiting enzymes in the BR biosynthesis pathway [23,24], activation of BSU1 phosphatase, dephosphorylation and inactivation of BIN2 kinase, and accumulation of nonphosphorylated transcription factor BZR1 in the nucleus. There are studies that have shown that DWF4 negatively regulates cold stress, and GSK1 and GSK2 can significantly improve the drought resistance of plants [25]. AtMYB30, encoding a R2R3-MYB TF, was known as a direct target of AtBES1 through microarray and chromatin immunoprecipitation experiments in Arabidopsis. The AtMYB30 protein binds to the promoter region of the BR target gene and unites with BES1 to adjust BR-prompted gene expression [26,27,28,29]. Under salt stress, the expression of the GhBES1-4 gene was upregulated in transgenic plants, and so were its interaction proteins, such as BIN2, BIM1, BRI1, BKI1, and ELF6, demonstrating their potential functional role in salt stress resistance.

4. Materials and Methods

4.1. Sequence Retrieval and Gene Identification

The full-length sequences of AtBES1 proteins were used as a query. The genomic and protein sequences of 27 plants, representative of nine most important plant ancestries, were obtained from freely available databases Phytozome v12.0 (https://phytozome.jgi.doe.gov/, accessed on 2 March 2022) and Congenie (http://congenie.org/, accessed on 2 March 2022) (for the gymnosperm Picea sitchensis). They were downloaded as a local protein database in order to identify BES1 homologs. In addition, the BES1-specific domain (PF05687) was used in a BLAST search to the native protein databases. Then, an HMM search (Biosequence analysis using profile hidden Markov Models, https://www.ebi.ac.uk/Tools/hmmer/search/hmmsearch, accessed on 2 March 2022) was conducted with the default parameter and an e-value ≤1 × 10⁻⁵.

4.2. Bioinformatics and Protein Interaction Analysis

The phylogenetic trees were constructed from the BES1 proteins that had been retrieved using MEGAX (Molecular Evolutionary Genetics Analysis Version X, http://www.megasoftware.net, accessed on 2 March 2022). The sequence logos were analyzed by the online website MEME (Multiple Em for Motif Elicitation, https://meme-suite.org/meme/tools/meme, accessed on 2 March 2022). The gene structure of all BES1 family genes was analyzed by the GSDS (Gene Structure Display Server 2.0) [30]. Collinearity analysis was performed by TBtools v1.098696 (https://github.com/CJ-Chen/TBtools, accessed on 2 March 2022). A DNA sequence of the length of 2000 bp upstream of the BES1 gene in Arabidopsis, rice, and cotton was extracted by TBtools, and analyzed on PlantCARE (Plant Cis-Acting Regulatory Element, http://bioinformatics.psb.ugent.be/webtools/plantcare/html/, accessed on 2 March 2022), then visualized by TBtools. STRING (Version 11.0) [31] was used to construct a protein interaction network of Arabidopsis and the rice BES1 protein. The physicochemical characteristics of BES1 proteins were analyzed by Protscale, SignalP-5.0, and Phyre2 (Protein Homology/analogy Recognition Engine V 2.0).

4.3. Expression Data, Plant Materials, and Abiotic Stress Treatment

The expression profiles of AtBES1 and OsBES1 family genes in different developmental stages and tissues were determined, according to the transcribed records in Genevestigator and the Arabidopsis and rice eFP browsers in the Bio-Analytic Resource (http://bar.utoronto.ca/, accessed on 2 March 2022) database [32]. Expression data in nine tissues (root, stem, leaf, torus, stamen, pistil, calycle, fiber, and ovule), as well as under different abiotic stresses (PEG, salt, high, and low temperature), for GhBES1 genes were obtained from transcriptome data. RNA-seq data were obtained from NCBI Sequence Read Archive (SRA: PRJNA248163). Based on iTRAQ data, proteomic changes of GhBES1 in cotton leaves were analyzed under salt stress. The data were deposited into CNGB Sequence Archive (CNSA) of the China National GeneBank DataBase (CNGBdb) with accession number CNP0002089 (https://db.cngb.org/, accessed on 2 March 2022).
The seedlings of Arabidopsis wild type (Col-0) were grown in a growth room under optimum growth conditions (16 h light and 8 h dark) at 20 °C for 30 days. The seedlings of japonica rice cultivar (Oryza sativa Nipponbare) were germinated at 28 °C for 72 h prior to moving to a growth room under 16 h light and 8 h dark at 28 °C for 16 days. The seedlings of upland cotton cv TM-1 were grown in an incubator under a 14 h light/10 h dark cycle at 28 °C until the three-leaf stage. All the plant seedlings were exposed to 4 °C for a period of 12 h as cold treatment. For heat treatment, Arabidopsis seedlings were exposed to 30 °C for a period of 12 h, whereas rice and cotton were grown at 40 °C for 12 h. Furthermore, the plant roots were immersed in the 175 mM NaCl and 20% PEG6000 solution for 12 h for salt and osmotic stress treatment, respectively. After treatments, all the sample plants were rapidly sampled and frozen in liquid nitrogen. Samples were stored at −80 °C for RNA extraction.
RNA was excavated by using the RNA Miniprep Kit (Axygen® Corning Inc., Tewksbury, MA, USA) following the manufacturer’s instructions. Quantitative real-time PCR (qRT-PCR) was performed by using SYBR® Premix Ex Taq™ II (TaKaRa, Dalian, China) on an Eppendorf Master cycler® eprealplex (Eppendorf, Hamburg, Germany) system in order to examine the BES1 expression levels. Atactin, Osactin, and Ghactin were selected as the internal controls. Three biological replicates, each of which contained three mechanical replications, were used.

4.4. Functional Verification of Transgenic Plants

In order to obtain transgenic rice plants, the full-length ORF of OsBES1-3 or OsBES1-5 was ligated into the KpnI and SacI sites of the plant expression vector pUN1301 vector (BioVector, Beijing, China) under the control of the ubiquitin promoter [33]. The recombinant plasmids were electroporated into Agrobacterium tumefaciens strain EHA105 cells and then introduced into rice embryonic Calli.
PrimerX was used to design primers to modify the cDNA of GhBES1-4, and the mutated cDNA sequence was incorporated into the pBI121 vector, behind the CaMv 35S promoter. The constructed plasmid containing the mutated GhBES1-4 was introduced into the A. tumefaciens strain (GV3101), which was used to generate transgenic plants [34]. The seeds of the T3 Arabidopsis plants expressing GhBES1-4, together with those of the wild-type control, were germinated in petri dishes containing 1/2 MS medium supplemented with 175 mM NaCl and vernalized at 4 °C for 48 h, prior to maintenance at 28 °C.
To elucidate the biological function of GhBES1-4, it was transiently expressed in N. benthamiana using the tobravirus pea early browning virus (PEBV)-based pCAPE expression system, together with associate and control plasmid pCAPE1 and pCAPE2. The vector constructions and A. tumefaciens transient transformation were performed as previously described [35]. After about three weeks of PEBV inoculation, samples of young N. benthamiana leaves were collected and floated on a 250 mM NaCl solution or water (control). The chlorophyll level of the N. benthamiana leaves was analyzed ten days after NaCl stress treatments, as described by Shabala [36].

5. Conclusions

In this study, we identified BES1 in nine different plant lineages and performed functional characterization. The current BES1 gene family, expanded mostly in angiosperm, seems to be a common ancestor of land plants. The spatial expression pattern analysis of the BES1 genes, together with the expression patterns under different abiotic stresses, provided a basic resource for the examination of the molecular regulation of plant development and stress tolerance. As the conservation of biological functionality might be of ancestral origin, the functional conservation of the BES1 gene family among different land plant species warrants a broad investigation in the future.

Supplementary Materials

The following supporting information can be downloaded at: https://www.mdpi.com/article/10.3390/ijms23084242/s1.

Author Contributions

Conceptualization, Methodology, Writing—Original Draft Preparation, and Editing, Z.S.; Software, Data Curation, Editing, X.L.; Visualization and Investigation, X.C.; Visualization and Investigation, Y.L.; Visualization, Investigation, and Supervision, W.Z. and H.L.; Writing—Reviewing and Editing, W.Y. and Z.Y. All authors have read and agreed to the published version of the manuscript.

Funding

This work was supported by the Key Research Development and Promote Program of Henan province (202102110153), the National Natural Science Foundation of Xinjiang (2022D01A159), and the National Natural Science Foundation of Henan (222300420588).

Institutional Review Board Statement

Not applicable.

Informed Consent Statement

Not applicable.

Data Availability Statement

Data is contained within the article or supplementary material.

Conflicts of Interest

The authors declare that the research was conducted in the absence of any commercial or financial relationships that could be construed as a potential conflict of interest.

References

  1. Yin, Y.; Wang, Z.-Y.; Mora-Garcia, S.; Li, J.; Yoshida, S.; Asami, T.; Chory, J. BES1 Accumulates in the Nucleus in Response to Brassinosteroids to Regulate Gene Expression and Promote Stem Elongation Extensive Loss-of-Function Genetic Screens for BR-Insensitive Dwarf Mutants Have Identified Mutations; Elsevier: Amsterdam, The Netherlands, 2002; Volume 109. [Google Scholar]
  2. Kono, A.; Yin, Y. Updates on BES1/BZR1 regulatory networks coordinating plant growth and stress responses. Front. Plant Sci. 2020, 11, 617162. [Google Scholar] [CrossRef] [PubMed]
  3. Zhao, J.; Peng, P.; Schmitz, R.J.; Decker, A.D.; Tax, F.E.; Li, J. Two putative BIN2 substrates are nuclear components of brassinosteroid signaling. Plant Physiol. 2002, 130, 1221–1229. [Google Scholar] [CrossRef] [PubMed] [Green Version]
  4. Wang, Z.; Tang, J.; Hu, R.; Wu, P.; Hou, X.-L.; Song, X.-M.; Xiong, A.-S. Genome-wide analysis of the BES1 transcription factor family in Chinese cabbage (Brassica rapa ssp. pekinensis). Plant Growth Regul. 2016, 80, 291–301. [Google Scholar] [CrossRef]
  5. Zhou, Y.; Zhang, Z.T.; Li, M.; Wei, X.Z.; Li, X.J.; Li, B.Y.; Li, X.-B. Cotton (Gossypium hirsutum) 14-3-3 proteins participate in regulation of fibre initiation and elongation by modulating brassinosteroid signalling. Plant Biotechnol. J. 2015, 13, 269–280. [Google Scholar] [CrossRef] [PubMed]
  6. Lian, H. Phyb interacts with BES1 to regulate brassinosteroid signaling in Arabidopsis. In Phyb-BES1 Interaction Represses BR Signaling Pathway N.D.; Oxford Academic: Oxford, UK, 2019. [Google Scholar] [CrossRef]
  7. Zhang, D.W. Sumoylation of BRI1-EMS-SUPPRESSOR 1 (BES1) by the SUMO E3 ligase SIZ1 negatively regulates brassinosteroids signaling in Arabidopsis thaliana. In Sumoylation Negatively Regulates BR Signaling N.D.; Oxford Academic: Oxford, UK, 2019. [Google Scholar] [CrossRef]
  8. Ruan, J.; Chen, H.; Zhu, T.; Yu, Y.; Lei, Y.; Yuan, L.; Liu, J.; Wang, Z.-Y.; Kuang, J.-F.; Lu, W.-J.; et al. Brassinosteroids repress the seed maturation program during the seed-to-seedling transition. Plant Physiol. 2021, 186, 534–548. [Google Scholar] [CrossRef] [PubMed]
  9. Lee, H.G.; Won, J.H.; Choi, Y.R.; Lee, K.; Seo, P.J. Brassinosteroids regulate circadian oscillation via the BES1/TPL-CCA1/LHY module in Arabidopsisthaliana. IScience 2020, 23, 101528. [Google Scholar] [CrossRef] [PubMed]
  10. Liu, X.; Zhao, C.; Gao, Y.; Xu, Y.; Wang, S.; Li, C.; Xie, Y.; Chen, P.; Yang, P.; Yuan, L.; et al. A multifaceted module of BRI1 Ethylmethane Sulfonate Supressor1 (BES1)-MYB88 in growth and stress tolerance of apple. Plant Physiol. 2021, 185, 1903–1923. [Google Scholar] [CrossRef] [PubMed]
  11. Zhao, X.; Dou, L.; Gong, Z.; Wang, X.; Mao, T. BES1 hinders ABSCISIC Acid Insensitive5 and promotes seed germination in Arabidopsis. New Phytol. 2019, 221, 908–918. [Google Scholar] [CrossRef] [Green Version]
  12. Sun, F.; Ding, L.; Feng, W.; Cao, Y.; Lu, F.; Yang, Q.; Li, W.; Lu, Y.; Shabek, N.; Fu, F.; et al. Maize transcription factor ZmBES1/BZR1-5 positively regulates kernel size. J. Exp. Bot. 2021, 72, 1714–1726. [Google Scholar] [CrossRef]
  13. Xie, Z.; Nolan, T.; Jiang, H.; Tang, B.; Zhang, M.; Li, Z.; Yin, Y. The AP2/ERF transcription factor TINY modulates brassinosteroid-regulated plant growth and drought responses in arabidopsis. Plant Cell 2019, 31, 1788–1806. [Google Scholar] [CrossRef] [Green Version]
  14. Hu, J.; Sun, S.; Wang, X. Regulation of shoot branching by strigolactones and brassinosteroids: Conserved and specific functions of Arabidopsis BES1 and rice BZR1. Mol. Plant 2020, 13, 808–810. [Google Scholar] [CrossRef] [PubMed]
  15. Cao, X.; Khaliq, A.; Lu, S.; Xie, M.; Ma, Z.; Mao, J.; Chen, B. Genome-wide identification and characterization of the BES1 gene family in apple (Malus domestica). Plant Biol. 2020, 22, 723–733. [Google Scholar] [CrossRef] [PubMed]
  16. Yu, H.Q.; Sun, F.A.; Feng, W.Q.; Lu, F.Z.; Li, W.C.; Fu, F.L. The BES1/BZR1 transcription factors regulate growth, development and stress resistance in plants. Yi Chuan Hered. 2019, 41, 206–214. [Google Scholar] [CrossRef]
  17. Song, X.; Ma, X.; Li, C.; Hu, J.; Yang, Q.; Wang, T.; Wang, L.; Wang, J.; Guo, D.; Ge, W.; et al. Comprehensive analyses of the BES1 gene family in Brassica napus and examination of their evolutionary pattern in representative species. BMC Genom. 2018, 19, 346. [Google Scholar] [CrossRef]
  18. Wang, Z.Y.; Bai, M.Y.; Oh, E.; Zhu, J.Y. Brassinosteroid signaling network and regulation of photomorphogenesis. Annu. Rev. Genet. 2012, 46, 701–724. [Google Scholar] [CrossRef]
  19. Iwamoto, M.; Maekawa, M.; Saito, A.; Higo, H.; Higo, K. Evolutionary relationship of plant catalase genes inferred from exon-intron structures: Isozyme divergence after the separation of monocots and dicots. Theor. Appl. Genet. 1998, 97, 9–19. [Google Scholar] [CrossRef]
  20. Lv, B.; Tian, H.; Zhang, F.; Liu, J.; Lu, S.; Bai, M.; Li, C.; Ding, Z. Brassinosteroids regulate root growth by controlling reactive oxygen species homeostasis and dual effect on ethylene synthesis in Arabidopsis. PLoS Genet. 2018, 14, e1007144. [Google Scholar] [CrossRef]
  21. Martins, S.; Montiel-Jorda, A.; Cayrel, A.; Huguet, S.; Roux, C.P.L.; Ljung, K.; Vert, G. Brassinosteroid signaling-dependent root responses to prolonged elevated ambient temperature. Nat. Commun. 2017, 8, 1–11. [Google Scholar] [CrossRef] [Green Version]
  22. Wang, Z.-Y.; Nakano, T.; Gendron, J.; He, J.; Chen, M.; Vafeados, D.; Yang, Y.; Fujioka, S.; Yoshida, S.; Asami, T.; et al. Nuclear-Localized BZR1 Mediates Brassinosteroid-Induced Growth and Feedback Suppression of Brassinosteroid Biosynthesis; dwarfism, Sterility, and Photomorphogenesis in the Dark (Li et al Molecular Genetic Studies of BR-Insensitive Mutants in Arabidopsis Have Led to the Identification of a Receptor Kinase, BRI1, as a Key Signaling Component in the BR. Vol. 2. Li and Chory; Elsevier: Amsterdam, The Netherlands, 2002. [Google Scholar]
  23. Mei, Y.; Yang, X.; Huang, C.; Zhang, X.; Zhou, X. Tomato leaf curl Yunnan virus-encoded C4 induces cell division through enhancing stability of Cyclin D 1.1 via impairing NbSKη-mediated phosphorylation in Nicotiana benthamiana. PLoS Pathog. 2018, 14, e1006789. [Google Scholar] [CrossRef] [Green Version]
  24. Tian, X.; Xuan, L.; Liu, B.; Hu, T.; Wang, C.; Wang, X. Effects of heterologous expression of Populus euphratica brassinosteroids biosynthetic enzyme genes CPD (PeCPD) and DWF4 (PeDWF4) on tissue dedifferentiation and growth of Arabidopsis thaliana seedlings. Plant Cell Tissue Organ Cult. 2018, 132, 111–121. [Google Scholar] [CrossRef]
  25. Sahni, S.; Prasad, B.D.; Liu, Q.; Grbic, V.; Sharpe, A.; Singh, S.P.; Krishna, P. Overexpression of the brassinosteroid biosynthetic gene DWF4 in Brassica napus simultaneously increases seed yield and stress tolerance. Sci. Rep. 2016, 6, 1–14. [Google Scholar] [CrossRef] [PubMed]
  26. Li, L.; Yu, X.; Thompson, A.; Guo, M.; Yoshida, S.; Asami, T.; Chory, J.; Yin, Y. Arabidopsis MYB30 is a direct target of BES1 and cooperates with BES1 to regulate brassinosteroid-induced gene expression. Plant J. Cell Mol. Biol. 2009, 58, 275–286. [Google Scholar] [CrossRef] [PubMed] [Green Version]
  27. Raffaele, S.; Vailleau, F.; Léger, A.; Joubès, J.; Miersch, O.; Huard, C.; Blée, E.; Mongrand, S.; Domergue, F.; Roby, D. A MYB transcription factor regulates very-long-chain fatty acid biosynthesis for activation of the hypersensitive cell death response in Arabidopsis. Plant Cell 2008, 20, 752–767. [Google Scholar] [CrossRef] [PubMed] [Green Version]
  28. Raffaele, S.; Rivas, S.; Roby, D. An essential role for salicylic acid in AtMYB30-mediated control of the hypersensitive cell death program in Arabidopsis. FEBS Lett. 2006, 580, 3498–3504. [Google Scholar] [CrossRef] [PubMed]
  29. Daniel, X.; Lacomme, C.; Morel, J.; Roby, D. A novel myb oncogene homologue in Arabidopsis thaliana related to hypersensitive cell death. Plant J. Cell Mol. Biol. 1999, 20, 57–66. [Google Scholar] [CrossRef] [Green Version]
  30. Hu, B.; Jin, J.; Guo, A.Y.; Zhang, H.; Luo, J.; Gao, G. GSDS 2.0: An upgraded gene feature visualization server. Bioinformatics 2015, 31, 1296–1297. [Google Scholar] [CrossRef] [Green Version]
  31. Szklarczyk, D.; Gable, A.L.; Lyon, D.; Junge, A.; Wyder, S.; Huerta-Cepas, J.; Simonovic, M.; Doncheva, N.T.; Morris, J.H.; Bork, P.; et al. STRING v11: Protein-protein association networks with increased coverage, supporting functional discovery in genome-wide experimental datasets. Nucleic Acids Res. 2019, 47, D607–D613. [Google Scholar] [CrossRef] [Green Version]
  32. Winter, D.; Vinegar, B.; Nahal, H.; Ammar, R.; Wilson, G.V.; Provart, N.J. An “electronic fluorescent pictograph” browser for exploring and analyzing large-scale biological data sets. PLoS ONE 2007, 2, e718. [Google Scholar] [CrossRef]
  33. Zhuang, X.; Jiang, J.; Li, J.; Ma, Q.; Xu, Y.; Xue, Y.; Xu, Z.; Chong, K. Over-expression of OsAGAP, an ARF-GAP, interferes with auxin influx, vesicle trafficking and root development. Plant J. 2006, 48, 581–591. [Google Scholar] [CrossRef]
  34. Clough, S.J.; Bent, A.F. Floral dip: A simplified method for Agrobacterium-mediated transformation of Arabidopsis thaliana. Plant J. 1998, 16, 735–743. [Google Scholar] [CrossRef] [Green Version]
  35. Liu, H.H.; Wang, Y.G.; Wang, S.P.; Li, H.J.; Xin, Q.G. Improved zinc tolerance of tobacco by transgenic expression of an allene oxide synthase gene from hexaploid wheat. Acta Physiol. Plant. 2014, 36, 2433–2440. [Google Scholar] [CrossRef]
  36. Shabala, S.N.; Shabala, S.I.; Martynenko, A.I.; Babourina, O.; Newman, I.A. Salinity effect on bioelectric activity, growth, Na+ accumulation and chlorophyll fluorescence of maize leaves: A comparative survey and prospects for screening. Aust. J. Plant Physiol. 1998, 25, 609–616. [Google Scholar] [CrossRef]
Figure 1. Phylogenetic tree, Ka/Ks values, and sequence features of BES1. (A) Phylogenetic tree of 135 BES1 genes from 17 species. The ML method was adopted to construct the trees. Bootstrapping was performed 1000 times to gain support values for each branch. (B) Prediction of duplicated gene pairs involved in different combinations from the table shows the Ka/Ks ratio statistics of different genes. (C) The weblogo represents motifs of BES1 protein sequences.
Ijms 23 04242 g001
Figure 2. Collinearity analysis of BES1 gene in Arabidopsis, rice, and cotton and among three cotton varieties (G. arboretum, G. raimondii, and G. hirsutum). The triangle represents the location of the BES1 genes on the chromosome.
Ijms 23 04242 g002
Figure 3. Heat map of AtBES1, OsBES1, and GhBES1 family genes expression in different growing stages or tissues. (A) Arabidopsis; (B) rice; (C) G. hirsutum.
Ijms 23 04242 g003
Figure 4. (A) Expression of BES1 family genes in Arabidopsis under different stresses. Numbers on the X-axis represent AtBES1s, and 1~8 represent AtBES1-1~AtBES1-8. (B) Expression of BES1 family genes in rice under different stresses. Numbers on the X-axis represent OsBES1s, and 1~6 represent OsBES1-1~OsBES1-6. (C) Expression of GhBES1 family genes under different stress treatments. (*: 0.01 < p < 0.05, **: p < 0.01; the resulting mean values were presented as relative units. Error bar represents SD).
Ijms 23 04242 g004
Figure 5. Functional verification in OsBES1 genes under drought stresses. (A) The root lengths condition of WT, pUBI::OsBES1-3, and pUBI::OsBES1-5 under control and drought stress. (B) Root length bar chart. ‘*’ indicates p < 0.05, ‘**’ indicates p < 0.01. Error bar represents SD. (C) The survival rate condition of WT, pUBI::OsBES1-3, and pUBI::OsBES1-5 under control and drought stress. ‘**’ indicates p < 0.01. Error bar represents SD. (D) WT, pUBI::OsBES1-3, and pUBI::OsBES1-5 under control and drought stress in pot.
Ijms 23 04242 g005
Figure 6. Functional verification of GhBES1-4 gene under salt stress. (A) Growth of GhBES1-4(OE) (the upper part) and WT (the lower half) seeds on 175 mM NaCl plates. (B) The survival rate of WT and GhBES1-4(OE) under 175 mM NaCl. ‘***’ indicates p < 0.005. (C) WT and GhBES1-4(OE) under salt stress.
Ijms 23 04242 g006
Figure 7. (AE) Protein interaction of AtBES1 and OsBES1; the two gene ids next to the central protein are Arabidopsis or rice BES1 ids and their homologous genes in G. hirsutum. (F) The expression pattern analysis of AtBES1-2 interacting protein.
Ijms 23 04242 g007
Table 1. Summary of the BES1 transcription factors of representative plant species.
LineageOrganismGenome Size (Mb)Gene MemberNumber/Mb
GlaucophytesCyanophora paradoxa0.1400
RhodophytesGaldieria sulphuraria13.700
Cyanidioschyzon merolae1600
ChlorophytesChlamydomonas reinhardtii12100
Volvox carteri12000
Coccomyxa subellipsoidea C-16948.800
Chlorella variabilis NC64A46.200
Micromonas pusilla RCC2992100
Ostreococcus lucimarinus13.200
Ostreococcus tauri1200
BryophytesPhyscomitrella patens51160.0059
Marchantia polymorpha216.240.003
LycophytesSelaginella moellendorffii10040.0400
GymnospermsPicea abies19,60050.003
Picea sitchensis550040.002
Bacal angiospermAmborella trichopoda699.290.005
Nymphaea colorata404.53390.005
MonocotsZea mays236580.0034
Sorghum bicolor732.280.0109
Oryza sativa43060.003
Brachypodium distachyum27280.004
EudicotsArabidopsis thaliana12580.0640
Aquilegia coerulea306.540.0131
Gossypium raimondii775110.0142
Mimulus guttatus43080.0186
Gossypium hirsutum2430220.0273
Gossypium arboretum752110.0160
Publisher’s Note: MDPI stays neutral with regard to jurisdictional claims in published maps and institutional affiliations.

