
Hypermethylation-Mediated Silencing of CIDEA, MAL and PCDH17 Tumour Suppressor Genes in Canine DLBCL: From Multi-Omics Analyses to Mechanistic Studies


 ,
,  , , , and
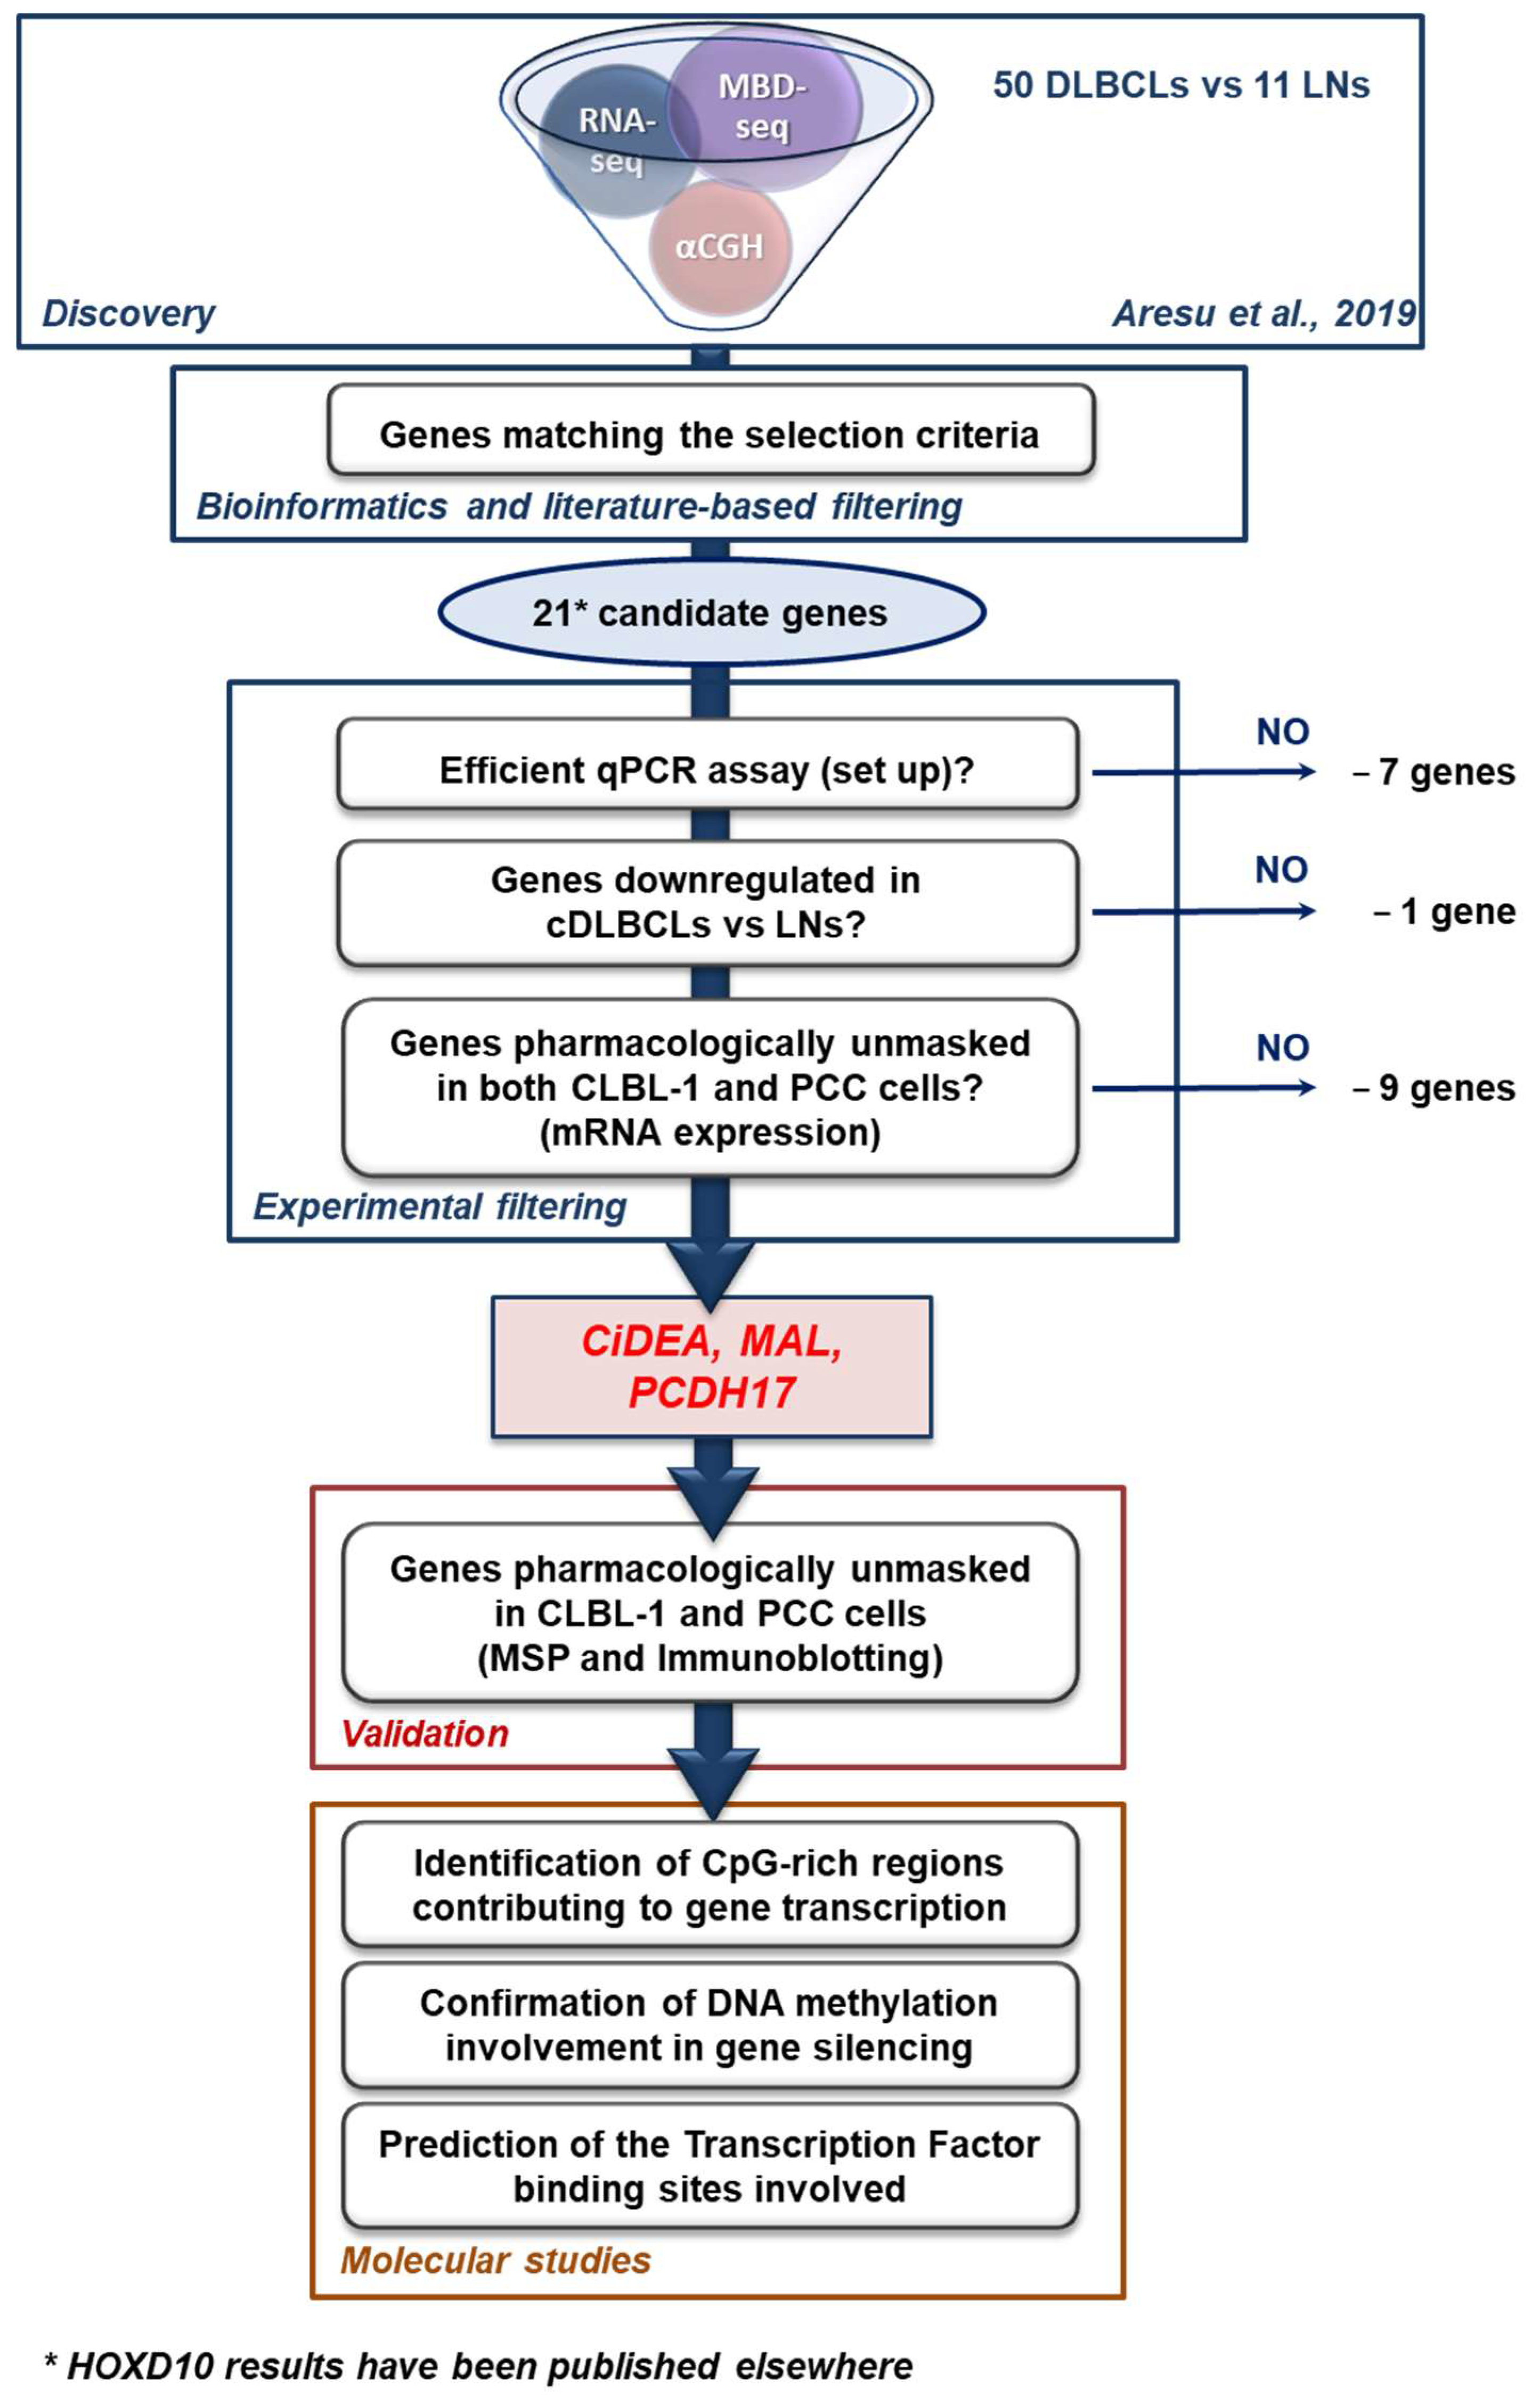
Abstract
1. Introduction
2. Results
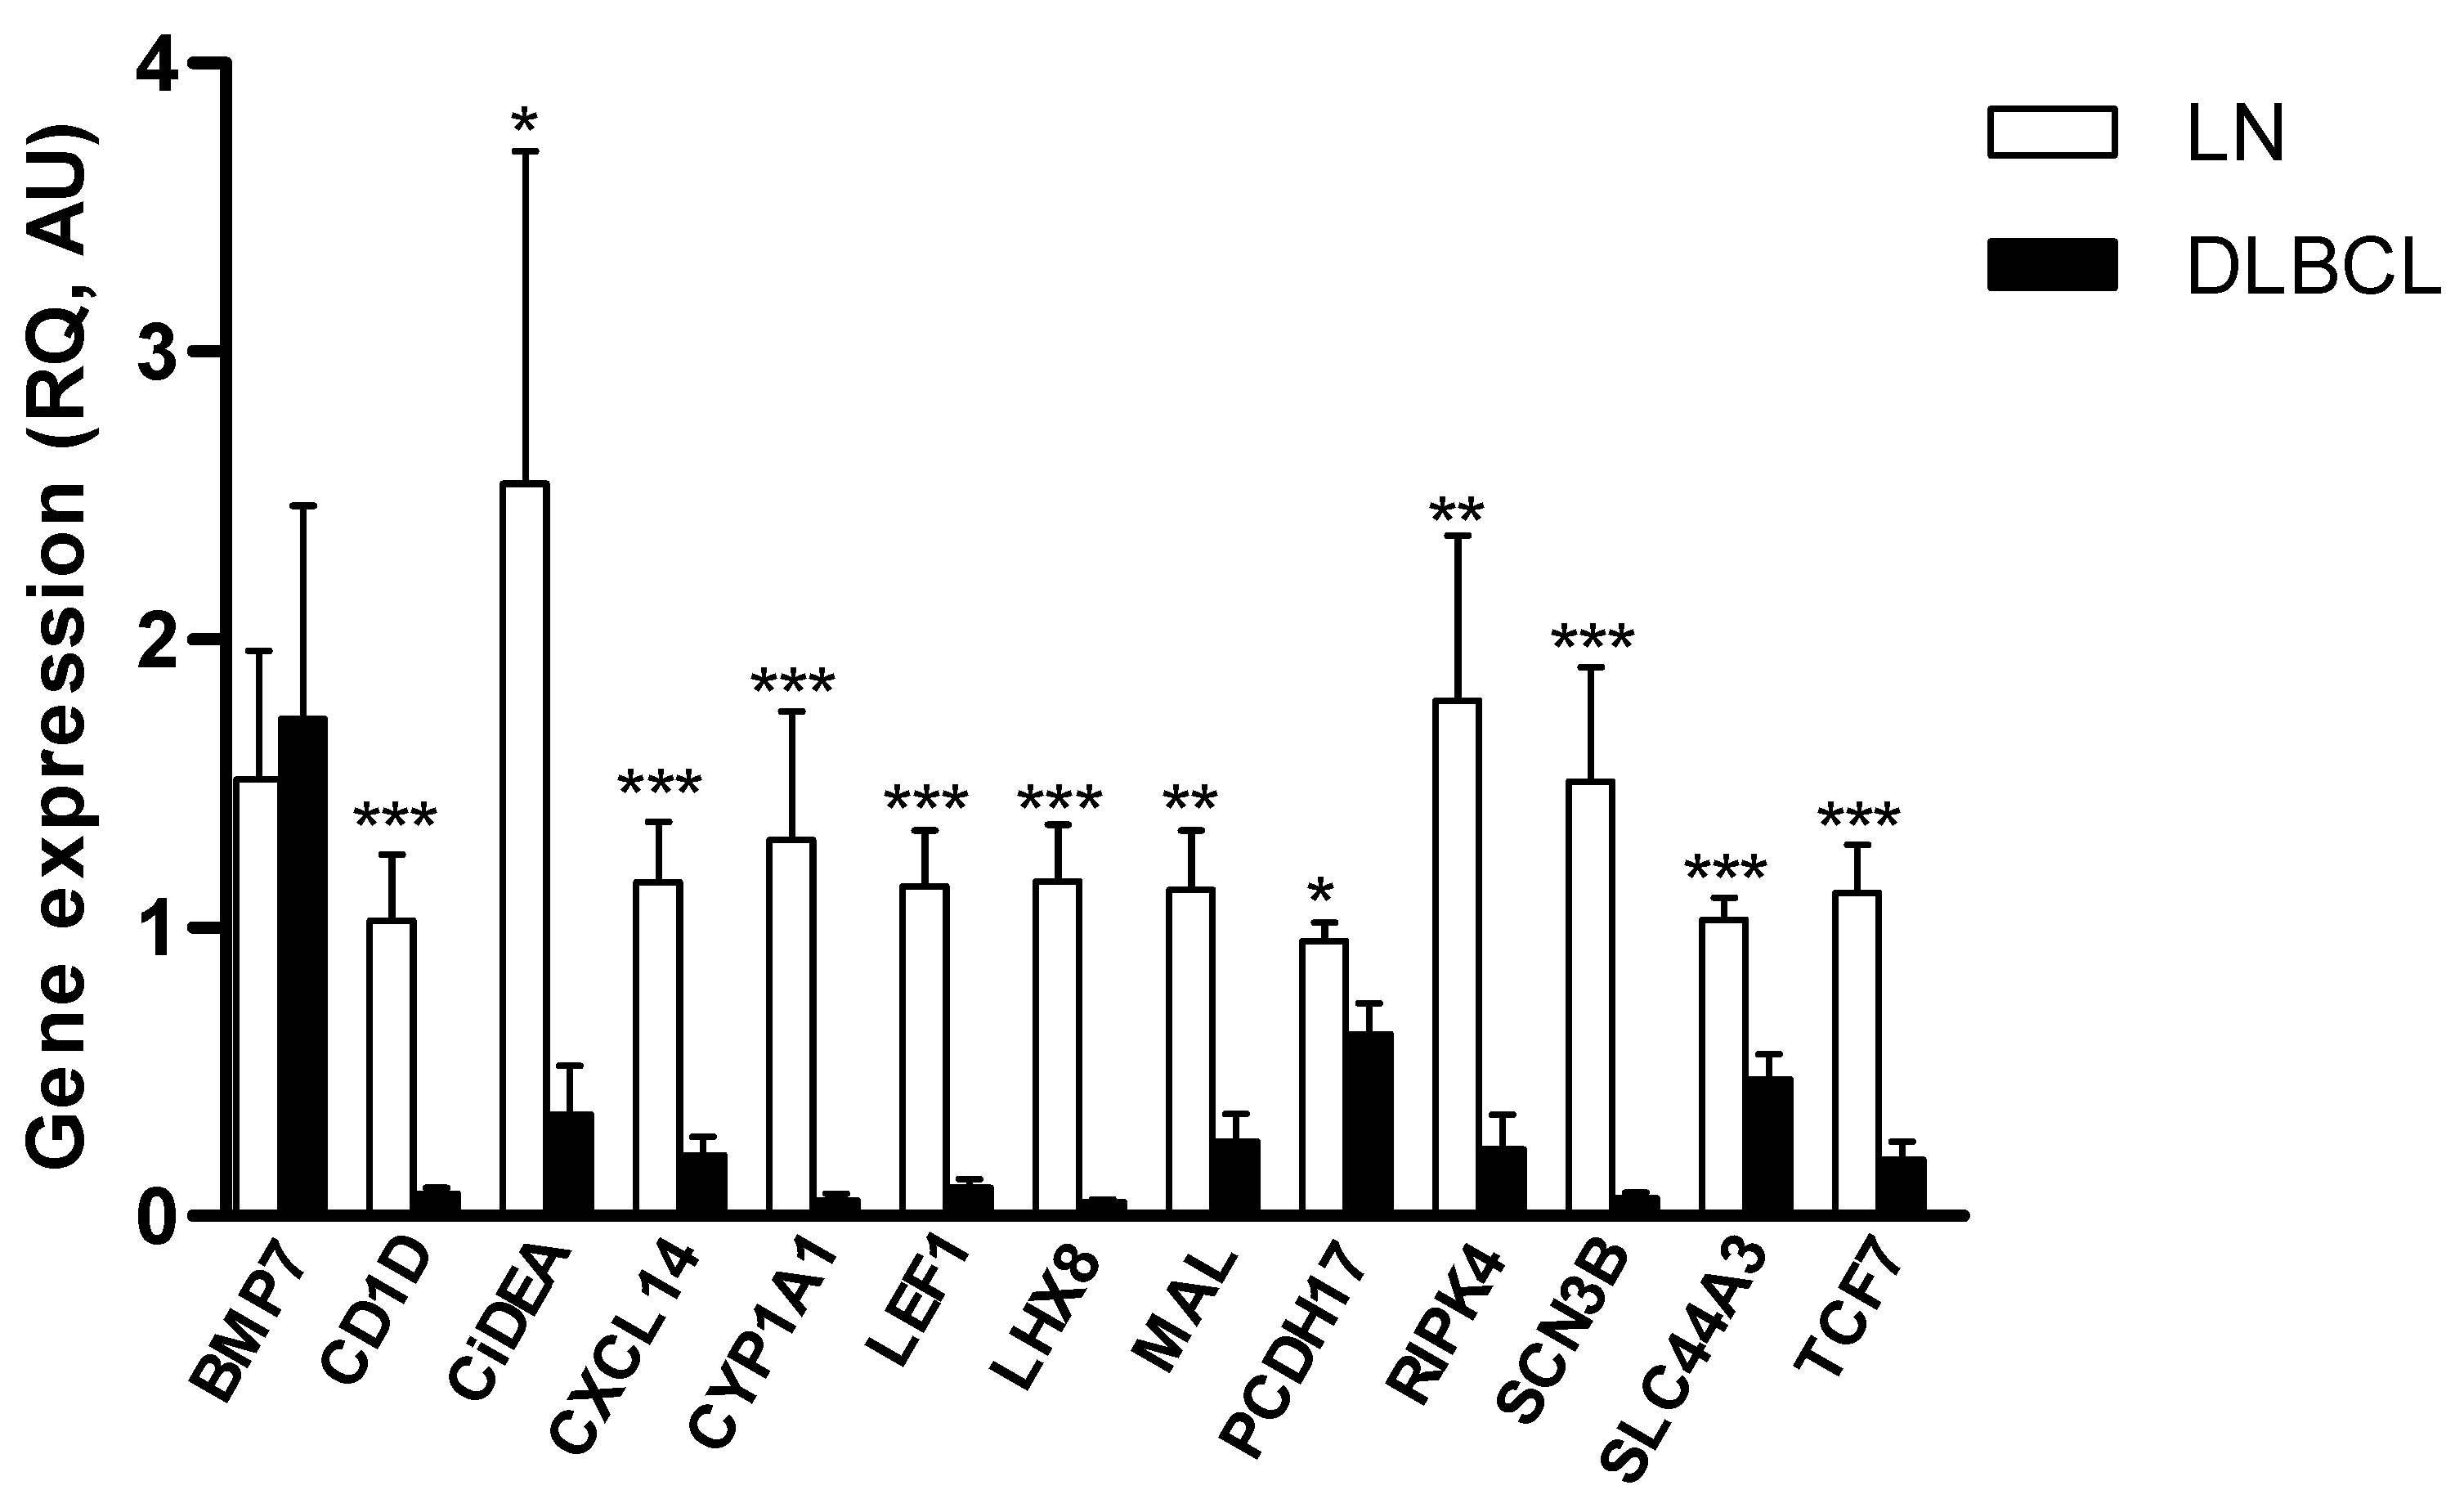
2.1. Identification of Putative TSGs Deregulated in cDLBCL
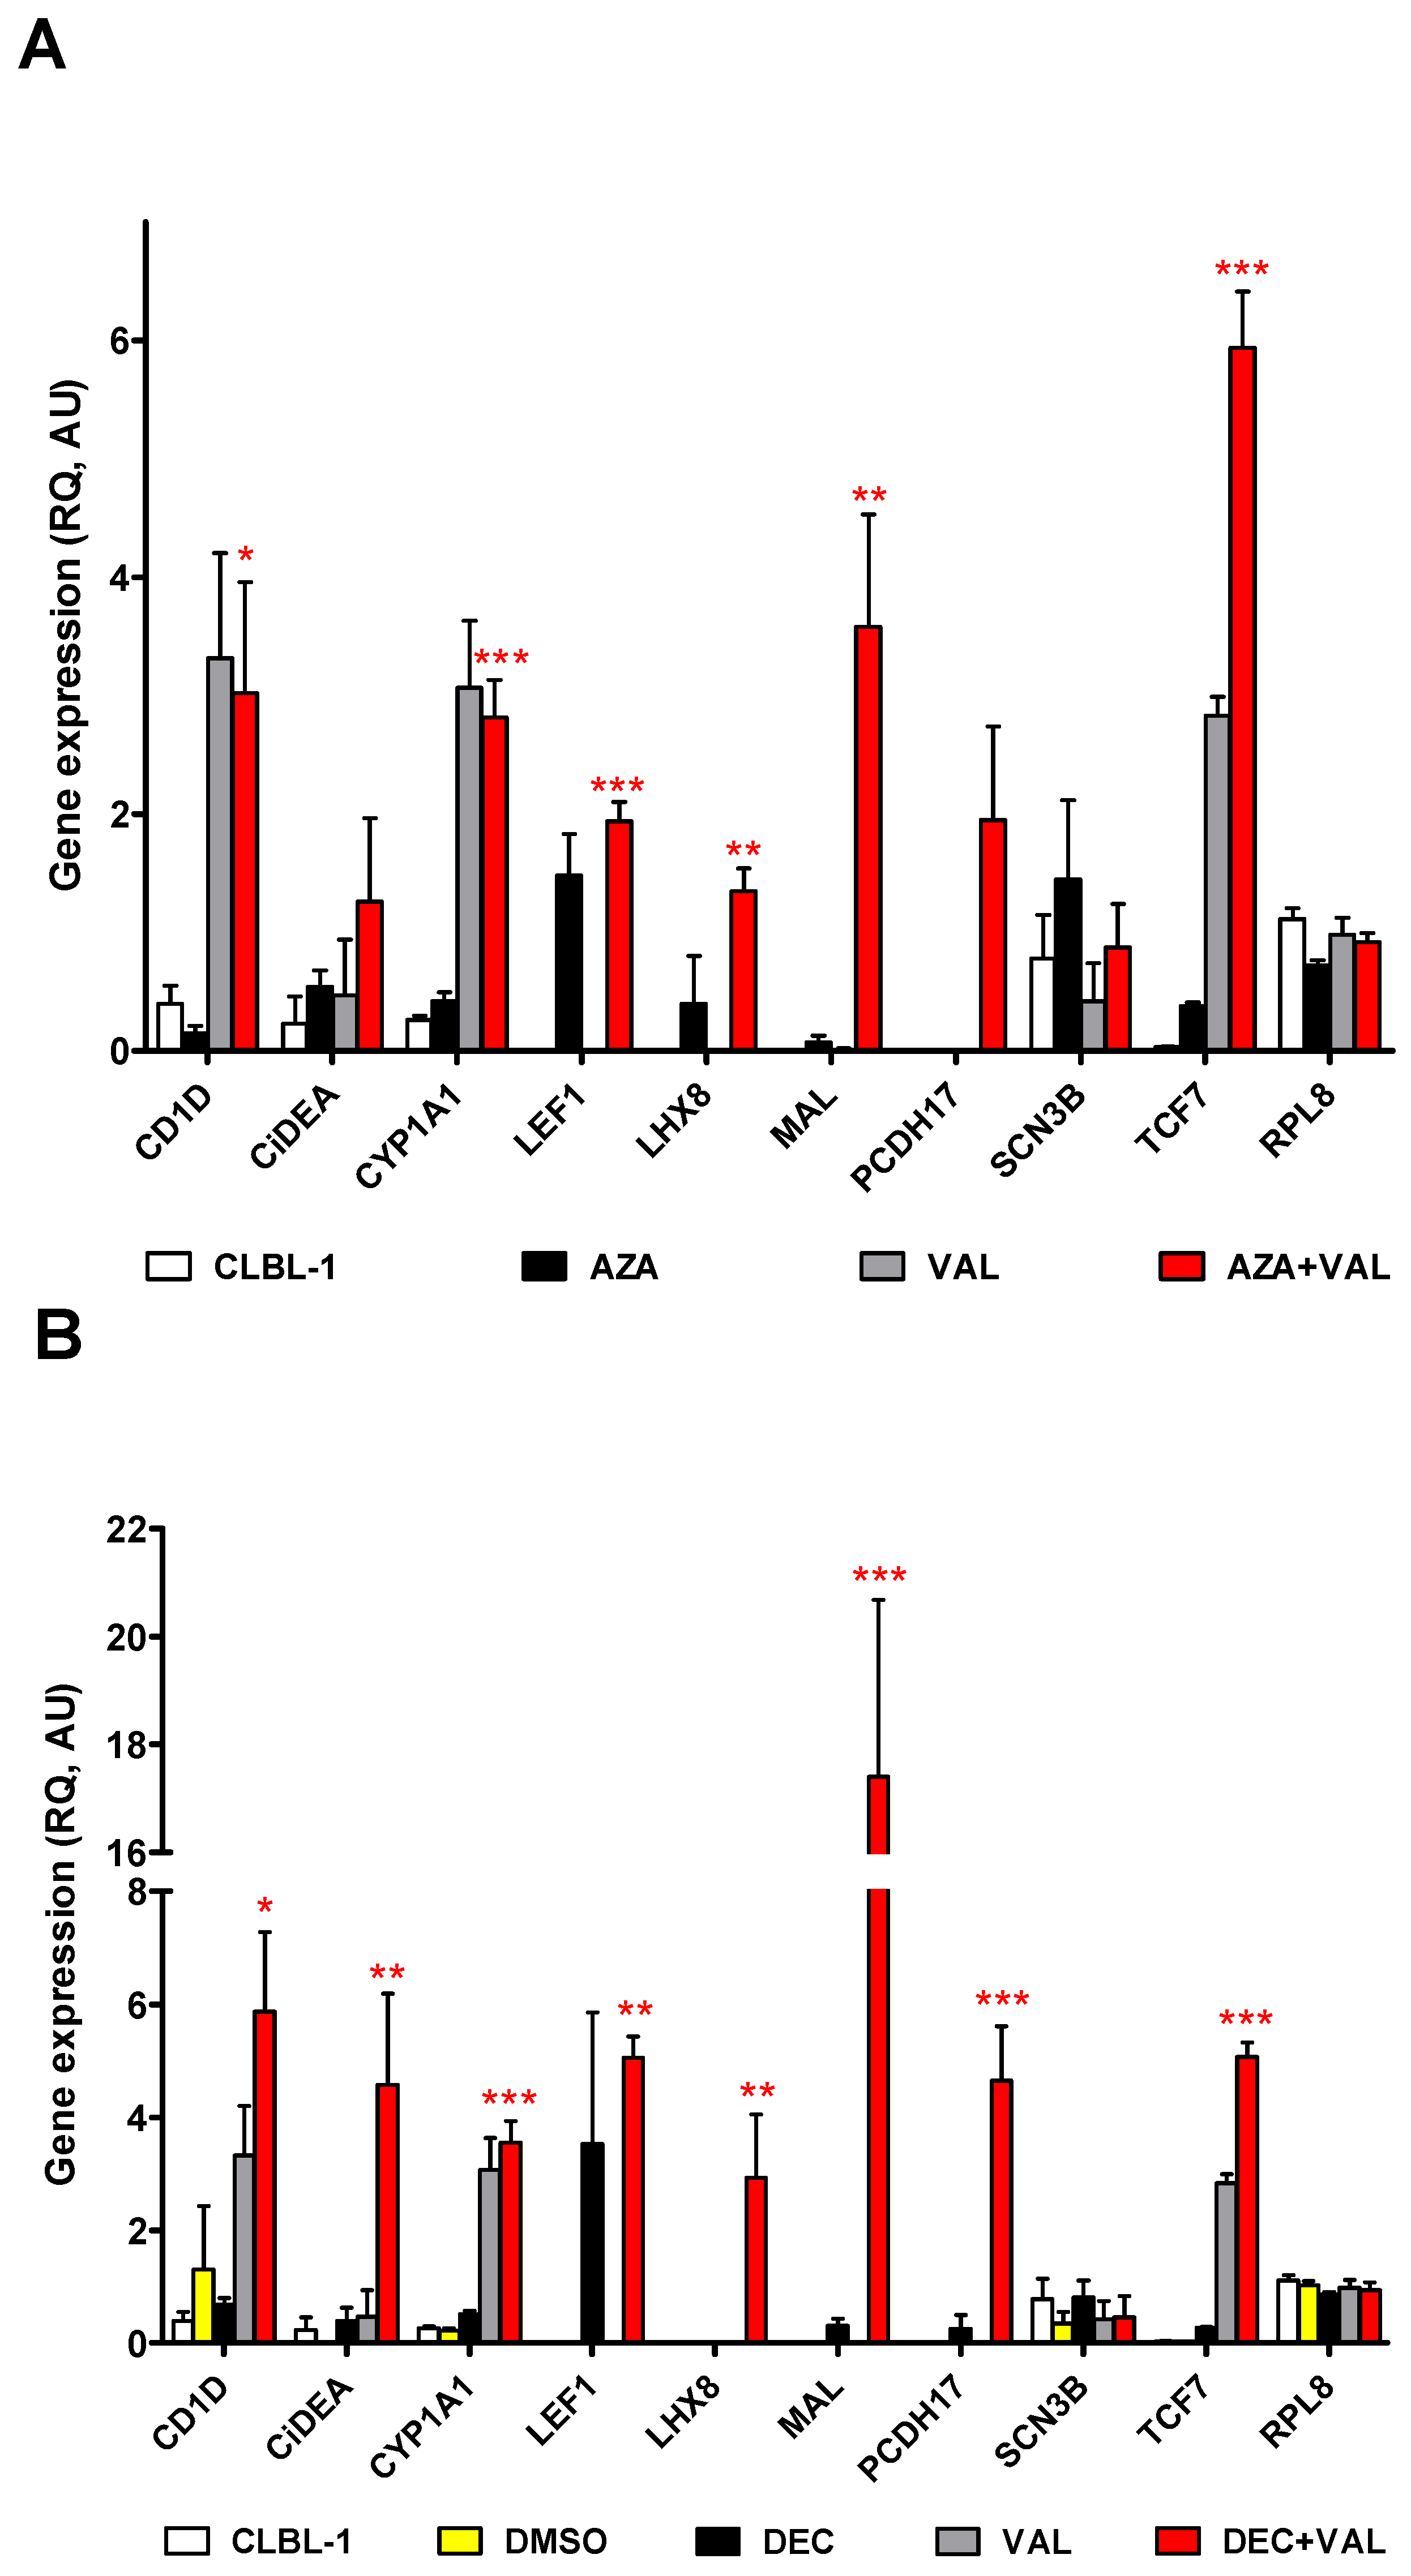
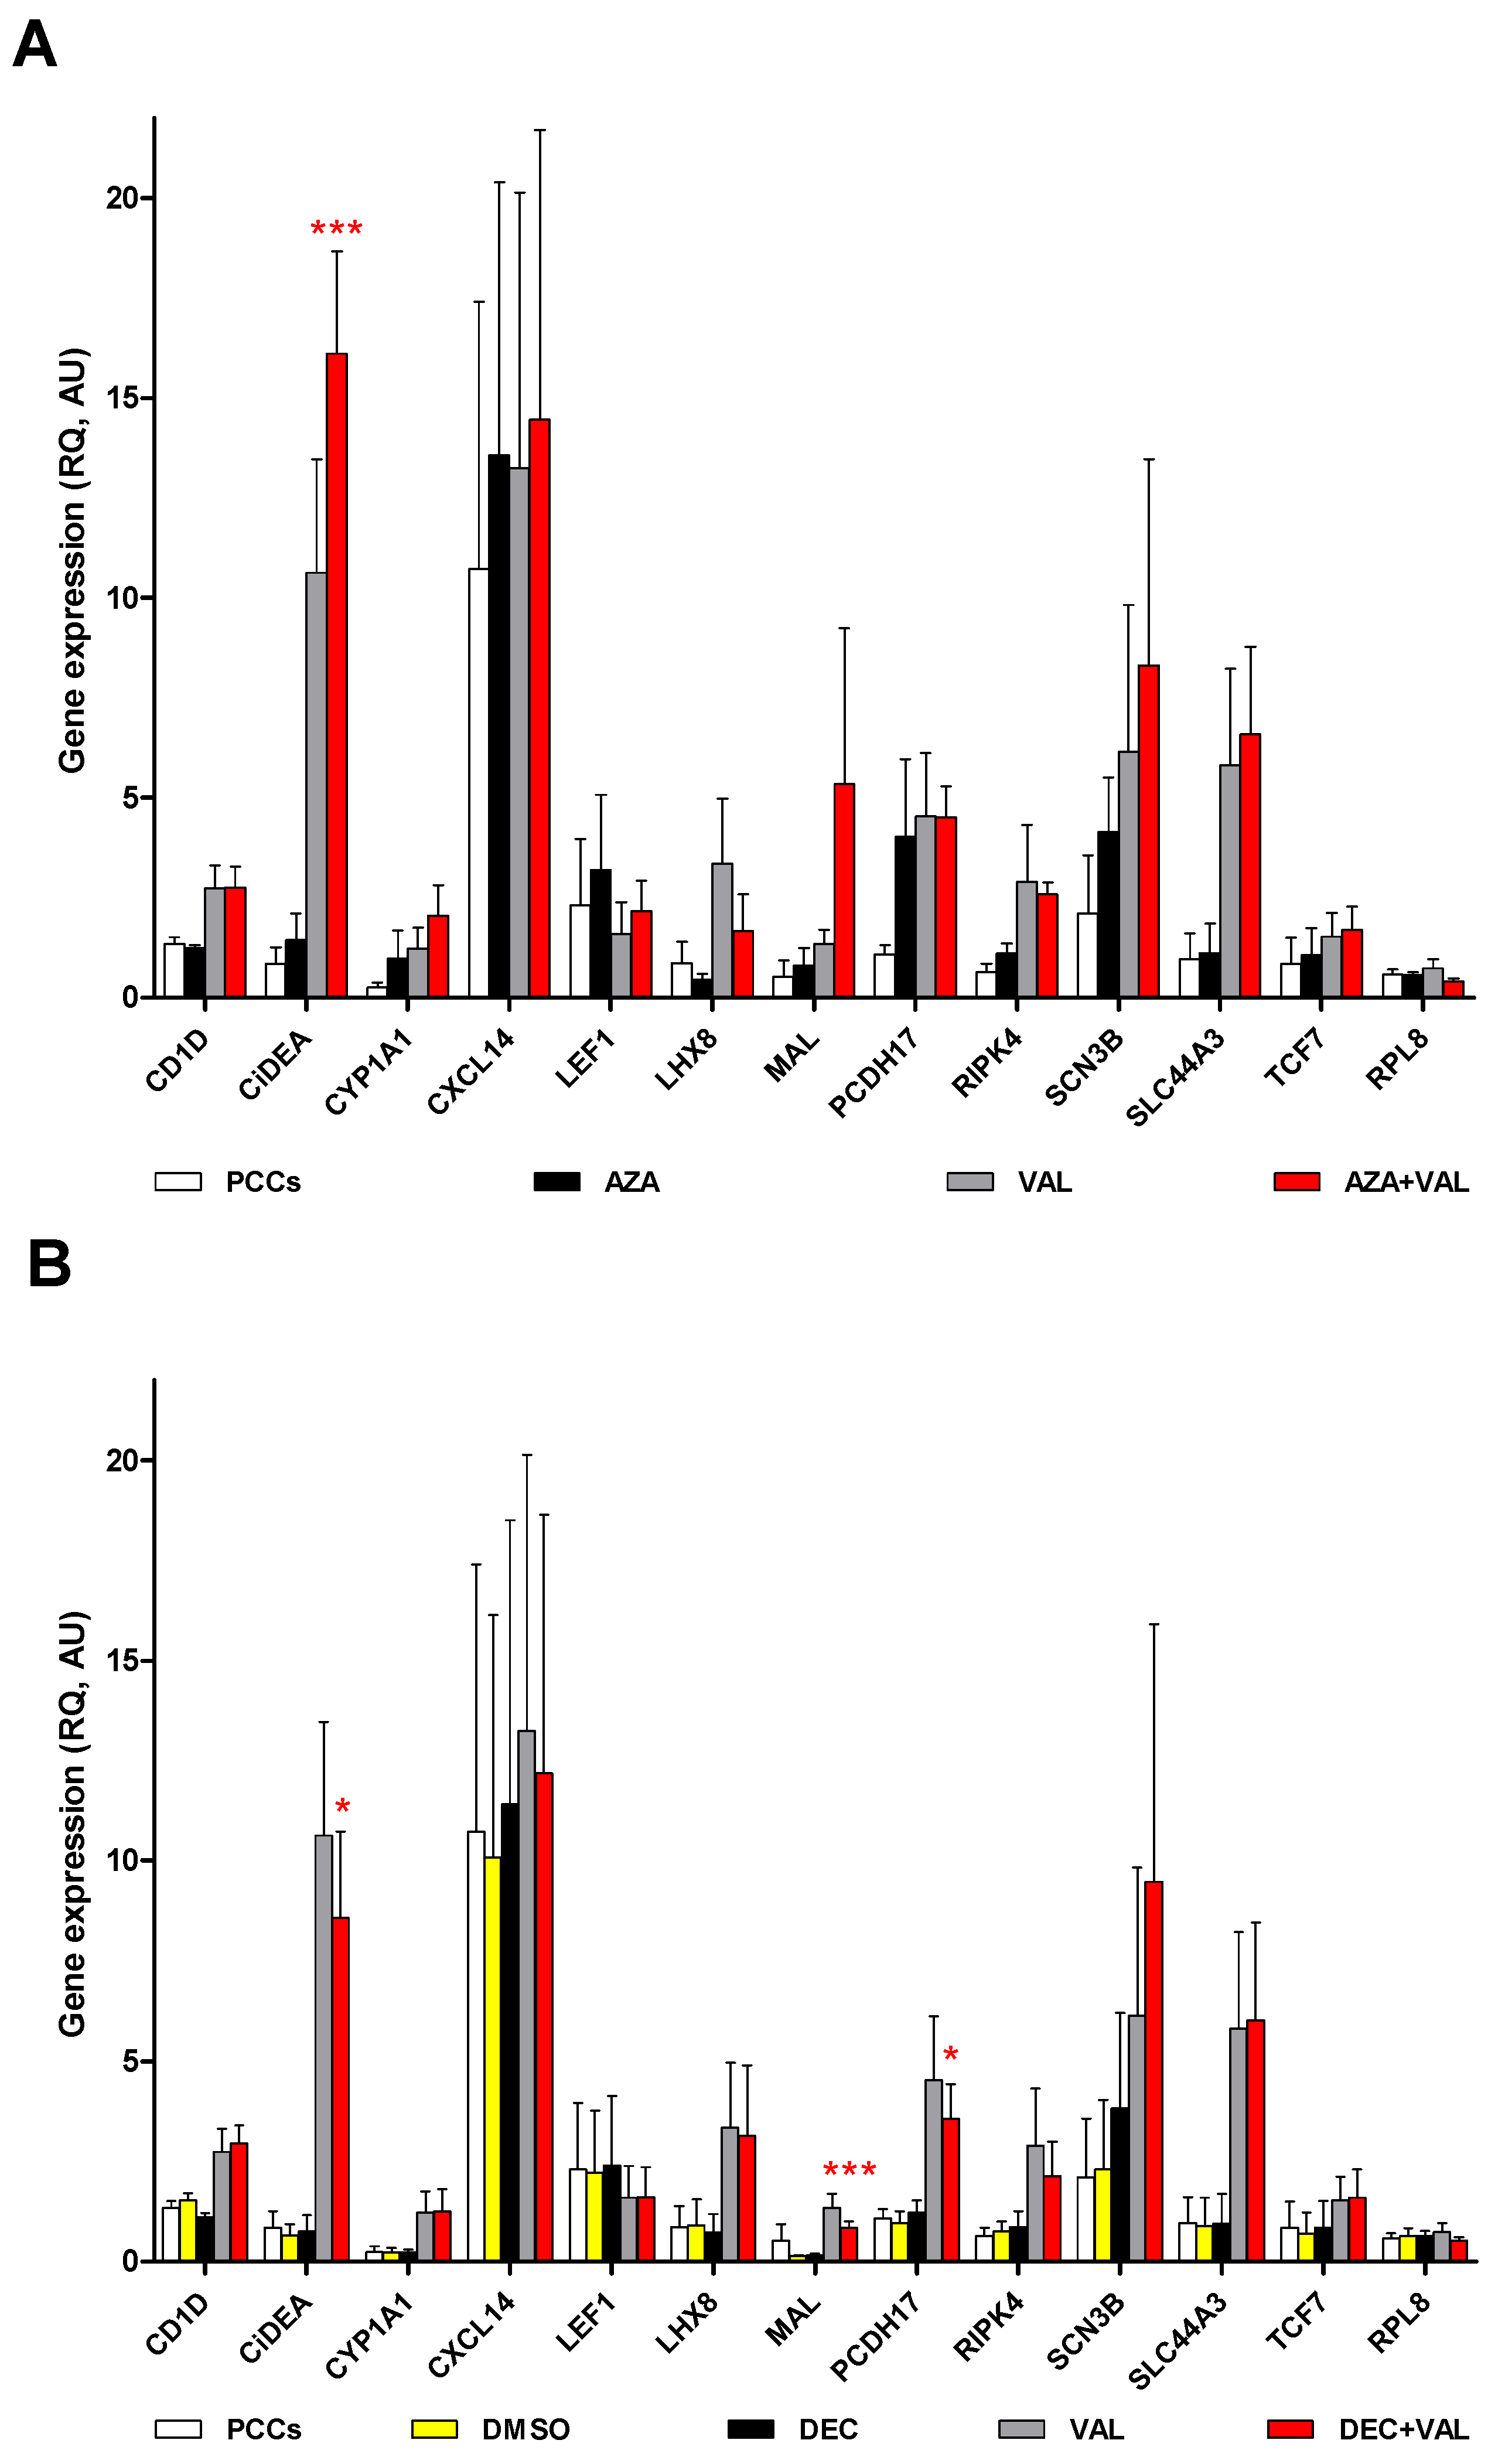
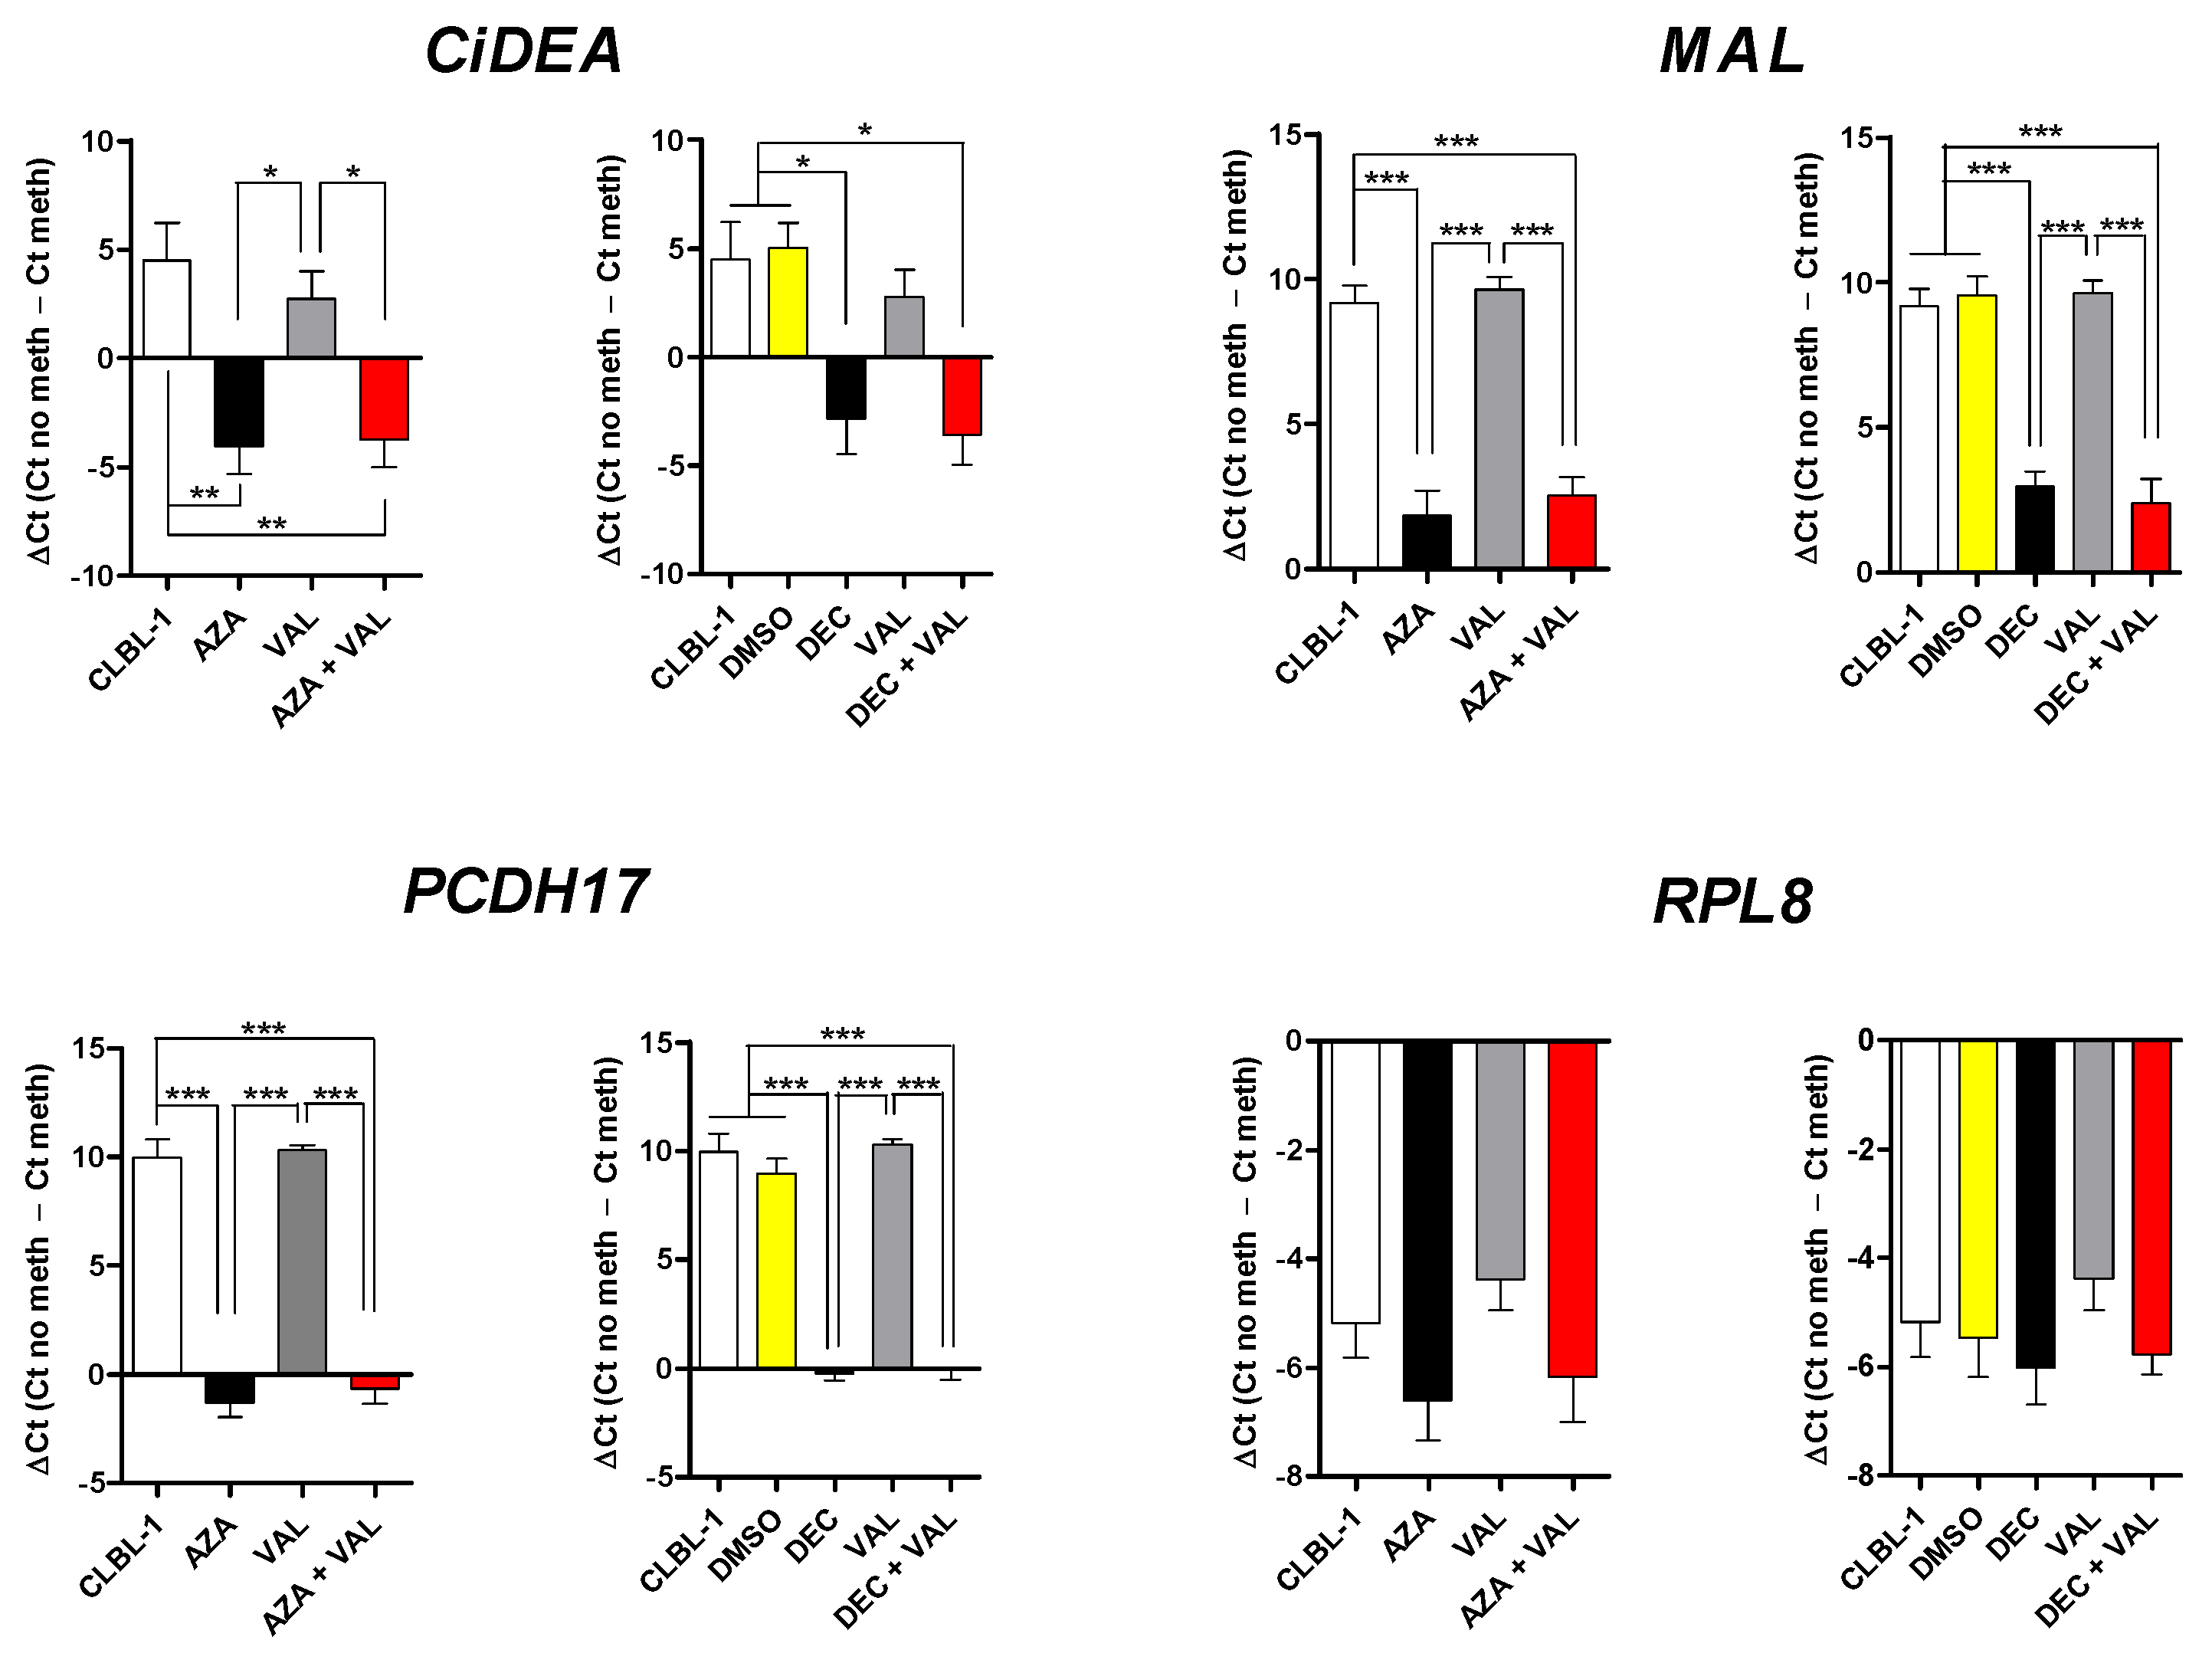
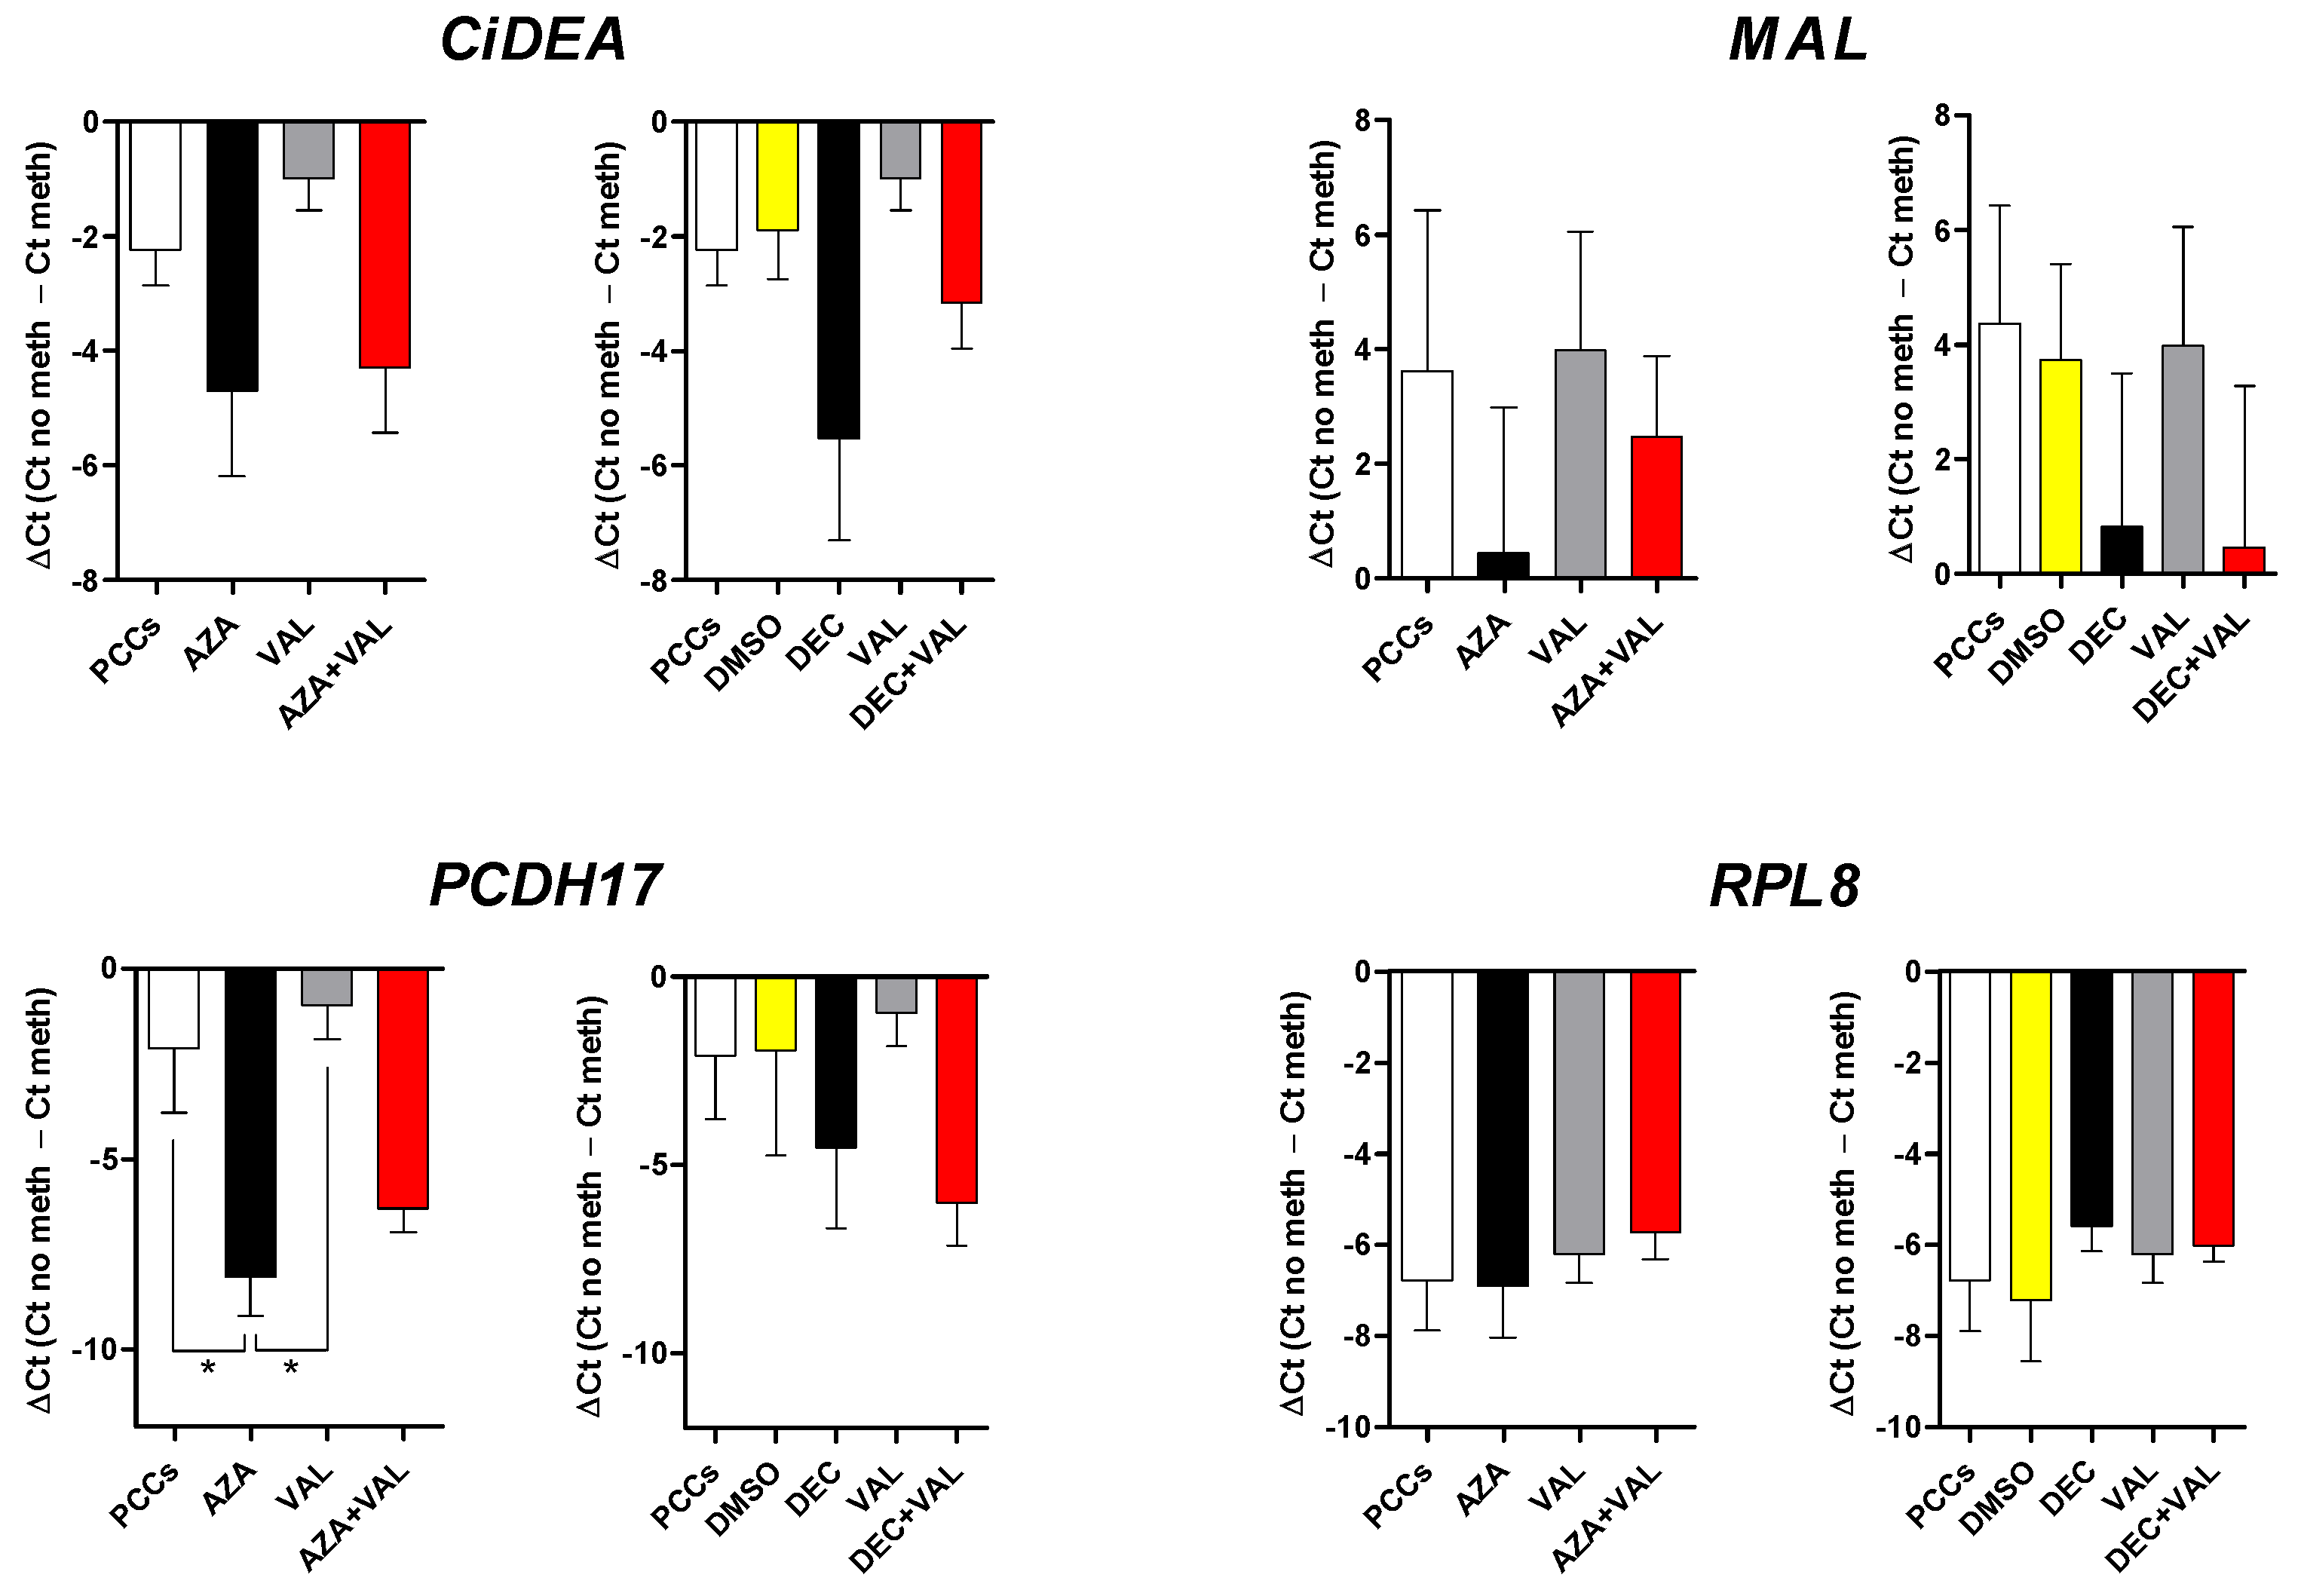
2.2. CiDEA, MAL and PCDH17 mRNA Expression Is Restored by HDs and HDACis in Both CLBL-1 Cells and cDLBCL Primary Cell Cultures
2.3. CiDEA, MAL and PCDH17 Are Confirmed to Be Aberrantly Hypermethylated in CLBL-1 and PCC Cells
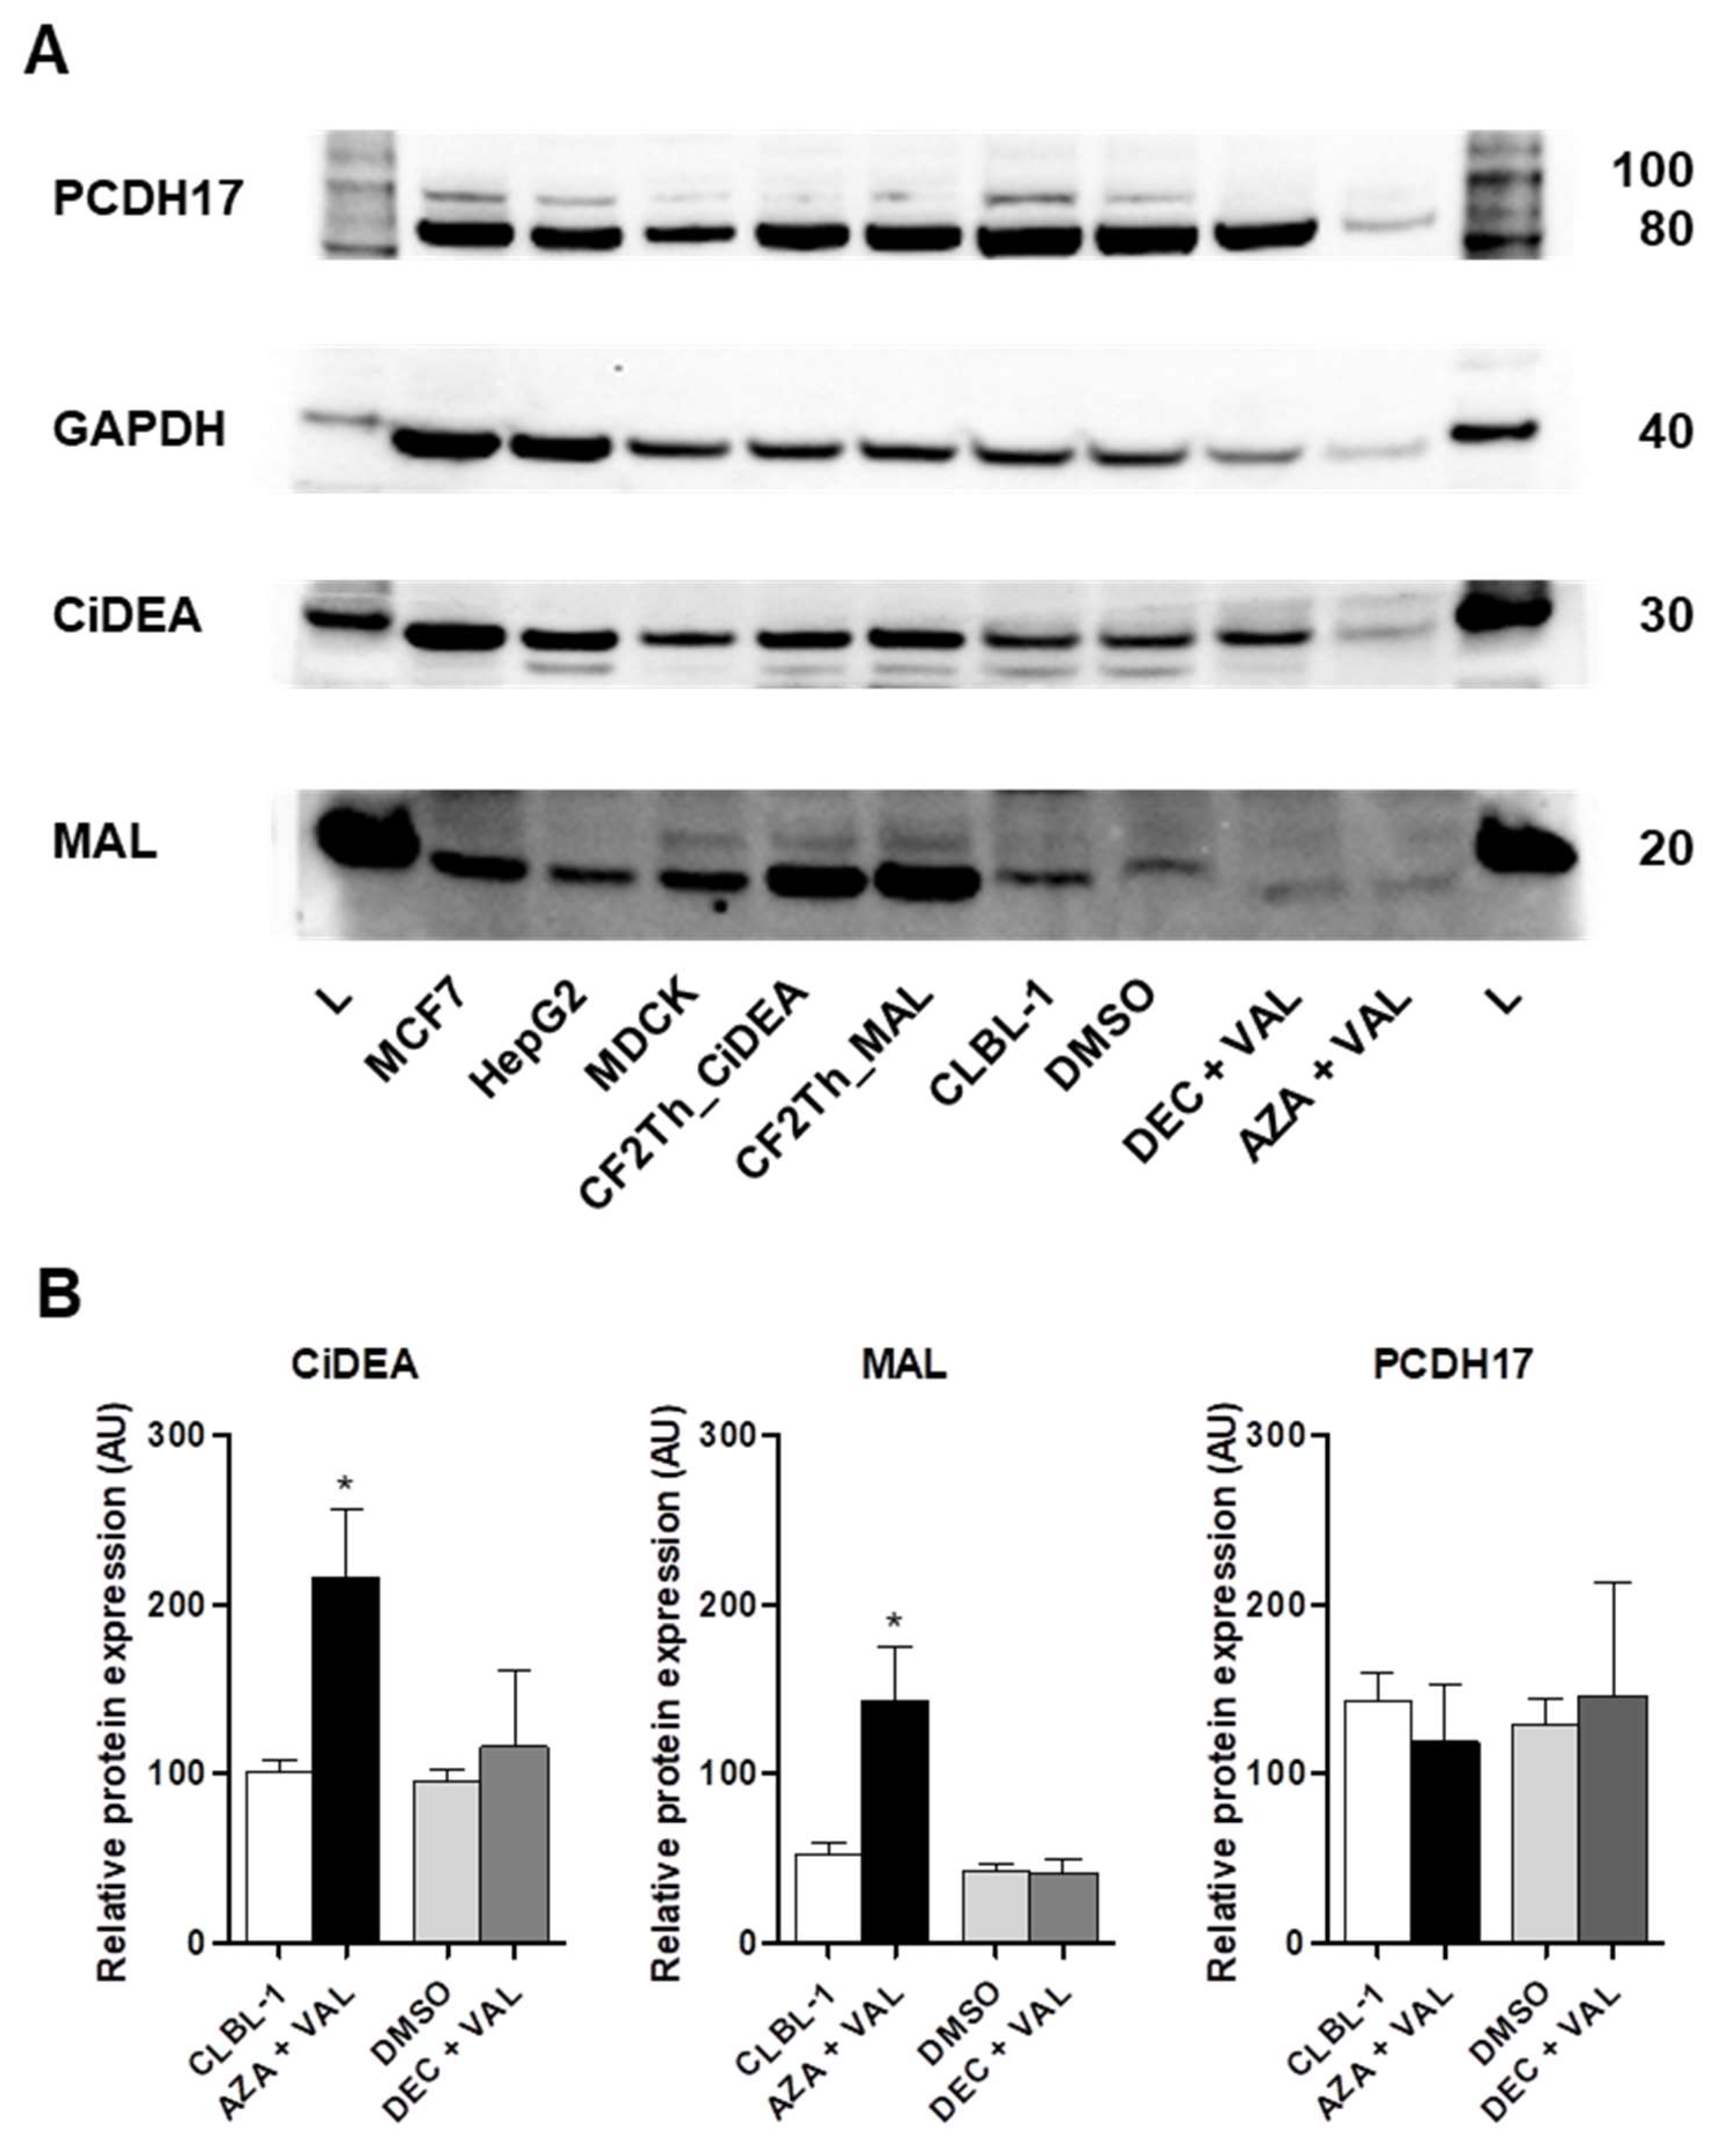
2.4. CiDEA and MAL Protein Expression Is Restored by AZA + VAL in CLBL-1 Cells
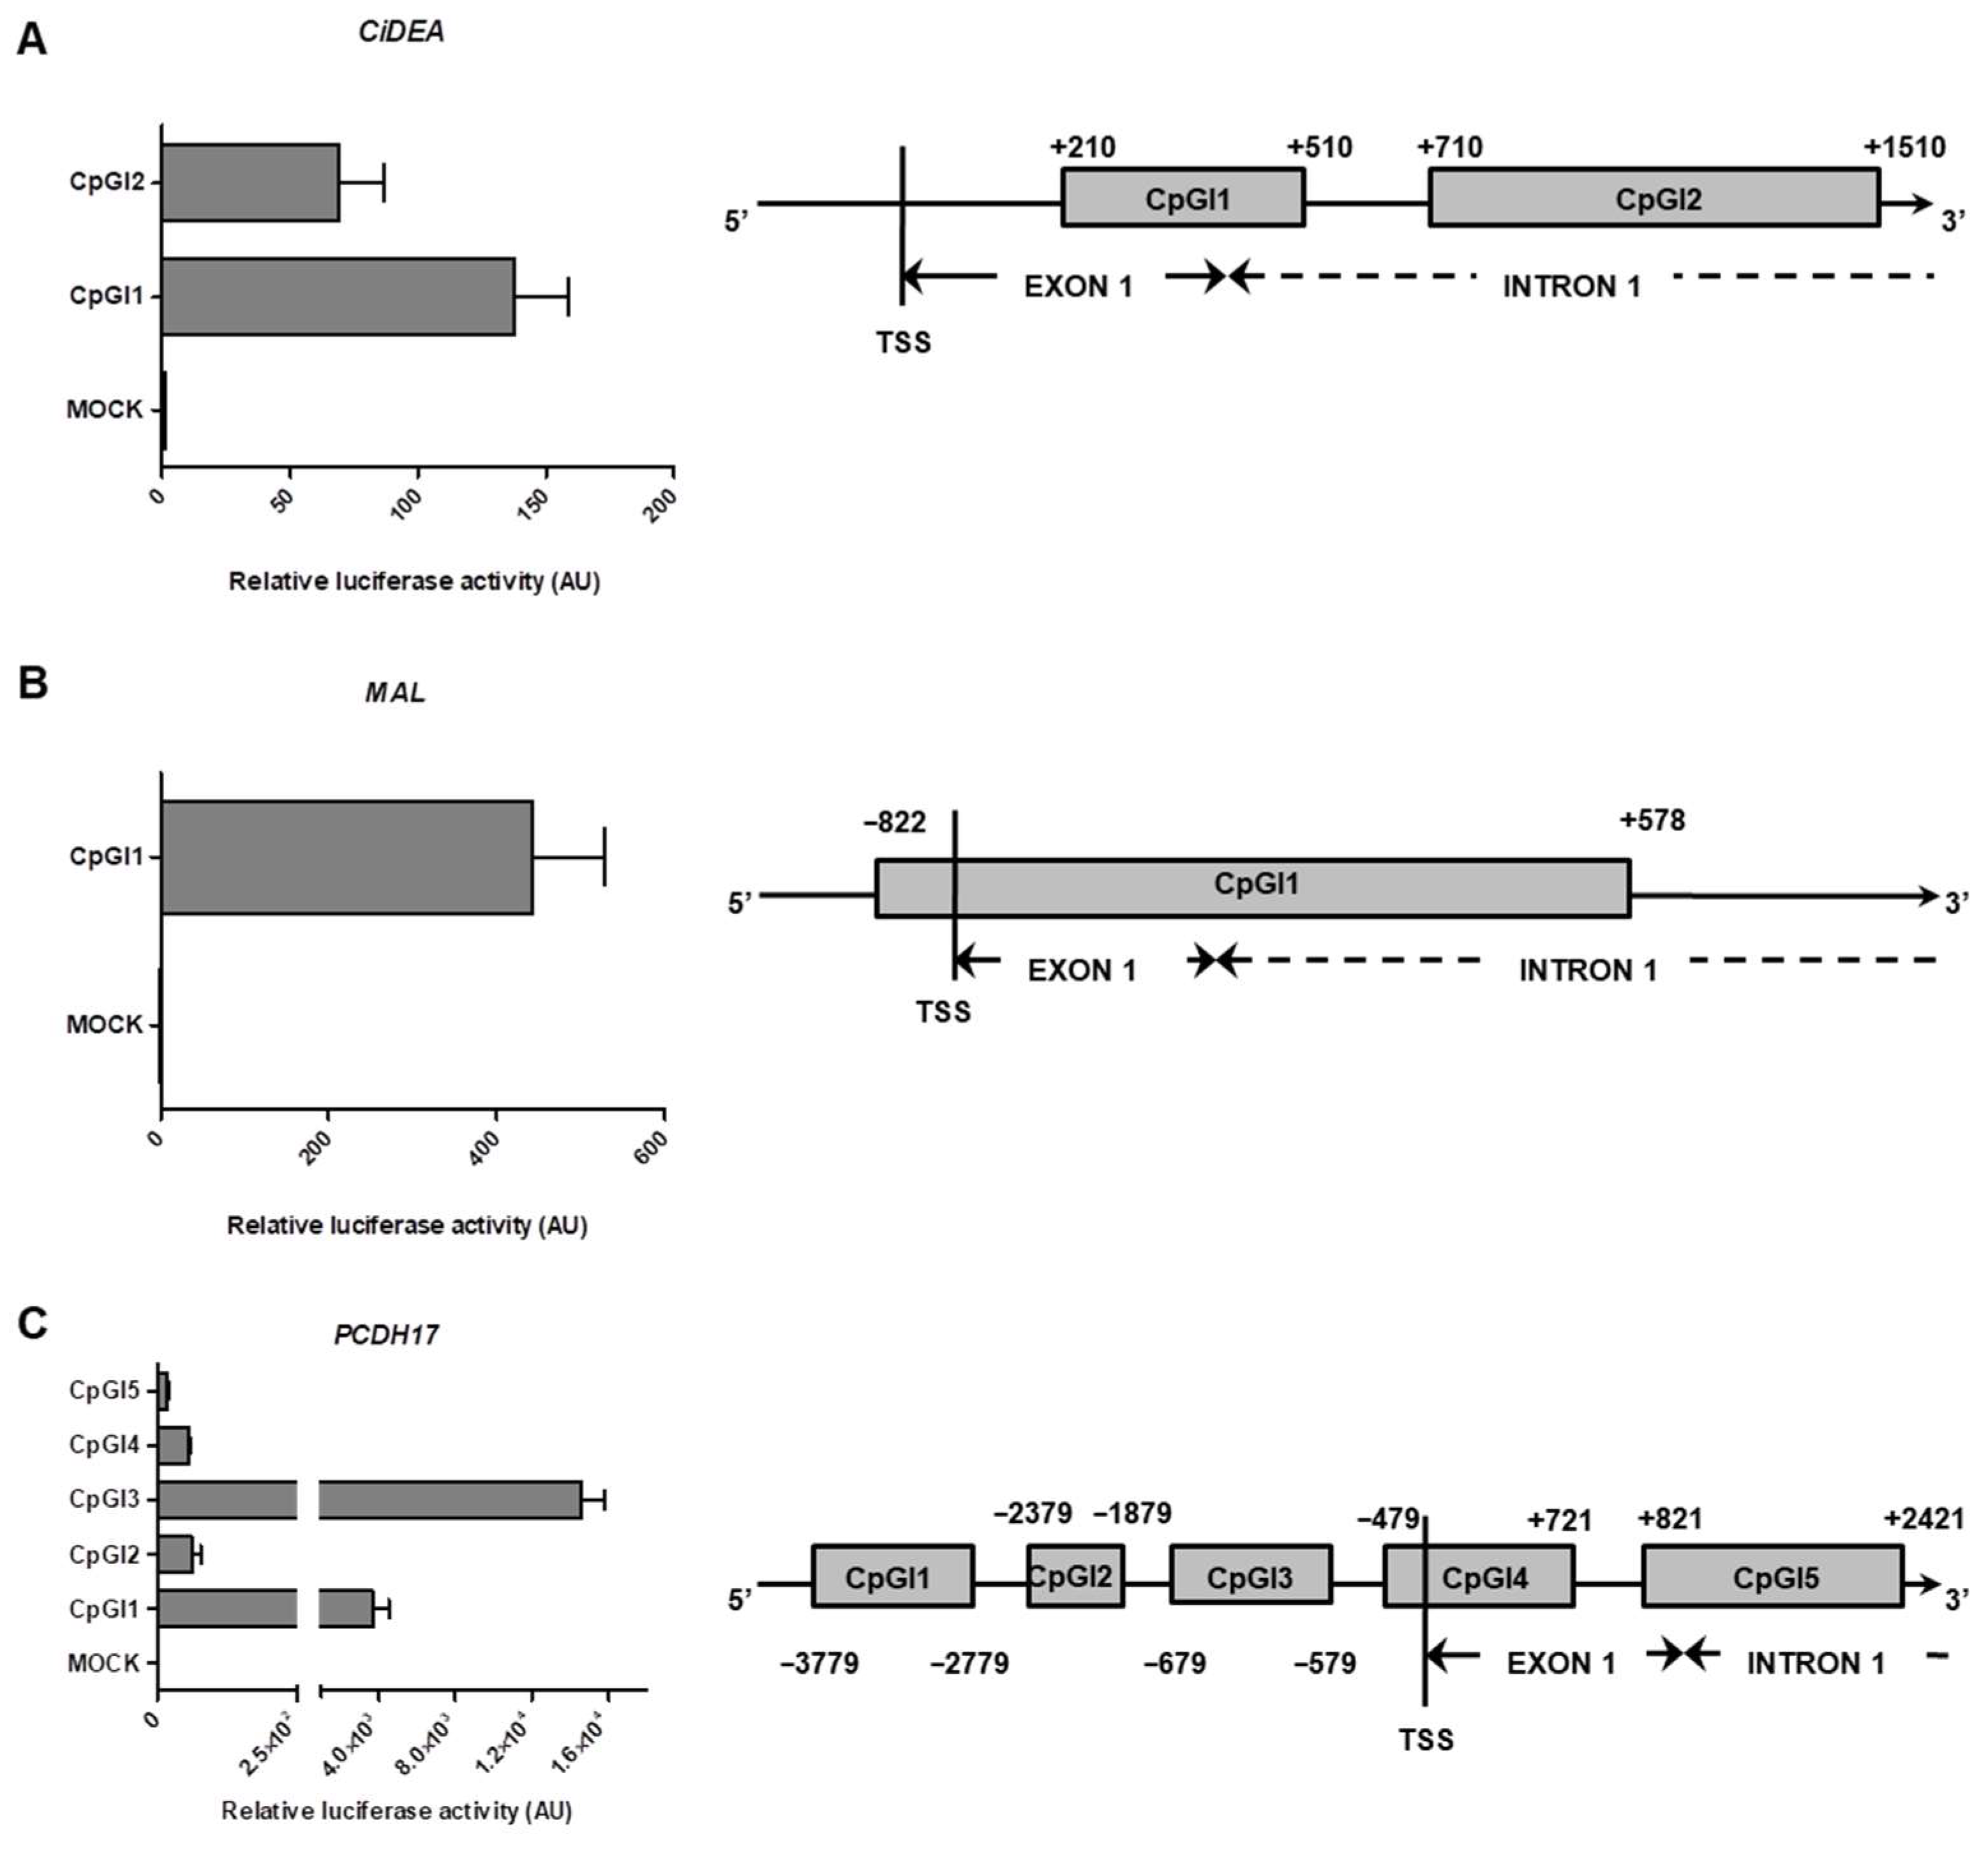
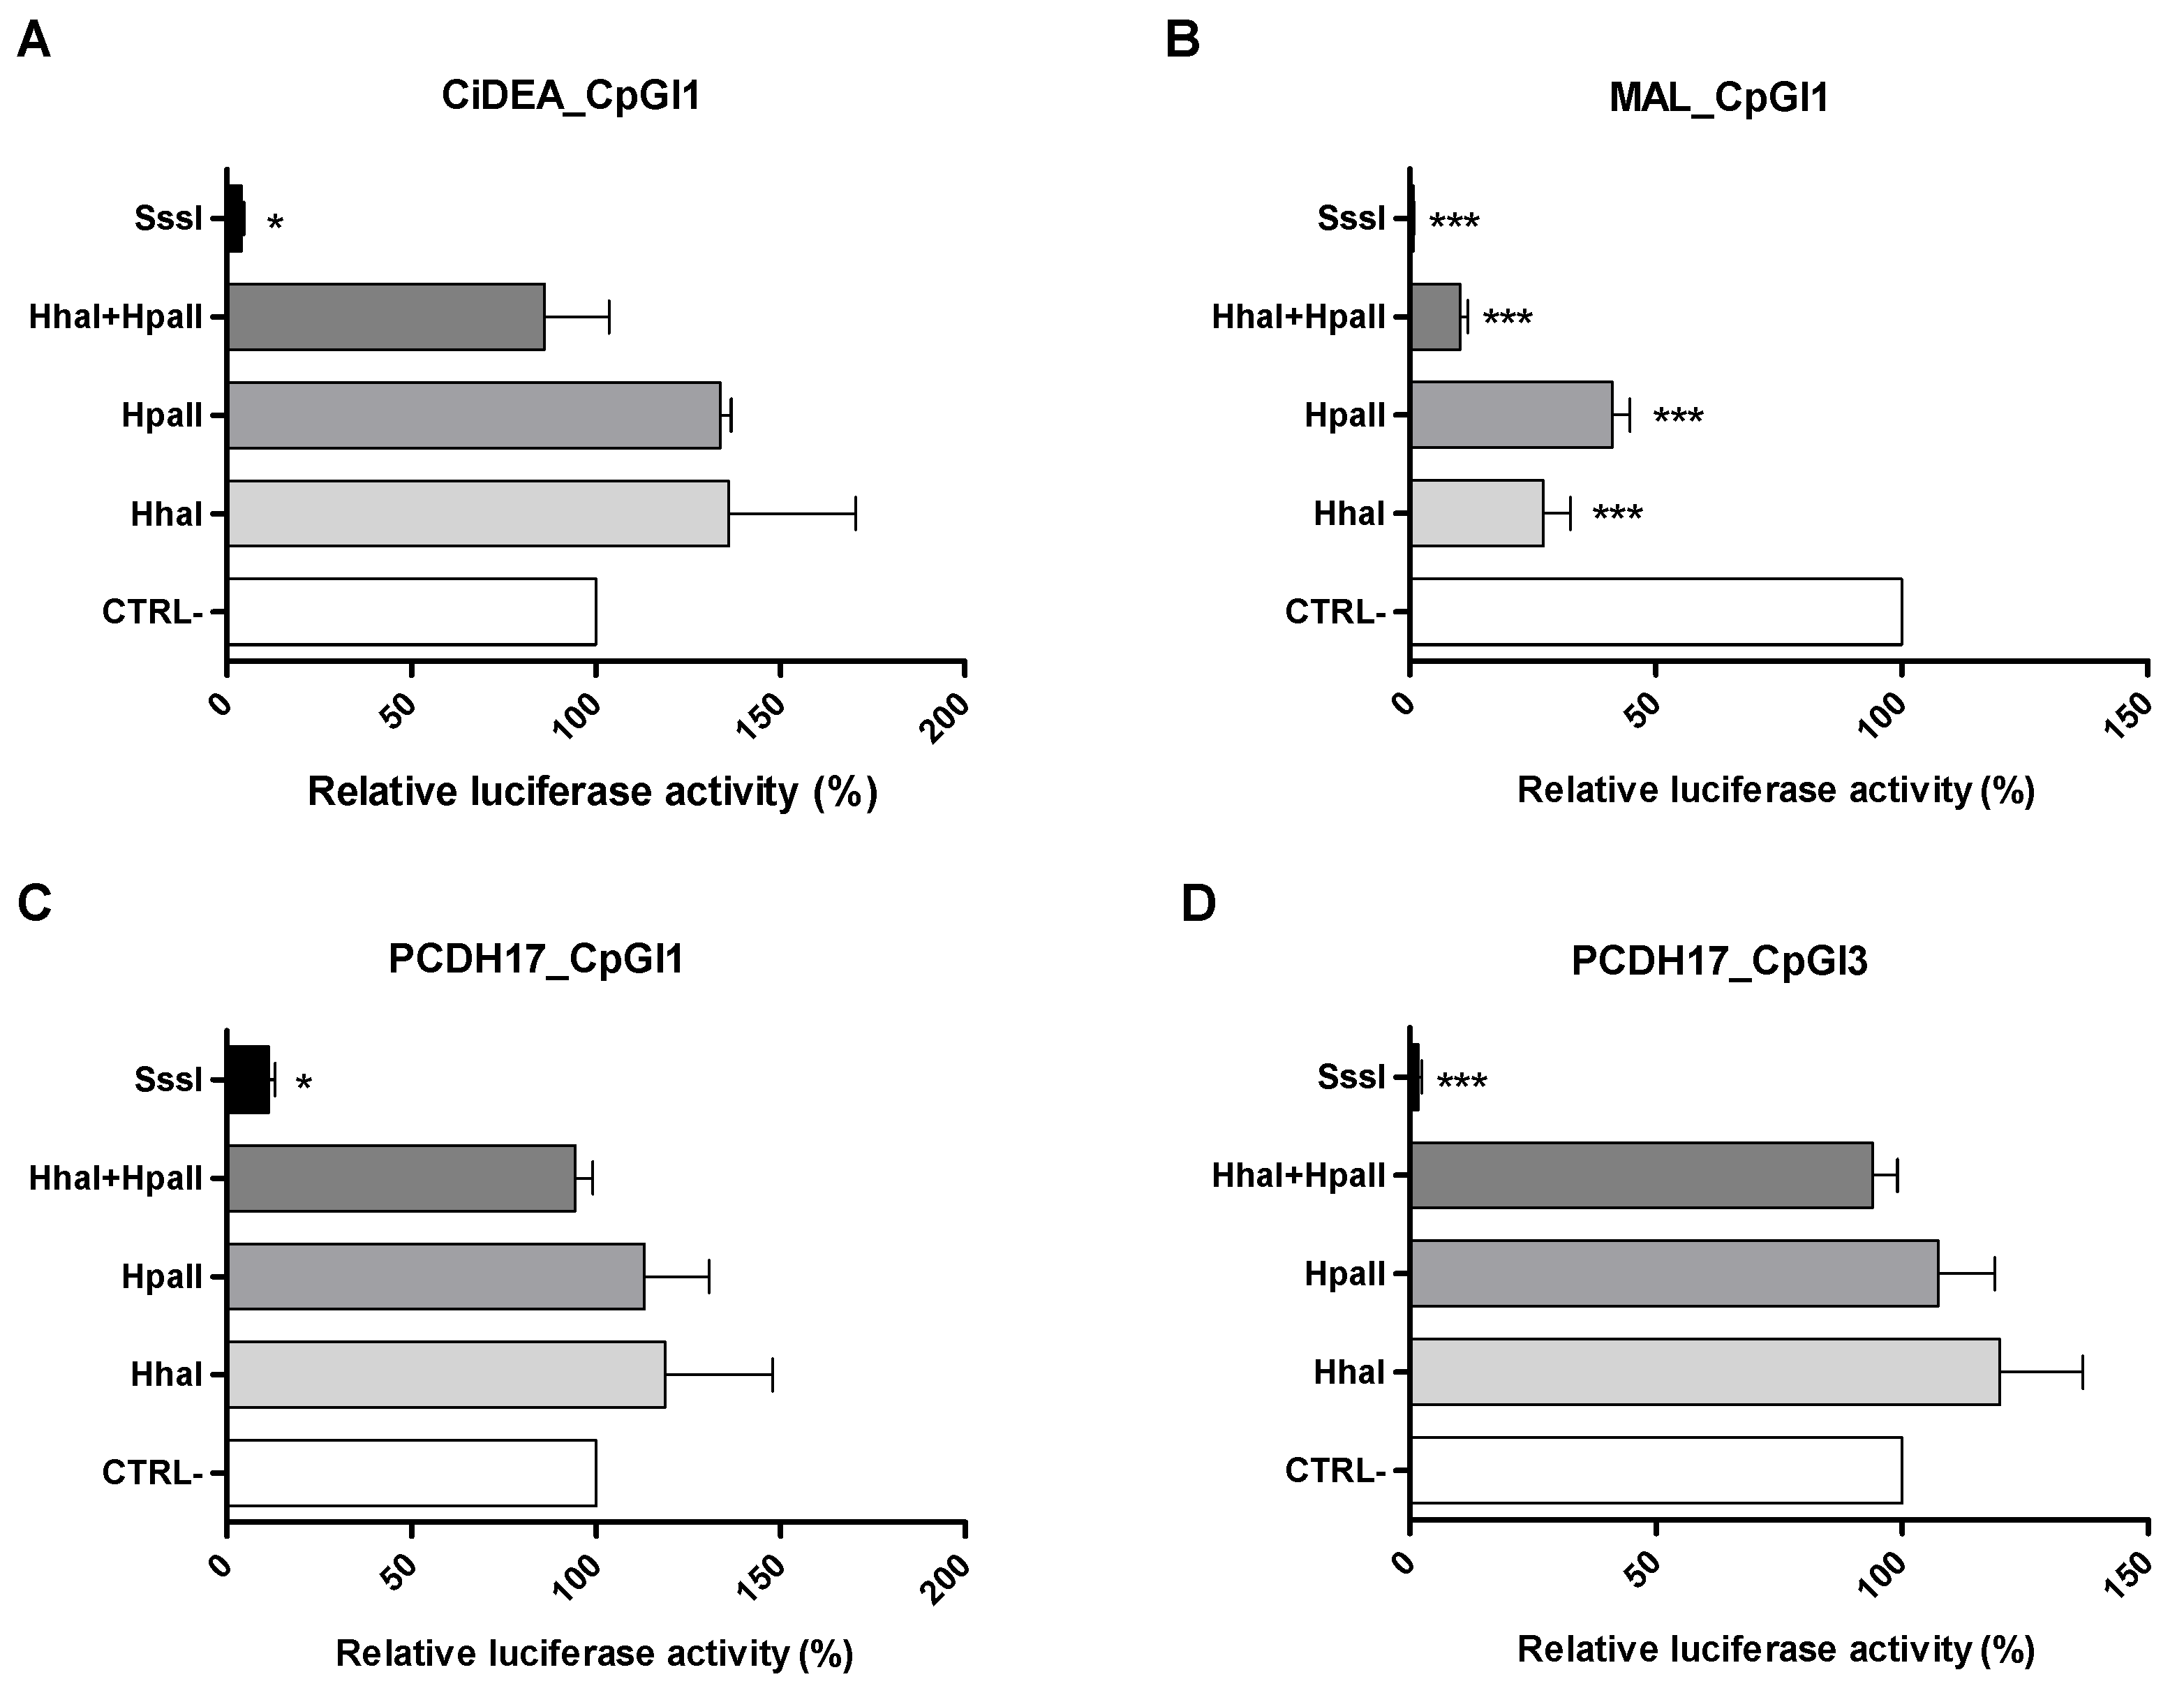
2.5. In Vitro Methylation of CiDEA, MAL and PCDH17 CpG Sites Affects Gene Transcription
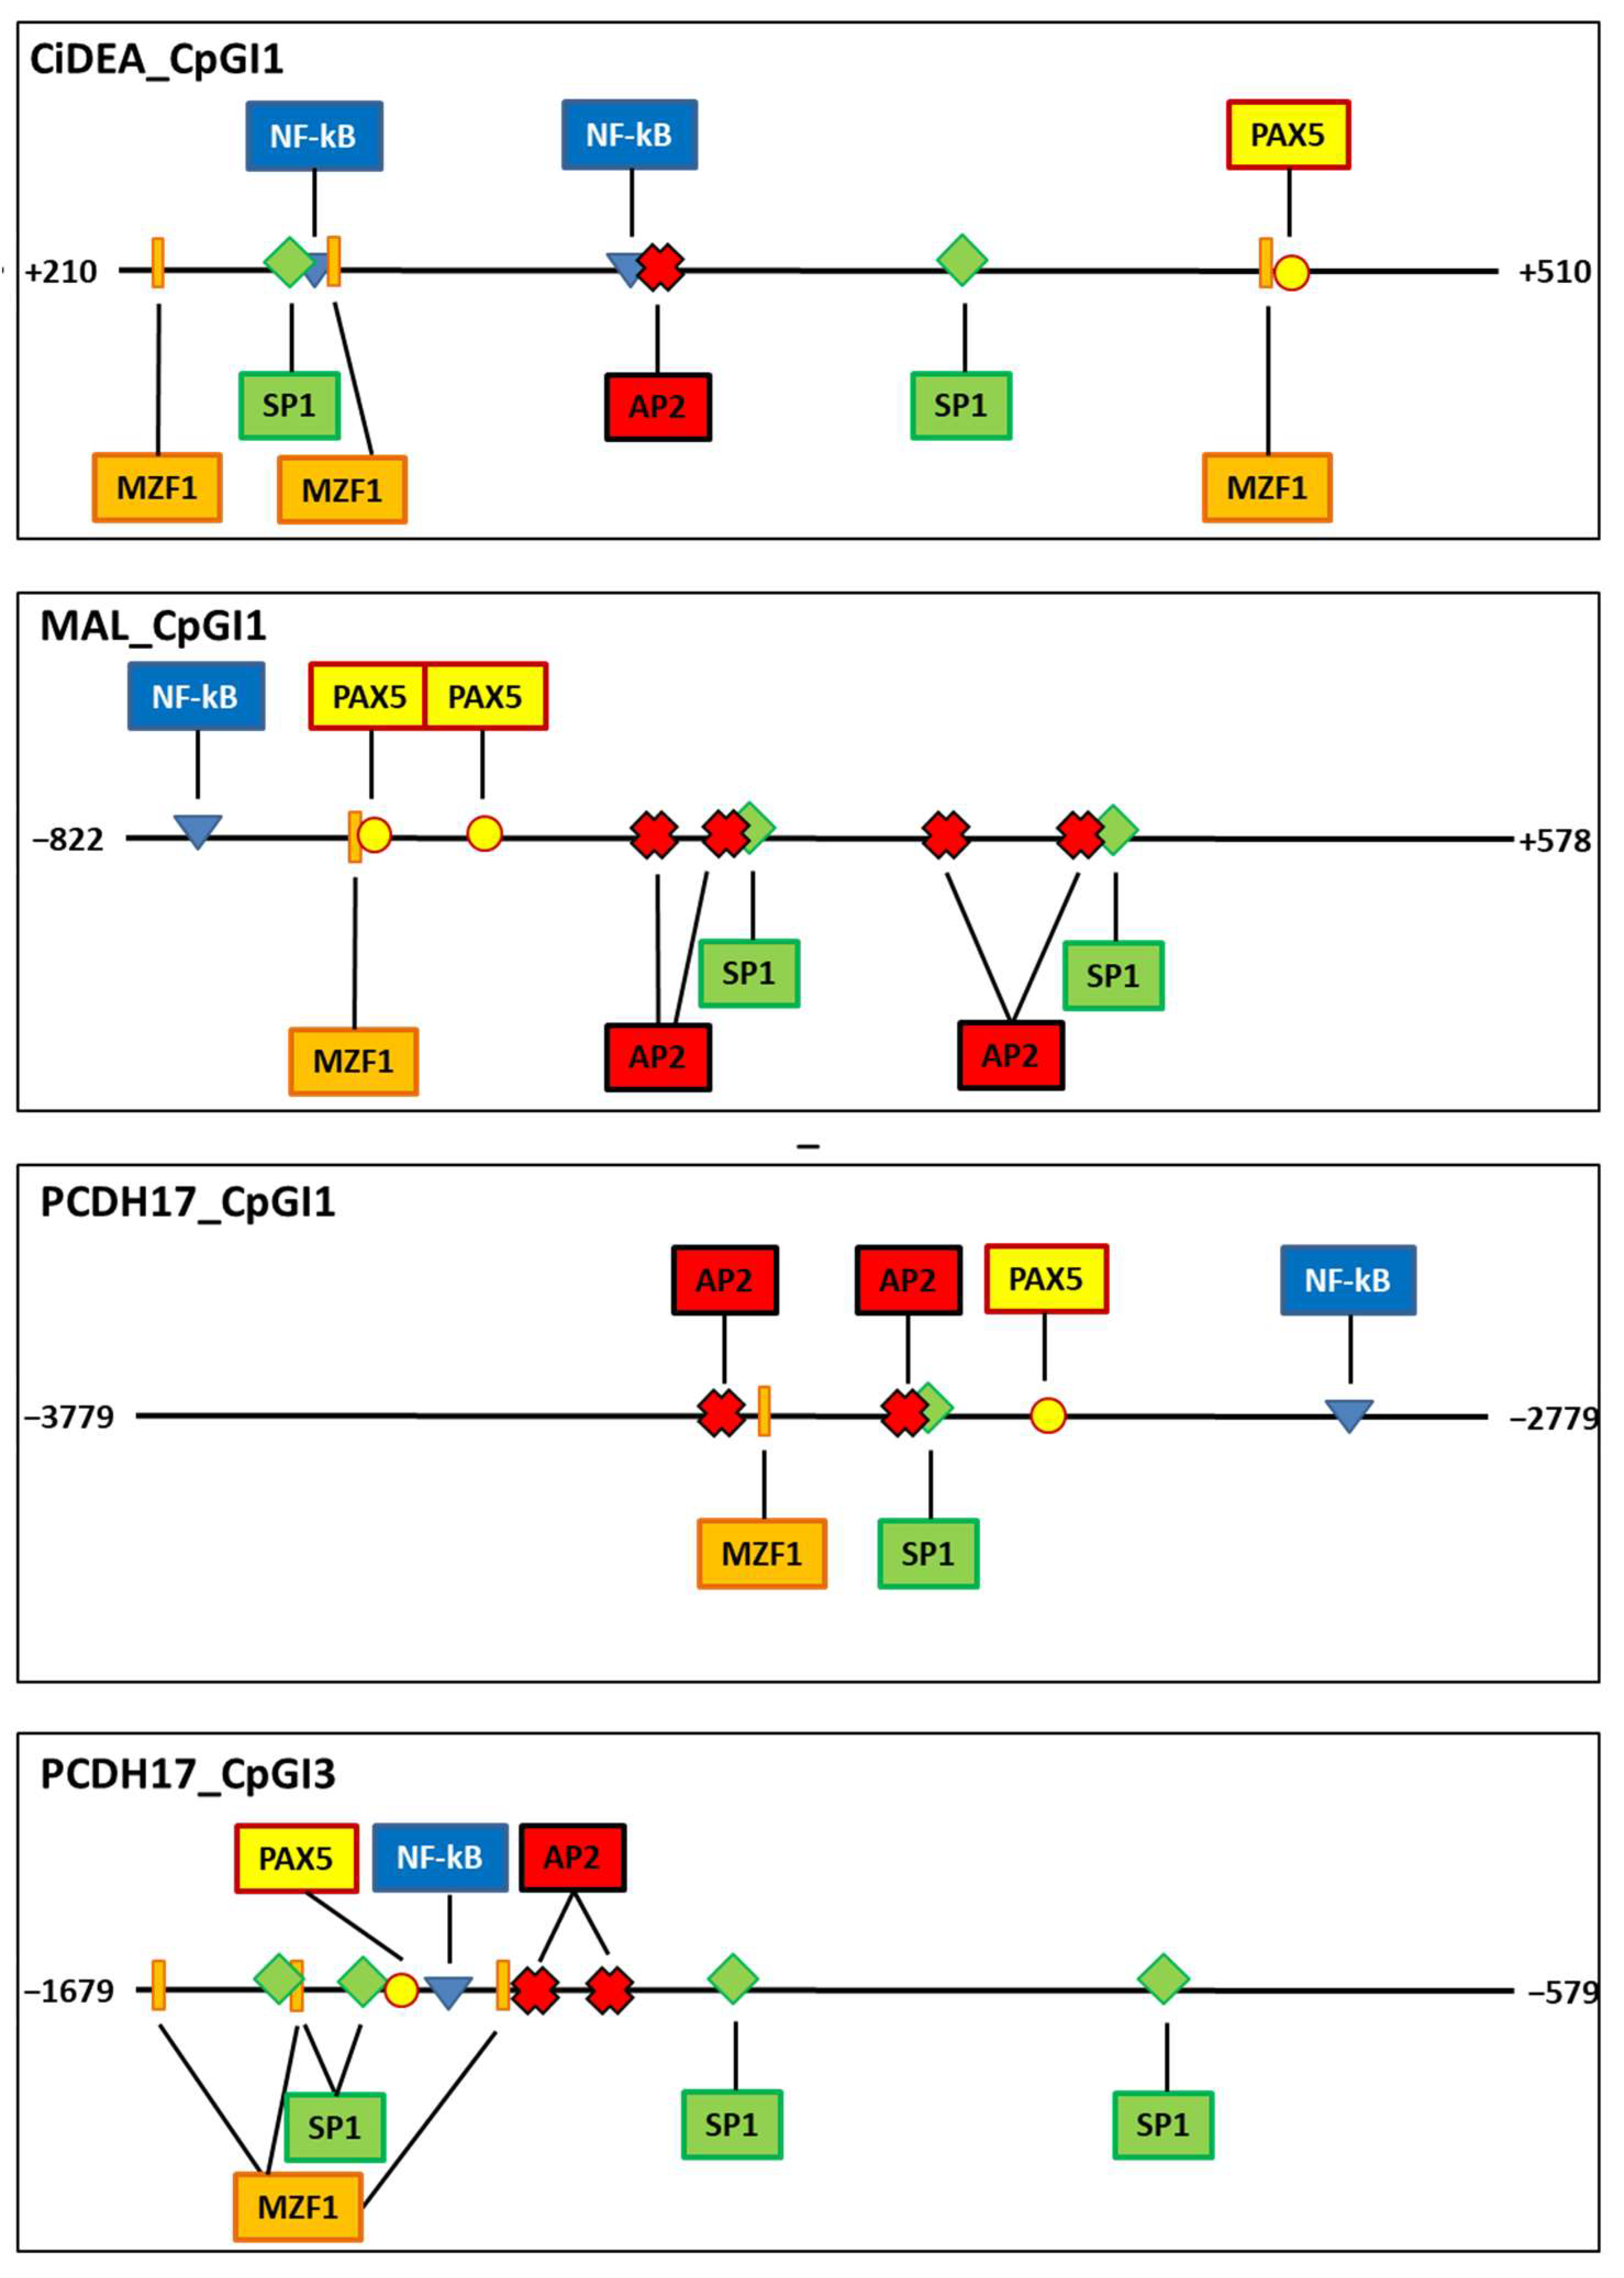
2.6. Transcription Factor Binding Sites Putatively Iinvolved in CiDEA, MAL and PCDH17 Methylation-Dependent Silencing
3. Discussion
4. Materials and Methods
4.1. Chemicals and Reagents
4.2. Candidate Genes Selection
4.3. Canine B-Cell Lymphoma Cell Lines
4.4. Cell Treatments
4.5. Cytotoxicity
4.6. Quantitative Real-Time PCR (qPCR)
4.7. Methyl Specific PCR (MSP)
4.8. Total Protein Isolation and Immunoblotting
4.9. Cloning of CiDEA, MAL and PCDH17 CpG-Rich Genomic Regions
4.10. Promoter Reporter Assays
4.11. In Vitro Methylation
4.12. In Silico Predictive Analysis
4.13. Statistical Analysis
Supplementary Materials
Author Contributions
Funding
Institutional Review Board Statement
Informed Consent Statement
Data Availability Statement
Acknowledgments
Conflicts of Interest
References
- Aresu, L. Canine lymphoma, more than a morphological diagnosis: What we have learned about diffuse large B-cell lymphoma. Front. Vet. Sci. 2016, 3, 77. [Google Scholar] [CrossRef] [PubMed]
- Richards, K.L.; Suter, S.E. Man’s best friend: What can pet dogs teach us about non-Hodgkin’s lymphoma? Immunol. Rev. 2015, 263, 173–191. [Google Scholar] [CrossRef] [PubMed]
- Avery, A.C. The genetic and molecular basis for canine models of human leukemia and lymphoma. Front. Oncol. 2020, 10, 23. [Google Scholar] [CrossRef] [PubMed]
- Frantz, A.M.; Sarver, A.L.; Ito, D.; Phang, T.L.; Karimpour-Fard, A.; Scott, M.C.; Valli, V.E.O.; Lindblad-Toh, K.; Burgess, K.E.; Husbands, B.D.; et al. Molecular profiling reveals prognostically significant subtypes of canine lymphoma. Vet. Pathol. 2012, 50, 693–703. [Google Scholar] [CrossRef] [PubMed]
- Mudaliar, M.A.; Haggart, R.D.; Miele, G.; Sellar, G.; Tan, K.A.; Goodlad, J.R.; Milne, E.; Vail, D.M.; Kurzman, I.; Crowther, D.; et al. Comparative gene expression profiling identifies common molecular signatures of NF-κB activation in canine and human diffuse large B cell lymphoma (DLBCL). PLoS ONE 2013, 8, e72591. [Google Scholar] [CrossRef] [PubMed]
- Richards, K.L.; Motsinger-Reif, A.A.; Chen, H.W.; Fedoriw, Y.; Fan, C.; Nielsen, D.M.; Small, G.W.; Thomas, R.; Smith, C.; Dave, S.S.; et al. Gene profiling of canine B-cell lymphoma reveals germinal center and postgerminal center subtypes with different survival times, modelling human DLBCL. Cancer Res. 2013, 73, 5029–5039. [Google Scholar] [CrossRef] [PubMed]
- Aresu, L.; Ferraresso, S.; Marconato, L.; Cascione, L.; Napoli, S.; Gaudio, E.; Kwee, I.; Tarantelli, C.; Testa, A.; Maniaci, C.; et al. New molecular and therapeutic insights into canine diffuse large B-cell lymphoma elucidates the role of the dog as a model for human disease. Haematologica 2019, 104, e256–e259. [Google Scholar] [CrossRef] [PubMed]
- Wu, Y.; Chang, Y.M.; Polton, G.; Stell, A.J.; Szladovits, B.; Macfarlane, M.; Peters, L.M.; Priestnall, S.L.; Bacon, N.J.; Kow, K.; et al. Gene expression profiling of B cell lymphoma in dogs reveals dichotomous metabolic signatures distinguished by oxidative phosphorylation. Front. Oncol. 2020, 10, 307. [Google Scholar] [CrossRef] [PubMed]
- Thomas, R.; Seiser, E.L.; Motsinger-Reif, A.; Borst, L.; Valli, V.E.; Kelley, K.; Suter, S.E.; Argyle, D.; Burgess, K.; Bell, J.; et al. Refining tumor-associated aneuploidy through ‘genomic recoding’ of recurrent DNA copy number aberrations in 150 canine non-Hodgkin lymphomas. Leuk. Lymphoma 2011, 52, 1321–1335. [Google Scholar] [CrossRef] [PubMed]
- Aricò, A.; Ferraresso, S.; Bresolin, S.; Marconato, L.; Comazzi, S.; Te Kronnie, G.; Aresu, L. Array-based comparative genomic hybridization analysis reveals chromosomal copy number aberrations associated with clinical outcome in canine diffuse large B-cell lymphoma. PLoS ONE 2014, 9, e111817. [Google Scholar] [CrossRef] [PubMed]
- Elvers, I.; Turner-Maier, J.; Swofford, R.; Koltookian, M.; Johnson, J.; Stewart, C.; Zhang, C.Z.; Schumacher, S.E.; Beroukhim, R.; Rosenberg, M.; et al. Exome sequencing of lymphomas from three dog breeds reveals somatic mutation patterns reflecting genetic background. Genome Res. 2015, 25, 1634–1645. [Google Scholar] [CrossRef] [PubMed]
- Giannuzzi, D.; Giudice, L.; Marconato, L.; Ferraresso, S.; Giugno, R.; Bertoni, F.; Aresu, L. Integrated analysis of transcriptome, methylome and copy number aberrations data of marginal zone lymphoma and follicular lymphoma in dog. Vet. Comp. Oncol. 2019, 18, 645–655. [Google Scholar] [CrossRef] [PubMed]
- Ferraresso, S.; Aricò, A.; Sanavia, T.; Da Ros, S.; Milan, M.; Cascione, L.; Comazzi, S.; Martini, V.; Giantin, M.; Di Camillo, B.; et al. DNA methylation profiling reveals common signatures of tumorigenesis and defines epigenetic prognostic subtypes of canine Diffuse Large B-cell Lymphoma. Sci. Rep. 2017, 7, 11591. [Google Scholar] [CrossRef]
- Cascione, L.; Giudice, L.; Ferraresso, S.; Marconato, L.; Giannuzzi, D.; Napoli, S.; Bertoni, F.; Giugno, R.; Aresu, L. Long non-coding RNAs as molecular signatures for canine B-cell lymphoma characterization. Non-Coding RNA 2019, 5, 47. [Google Scholar] [CrossRef] [PubMed]
- Chakraborty, S.; Hose, M.I.; Ahmed, M.; Shekhar, H.U. Onco-Multi-OMICS approach: A new frontier in cancer research. BioMed Res. Int. 2018, 2018, 9836256. [Google Scholar] [CrossRef] [PubMed]
- Sun, X.; Yi, J.; Yang, J.; Han, Y.; Qian, X.; Liu, Y.; Li, Y.; Lu, B.; Zhang, J.; Pan, X.; et al. An integrated epigenomic-transcriptomic landscape of lung cancer reveals novel methylation driver genes of diagnostic and therapeutic relevance. Theranostics 2021, 11, 5346–5364. [Google Scholar] [CrossRef] [PubMed]
- Zhu, H.; Wang, G.; Qian, J. Transcription factors as readers and effectors of DNA methylation. Nat. Rev. Genet. 2016, 17, 551–565. [Google Scholar] [CrossRef] [PubMed]
- Yin, Y.; Morgunova, E.; Jolma, A.; Kaasinen, E.; Sahu, B.; Khund-Sayeed, S.; Das, P.K.; Kivioja, T.; Dave, K.; Zhong, F.; et al. Impact of cytosine methylation on DNA binding specificities of human transcription factors. Science 2017, 356, eaaj2239. [Google Scholar] [CrossRef] [PubMed]
- Héberlé, E.; Bardet, A.F. Sensitivity of transcription factors to DNA methylation. Essays Biochem. 2019, 63, 727–741. [Google Scholar] [CrossRef] [PubMed]
- Kulis, M.; Esteller, M. DNA methylation and cancer. Adv. Genet. 2010, 70, 27–56. [Google Scholar] [CrossRef]
- Fujiwara-Igarashi, A.; Goto-Koshino, Y.; Mochizuki, H.; Sato, M.; Fujino, Y.; Ohno, K.; Tsujimoto, H. Inhibition of p16 tumor suppressor gene expression via promoter hypermethylation in canine lymphoid tumor cells. Res. Vet. Sci. 2014, 97, 60–63. [Google Scholar] [CrossRef] [PubMed]
- Sato, M.; Mochizuki, H.; Goto-Koshino, Y.; Fujiwara-Igarashi, A.; Takahashi, M.; Fujino, Y.; Ohno, K.; Tsujimoto, H. Hypermethylation of the death-associated protein kinase CpG island in canine B-cell lymphoid tumors. Vet. Immunol. Immunopathol. 2014, 161, 222–231. [Google Scholar] [CrossRef]
- Tomiyasu, H.; Goto-Koshino, Y.; Fujino, Y.; Ohno, K.; Tsujimoto, H. Epigenetic regulation of the ABCB1 gene in drug-sensitive and drug-resistant lymphoid tumour cell lines obtained from canine patients. Vet. J. 2014, 199, 103–109. [Google Scholar] [CrossRef] [PubMed]
- Da Ros, S.; Aresu, L.; Ferraresso, S.; Zorzan, E.; Gaudio, E.; Bertoni, F.; Dacasto, M.; Giantin, M. Validation of epigenetic mechanisms regulating gene expression in canine B-cell lymphoma: An in vitro and in vivo approach. PLoS ONE. 2018, 13, e0208709. [Google Scholar] [CrossRef]
- Ferraresso, S.; Bresolin, S.; Aricò, A.; Comazzi, S.; Gelain, M.E.; Riondato, F.; Bargelloni, L.; Marconato, L.; Te Kronnie, G.; Aresu, L. Epigenetic silencing of TFPI-2 in canine diffuse B-cell lymphoma. PLoS ONE 2014, 9, e92707. [Google Scholar] [CrossRef]
- Pan, H.; Jiang, Y.; Boi, M.; Tabbò, F.; Redmond, D.; Nie, K.; Ladetto, M.; Chiappella, A.; Cerchietti, L.; Shaknovich, R.; et al. Epigenomic evolution in diffuse large B-cell lymphomas. Nat. Commun. 2015, 6, 6921. [Google Scholar] [CrossRef] [PubMed]
- Cogan, J.C.; Liu, Y.; Amengual, J.E. Hypomethylating agents in lymphoma. Curr. Treat. Options Oncol. 2020, 21, 61. [Google Scholar] [CrossRef] [PubMed]
- Rütgen, B.C.; Hammer, S.E.; Gerner, W.; Christian, M.; de Arespacochaga, A.G.; Willmann, M.; Kleiter, M.; Schwendenwein, I.; Saalmüller, A. Establishment and characterization of a novel canine B-cell line derived from a spontaneously occurring diffuse large cell lymphoma. Leuk. Res. 2010, 34, 932–938. [Google Scholar] [CrossRef] [PubMed]
- Inohara, N.; Koseki, T.; Chen, S.; Wu, X.; Núñez, G. CIDE, a novel family of cell death activators with homology to the 45 kDa subunit of the DNA fragmentation factor. EMBO J. 1998, 17, 2526–2533. [Google Scholar] [CrossRef] [PubMed]
- Erdtmann, L.; Franck, N.; Lerat, H.; Le Seyec, J.; Gilot, D.; Cannie, I.; Gripon, P.; Hibner, U.; Guguen-Guillouzo, C. The hepatitis C virus NS2 protein is an inhibitor of CIDE-B-induced apoptosis. J. Biol. Chem. 2003, 278, 18256–18264. [Google Scholar] [CrossRef] [PubMed]
- Liu, K.; Zhou, S.; Kim, J.Y.; Tillison, K.; Majors, D.; Rearick, D.; Lee, J.H.; Fernandez-Boyanapalli, R.F.; Barricklow, K.; Houston, M.S.; et al. Functional analysis of FSP27 protein regions for lipid droplet localization, caspase dependent apoptosis, and dimerization with CIDEA. Am. J. Physiol. Endocrinol. Metab. 2009, 297, E1395–E1413. [Google Scholar] [CrossRef] [PubMed]
- Huang, Y.W.; Luo, J.; Weng, Y.I.; Mutch, D.G.; Goodfellow, P.J.; Miller, D.S.; Huang, T.H.M. Promoter hypermethylation of CIDEA, HAAO and RXFP3 associated with microsatellite instability in endometrial carcinomas. Gynecol. Oncol. 2010, 117, 239–247. [Google Scholar] [CrossRef]
- Gao, Y.P.; Li, L.; Yan, J.; Hou, X.X.; Chang, Z.W.; Guan, X.Y.; Qin, Y.R. Down-regulation of CIDEA promoted tumor growth and contributed to cisplatin resistance by regulating the JNK-p21/Bad signalling pathways in esophageal squamous cell carcinoma. Front. Oncol. 2021, 10, 627845. [Google Scholar] [CrossRef] [PubMed]
- Rubio-Ramos, A.; Labat-de-Hoz, L.; Correas, I.; Alonso, M.A. The MAL protein, an integral component of specialized membranes, in normal cells and cancer. Cells 2021, 10, 1065. [Google Scholar] [CrossRef]
- Lara-Lemus, R. On the role of myelin and lymphocyte protein (MAL) in cancer: A puzzle with two faces. J. Cancer 2019, 10, 2312–2318. [Google Scholar] [CrossRef] [PubMed]
- Mimori, K.; Shiraishi, T.; Mashino, K.; Sonoda, H.; Yamashita, K.; Yoshinaga, K.; Masuda, T.; Utsunomiya, T.; Alonso, M.A.; Inoue, H.; et al. MAL gene expression in esophageal cancer suppresses motility, invasion and tumorigenicity and enhances apoptosis through the Fas pathway. Oncogene 2003, 22, 3463–3471. [Google Scholar] [CrossRef] [PubMed][Green Version]
- Overmeer, R.M.; Henken, F.E.; Bierkens, M.; Wilting, S.M.; Timmerman, I.; Meijer, C.J.L.M.; Snijders, P.J.F.; Steenbergen, R.D.M. Repression of MAL tumour suppressor activity by promoter methylation during cervical carcinogenesis. J. Pathol. 2009, 219, 327–336. [Google Scholar] [CrossRef] [PubMed]
- Kohno, T.; Moriuchi, R.; Katamine, S.; Yamada, Y.; Tomonaga, M.; Matsuyama, T. Identification of genes associated with the progression of adult T cell leukemia (ATL). Jpn. J. Cancer Res. 2000, 91, 1103–1110. [Google Scholar] [CrossRef] [PubMed]
- Chan, J.K.C. Mediastinal large B-cell lymphoma: New evidence in support of its distinctive identity. Adv. Anat. Pathol. 2000, 7, 201–209. [Google Scholar] [CrossRef]
- Copie-Bergman, C.; Plonquet, A.; Alonso, M.A.; Boulland, M.L.; Marquet, J.; Divine, M.; Möller, P.; Leroy, K.; Gaulard, P. MAL Expression in Lymphoid Cells: Further evidence for MAL as a distinct molecular marker of primary mediastinal large B-Cell lymphomas. Mod. Pathol. 2002, 15, 1172–1180. [Google Scholar] [CrossRef] [PubMed]
- Copie-Bergman, C.; Gaulard, P.; Maouche-Chretien, L.; Brière, J.; Haioun, C.; Alonso, M.A.; Roméo, P.H.; Leroy, K. The MAL gene is expressed in primary mediastinal large B-cell lymphoma. Blood 1999, 94, 3567–3575. [Google Scholar] [CrossRef] [PubMed]
- Lind, G.E.; Ahlquist, T.; Kolberg, M.; Berg, M.; Eknaes, M.; Alonso, M.A.; Kallioniemi, A.; Meling, G.I.; Skotheim, R.I.; Rognum, T.O.; et al. Hypermethylated MAL gene—A silent marker of early colon tumorigenesis. J. Transl. Med. 2008, 6, 13. [Google Scholar] [CrossRef] [PubMed]
- Buffart, T.E.; Overmeer, R.M.; Steenbergen, R.D.; Tijssen, M.; van Grieken, N.C.T.; Snijders, P.J.F.; Gragsch, H.I.; van de Velde, C.J.H.; Carvalho, B.; Meijer, G.A. MAL promoter hypermethylation as a novel prognostic marker in gastric cancer. Br. J. Cancer 2008, 99, 1802–1807. [Google Scholar] [CrossRef] [PubMed]
- Suzuki, M.; Shiraishi, K.; Eguchi, A.; Ikeda, K.; Mori, T.; Yoshimoto, K.; Ohba, Y.; Yamada, T.; Ito, T.; Baba, Y.; et al. Aberrant methylation of LINE-1, SLIT2, MAL and IGFBP7 in non-small cell lung cancer. Oncol. Rep. 2013, 29, 1308–1314. [Google Scholar] [CrossRef] [PubMed]
- Kalmár, A.; Péterfia, B.; Hollósi, P.; Galamb, O.; Spisák, S.; Wichmann, B.; Bodor, A.; Tóth, K.; Patai, A.V.; Valcz, G.; et al. DNA hypermethylation and decreased mRNA expression of MAL, PRIMA1, PTGDR and SFRP1 in colorectal adenoma and cancer. BMC Cancer 2015, 15, 736. [Google Scholar] [CrossRef]
- Choi, B.; Han, T.S.; Min, J.; Hur, K.; Lee, S.M.; Lee, H.J. MAL and TMEM220 are novel DNA methylation markers in human gastric cancer. Biomarkers 2017, 22, 35–44. [Google Scholar] [CrossRef] [PubMed]
- Del Pino, M.; Sierra, A.; Marimon, L.; Delgado, C.M.; Rodriguez-Trujillo, A.; Bernadas, E.; Saco, A.; Torné, A.; Ordi, J. CADM1, MAL, and miR124 promoter methylation as biomarkers of transforming cervical intrepithelial lesions. Int. J. Mol. Sci. 2019, 20, 2262. [Google Scholar] [CrossRef] [PubMed]
- Haruki, S.; Imoto, I.; Kozaki, K.; Matsui, T.; Kawachi, H.; Komatsu, S.; Muramatsu, T.; Shimada, Y.; Kawano, T.; Inazawa, J. Frequent silencing of protocadherin 17, a candidate tumour suppressor for esophageal squamous cell carcinoma. Carcinogenesis 2010, 31, 1027–1036. [Google Scholar] [CrossRef] [PubMed]
- Hu, X.; Sui, X.; Li, L.; Huang, X.; Rong, R.; Su, X.; Shi, Q.; Mo, L.; Shu, X.; Kuang, Y.; et al. Protocadherin 17 acts as a tumour suppressor inducing tumour cell apoptosis and autophagy, and is frequently methylated in gastric and colorectal cancers. J. Pathol. 2013, 229, 62–73. [Google Scholar] [CrossRef] [PubMed]
- Luo, Z.G.; Li, Z.G.; Gui, S.L.; Chi, B.J.; Ma, J.G. Protocadherin-17 promoter methylation in serum-derived DNA is associated with poor prognosis of bladder cancer. J. Int. Med. Res. 2014, 42, 35–41. [Google Scholar] [CrossRef] [PubMed]
- Yang, S.; Dai, Z.; Li, W.; Wang, R.; Huang, D. Aberrant promoter methylation reduced the expression of protocadherin 17 in nasopharyngeal cancer. Biochem. Cell Biol. 2019, 97, 364–368. [Google Scholar] [CrossRef] [PubMed]
- Lv, J.; Zhu, P.; Yang, Z.; Li, M.; Zhang, X.; Cheng, J.; Chen, X.; Lu, F. PCDH20 functions as a tumour-suppressor gene through antagonizing the Wnt/beta-catenin signalling pathway in hepatocellular carcinoma. J. Viral Hepat. 2015, 22, 201–211. [Google Scholar] [CrossRef] [PubMed]
- Zhao, Y.; Yang, Y.; Trovik, J.; Sun, K.; Zhou, L.; Jiang, P.; Lau, T.S.; Hoivik, E.A.; Salvesen, H.B.; Sun, H.; et al. A Novel Wnt Regulatory Axis in Endometrioid Endometrial Cancer. Cancer Res. 2014, 74, 5103–5117. [Google Scholar] [CrossRef] [PubMed]
- Yin, X.; Xiang, T.; Mu, J.; Mao, H.; Li, L.; Huang, X.; Li, C.; Feng, Y.; Luo, X.; Wei, Y.; et al. Protocadherin 17 functions as a tumor suppressor suppressing Wnt/β-catenin signaling and cell metastasis and is frequently methylated in breast cancer. Oncotarget 2016, 7, 51720–51732. [Google Scholar] [CrossRef]
- Uyen, L.T.N.; Amano, Y.; Al-Kzayer, L.F.Y.; Kubota, N.; Kobayashi, J.; Nakazawa, Y.; Koike, K.; Sakashita, K. PCDH17 functions as a common tumor suppressor gene in acute leukemia and its transcriptional downregulation is mediated primarily by aberrant histone acetylation, not DNA methylation. Int. J. Hematol. 2020, 111, 451–462. [Google Scholar] [CrossRef] [PubMed]
- Gros, C.; Fahy, J.; Halby, L.; Dufau, I.; Erdmann, A.; Gregoire, J.M.; Ausseil, F.; Vispé, S.; Arimondo, P.B. DNA methylation inhibitors in cancer: Recent and future approaches. Biochimie 2012, 94, 2280–2296. [Google Scholar] [CrossRef] [PubMed]
- Marchi, E.; Zullo, K.M.; Amengual, J.E.; Kalac, M.; Bongero, D.; McIntosh, C.M.; Fogli, L.K.; Rossi, M.; Zinzani, P.L.; Pileri, S.A.; et al. The combination of hypomethylating agents and histone deacetylase inhibitors produce marked synergy in preclinical models of T-cell lymphoma. Br. J. Haematol. 2015, 171, 215–226. [Google Scholar] [CrossRef]
- Lu, Y.C.; Chang, J.T.; Chan, E.C.; Chao, Y.K.; Yeh, T.S.; Chen, J.S.; Cheng, A.J. miR-196, an emerging cancer biomarker for digestive tract cancers. J. Cancer 2016, 7, 650–655. [Google Scholar] [CrossRef]
- Álvarez-Teijeiro, S.; Menéndez, S.T.; Villaronga, M.A.; Rodrigo, J.P.; Manterola, L.; de Villalaín, L.; de Vicente, J.C.; Alonso-Durán, L.; Fernández, M.P.; Lawrie, C.H.; et al. Dysregulation of miR-196b in head and neck cancers leads to pleioropic effects in the tumor cells and surrounding stromal fibroblasts. Sci. Rep. 2017, 7, 17785. [Google Scholar] [CrossRef]
- Xu, L.; Guo, Y.; Yan, W.; Cen, J.; Niu, Y.; Yan, Q.; He, H.; Chen, C.S.; Hu, S. High level of miR-196b at newly diagnosed pediatric acute myeloid leukemia predicts a poor outcome. EXCLI J. 2017, 16, 197–209. [Google Scholar] [CrossRef] [PubMed]
- Luo, M.; Sun, G.; Sun, J.W. MiR-196b affects the progression and prognosis of human LSCC through targeting PCDH-17. Auris Nasus Larynx 2019, 46, 583–592. [Google Scholar] [CrossRef]
- Ho, T.T.; He, X.; Mo, Y.Y.; Beck, W.T. Transient resistance to DNA damaging agents is associated with expression of microRNAs-135b and -196b in human leukemia cell lines. Int. J. Biochem. Mol. Biol. 2016, 7, 27–47. [Google Scholar]
- Pappalardi, M.B.; Keenan, K.; Cockerill, M.; Kellner, W.A.; Stowell, A.; Sherk, C.; Wong, K.; Pathuri, S.; Briand, J.; Steidel, M.; et al. Discovery of a first-in-class reversible DNMT1-selective inhibitor with improved tolerability and efficacy in acute myeloid leukemia. Nat. Cancer 2021, 2, 1002–1017. [Google Scholar] [CrossRef] [PubMed]
- Rajan, A.; Shi, H.; Xue, B. Class I and II histone deacetylase inhibitors differentially regulate thermogenic gene expression in brown adipocytes. Sci. Rep. 2018, 8, 13072. [Google Scholar] [CrossRef]
- Marek-Bukowiec, K.; Aguado, E.; Miazek, A. Phorbol ester-mediated re-expression of endogenous LAT adapter in J.CaM2 cells: A model for dissecting drivers and blockers of LAT transcription. Genes Immun. 2016, 17, 313–320. [Google Scholar] [CrossRef][Green Version]
- Yang, Y.; Liu, J.; Li, X.; Li, J.C. PCDH17 gene promoter demethylation and cell cycle arrest by genistein in gastric cancer. Histol. Histopathol. 2012, 27, 217–224. [Google Scholar] [CrossRef]
- Byzia, E.; Soloch, N.; Bodnar, M.; Szaumkessel, M.; Kiwerska, K.; Kostrzewska-Poczekaj, M.; Jarmuz-Szymczak, M.; Szylberg, L.; Wierzbicka, M.; Bartochowska, A.; et al. Recurrent transcriptional loss of the PCDH17 tumor suppressor in laryngeal squamous cell carcinoma is partially mediated by aberrant promoter DNA methylation. Mol. Carcinog. 2018, 57, 878–885. [Google Scholar] [CrossRef]
- Pettersson, A.T.; Laurencikiene, J.; Nordström, E.A.; Stenson, B.M.; van Harmelen, V.; Murphy, C.; Dahlman, I.; Rydén, M. Characterization of the human CIDEA promoter in fat cells. Int. J. Obes. 2008, 32, 1380–1387. [Google Scholar] [CrossRef]
- Viswakarma, N.; Yu, S.; Naik, S.; Kashireddy, P.; Matsumoto, K.; Sarkar, J.; Surapureddi, S.; Jia, Y.; Rao, M.S.; Reddy, J.K. Transcriptional regulation of Cidea, mitochondrial cell death-inducing DNA fragmentation factor alpha-like effector A, in mouse liver by peroxisome proliferator-activated receptor alpha and gamma. J. Biol. Chem. 2007, 282, 18613–18624. [Google Scholar] [CrossRef] [PubMed]
- Li, D.; Da, L.; Tang, H.; Li, T.; Zhao, M. CpG methylation plays a vital role in determining tissue- and cell-specific expression of the human cell-death-inducing DFF45-like effector A gene through the regulation of Sp1/Sp3 binding. Nucleic Acids Res. 2008, 36, 330–341. [Google Scholar] [CrossRef]
- Huang, D.; Ovcharenco, I. Epigenetic and genetic alterations and their influence on gene regulation in chronic lymphocytic leukemia. BMC Genom. 2017, 18, 236. [Google Scholar] [CrossRef] [PubMed]
- Beishline, K.; Azizkhan-Clifford, J. Sp1 and the ‘hallmarks of cancer’. FEBS J. 2015, 282, 224–258. [Google Scholar] [CrossRef]
- Tian, H.P.; Lun, S.M.; Huang, H.J.; He, R.; Kong, P.Z.; Wang, Q.S.; Li, X.Q.; Feng, Y.M. DNA methylation affects the SP1-regulated transcription of FOXF2 in breast cancer cells. J. Biol. Chem. 2015, 290, 19173–19183. [Google Scholar] [CrossRef]
- Tugores, A.; Rubio, T.; Rancaño, C.; Alonso, M.A. A tandem array of Sp-1 sites and a reverse initiator element are both required for synergistic transcriptional activation of the T-cell-specific MAL gene. DNA Cell Biol. 1997, 16, 245–255. [Google Scholar] [CrossRef] [PubMed]
- Long, Y.; Wang, L.; Li, Z. SP1-induced SNHG14 aggravates hypertrophic response in in vitro model of cardiac hypertrophy via up-regulation of PCDH17. J. Cell Mol. Med. 2020, 24, 7115–7126. [Google Scholar] [CrossRef]
- Pellikainen, J.M.; Kosma, V.M. Activator protein-2 in carcinogenesis with a special reference to breast cancer—A mini review. Int. J. Cancer 2007, 120, 2061–2067. [Google Scholar] [CrossRef] [PubMed]
- Kroes, R.A.; Moskal, J.R. The role of DNA methylation in ST6Gal1 expression in gliomas. Glicobiology 2016, 26, 1271–1283. [Google Scholar] [CrossRef] [PubMed]
- Bar-Eli, M. Gene regulation in melanoma progression by the AP-2 transcription factor. Pigment Cell Res. 2001, 14, 78–85. [Google Scholar] [CrossRef]
- Nagel, D.; Vincendeau, M.; Eitelhuber, A.C.; Krappmann, D. Mechanisms and consequences of constitutive NF-kB activation in B-cell lymphoid malignancies. Oncogene 2014, 33, 5655–5665. [Google Scholar] [CrossRef] [PubMed]
- Seelig, D.M.; Ito, D.; Forster, C.L.; Yoon, U.A.; Breen, M.; Burns, L.J.; Bachanova, V.; Lindblad-Toh, K.; O’Brien, T.D.; Schmechel, S.C.; et al. Constitutive activation of alternative nuclear factor kappa B pathway in canine diffuse large B-cell lymphoma contributes to tumor cell survival and is target of new adjuvant therapies. Leuk. Lymphoma 2017, 58, 1702–1710. [Google Scholar] [CrossRef] [PubMed]
- Wang, T.; Li, J.; Ding, K.; Zhang, L.; Che, Q.; Sun, X.; Dai, Y.; Bao, M.; Wang, X.; Yang, L.; et al. The CpG dinucleotide adjacent to a kB site affects NF-kB function through its methylation. Int. J. Mol. Sci. 2017, 18, 528. [Google Scholar] [CrossRef] [PubMed]
- Holmes, M.L.; Pridans, C.; Nutt, S.L. The regulation of the B-cell expression programme by Pax5. Immunol. Cell Biol. 2007, 86, 47–53. [Google Scholar] [CrossRef] [PubMed]
- Medvedovic, J.; Ebert, A.; Tagoh, H.; Busslinger, M. Pax5: A master regulator of B cell development and leukemogenesis. Adv. Immunol. 2011, 111, 179–206. [Google Scholar] [CrossRef] [PubMed]
- Palmisano, W.A.; Crume, K.P.; Grimes, M.J.; Winters, S.A.; Toyota, M.; Esteller, M.; Joste, N.; Baylin, S.B.; Belinsky, S.A. Aberrant promoter methylation of the transcription factor genes PAX5 alpha and beta in human cancers. Cancer Res. 2003, 63, 4620–4625. [Google Scholar] [PubMed]
- Brix, D.M.; Clemmensen, K.K.B.; Kallunki, T. Zinc finger transcription factor MZF1—a regulator of cancer invasion. Cells 2020, 9, 223. [Google Scholar] [CrossRef] [PubMed]
- Chen, H.; Jin, K.; Song, J.; Zuo, Q.; Yang, H.; Zhang, Y.; Li, B. Functional characterization of the Sox2, c-Myc, and Oct4 promoters. J. Cell Biochem. 2019, 120, 332–342. [Google Scholar] [CrossRef]
- Jia, N.; Wang, J.; Li, Q.; Tao, X.; Chang, K.; Hua, K.; Yu, Y.; Wong, K.K.; Feng, W. DNA methylation promotes paired box 2 expression via myeloid zinc finger 1 in endometrial cancer. Oncotarget 2016, 7, 84785–84797. [Google Scholar] [CrossRef] [PubMed]
- Lee, Y.K.; Park, U.H.; Kim, E.J.; Hwang, J.T.; Jeong, J.C.; Um, S.J. Tumor antigen PRAME is up-regulated by MZF1 in cooperation with DNA hypomethylation in melanoma cells. Cancer Lett. 2017, 403, 144–151. [Google Scholar] [CrossRef] [PubMed]
- Valli, V.E.; San Myint, M.; Barthel, A.; Bienzle, D.; Caswell, J.; Colbatzky, F.; Durham, A.; Ehrhart, E.J.; Johnson, Y.; Jones, C.; et al. Classification of canine malignant lymphomas according to the World Health Organization criteria. Vet. Pathol. 2011, 48, 198–211. [Google Scholar] [CrossRef]
- Aricò, A.; Giantin, M.; Gelain, M.E.; Riondato, F.; Comazzi, S.; Rütgen, B.C.; Essler, S.E.; Dacasto, M.; Castagnaro, M.; Aresu, L. The role of vascular endothelial growth factor and matrix metalloproteinases in canine lymphoma: In vivo and in vitro study. BMC Vet. Res. 2013, 9, 94. [Google Scholar] [CrossRef] [PubMed]
- Sabattini, S.; Lopparelli, R.M.; Rigillo, A.; Giantin, M.; Renzi, A.; Matteo, C.; Capitani, O.; Dacasto, M.; Mengoli, M.; Bettini, G. Canine Splenic Nodular Lymphoid Lesions: Immunophenotyping, Proliferative Activity, and Clonality Assessment. Vet. Pathol. 2018, 55, 645–653. [Google Scholar] [CrossRef] [PubMed]
- Herman, J.G.; Graff, J.R.; Myöhänen, S.; Nelkin, B.D.; Baylin, S.B. Methylation-specific PCR: A novel PCR assay for methylation status of CpG islands. Proc. Natl. Acad. Sci. USA 1996, 93, 9821–9826. [Google Scholar] [CrossRef]
- Hernández, H.G.; Tse, M.Y.; Pang, S.C.; Arboleda, H.; Forero, D.A. Optimizing methodologies for PCR-based DNA methylation analysis. Biotechniques 2013, 55, 181–197. [Google Scholar] [CrossRef]
- Zeschnigk, M.; Böhringer, S.; Price, E.A.; Onadim, Z.; Masshöfer, L.; Lohmann, D.R. A novel real-time PCR assay for quantitative analysis of methylated alleles (QAMA): Analysis of the retinoblastoma locus. Nucleic Acids Res. 2004, 32, e125. [Google Scholar] [CrossRef]
- Giantin, M.; Rahnasto-Rilla, M.; Tolosi, R.; Lucatello, L.; Pauletto, M.; Guerra, G.; Pezzato, F.; Lopparelli, R.M.; Merlanti, R.; Carnier, P.; et al. Functional impact of cytochrome P450 3A (CYP3A) missense variants in cattle. Sci. Rep. 2019, 9, 19672. [Google Scholar] [CrossRef] [PubMed]
- Cartharius, K.; Frech, K.; Grote, K.; Klocke, B.; Haltmeier, M.; Klingenhoff, A.; Frisch, M.; Bayerlein, M.; Werner, T. MatInspector and beyond: Promoter analysis based on transcription factor binding sites. Bioinformatics 2005, 21, 2933–2942. [Google Scholar] [CrossRef] [PubMed]
- Quandt, K.; Frech, K.; Karas, H.; Wingender, E.; Werner, T. MatInd and MatInspector: New fast and versatile tools for detection of consensus matches in nucleotide sequence data. Nucleic Acids Res. 1995, 23, 4878–4884. [Google Scholar] [CrossRef] [PubMed]
- Farré, D.; Roset, R.; Huerta, M.; Adsuara, J.E.; Roselló, L.; Albà, M.M.; Messeguer, X. Identification of patterns in biological sequences at the ALGGEN server: PROMO and MALGEN. Nucleic Acids Res. 2003, 31, 3651–3653. [Google Scholar] [CrossRef]
- Messeguer, X.; Escudero, R.; Farré, D.; Núñez, O.; Martínez, J.; Albà, M.M. PROMO: Detection of known transcription regulatory elements using species-tailored searches. Bioinformatics 2002, 18, 333–334. [Google Scholar] [CrossRef]
- Tsunoda, T.; Takagi, T. Estimating transcription factor bindability on DNA. Bioinformatics 1999, 15, 622–630. [Google Scholar] [CrossRef]


Publisher’s Note: MDPI stays neutral with regard to jurisdictional claims in published maps and institutional affiliations. |
© 2022 by the authors. Licensee MDPI, Basel, Switzerland. This article is an open access article distributed under the terms and conditions of the Creative Commons Attribution (CC BY) license (https://creativecommons.org/licenses/by/4.0/).
Share and Cite
Zorzan, E.; Elgendy, R.; Guerra, G.; Da Ros, S.; Gelain, M.E.; Bonsembiante, F.; Garaffo, G.; Vitale, N.; Piva, R.; Marconato, L.; et al. Hypermethylation-Mediated Silencing of CIDEA, MAL and PCDH17 Tumour Suppressor Genes in Canine DLBCL: From Multi-Omics Analyses to Mechanistic Studies. Int. J. Mol. Sci. 2022, 23, 4021. https://doi.org/10.3390/ijms23074021
Zorzan E, Elgendy R, Guerra G, Da Ros S, Gelain ME, Bonsembiante F, Garaffo G, Vitale N, Piva R, Marconato L, et al. Hypermethylation-Mediated Silencing of CIDEA, MAL and PCDH17 Tumour Suppressor Genes in Canine DLBCL: From Multi-Omics Analyses to Mechanistic Studies. International Journal of Molecular Sciences. 2022; 23(7):4021. https://doi.org/10.3390/ijms23074021
Chicago/Turabian StyleZorzan, Eleonora, Ramy Elgendy, Giorgia Guerra, Silvia Da Ros, Maria Elena Gelain, Federico Bonsembiante, Giulia Garaffo, Nicoletta Vitale, Roberto Piva, Laura Marconato, and et al. 2022. "Hypermethylation-Mediated Silencing of CIDEA, MAL and PCDH17 Tumour Suppressor Genes in Canine DLBCL: From Multi-Omics Analyses to Mechanistic Studies" International Journal of Molecular Sciences 23, no. 7: 4021. https://doi.org/10.3390/ijms23074021
APA StyleZorzan, E., Elgendy, R., Guerra, G., Da Ros, S., Gelain, M. E., Bonsembiante, F., Garaffo, G., Vitale, N., Piva, R., Marconato, L., Aresu, L., Dacasto, M., & Giantin, M. (2022). Hypermethylation-Mediated Silencing of CIDEA, MAL and PCDH17 Tumour Suppressor Genes in Canine DLBCL: From Multi-Omics Analyses to Mechanistic Studies. International Journal of Molecular Sciences, 23(7), 4021. https://doi.org/10.3390/ijms23074021