
The Human Monocyte—A Circulating Sensor of Infection and a Potent and Rapid Inducer of Inflammation

 , ,
, , 
Abstract
:1. Introduction
2. Results
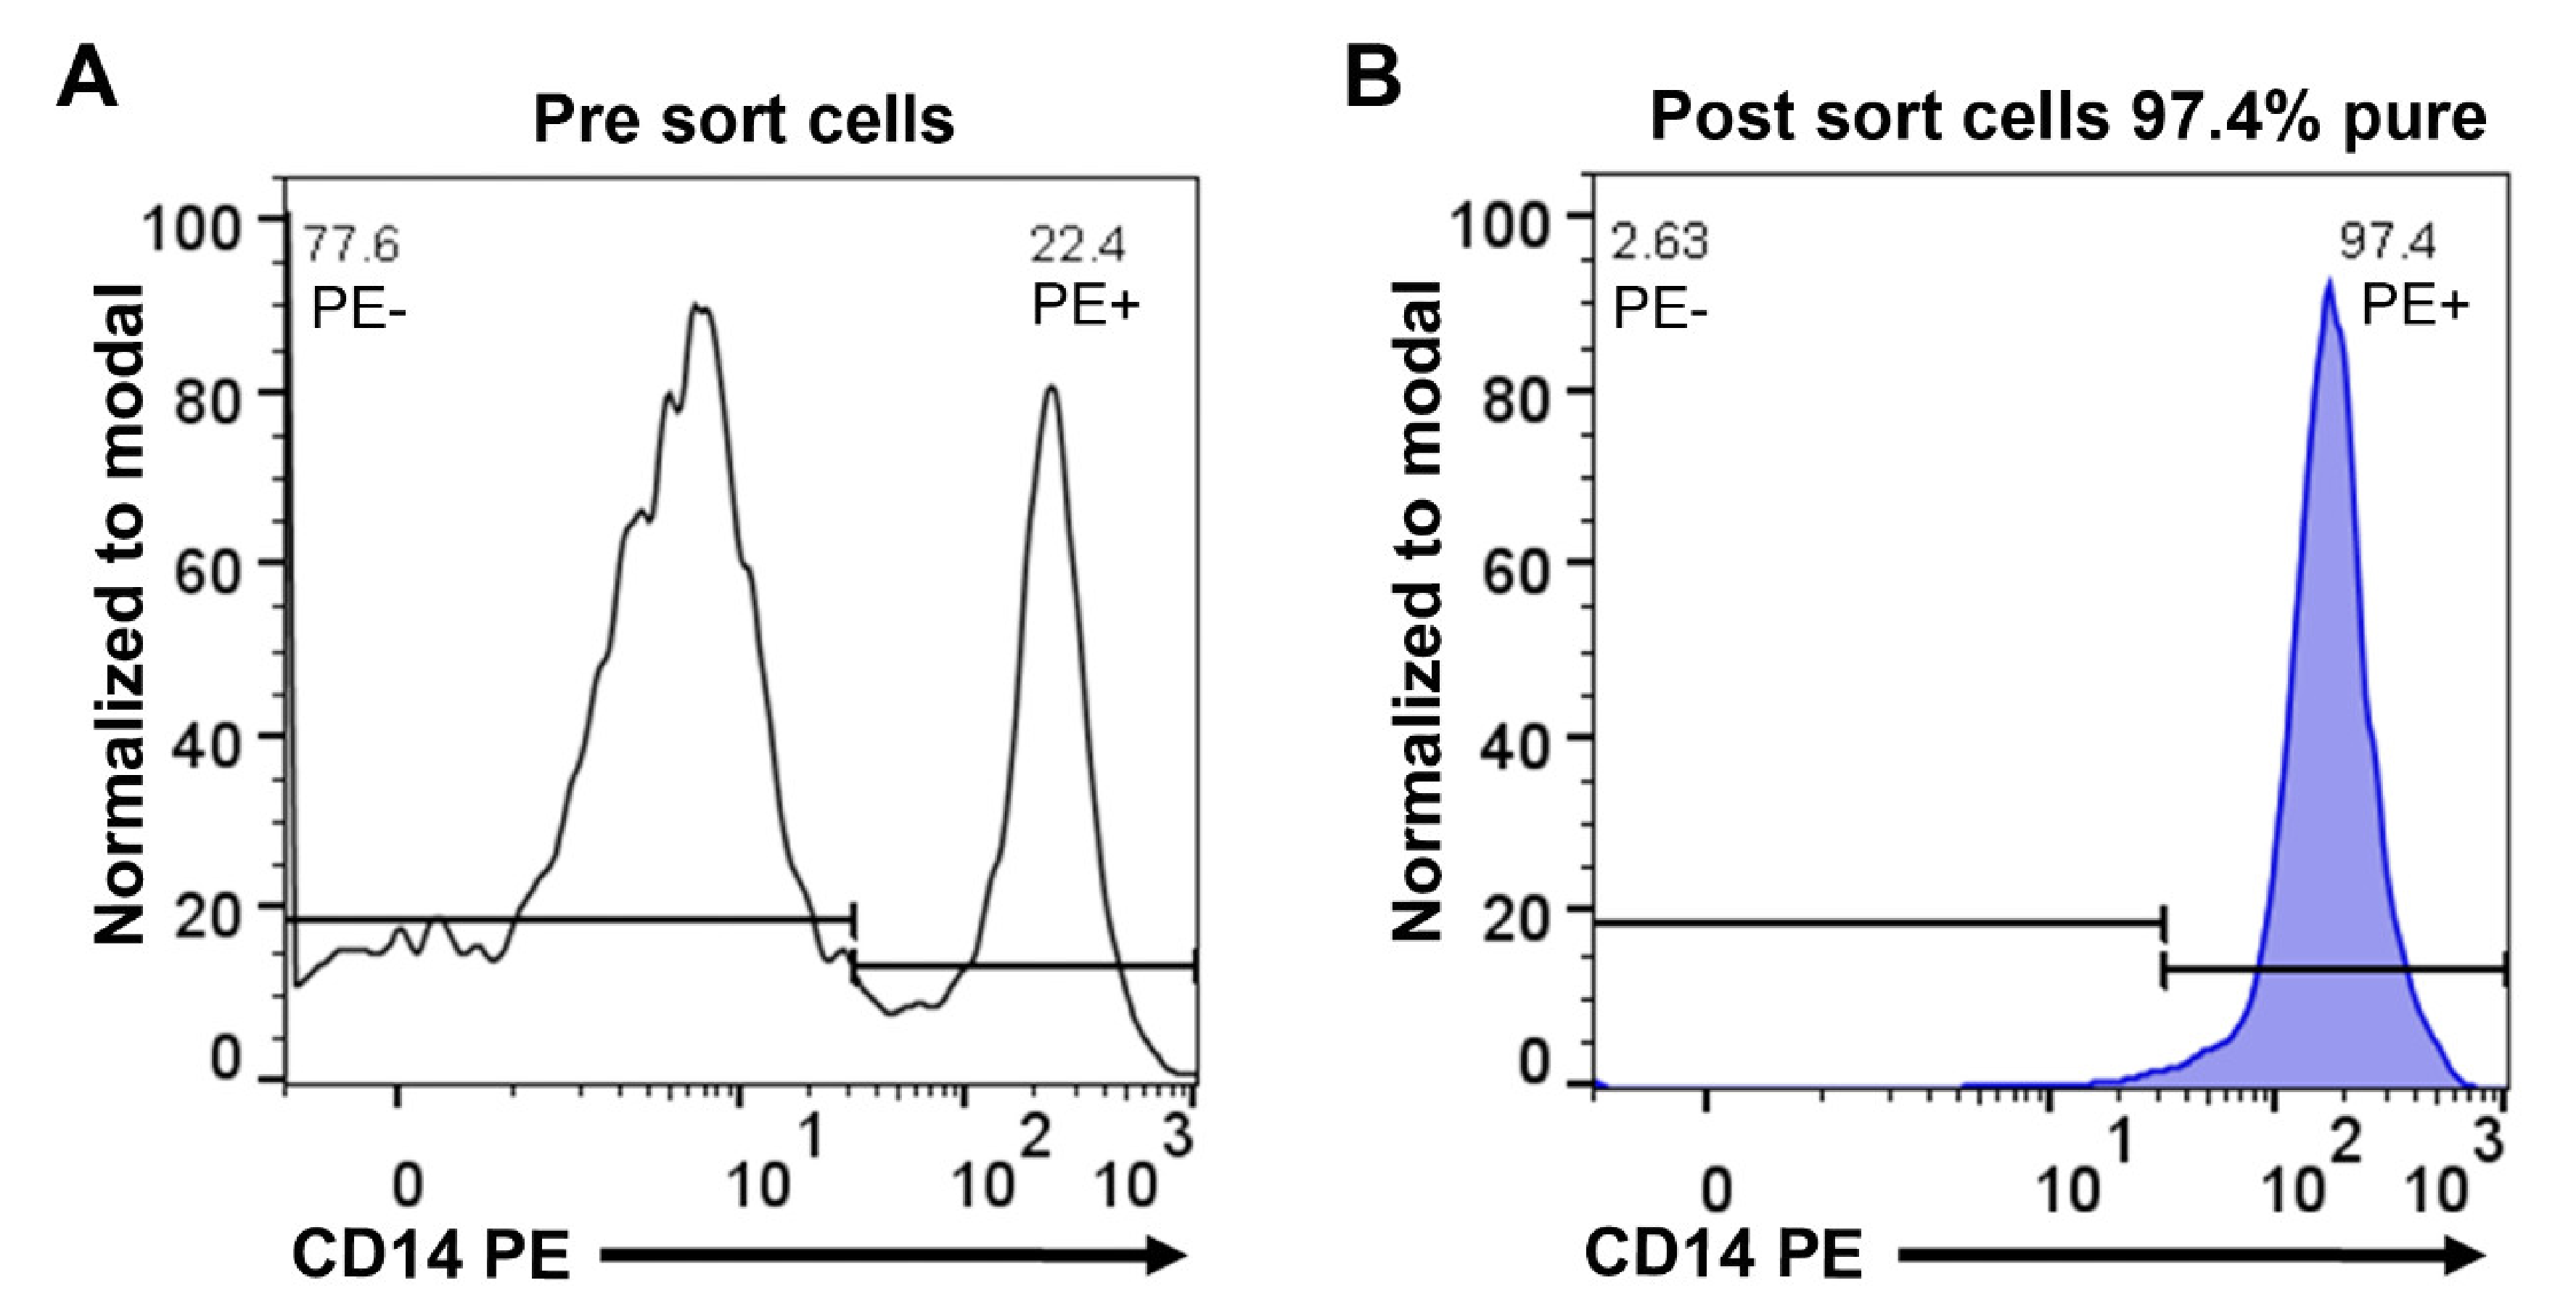
2.1. Purification of Monocytes from Human Peripheral Blood
2.2. In Vitro Culture of Purified Peripheral Blood Monocytes
2.3. Ampliseq Analysis of the Total Transcriptome of the Different Monocyte Samples
2.4. Influence of In Vitro Culture on the Monocyte Transcriptome
2.5. Lysozyme, MHC Molecules and Pattern Recognition Receptors and Other Immune-Related Molecules
2.6. Fc Receptors
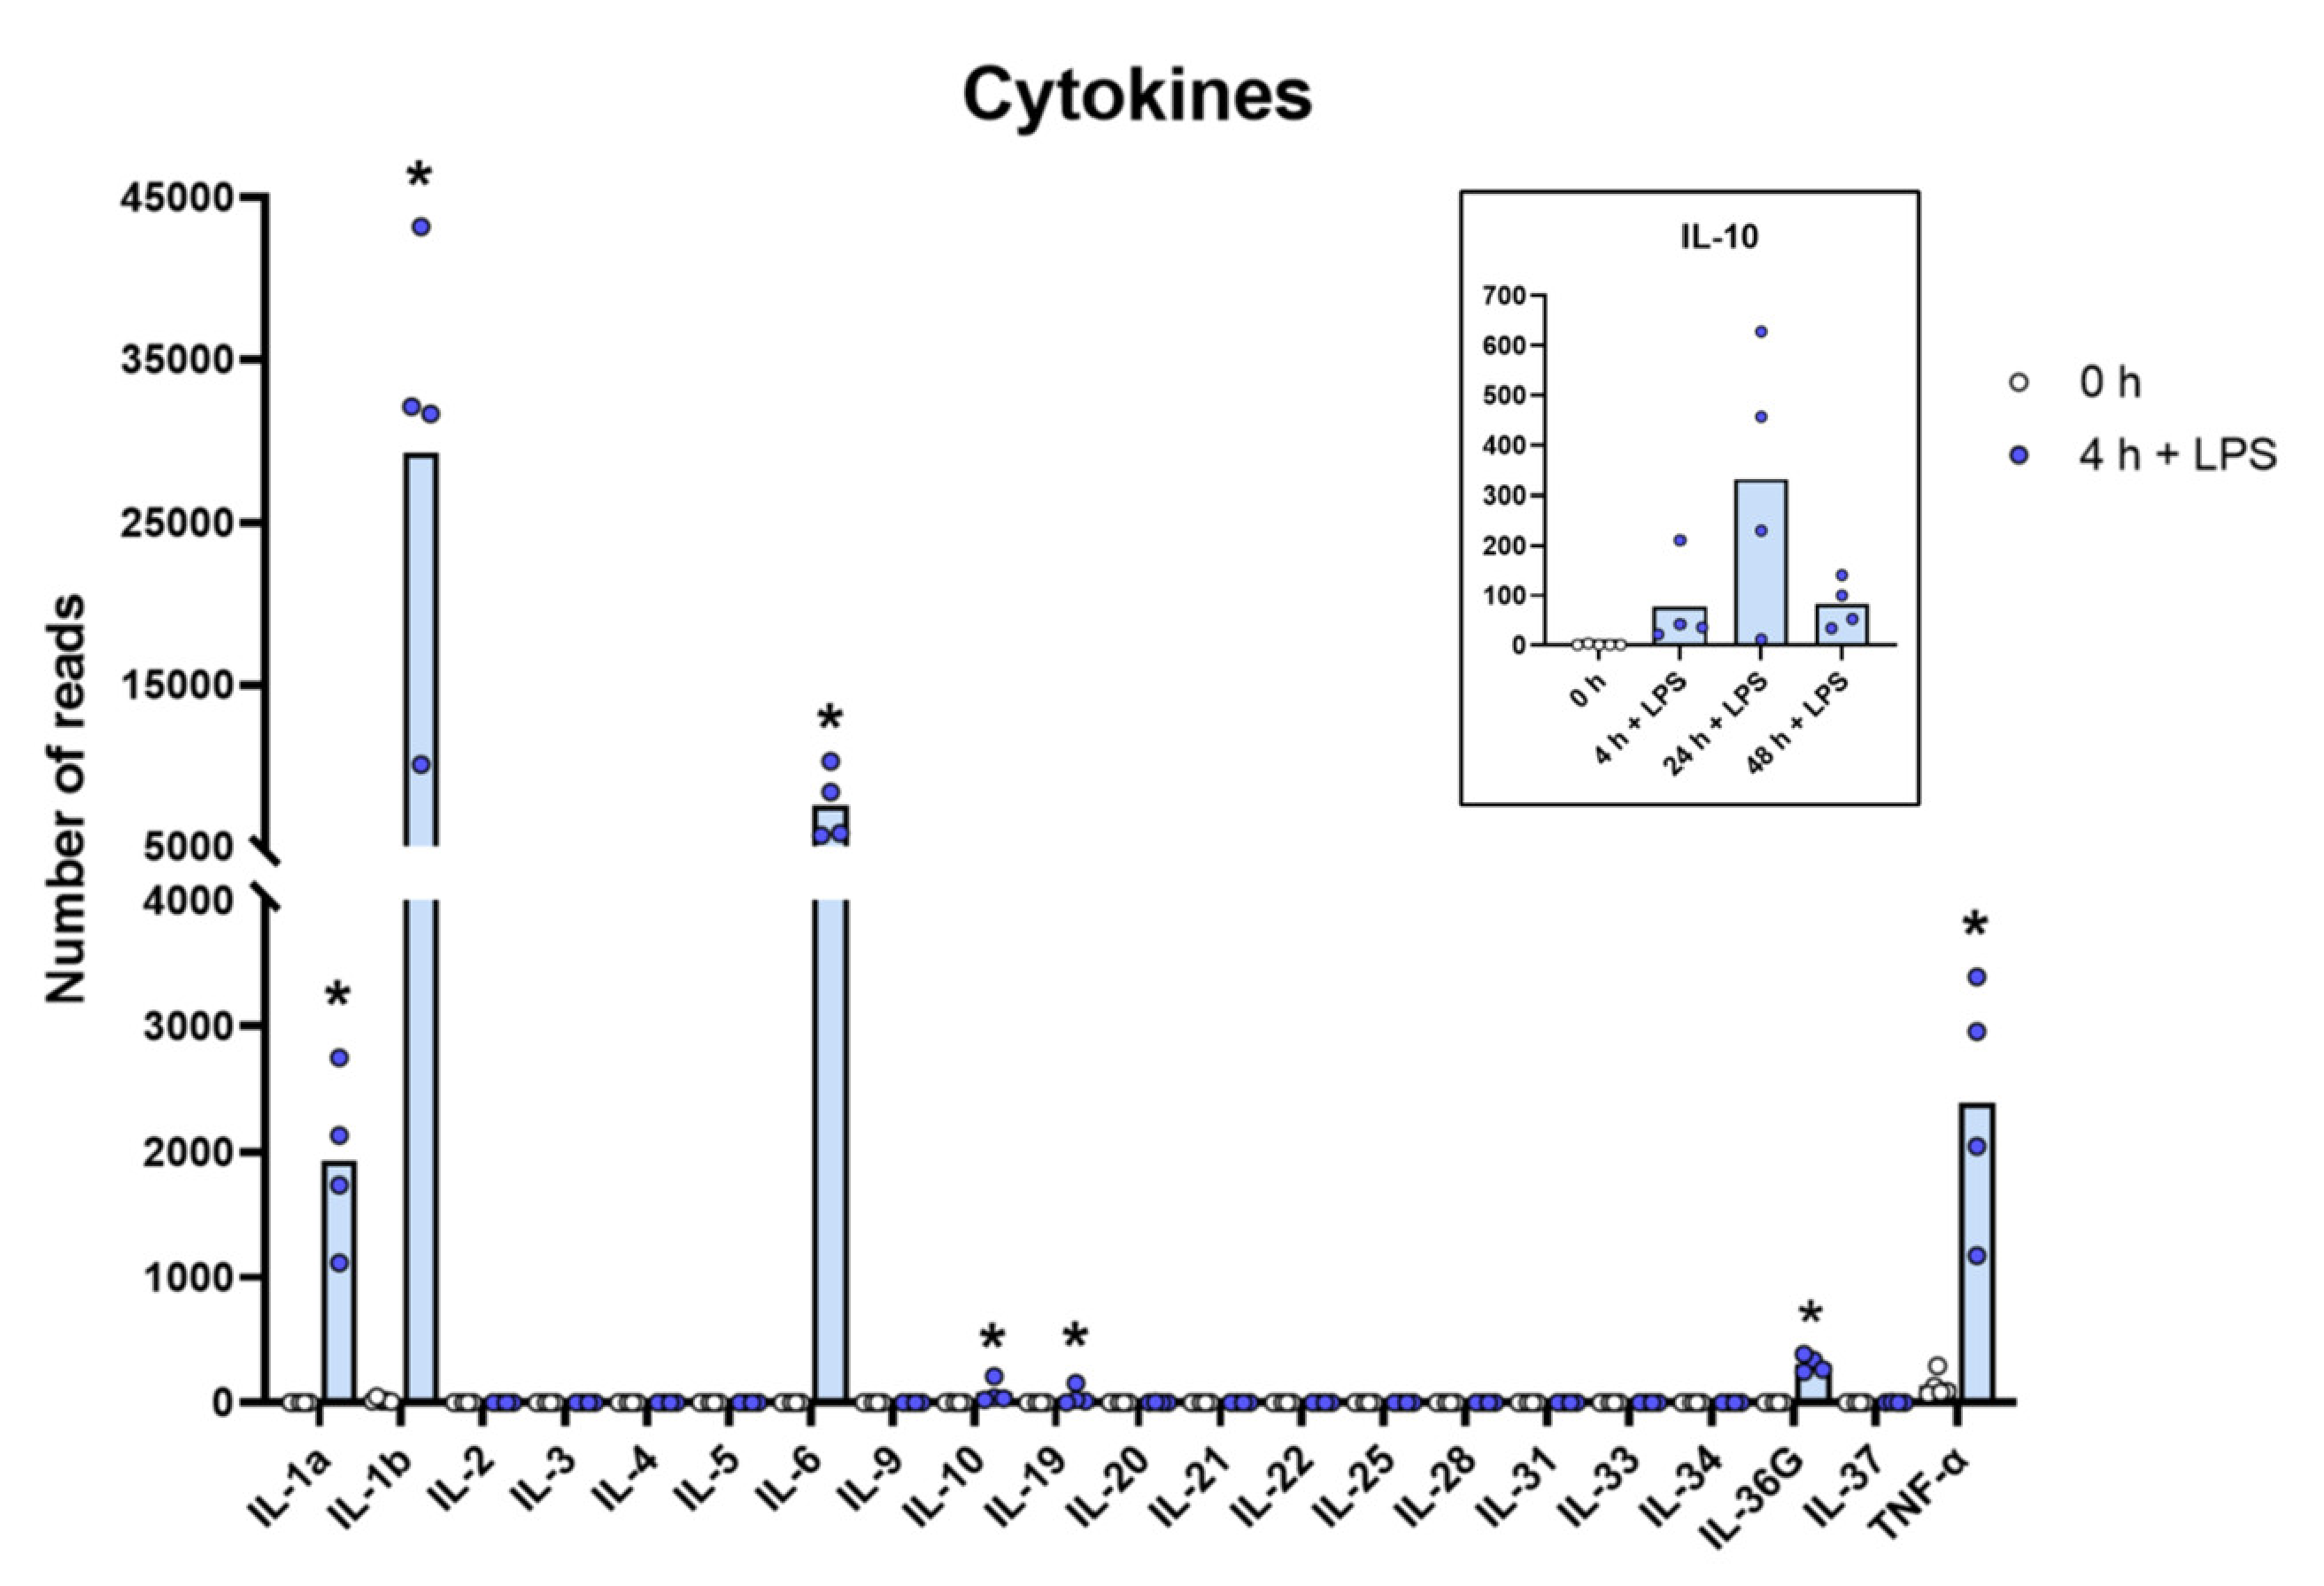
2.7. Cytokines
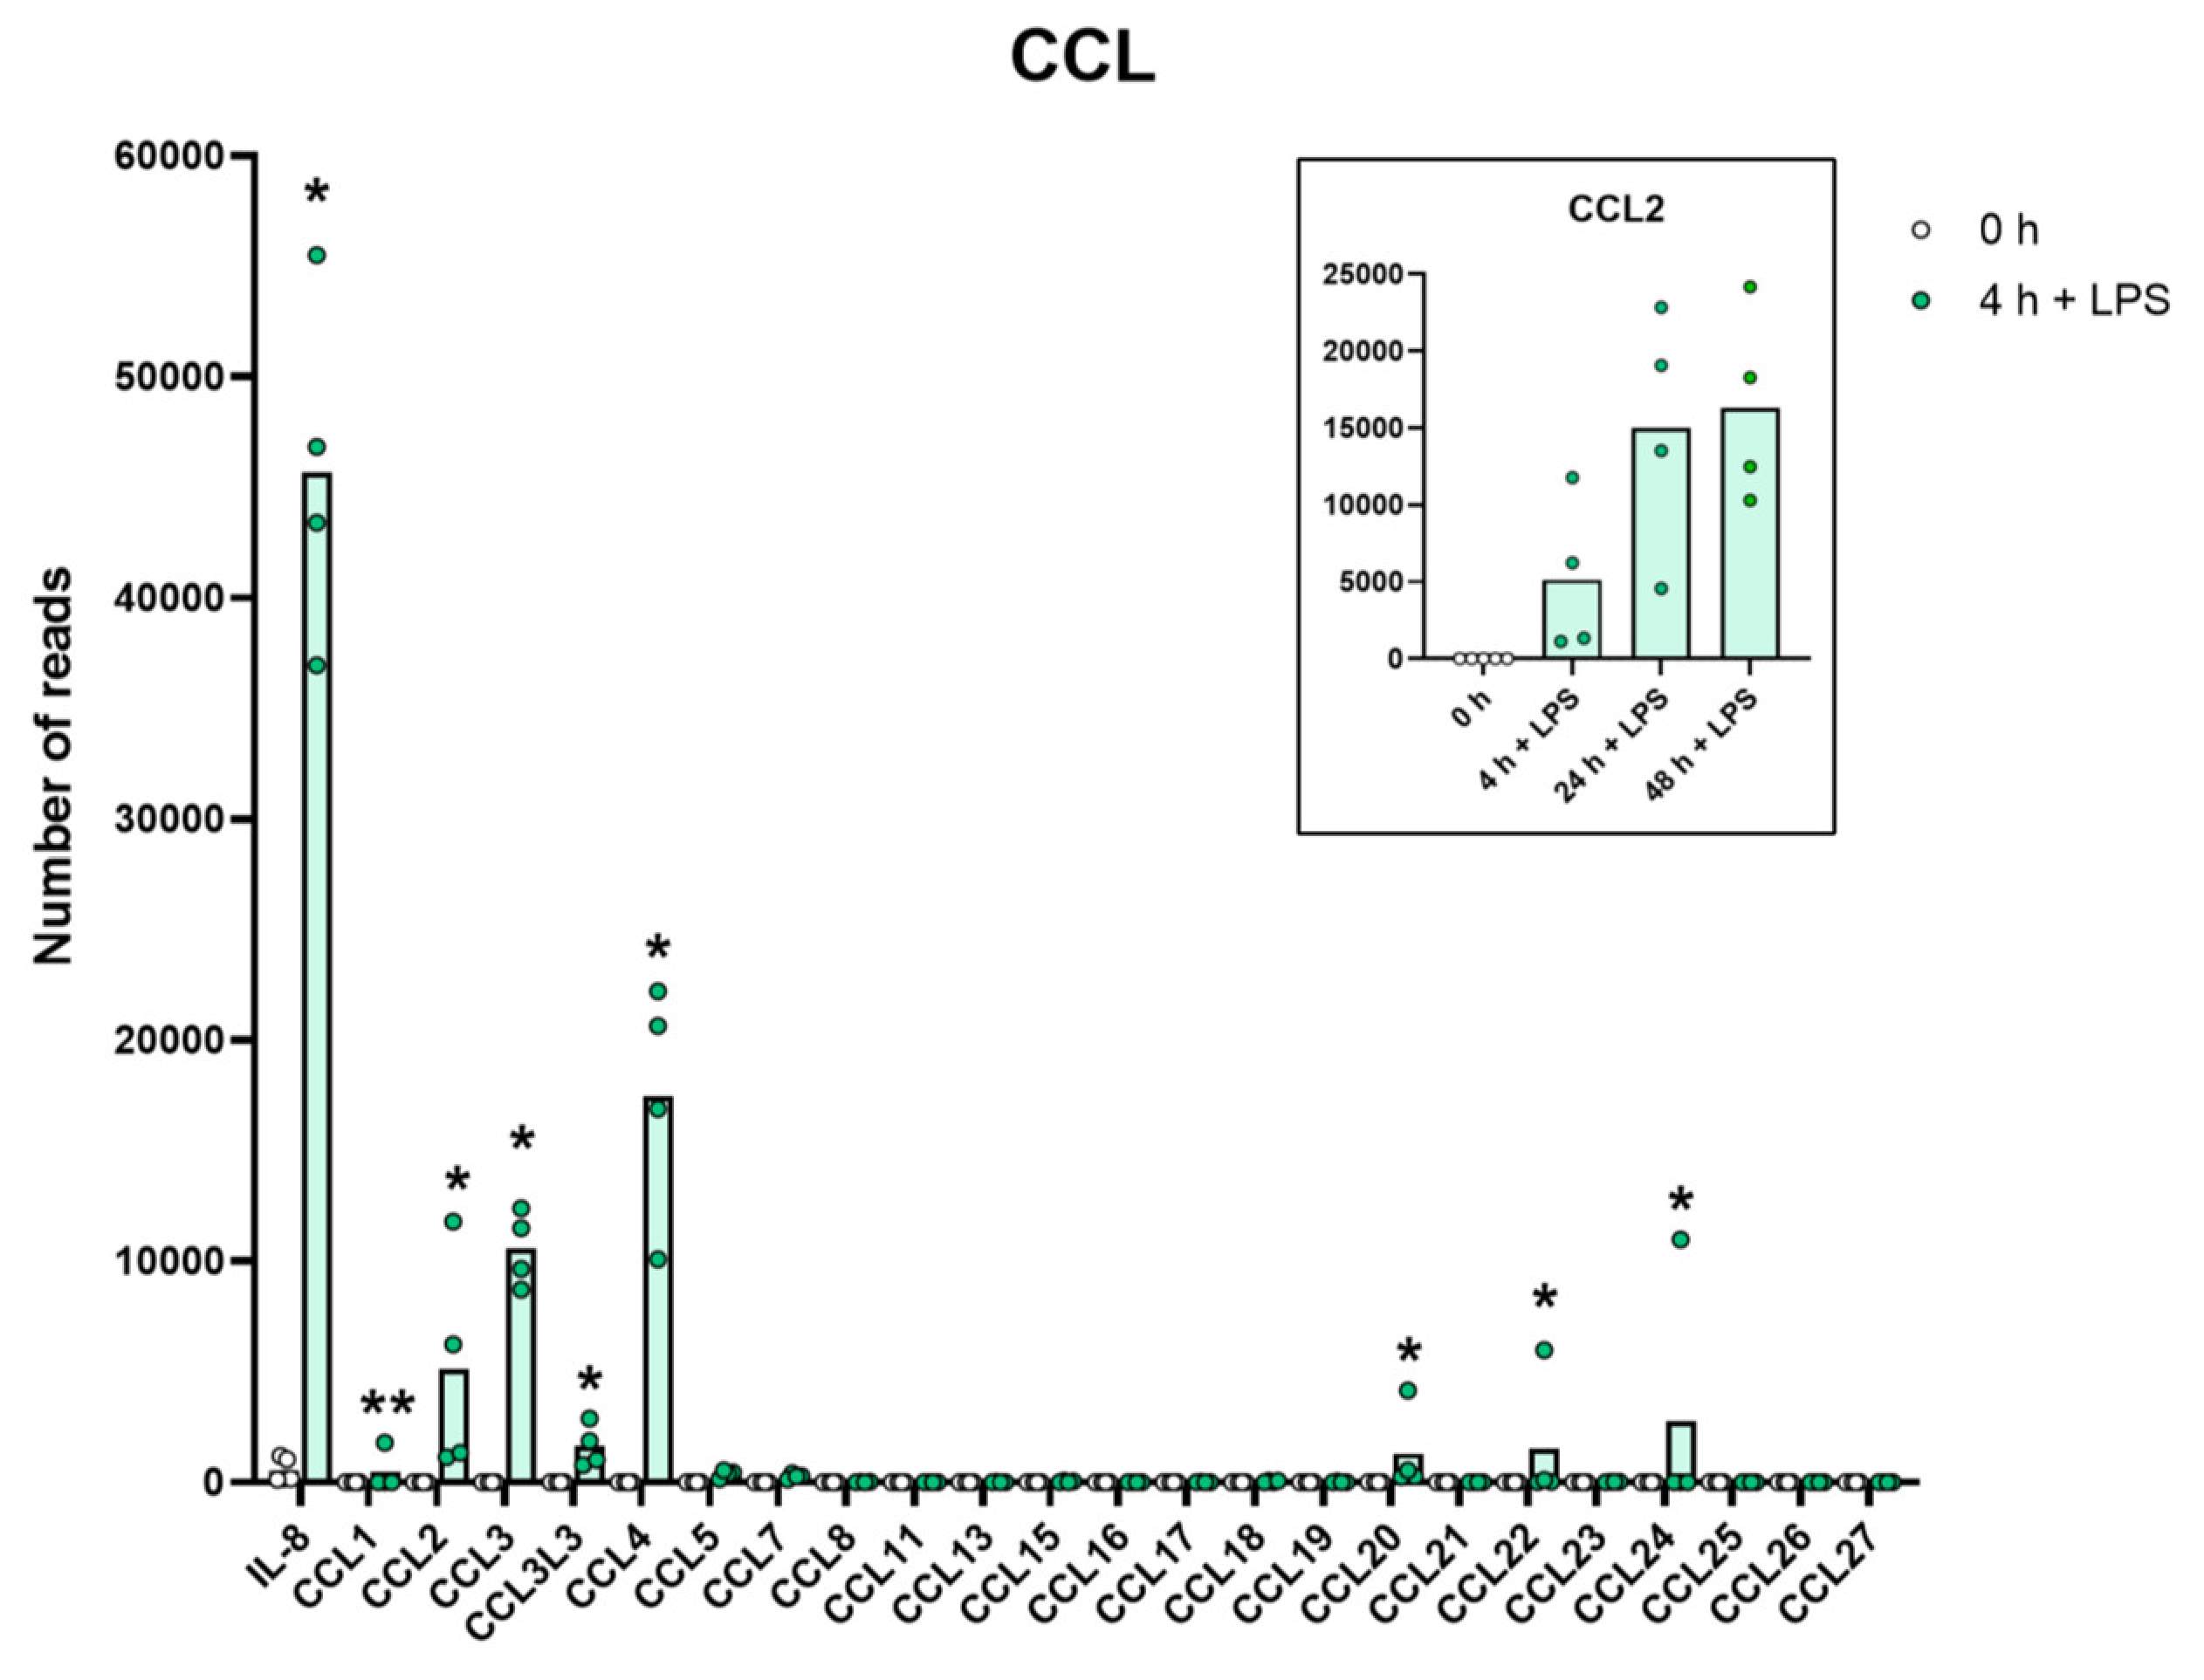
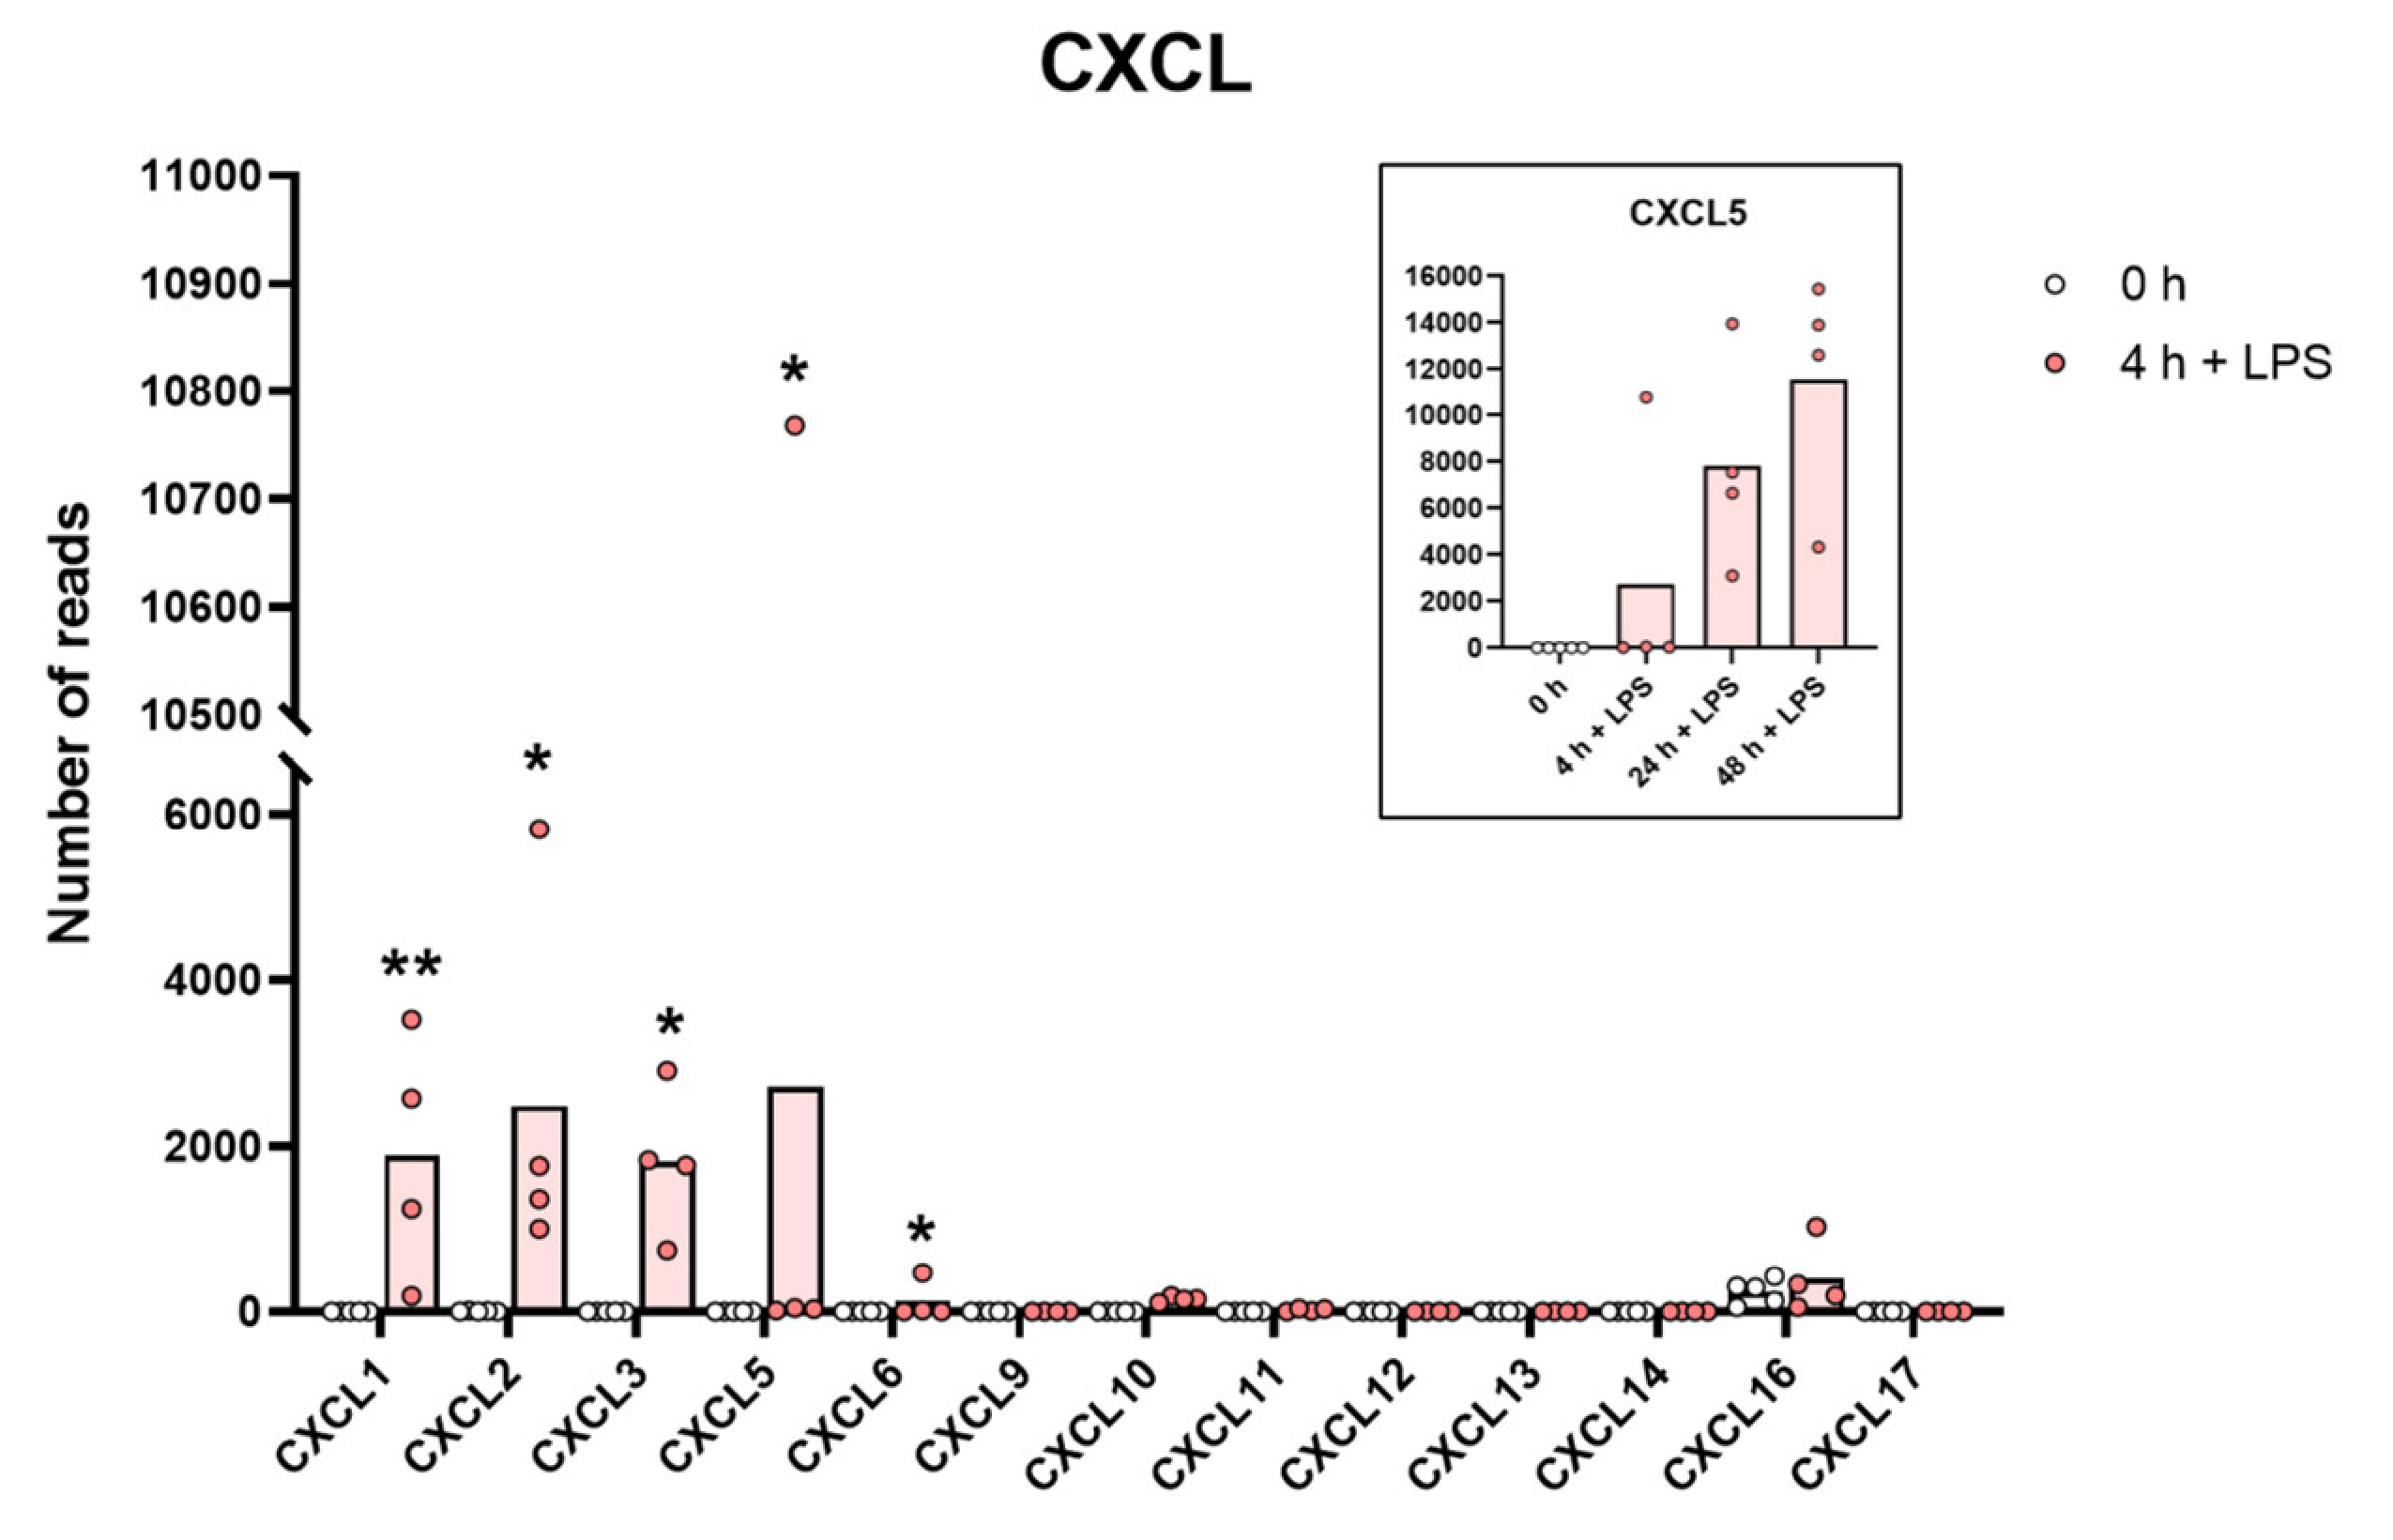
2.8. Chemokines
2.9. Receptors for Cytokines and Chemokines
2.10. Effect on the Monocyte Transcriptome by Culturing the Cells in the Presence of IFN-γ
3. Discussion
4. Materials and Methods
4.1. Purification of Monocytes from Human Peripheral Blood
4.2. Ampliseq Analysis of the Total Transcriptome
Supplementary Materials
Author Contributions
Funding
Data Availability Statement
Conflicts of Interest
References
- Sieweke, M.H.; Allen, J.E. Beyond stem cells: Self-renewal of differentiated macrophages. Science 2013, 342, 1242974. [Google Scholar] [CrossRef] [PubMed]
- Amit, I.; Winter, D.; Jung, S. The role of the local environment and epigenetics in shaping macrophage identity and their effect on tissue homeostasis. Nat. Immunol. 2016, 17, 18–25. [Google Scholar] [CrossRef] [PubMed]
- Perdiguero, E.G.; Klapproth, K.; Schulz, C.; Busch, K.; de Bruijn, M.; Rodewald, H.-R.; Geissmann, F. The Origin of Tissue-Resident Macrophages: When an Erythro-myeloid Progenitor Is an Erythro-myeloid Progenitor. Immunity 2015, 43, 1023–1024. [Google Scholar] [PubMed] [Green Version]
- Hoeffel, G.; Chen, J.; Lavin, Y.; Low, D.; Almeida, F.F.; See, P.; Beaudin, A.E.; Lum, J.; Low, I.; Forsberg, E.C.; et al. C-Myb(+) erythro-myeloid progenitor-derived fetal monocytes give rise to adult tissue-resident macrophages. Immunity 2015, 42, 665–678. [Google Scholar] [CrossRef] [PubMed] [Green Version]
- Ginhoux, F.; Greter, M.; Leboeuf, M.; Nandi, S.; See, P.; Gokhan, S.; Mehler, M.F.; Conway, S.J.; Ng, L.G.; Stanley, E.R.; et al. Fate mapping analysis reveals that adult microglia derive from primitive macrophages. Science 2010, 330, 841–845. [Google Scholar] [CrossRef] [Green Version]
- Kierdorf, K.; Erny, D.; Goldmann, T.; Sander, V.; Schulz, C.; Perdiguero, E.G.; Wieghofer, P.; Heinrich, A.; Riemke, P.; Hölscher, C.; et al. Microglia emerge from erythromyeloid precursors via Pu.1- and Irf8-dependent pathways. Nat. Neurosci. 2013, 16, 273–280. [Google Scholar] [CrossRef]
- Bain, C.C.; Bravo-Blas, A.; Scott, C.L.; Perdiguero, E.G.; Geissmann, F.; Henri, S.; Malissen, B.; Osborne, L.C.; Artis, D.; Mowat, A.M. Constant replenishment from circulating monocytes maintains the macrophage pool in the intestine of adult mice. Nat. Immunol. 2014, 15, 929–937. [Google Scholar] [CrossRef] [Green Version]
- Summers, K.M.; Bush, S.J.; Hume, D.A. Network analysis of transcriptomic diversity amongst resident tissue macrophages and dendritic cells in the mouse mononuclear phagocyte system. PLOS Biol. 2020, 18, e3000859. [Google Scholar] [CrossRef]
- Ziegler-Heitbrock, L. The CD14+ CD16+ blood monocytes: Their role in infection and inflammation. J. Leukoc. Biol. 2007, 81, 584–592. [Google Scholar] [CrossRef]
- Swirski, F.K.; Nahrendorf, M.; Etzrodt, M.; Wildgruber, M.; Cortez-Retamozo, V.; Panizzi, P.; Figueiredo, J.-L.; Kohler, R.H.; Chudnovskiy, A.; Waterman, P.; et al. Identification of splenic reservoir monocytes and their deployment to inflammatory sites. Science 2009, 325, 612–616. [Google Scholar] [CrossRef] [Green Version]
- Hoeffel, G.; Ginhoux, F. Fetal monocytes and the origins of tissue-resident macrophages. Cell. Immunol. 2018, 330, 5–15. [Google Scholar] [CrossRef]
- Hoeksema, M.A.; Glass, C.K. Nature and nurture of tissue-specific macrophage phenotypes. Atherosclerosis 2019, 281, 159–167. [Google Scholar] [CrossRef] [Green Version]
- Hume, D.A.; Irvine, K.M.; Pridans, C. The Mononuclear Phagocyte System: The Relationship between Monocytes and Macrophages. Trends Immunol. 2019, 40, 98–112. [Google Scholar] [CrossRef]
- Guilliams, M.; Thierry, G.R.; Bonnardel, J.; Bajenoff, M. Establishment and Maintenance of the Macrophage Niche. Immunity 2020, 52, 434–451. [Google Scholar] [CrossRef]
- Jenkins, S.; Hume, D.A. Homeostasis in the mononuclear phagocyte system. Trends Immunol. 2014, 35, 358–367. [Google Scholar] [CrossRef]
- Li, Z.; Liu, S.; Xu, J.; Zhang, X.; Han, D.; Liu, J.; Xia, M.; Yi, L.; Shen, Q.; Xu, S.; et al. Adult Connective Tissue-Resident Mast Cells Originate from Late Erythro-Myeloid Progenitors. Immunity 2018, 49, 640–653.e5. [Google Scholar] [CrossRef] [Green Version]
- Gentek, R.; Ghigo, C.; Hoeffel, G.; Bulle, M.J.; Msallam, R.; Gautier, G.; Launay, P.; Chen, J.; Ginhoux, F.; Bajénoff, M. Hemogenic Endothelial Fate Mapping Reveals Dual Developmental Origin of Mast Cells. Immunity 2018, 48, 1160–1171.e5. [Google Scholar] [CrossRef] [Green Version]
- Hallgren, J.; Gurish, M.F. Mast cell progenitor trafficking and maturation. Adv. Exp. Med. Biol. 2011, 716, 14–28. [Google Scholar]
- Ciesielska, A.; Matyjek, M.; Kwiatkowska, K. TLR4 and CD14 trafficking and its influence on LPS-induced pro-inflammatory signaling. Cell. Mol. Life Sci. 2021, 78, 1233–1261. [Google Scholar] [CrossRef]
- Maurer, M.; von Stebut, E. Macrophage inflammatory protein-1. Int. J. Biochem. Cell Biol. 2004, 36, 1882–1886. [Google Scholar] [CrossRef]
- Wang, P.; Hou, J.; Lin, L.; Wang, C.; Liu, X.; Li, D.; Ma, F.; Wang, Z.; Cao, X. Inducible microRNA-155 feedback promotes type I IFN signaling in antiviral innate immunity by targeting suppressor of cytokine signaling 1. J. Immunol. 2010, 185, 6226–6233. [Google Scholar] [CrossRef] [Green Version]
- Schulte, L.N.; Westermann, A.J.; Vogel, J. Differential activation and functional specialization of miR-146 and miR-155 in innate immune sensing. Nucleic Acids Res. 2013, 41, 542–553. [Google Scholar] [CrossRef] [Green Version]
- Hathcock, K.S.; Laszlo, G.; Dickler, H.B.; Bradshaw, J.; Linsley, P.; Hodes, R.J. Identification of an alternative CTLA-4 ligand costimulatory for T cell activation. Science 1993, 262, 905–907. [Google Scholar] [CrossRef]
- Meissner, F.; Scheltema, R.A.; Mollenkopf, H.-J.; Mann, M. Direct Proteomic Quantification of the Secretome of Activated Immune Cells. Science 2013, 340, 475–478. [Google Scholar] [CrossRef] [PubMed]
- Siddhuraj, P.; Clausson, C.M.; Sanden, C.; Alyamani, M.; Kadivar, M.; Marsal, J.; Wallengren, J.; Bjermer, L.; Erjefält, J.S. Lung Mast Cells Have a High Constitutive Expression of Carboxypeptidase A3 mRNA That is Independent from Granule-Stored CPA3. Cells 2021, 10, 309. [Google Scholar] [CrossRef] [PubMed]
- Rosier, F.; Fernandez Nunez, N.; Torres, M.; Loriod, B.; Rihet, P.; Pradel, L.C. Transcriptional Response in a Sepsis Mouse Model Reflects Transcriptional Response in Sepsis Patients. Int. J. Mol. Sci. 2022, 23, 821. [Google Scholar] [CrossRef] [PubMed]
- Zhang, H.; Jiang, Z.; Shen, C.; Zou, H.; Zhang, Z.; Wang, K.; Bai, R.; Kang, Y.; Ye, X.-Y.; Xie, T. 5-Hydroxymethylfurfural Alleviates Lung Injury by Inhibiting Endo-plasmic Reticulum Stress and NLRP3 Inflammasome Activation. Front. Cell Dev. Biol. 2021, 9, 782427. [Google Scholar] [CrossRef] [PubMed]


Publisher’s Note: MDPI stays neutral with regard to jurisdictional claims in published maps and institutional affiliations. |
© 2022 by the authors. Licensee MDPI, Basel, Switzerland. This article is an open access article distributed under the terms and conditions of the Creative Commons Attribution (CC BY) license (https://creativecommons.org/licenses/by/4.0/).
Share and Cite
Lara, S.; Akula, S.; Fu, Z.; Olsson, A.-K.; Kleinau, S.; Hellman, L. The Human Monocyte—A Circulating Sensor of Infection and a Potent and Rapid Inducer of Inflammation. Int. J. Mol. Sci. 2022, 23, 3890. https://doi.org/10.3390/ijms23073890
Lara S, Akula S, Fu Z, Olsson A-K, Kleinau S, Hellman L. The Human Monocyte—A Circulating Sensor of Infection and a Potent and Rapid Inducer of Inflammation. International Journal of Molecular Sciences. 2022; 23(7):3890. https://doi.org/10.3390/ijms23073890
Chicago/Turabian StyleLara, Sandra, Srinivas Akula, Zhirong Fu, Anna-Karin Olsson, Sandra Kleinau, and Lars Hellman. 2022. "The Human Monocyte—A Circulating Sensor of Infection and a Potent and Rapid Inducer of Inflammation" International Journal of Molecular Sciences 23, no. 7: 3890. https://doi.org/10.3390/ijms23073890
APA StyleLara, S., Akula, S., Fu, Z., Olsson, A.-K., Kleinau, S., & Hellman, L. (2022). The Human Monocyte—A Circulating Sensor of Infection and a Potent and Rapid Inducer of Inflammation. International Journal of Molecular Sciences, 23(7), 3890. https://doi.org/10.3390/ijms23073890