Article

Gut Mucosal Microbiome Is Perturbed in Rheumatoid Arthritis Mice and Partly Restored after TDAG8 Deficiency or Suppression by Salicylanilide Derivative

1
Faculty of Applied Sciences, Ton Duc Thang University, Ho Chi Minh City 700000, Vietnam
2
Department of Life Sciences and Institute of Genome Sciences, National Yang Ming Chiao Tung University, Taipei 112, Taiwan
3
Institute of Microbiology and Immunology, National Yang Ming Chiao Tung University, Taipei 112, Taiwan
*
Author to whom correspondence should be addressed.
These authors contributed equally to this work.
Int. J. Mol. Sci. 2022, 23(7), 3527; https://doi.org/10.3390/ijms23073527
Submission received: 27 February 2022 / Revised: 20 March 2022 / Accepted: 22 March 2022 / Published: 24 March 2022
(This article belongs to the Special Issue Diet, Gut Microbiota and Human Health)

Abstract

:
Rheumatoid arthritis (RA), an autoimmune disease, is characterized by chronic joint inflammation and pain. We previously found that the deletion of T-cell death-associated gene 8 (TDAG8) significantly reduces disease severity and pain in RA mice. Whether it is by modulating gut microbiota remains unclear. In this study, 64 intestinal samples of feces, cecal content, and cecal mucus from the complete Freund’s adjuvant-induced arthritis mouse models were compared. The α- and β-diversity indices of the microbiome were significantly lower in RA mice. Cecal mucus showed a higher ratio of Firmicutes to Bacteroidetes in RA than healthy mice, suggesting the ratio could serve as an RA indicator. Four core genera, Eubacterium_Ventriosum, Alloprevotella, Rikenella, and Treponema, were reduced in content in both feces and mucus RA samples, and could serve microbial markers representing RA progression. TDAG8 deficiency decreased the abundance of proinflammation-related Eubacterium_Xylanophilum, Clostridia, Ruminococcus, Paraprevotella, and Rikenellaceae, which reduced local mucosal inflammation to relieve RA disease severity and pain. The pharmacological block of the TDAG8 function by a salicylanilide derivative partly restored the RA microbiome to a healthy composition. These findings provide a further understanding of specific bacteria interactions with host gut mucus in the RA model. The modulation by TDAG8 on particular bacteria can facilitate microbiota-based therapy.

1. Introduction

Rheumatoid arthritis (RA) is a common, autoimmune, inflammatory, and chronic disease that affects nearly 1% of the adult population worldwide [1,2]. RA is characterized by its severely progressive disability, systemic complications, early death, and health expenditure terms. The pathogenesis of RA is complex and leads to the destruction of both cartilaginous and bony elements of the joint. The dysregulated inflammatory processes in the synovium of the joint are often accompanied by ongoing pain and increased pain during movement. The etiology of RA is ambiguous; the initiation of RA seems to result from both genetic and environmental causes [1,2].
Various risk factors have been indicated as potential causes for RA, and microorganisms have recently been of interest as a risk factor. The overrepresentation of some microorganisms in the intestines could be related to RA morbidity. In fact, fluctuations in bacterial content might lead to altered levels of metabolites that promote joint inflammation [3,4,5]. Vaahtovuo et al. used fecal samples to investigate bacterial composition based on DNA staining, flow cytometry, and 16S rDNA hybridization in RA patients. RA patients had a significantly lower content of bifidobacteria and bacteria of the Bacteroides-Porphyromonas-Prevotella group, Eubacterium rectale-Clostridium coccoides group, and Bacteroides fragilis subgroup [6]. Scher et al. used the V1–V2 variable region of bacterial 16S rDNA gene amplification and found the presence of Prevotella as highly correlated with disease in patients with new-onset untreated RA [7]. Zhang et al. used metagenomic shotgun sequencing to study the microbiome of fecal, dental, and salivary samples from an RA cohort and healthy controls. The genus Haemophilus was depleted in RA patients, whereas that of Lactobacillus was increased in individuals with RA in all three samples. A cluster containing the genera Klebsiella, Bifidobacterium, Sutterella, and Megamonas was enriched in healthy controls. In contrast, a large group including the genera Gordonibacter, Clostridium, Lachnospiraceae, and Eggerthella was enriched in RA patients [8]. Jeong et al. reported the overgrowth of the genus Collinsella in healthy individuals [9]. Sun et al. found that RA patients showed an increase in the content of 8 bacterial genera (Bacteroides, Escherichia-Shigella, the Eubacterium xylanophium group, Flavonifractor, Oscillospira, Parasutterella, Sellimonas, and Tyzzerella) and a decrease in 18 genera Akkermansia, Alloprevotella, Coprococcus 1, Coriobacteriaceae UCG-002, Citrobacter, Clostridium sensu stricto-3, Desulfovibrio, Enterobacter, Enterococcus, Helicobacter, Klebsiella, Lactobacillus, Odoribacter, Rikenellaceae RC9, Rikenella, Ruminococcaceae UCG-014, Rhodococcus, and Staphylococcus [10].
To understand the mechanisms of the disease and evaluate therapeutic targets, several arthritis mouse models have been established [11,12,13,14]. We adopted and modified Gauldie’s method to establish an arthritis model that could reproduce some of the possible mechanisms at play in RA [15]. Several proton-sensing receptors, including transient receptor potential/vanilloid receptor subtype 1 (TRPV1), acid-sensing ion channel 3 (ASIC3), and proton-sensing G-protein-coupled receptors, were found to be associated with arthritis or arthritis-associated pain [16,17,18]. We previously demonstrated that ASIC3, TRPV1, and T-cell death-associated gene 8 (TDAG8) modulate RA disease progression and RA-associated pain [15]. TDAG8 gene deletion reduces RA disease severity and relieves RA-associated pain through the regulation of satellite glial cells and proinflammatory macrophages [19]. Small molecule compounds (such as CCL-2d, LCC-09, and NSC745885) inhibit TDAG8 gene expression and function, also relieving RA-associated pain [19,20]. Genetic variants in the TDAG8 locus are associated with spondyloarthritis [21], TDAG8 is highly expressed in Th17 cells [22], and TDAG8 deletion reduces Th17 cell number and IL 17 secretion [23]. RA has been proposed to start at the mucus site with inflammation and autoimmunity, which responds to microbes or microbial factors. However, the characteristics of the microbiome in mucus and its role modulating RA is limited. Furthermore, the role of the cecal content and cecal mucus microbiome in RA is still unknown. In this study, we used a previously established RA mouse model induced by complete Freund’s adjuvant [15] to collect 64 samples from three sites, including feces, cecal content, and cecal mucus. We studied the microbial composition and the association of the microbiome in feces, cecal content, and cecal mucus. We also analyzed microbial composition in TDAG8-deficient and TDAG8 inhibitor (CCL-2d)-treated RA mice for relieving RA disease severity and pain. TDAG8 gene deletion or inhibition restored the altered microbial composition to a healthy condition, so TDAG8 may regulate gut microbiota to modulate RA disease progression and pain. Accordingly, these findings provided us with a more fundamental understanding of microbial composition in RA and TDAG8 modulation in RA through microbiota. It could facilitate the development of novel therapies in RA and RA pain by both novel small molecules and bacteria.

2. Results

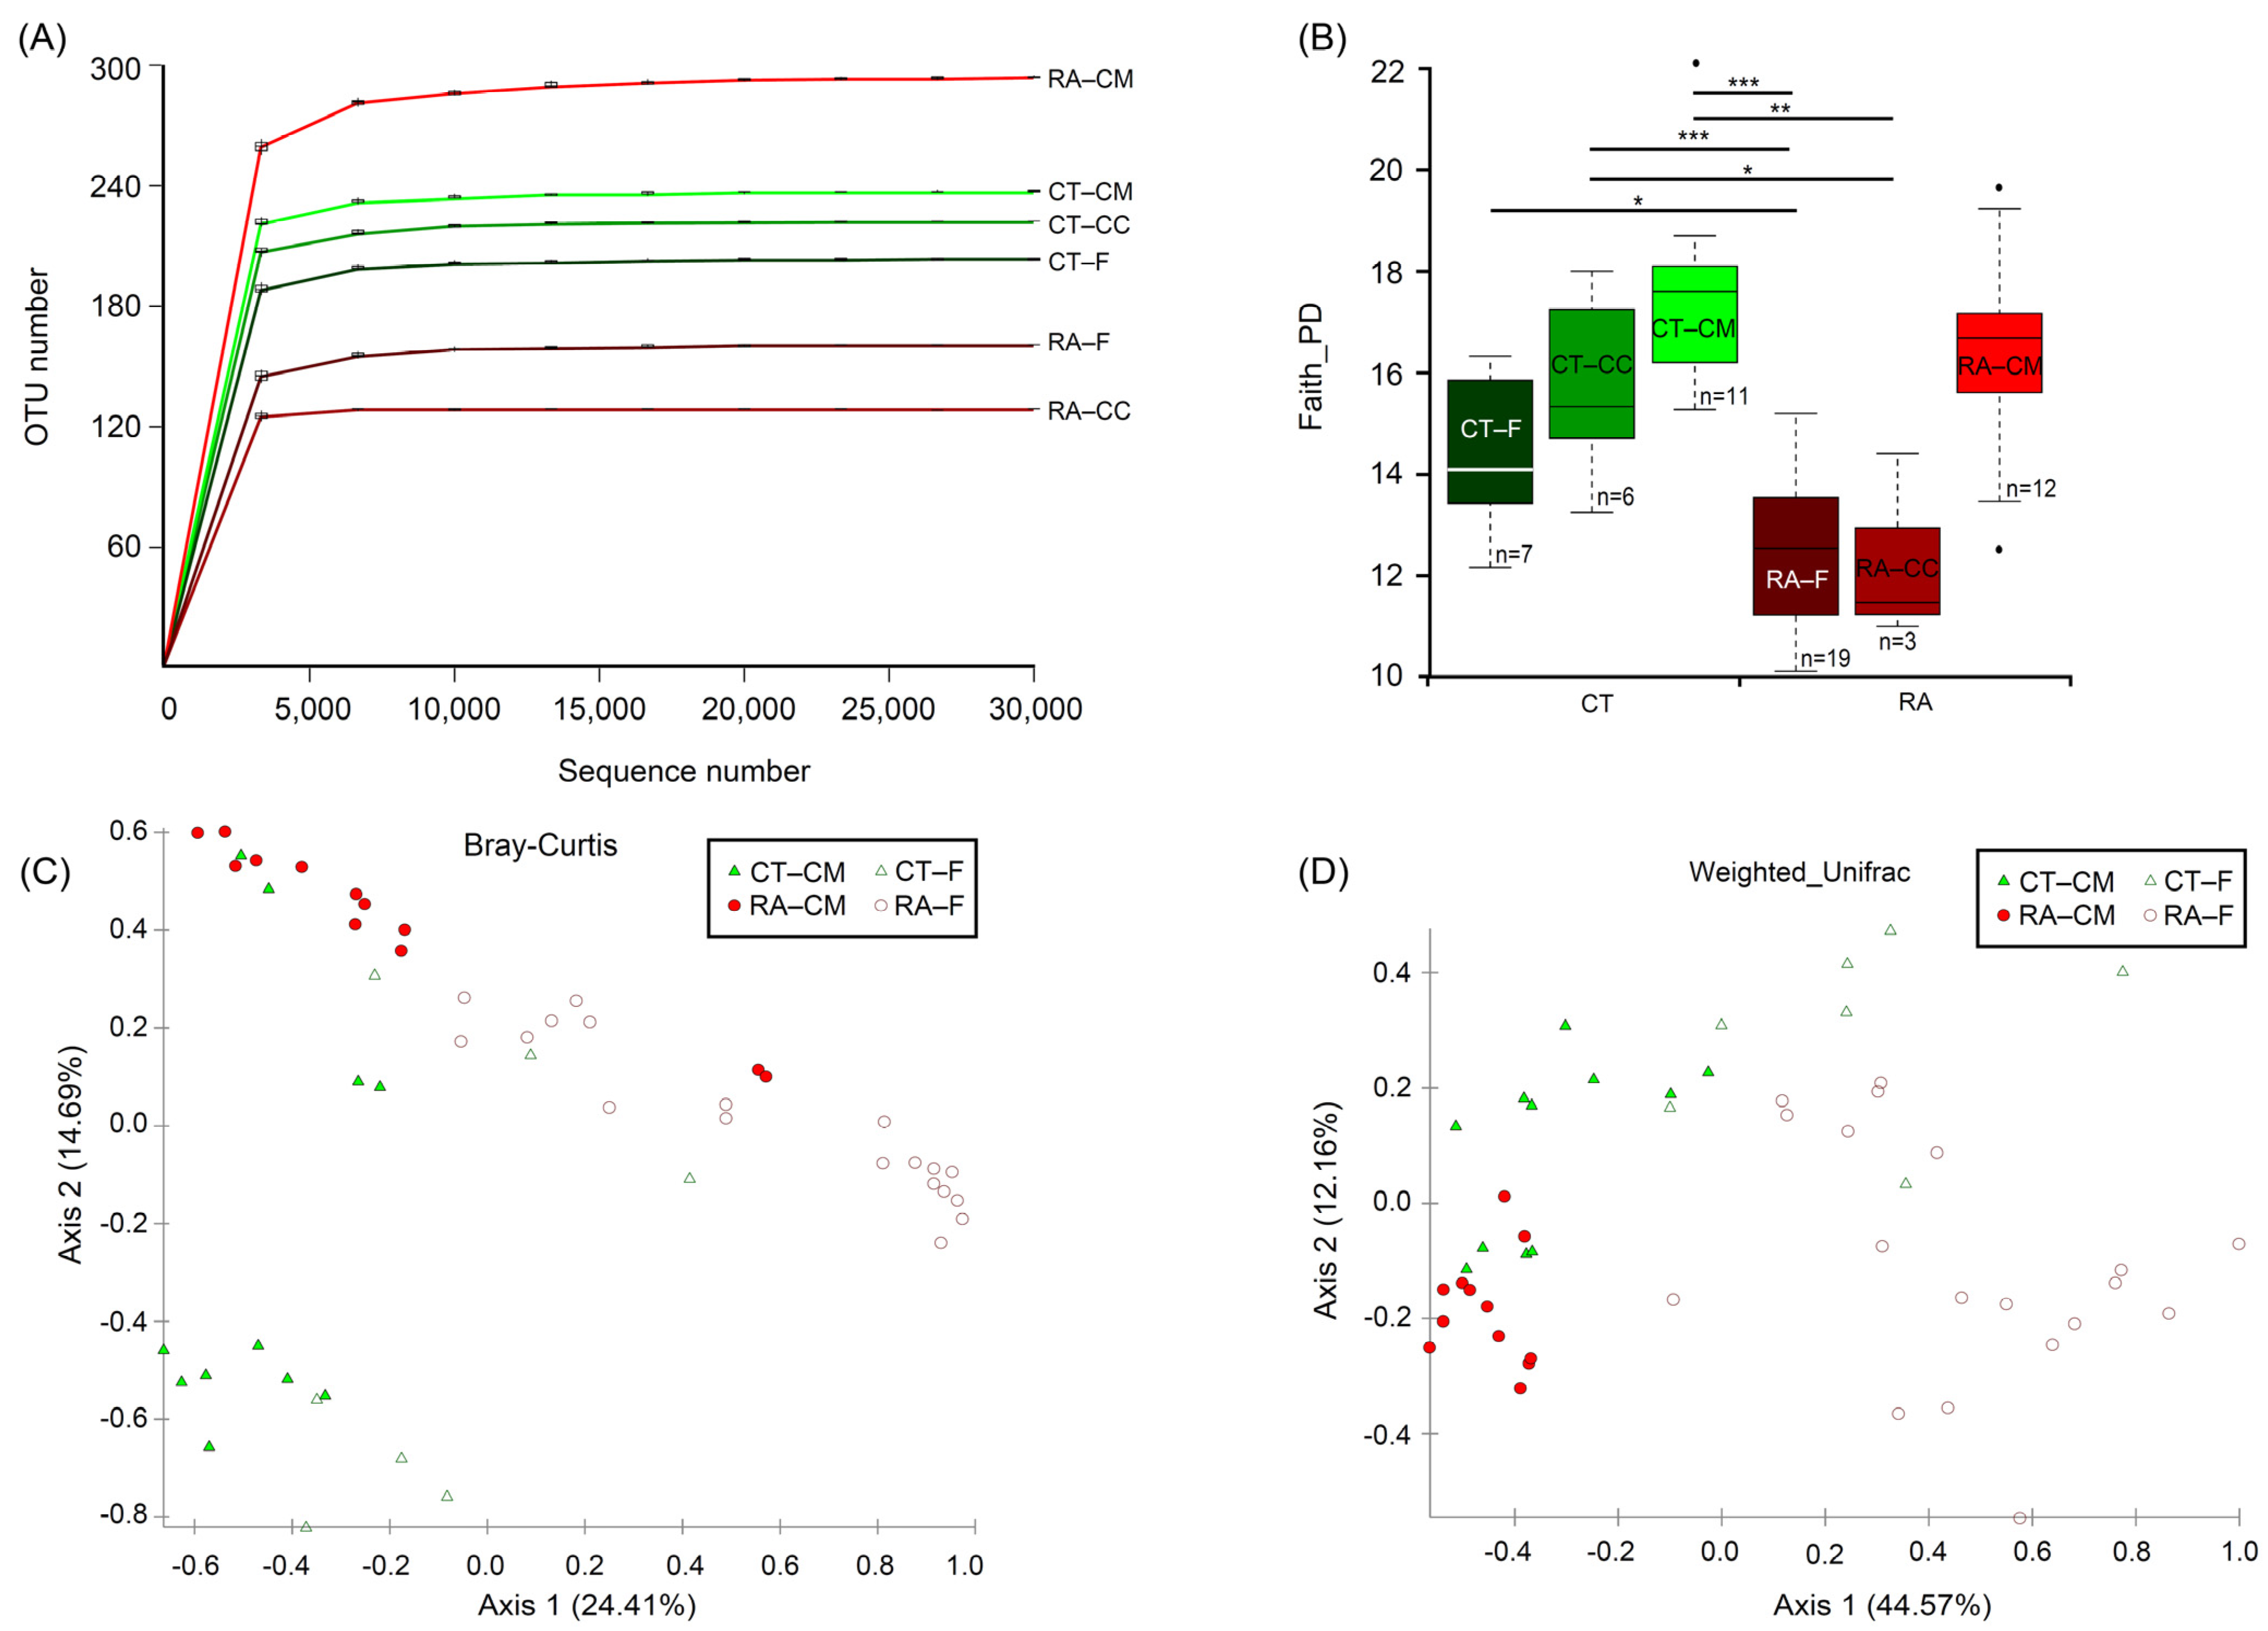
2.1. Differences in Microbiomes of RA Mice

To examine the association between RA and changes in microbial profiles, total DNA from samples from three locations, feces, cecal content, and cecal mucus, was extracted and sequenced. The 3,461,121 reads were grouped into 1110 OTUs, with a mean of 59,674 reads across the 58 samples. Good’s coverage was high, with an average of 0.999 across all samples. Reads distributed by samples are described in Table 1.
The complete and resampled datasets were used to calculate the Bray–Curtis dissimilarity, and then the Mantel test was used to compare both datasets. The results showed a significant correlation (correlation coefficient 0.9802, p = 0.001) and indicated a difference in the number of sequences per sample, causing no effects in the analysis. In addition, the α-diversity revealed no major differences for both matrices (Table 1). Analyses of microbial communities revealed differences in richness (observed OTUs) between RA and healthy mice (Figure 1A). To standardize the microbiome measures, a minimum of 31,794 sequences was used per sample. Rarefaction curves that reached the plateau phase indicated that the sequencing depth was sufficient for an analysis (Figure 1A). Faith’s Phylogenetic Diversity was statistically significant in the microbiome from RA mice through healthy controls (p < 0.05) for both feces and cecal content; however, the cecal mucus content did not differ between healthy controls and RA mice (Figure 1B). The significant variations in the microbial diversity at different sites from the same mouse group were analyzed. The bacterial diversity in the cecal mucus resulted in significant differences (p < 0.05) in the microbiome of feces or cecal content in RA mice. Diversity did not differ between feces and the cecal content for mouse groups, either the control or RA model.
To investigate both community evenness and richness, the Shannon diversity index revealed a similar decreasing trend in phylogenetic differences in different groups, but only feces revealed a significant difference (p = 0.04, Kruskal–Wallis) between control and RA mice. The microbial community was markedly less diverse in RA than control mice. Therefore, the development of RA might be related to a decline in the α-diversity of the microbiome. The data from the feces samples agreed with data from the cecal content samples. Therefore, the cecal content samples were ignored and a further analysis focused on the data from the fecal and cecal mucus samples. Healthy controls and RA mice significantly differed in bacterial community in feces (PERMANOVA, p < 0.05) by using the Bray–Curtis distance-based microbiome structure analysis, separating along principal coordinate dimension 1 (PCoA1) and explaining approximately 24.4% of the total variations in data. They also differed in bacterial community in cecal mucus (PERMANOVA, p < 0.05) (Figure 1C). PERMDISP indicated that dispersion did not contribute to significance (Table S1). The principal coordinate analysis of the weighted UniFrac distance showed that the RA treatment compared to healthy mice resulted in significant differences in β-diversity in both feces and mucus (PERMANOVA, p < 0.05), separating along principal coordinate dimension 1 (PCoA1) and explaining approximately 44.5% of the total variations in data. They also differed in bacterial community in cecal mucus (PERMANOVA, p < 0.05) (Figure 1D). Similar results were obtained from the microbiome structure analysis when using the unweighted UniFrac and Jaccard distance (Figure S1). Considering these results, we found evidence for RA-associated differences in both α- and β-diversity in bacterial community between the fecal and cecal mucus samples.

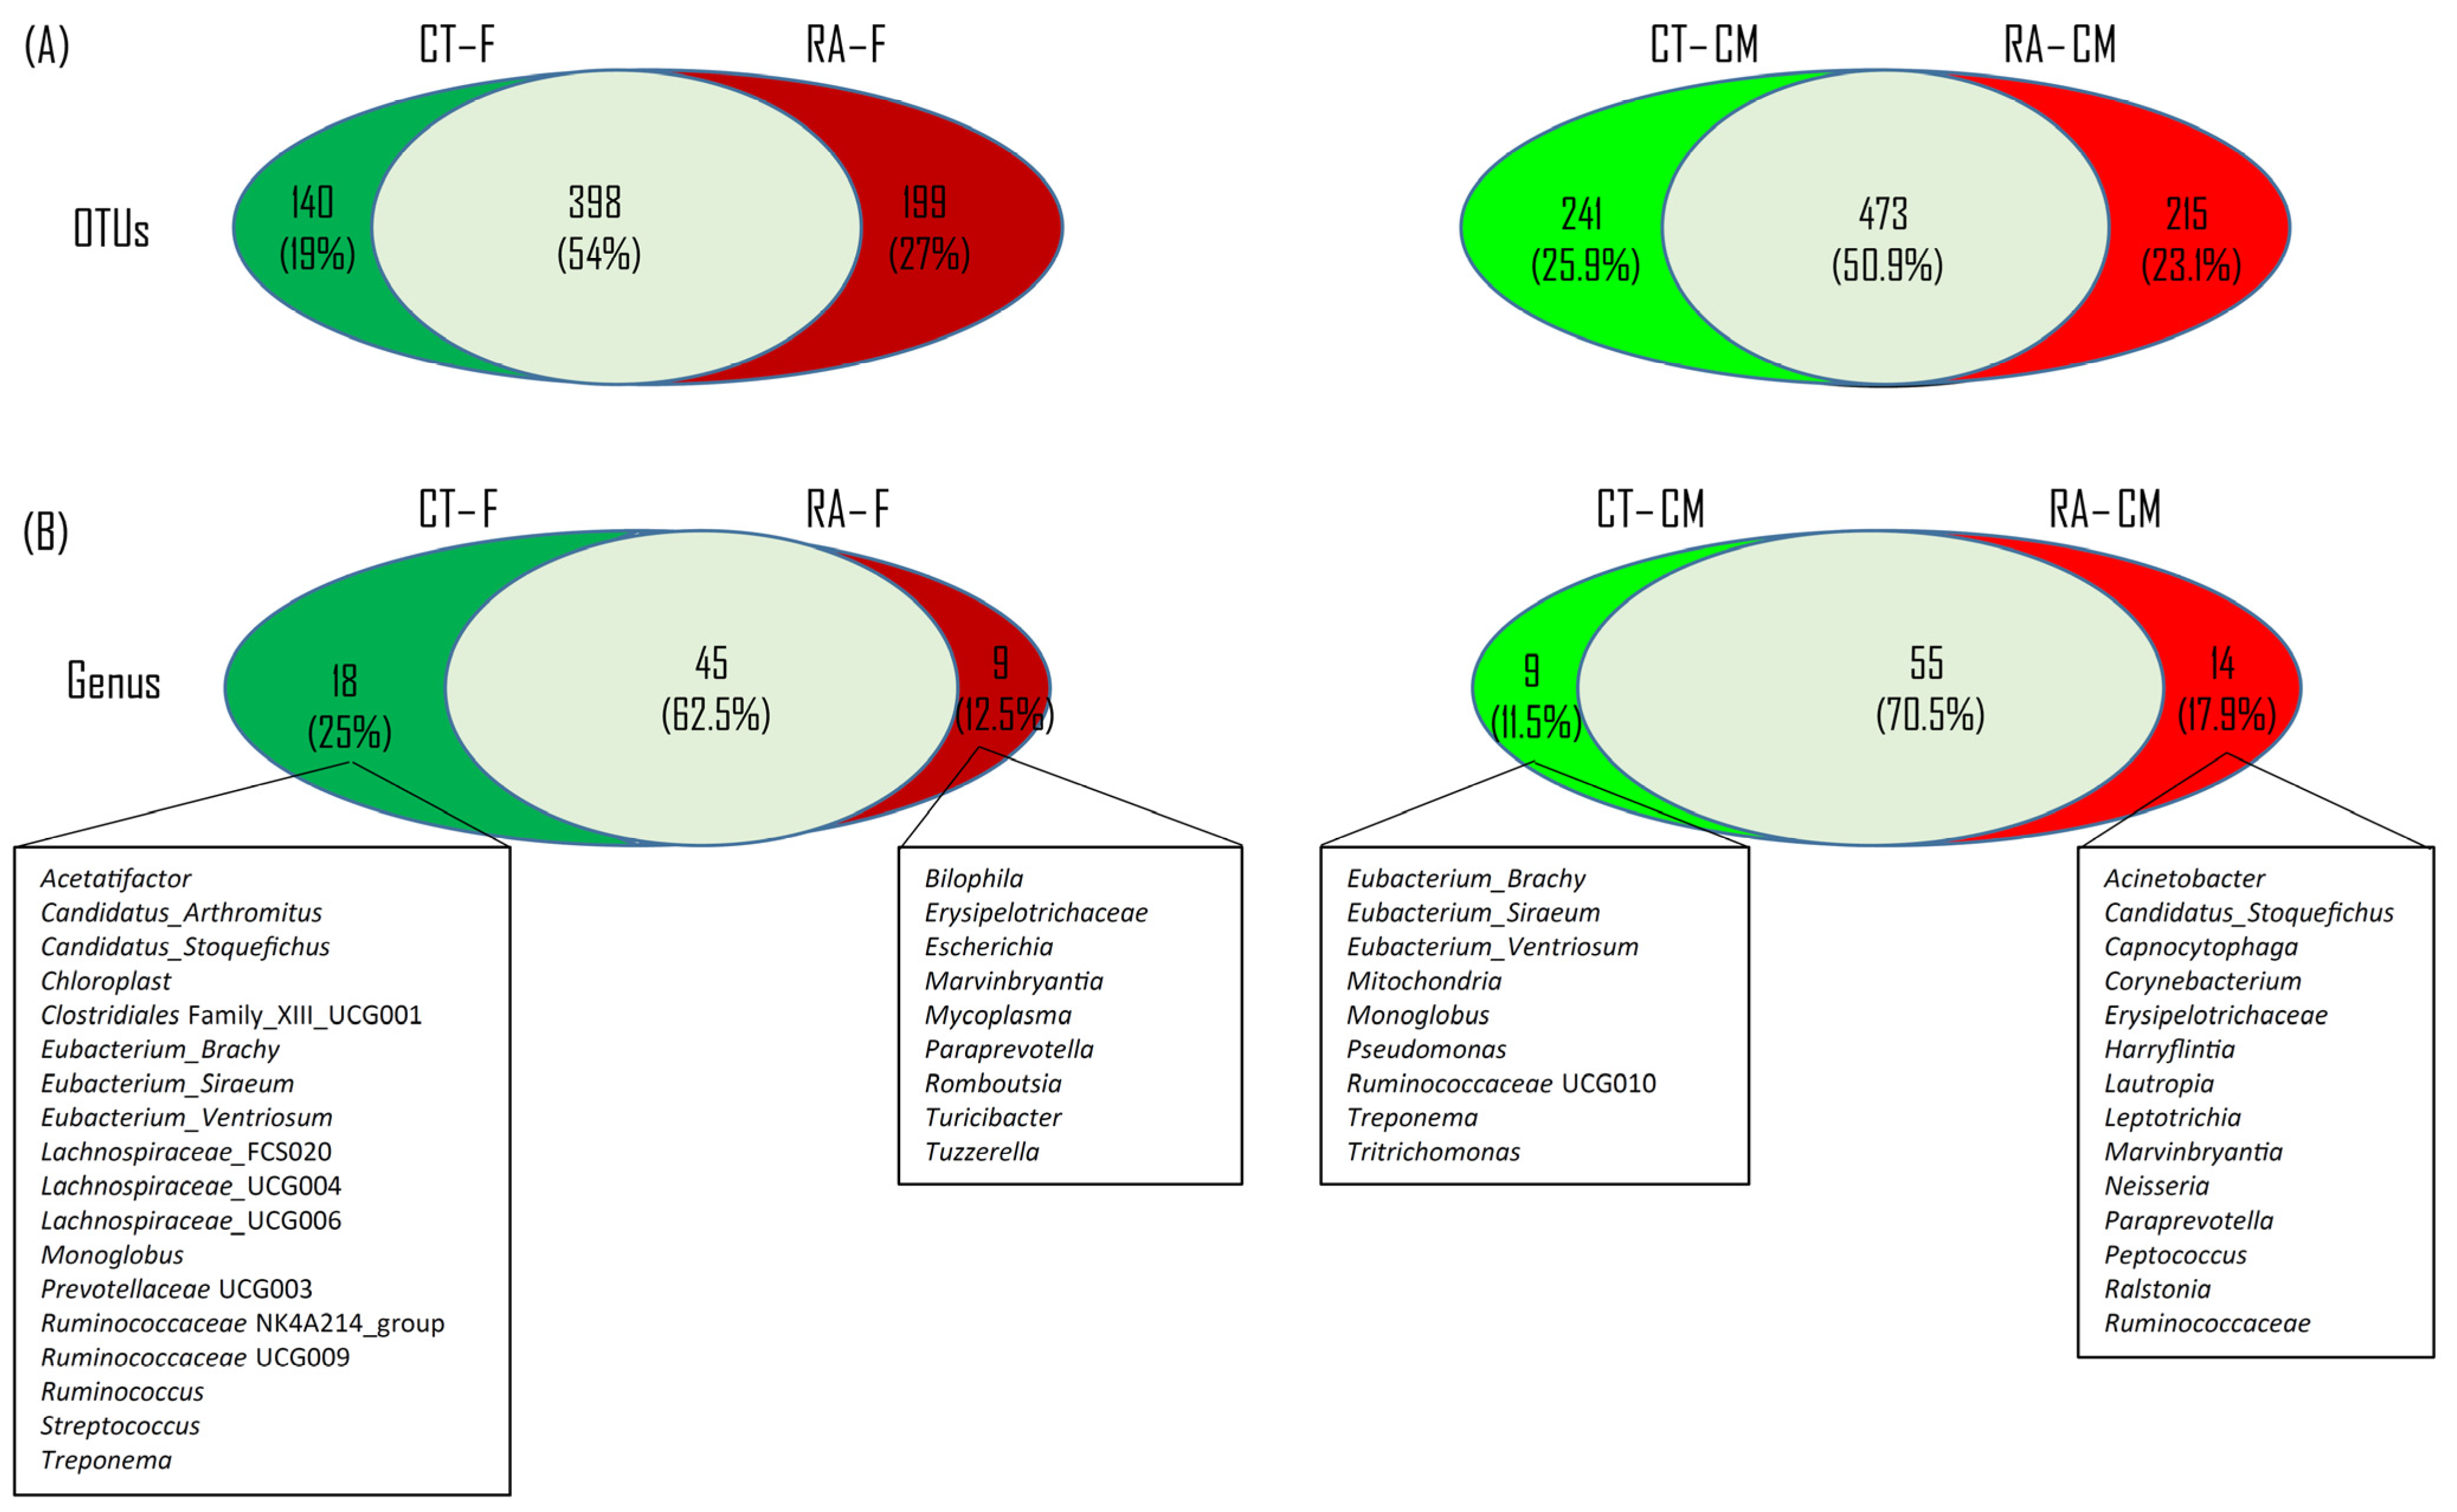
2.2. Core Microbiome

To test the presence of an identifiable common core bacterial community defined as the shared members among the microbiome and common genera, we used a Venn diagram. We identified 538 and 714 OTUs in feces and cecal mucus, respectively, from healthy mice, and 597 and 688 OTUs in feces and cecal mucus from RA mice (Figure 2A). In total, 398 OTUs were shared between healthy and RA groups, occupying 54% of all OTUs (737 OTUs) in feces, whereas 473 OTUs were shared between the healthy control and RA mice, representing 50.9% of all OTUs (929 OTUs) in cecal mucus. At the genus level, we identified 63 and 64 genera in feces and cecal mucus from healthy mice, and 54 and 69 genera in feces and cecal mucus from RA mice (Figure 2B). In total, 45 and 55 genera were shared between healthy and RA groups, representing 62.5% and 70.5% of all genera in feces and cecal mucus, respectively.
In fecal samples, we observed 18 unique genera in healthy controls, including Acetatifactor, Candidatus_Arthromitus, Candidatus_Stoquefichus, Chloroplast, Clostridiales_UCG001, Eubacterium_Brachy, Eubacterium_Siraeum, Eubacterium_Ventriosum, Lachnospiraceae_FCS020, Lachnospiraceae_UCG004, Lachnospiraceae_UCG006, Monoglobus, Prevotellaceae UCG003, Ruminococcaceae NK4A214, Ruminococcaceae UCG009, Ruminococcus, Streptococcus, and Treponem, and 9 unique genera in RA mice, including Bilophila, Erysipelotrichaceae, Escherichia, Marvinbryantia, Mycoplasma, Paraprevotella, Romboutsia, Turicibacter, and Tuzzerella (Figure 2B). In cecal mucus samples, 9 unique genera in healthy controls were observed, including Eubacterium_Brachy, Eubacterium_Siraeum, Eubacterium_Ventriosum, Mitochondria, Monoglobus, Pseudomonas, Ruminococcaceae UCG010, Treponema, and Tritrichomonas, and 14 unique genera in RA mice, including Acinetobacter, Candidatus_Stoquefichus, Capnocytophaga, Corynebacterium, Erysipelotrichaceae, Harryflintia, Lautropia, Leptotrichia, Marvinbryantia, Neisseria, Paraprevotella, Peptococcus, Ralstonia, and Ruminococcaceae (Figure 2B).
All things considered, five and three common unique genera were found in both feces and cecal mucus samples, respectively, from healthy controls and RA mice. The five common unique genera in both the feces and cecal mucus from healthy controls belonged to Eubacterium_Brachy, Eubacterium_Siraeum, Eubacterium_Ventriosum, Monoglobus, and Treponema. Erysipelotrichaceae, Marvinbryantia, and Paraprevotella were not observed in healthy controls as compared with their abundance in RA mice (Figure 2B).

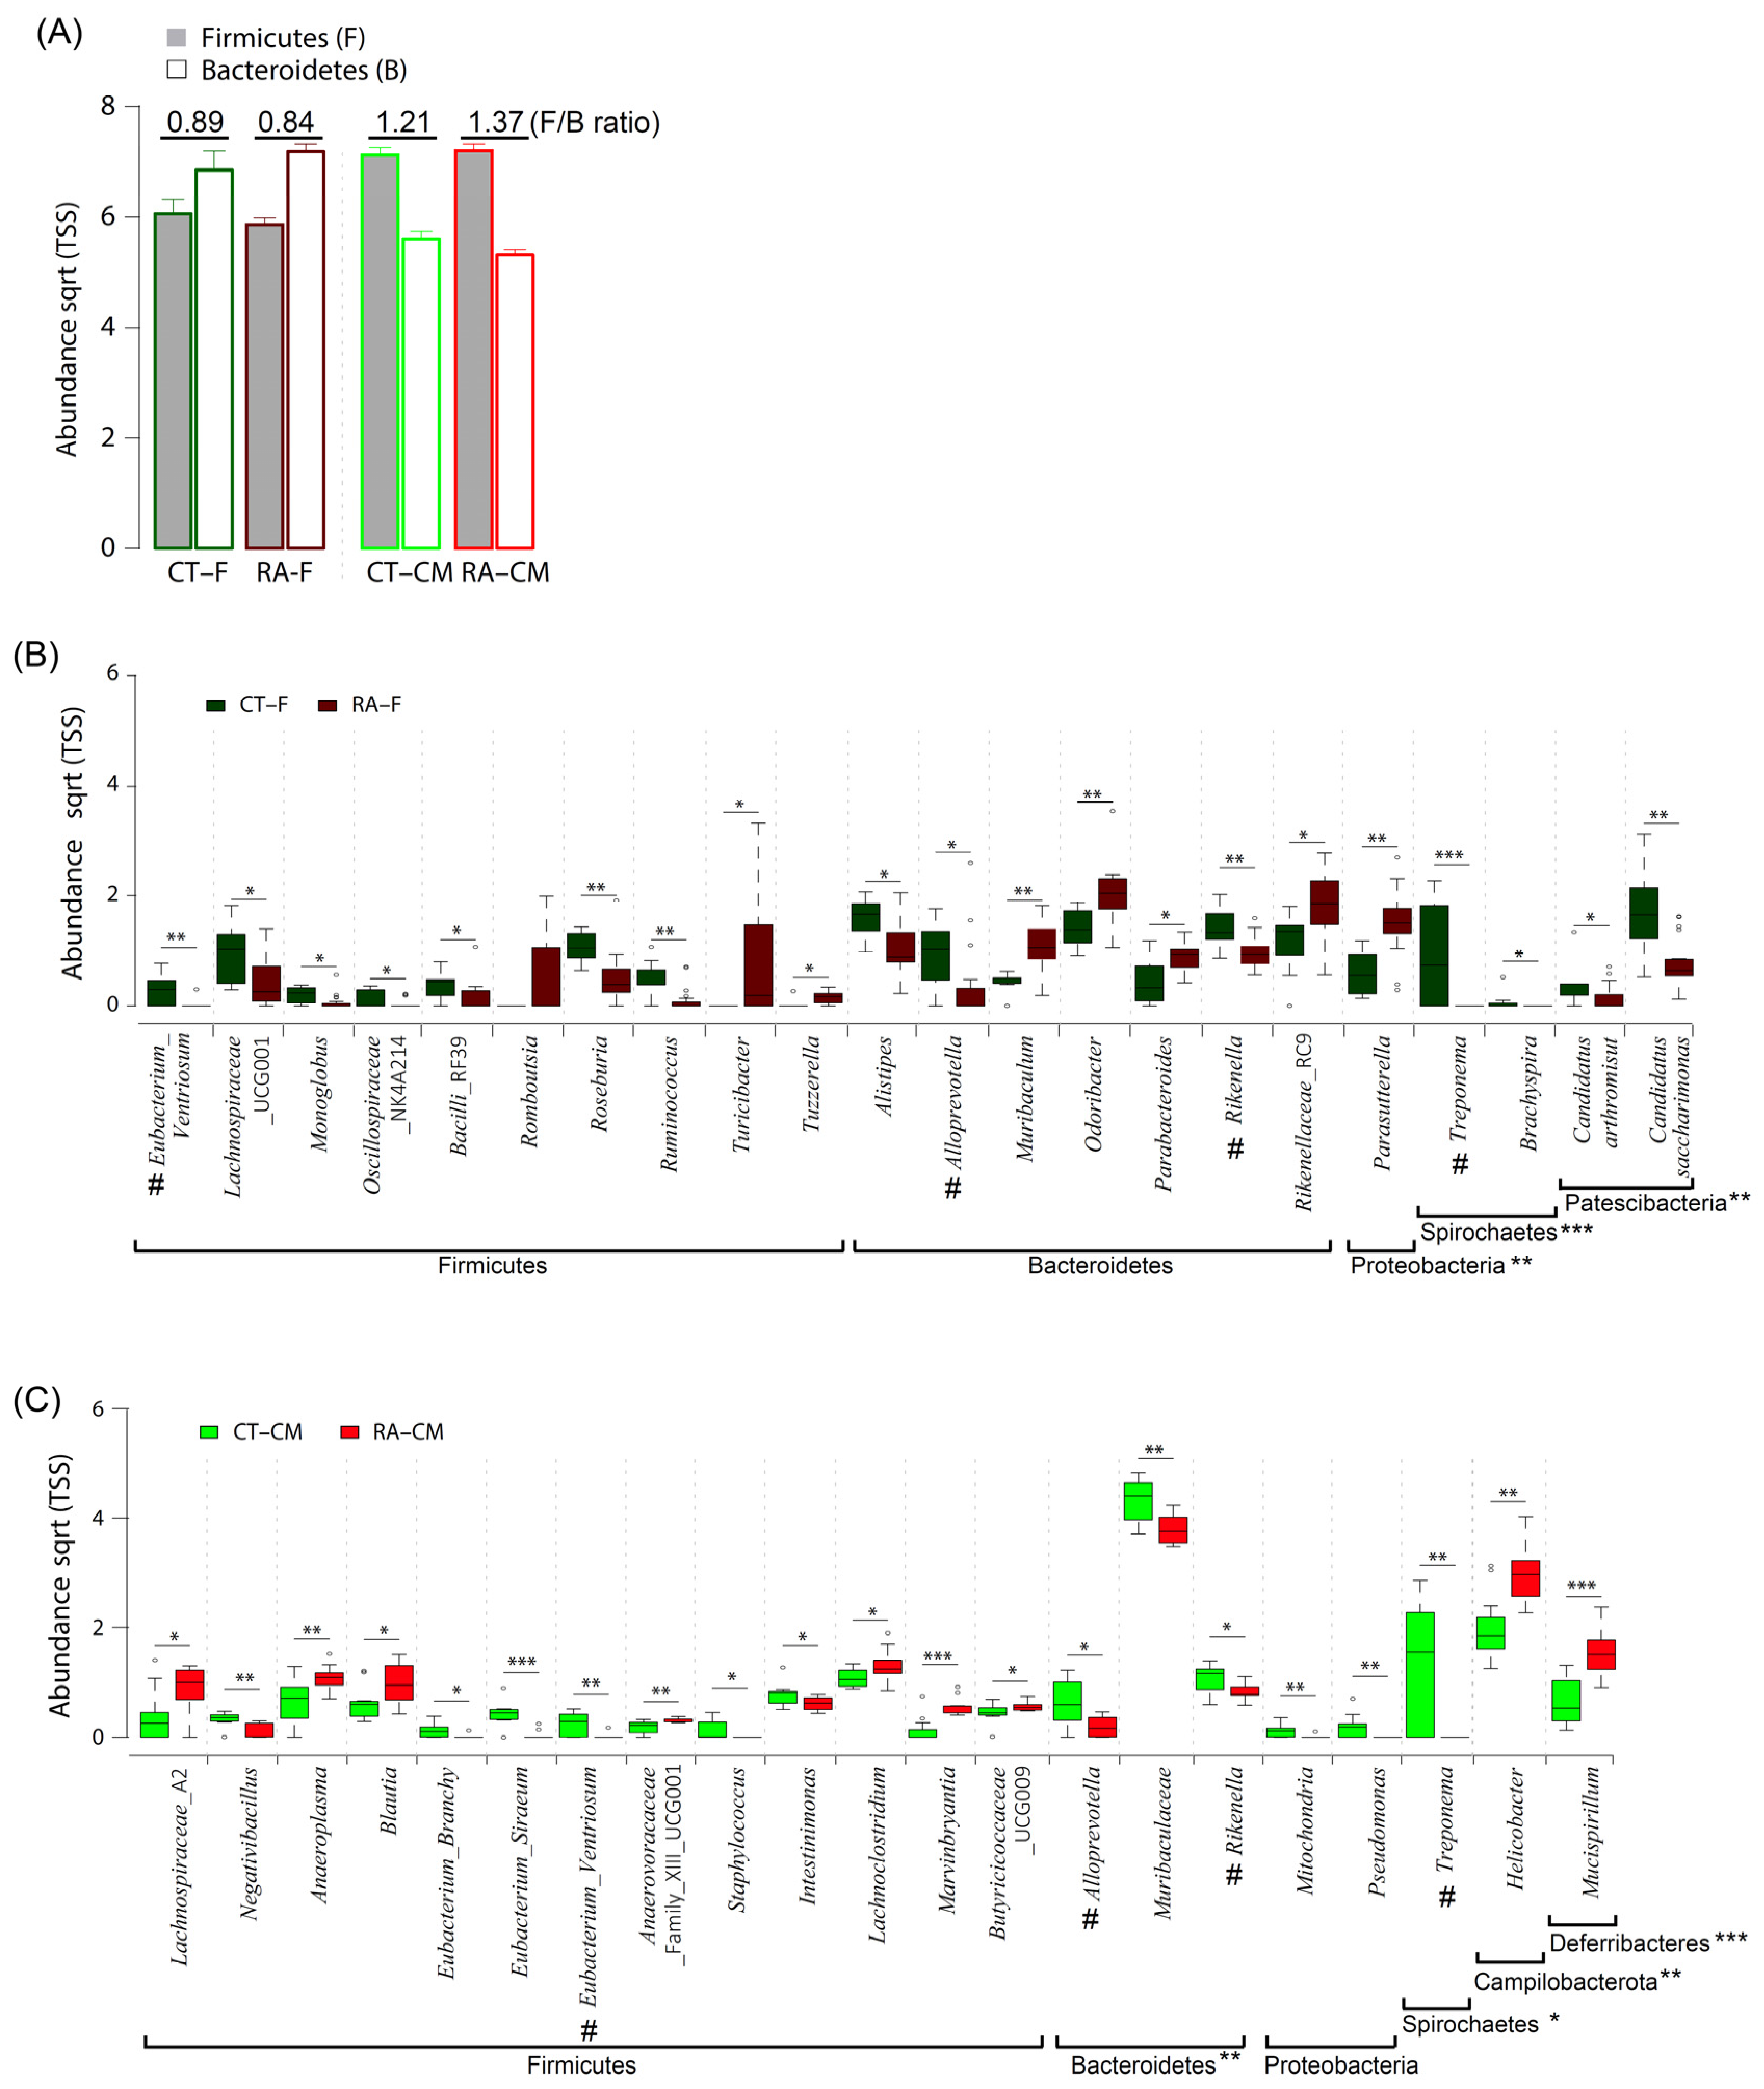
2.3. Featured Microbial Taxa by Using LEfSe

An LDA (score > 3) effect size-based cladogram showed bacterial species enriched in feces from healthy controls: Spirochaetes and Patescibacteria phyla; Spirochaetia, Cyanophyceae, and Brachyspirae class; Spirochaetaceae and Brachyspiraceae families; Muribaculaceae, Alloprevotella, Prevotellaceae_UCG_001, Rikenella, Chloroplast, Clostridia_UCG_014, Candidatus_Arthromitus, Lachnospiraceae_UCG_001, Eubacterium_Ventriosum, Monoglobus, Brachyspira, and Treponema genera (Figure 3A). Bacterial species enriched in feces from RA mice were taxa in the Proteobacteria and Desulfobacterota phyla; γ-proteobacteria, Desulfovibrionia, and Deferribacteres class; Deferribacteraceae, Desulfovibrionaceae, Peptostreptococcaceae, and Sutterellaceae families; Muribaculum, Rikenellaceae_RC9, Helicobacter, Turicibacter, Tuzzerella, Romboutsia, and Parasutterella genera. The data were also indicated in an LDA bar graph (Figure 3B): 15 genera enriched in fecal samples from healthy controls included Treponema, Candidatus_Saccharimonas, Lachnospiraceae_UCG001, Alistipes, Roseburia, Alloprevotella, Runinococcus, Rikenella, Eubacterium_Ventriosum, Brachyspira, Candidatus_Arthromitus, Chloroplast, Oscillospiraceae_NK4A214, Bacilli_RF39, and Monoglobus, and 10 genera enriched in feces from RA mice included Parasutterella, Turicibacter, Odoribacter, Rikenellaceae_RC9, Muribaculum, Romboutsia, Mucispirillum, Paraprevotella, Parabacteroides, and Tuzzerella (Figure 3B). Similar to core microbiome results in fecal samples, genera including Candidatus_Arthromitus, Chloroplast, Monoglobus, and Treponema had different LDA scores in healthy controls, whereas Turicibacter, Romboutsia, Paraprevotella, and Tuzzerella had different LDA scores in RA mice.
For cecal mucus, species enriched in healthy controls were in the Bacteroidetes and Spirochaetes phyla; Bacteroidia, Spirochaetia, and α-proteobacteria classes; Prevotellaceae, Peptococcaceae, Mitochondria, and Spirochaetaceae families; Alloprovotella, Provotellaceae_UGC_001, Eubacterium_Ventriosum, Butyricicoccus, Negativibacillus, Mitochondria, Cupriavidus, and Treponema genera, whereas species enriched in RA mice were in the Deferribacteres, Cyanobacteria, and Campilobacterota phyla; Deferribacteres, Vampirvibrionia, Campylobacteria, Clostridia, and Saccharimonadia classes; Gastranaerophilales, Anaeroplasma, Clostridia_vadinBB60, Acetatifactor, Tuzzerella, Tyzzerella, and Candidatus_Saccharimonas genera (Figure 4A). These results were also illustrated in an LDA bar graph (Figure 4B). Fifteen genera enriched in cecal mucus samples from healthy controls included Treponema, Muribaculaceae, Eubacterium_Siraeum, Alloprevotella, Rikenella, Negativibacillus, Eubacterium_Ventriosum, Intestinimonas, Pseudomonas, Tritrichomonas, Eubacterium_Brachy, Mitochondria, Cupriavidus, Staphylococcus, and Ruminococcaceae_UBA1819, whereas nine genera enriched in cecal mucus samples from RA mice included Helicobacter, Mucispirillum, Marvinbryantia, Lachnospiraceae_A2, Anaeroplasma, Clostridia, Blautia, Tyzzerella, and Anaerovoracaceae_ UCG001 (Figure 4B). Similar to core microbiome results in cecal mucus samples, the genera including Mitochondria, Pseudomonas, Treponema, and Tritrichomonas revealed different LDA scores in healthy controls, and Marvinbryantia yielded different LDA scores in RA mice.

2.4. Featured Microbial Taxa Using Wilcoxon Rank-Sum Tests

To further examine the variation in the relative abundance of different microbial taxa between the healthy control and RA groups, we used comparative analyses at all taxonomic levels for the mean relative abundance of two groups. The bacterial composition of each group at both the phylum and genus levels was analyzed by Wilcoxon rank-sum tests to identify taxa differing in abundance at phylum levels (Table 2). A total of 16 bacterial phyla was obtained in all samples; the phyla Firmicutes and Bacteroidetes were the most abundant, representing >80% of the gut microbiome. The present data showed a significantly increased abundance of Spirochaetes and Patescibacteria, and a decreased abundance of Proteobacteria and Desulfobacterota in fecal samples from RA mice (Table 2).
The ratio of Firmicutes/Bacteroidetes (F/B) is considered an important marker of the gut microbiome state. In this study, RA mice had a lower F/B ratio in fecal samples as compared to healthy controls (Figure 5A). At the genus level, we identified 21 differentially abundant genera in fecal samples, with 14 genera enriched in healthy controls (Eubacterium_Ventriosum, Lachnospiraceae_UCG001, Monoglobus, Oscillospiraceae_NK4A214 group; Bacilli_RF39, Roseburia, Ruminococcus, Alistipes, Alloprevotella, Rikenella, Treponema, Brachyspira, Candidatus_Saccharimonas, and Candidatus_Arthromis) and 7 genera (Turicibacter, Tuzzerella, Muribaculum, Odoribacter, Parabacteroides, Rikenellaceae_RC9, and Parasutterella) enriched in RA (Figure 5B and Table 3). Within the phylum Firmicutes, the genera Eubacterium_Ventriosum, Roseburia, and Ruminococcus were more abundant (p ≤ 0.01) in healthy controls than in RA mice. Within the phylum Bacteroidetes, Proteobacteria, Patescibacteria, and Spirochaetes, the genera Rikenella, Candidatus_Saccharimonas, and Treponema were more abundant (p ≤ 0.01) in healthy controls than in RA mice.
For cecal mucus samples, three differentially abundant taxa enriched in healthy controls included Parabasalia, Bacteroidetes, and Spirochaetes, whereas Campilobacterota and Deferribacteres were enriched in RA mice (Table 2). The statistical analysis revealed significant differences in the relative abundance of Bacteroidetes, with an average of a 27.9% and 33.8% abundance for RA samples and healthy controls, respectively. The F/B ratio was higher in cecal mucus samples in RA mice than healthy controls (Figure 5A). At the genus level, 20 differentially abundant genera included 12 genera enriched in healthy controls (Negativibacillus, Eubacterium_Brachy, Eubacterium_Siraeum, Eubacterium_Ventriosum, Staphylococcus, Intestinimonas, Alloprevotella, Muribaculaceae, Rikenella, Mitochondria, Pseudomonas, and Treponema) and 8 genera enriched in RA mice (Lachnospiraceae_A2, Anaeroplasma, Blautia, Lachnoclostridium, Marvinbryantia, Butyricicoccaceae_UCG009, Helicobacter, and Mucispirillum). Within the phylum Firmicutes, the bacterial genera Eubacterium_Siraeum, Eubacterium_Ventriosum, and Negativibacillus were more abundant (p ≤ 0.01) in healthy controls than in RA mice. Within the phylum Proteobacteria, the genera Mitochondria and Pseudomonas were more abundant (p ≤ 0.01) in healthy controls than RA mice. However, the Treponema and Muribaculaceae genera were more abundant (p ≤ 0.01) in healthy controls than RA mice (Figure 5C and Table 3).

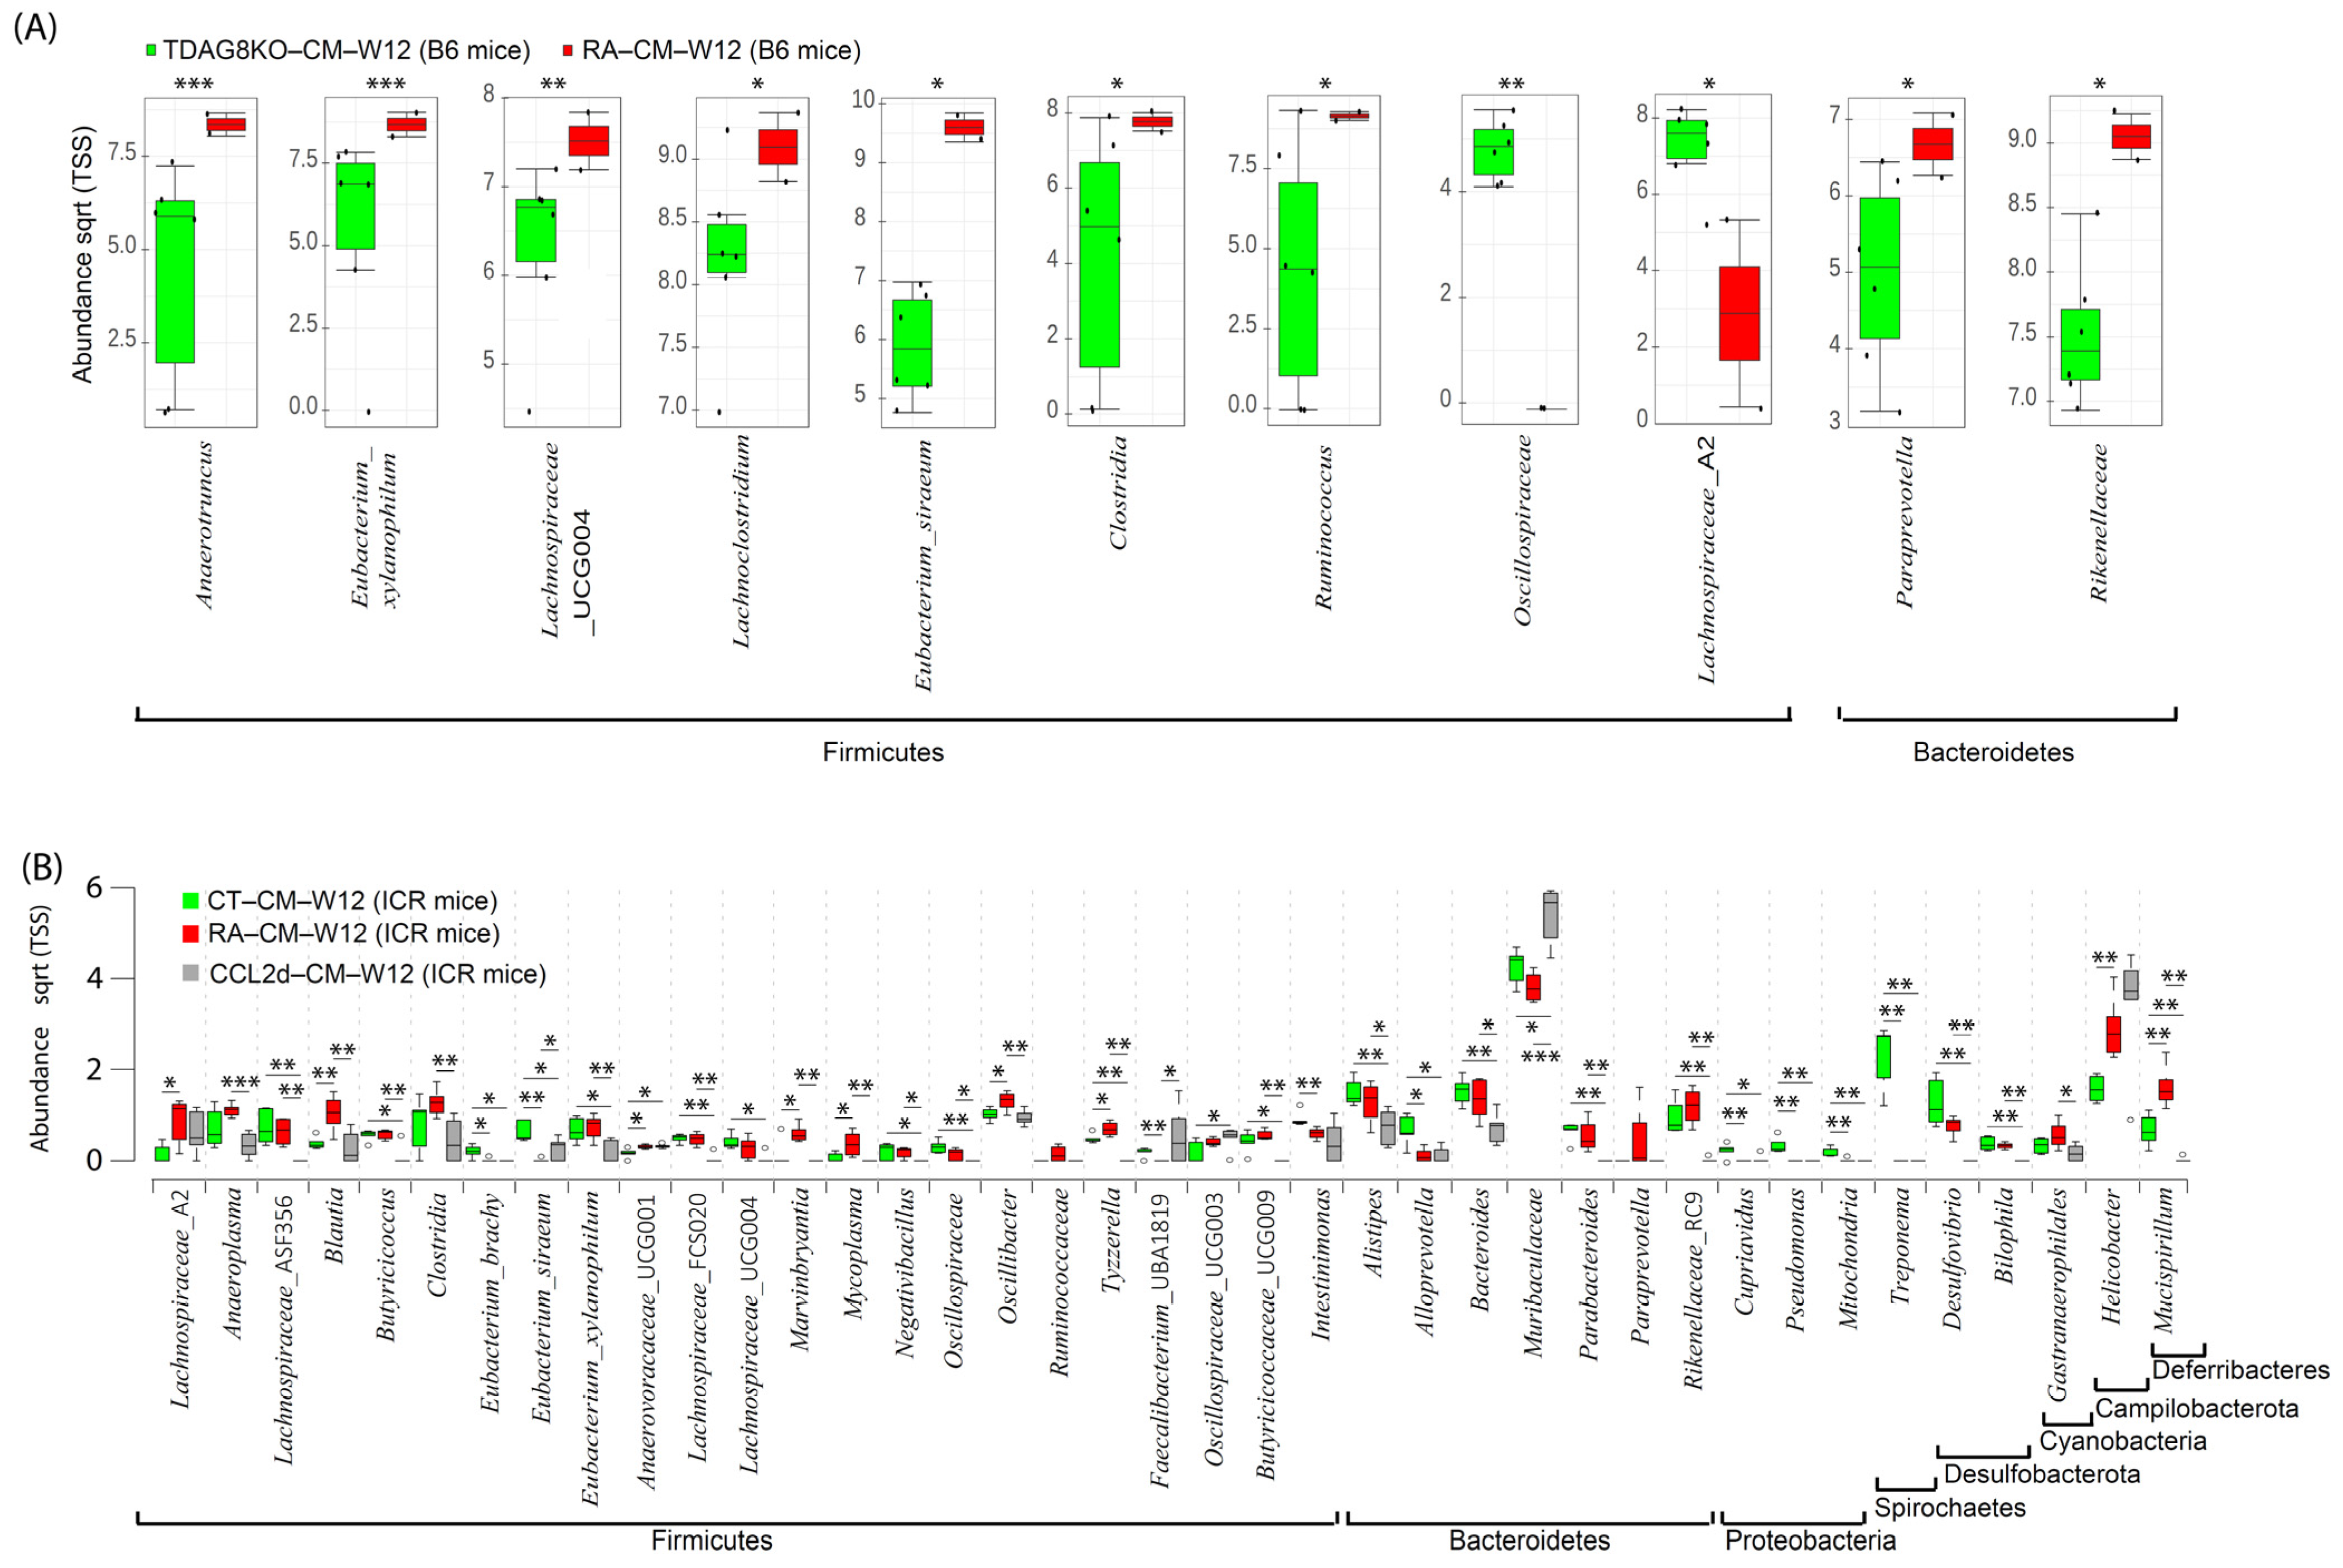
2.5. Restoration of Microbiome in Cecal Mucosa in TDAG8−/− and CCL-2d-Treated Mice

To obtain the new insight into the pathology of RA, the Wilcoxon rank-sum test was used to investigate taxa differing in abundance between healthy and RA mouse groups at week 12 after the first CFA injection in TDAG8−/− and CCL-2d-treated mice (Figure 6). Using B6 mice treated with CFA, we identified 11 differentially abundant taxa in cecal mucus samples between TDAG8+/+ mice and TDAG8−/− mice (Figure 6A). Within the phylum Firmicutes, 7 of 11 genera, Anaerotruncus, Eubacterium_Xylanophilum, Lachnospiraceae _UCG004, Lachnoclostridium, Eubacterium_Siraeum, Clostridia, and Ruminococcus were more abundant, whereas Oscillospiraceae and Lachnospiraceae_A2 were less abundant in TDAG8−/− RA mice than TDAG8+/+ RA mice (p ≤ 0.05). Within the phyla Bacteroidetes, the genera Paraprevotella and Rikenellaceae were more abundant in TDAG8−/− RA mice than TDAG8+/+ RA mice (p ≤ 0.05) (Table 4).
For RA mice treated with CCL-2d to suppress TDAG8 expression and function [19], we detected 39 differentially abundant taxa in cecal mucus samples in healthy controls, RA mice, and RA mice with CCL-2d treatment (Figure 6B). Within the phylum Firmicutes, 5 of 23 genera, Blautia, Marvinbryantia, Mycoplasma, Oscillibacter, and Tyzzerella, were more abundant (p ≤ 0.05) in RA mice than healthy controls or RA mice with CCL-2d treatment. Within the phylum Deferribacteres, the genus Mucispirillum was more abundant (p ≤ 0.01) in RA mice than healthy controls or RA mice with CCL-2d treatment. Seven genera, Eubacterium_Brachy, Eubacterium_Siraeum, Alloprevotella, Cupriavidus, Pseudomonas, Mitochondria, and Treponema, were more abundant (p ≤ 0.05) and the genus Anaerovoracaceae_UCG001 was less abundant (p ≤ 0.05) in healthy controls than RA mice with or without CCL-2d treatment. Thus, the CCL-2d treatment restored a part of the altered gut microbial ecosystem, including a decreased relative abundance of bacteria Eubacterium_Xylanophilum, Lachnospiraceae_A2, Anaeroplasma, Blautia, Marvinbryantia, Clostridia, Ruminococcus, Paraprevotella, Rikenellaceae, and Mucispirillum, and an increased abundance of microorganisms Eubacterium_Siraeum and Muribaculaceae (Table 4).

3. Discussion

Alterations in the fecal microbiome between RA and healthy individuals have been reported on since the beginning of this century [3,4,5,10]. However, details of the microbiome in the colon content and mucus remained unclear for RA patients. In this study, we used samples from feces, cecal content, and cecal mucus in an RA mouse model and healthy controls to investigate the microbial composition. We generated a total of 3,461,121 sequences representing 1110 unique OTUs with a 99% Good’s coverage for all samples. Rarefaction curves showed that the sequencing depth was sufficient for further study because the samples reached the plateau phase (Figure 1A). From the rarefaction results, a minimum of 31,794 sequences per sample was used for standardizing the microbial estimations. According to the α- and β-diversity indices for the microbiome, the fecal and cecal content did not significantly differ in both healthy controls and RA mice. However, the bacterial composition in cecal mucus was significantly different from feces in all conditions. In previous studies, the mucus microbiome was also found different from that in feces from mice, humans, and Rhesus macaque [24,25,26]. The microbial composition in the intestine is partially correlated with that in feces, but the fecal microbiome does not represent the complete picture in the intestine [24,25,26]. In intestinal dysbiosis particularly, the represented mucus microbiome plays an important role because of a close interaction with epithelial cells and the mucus immune system [24,25,26]. In most studies, diversity indices are reduced in terms of phylogenetic diversity, species richness, and evenness in RA mice as compared to healthy individuals [9,10,27,28]. Our results agreed with the published results. The apparent decrease in microbial diversity is an important marker that indicates the association between the etiology of RA and the microbiome.
The investigation of the presence of a common core bacterial community revealed 43% of the genera in all samples. In addition, on comparing RA and healthy control samples in the different intestinal sites, the core bacterial microbiome was stable, which was more than 62% of the genera. The altered gut microbiome acts as an adjuvant criterion for clinical diagnosis to identify patients with autoimmune diseases [29,30,31,32]. In this study, at the phylum level in fecal samples, RA mice showed a decrease in Spirochaetes and Palescibacteria content and an increase in Proteobacteria and Desulfobacterota content as compared to healthy controls. However, at the phylum level in cecal mucus samples, RA mice showed a decrease in Parabasalia, Bacteroidetes, and Spirochaetes content and an increase in Deferribacteres and Campilobacterota content as compared to healthy controls (Table 2).
The F/B ratio can be used as an important indicator of the gut microbiome state and host health [28,33]. Bacteroidetes found in the gut mainly functions in polysaccharide metabolism and calorie absorption, whereas Firmicutes is important for the production of short-chain fatty acids [34]. Scher et al. found Bacteroidetes absent in patients with new-onset RA as compared to healthy controls [7]. The analysis of the fecal microbiome composition revealed a higher F/B ratio in RA than osteoarthritis patients [28]. The collagen-induced arthritis mouse model used to study the immune-priming phase of arthritis revealed a decrease in Bacteroidetes and an increase in Firmicutes content [33]. In agreement with previous studies [7,28,33], we found a higher F/B ratio in cecal mucus from RA than healthy control mice (Figure 5A). However, fecal samples did not show a similar trend. Thus, the F/B ratio could be a good indicator for mouse mucosal samples but may not apply to mouse fecal samples.
In both feces and cecal mucus, Eubacterium_Ventriosum, Alloprevotella, Rikenella, and Treponema were significantly less abundant in the RA mouse than healthy control microbiome (Figure 5B,C). Our results agreed with results from some previous studies [10,35]. Sun et al. investigated samples from 66 Chinese patients with RA and 60 healthy controls by using the bacterial 16S rDNA gene; Alloprevotella and Rikenella were less abundant in the RA than control group. Alloprevotella and Treponema were reported to produce significant amounts of short-chain fatty acids, and their abundance is negatively correlated with metabolic syndrome [35,36]. The Alloprevotella content was found to be positively correlated with inflammation biomarkers and the rheumatoid factor [10]. Severijnen et al. investigated arthritis-inducing properties of Eubacterium species and revealed a diversity in such properties among different species of the anaerobic genus Eubacterium in inducing joint inflammation [37]. However, the exact effect of Treponema and Eubacterium_Ventriosum on RA is difficult to determine, because the isolation and in vitro cultivation of these strains are challenging. Given that we observed a reduced abundance of Eubacterium_Ventriosum, Alloprevotella, Rikenella, and Treponema in both RA fecal and mucosal samples, these four genera could serve as microbial markers for RA progression.
In our previous study, TDAG8 gene deficiency relieved RA disease severity and chronic pain [15]. A salicylanilide derivative compound, CCL-2d, which inhibits TDAG8 function and expression, also provided similar results as TDAG8 deficiency in mice [15]. To investigate whether the deficiency of the TDAG8 gene affects the composition of the microbiome in the molecular mechanism, the inhibition of TDAG8 expression and function by gene deletion or an inhibitor was performed. The results revealed that mice with TDAG8 gene deficiency showed a restoration of the gut microbial ecosystem by significantly reducing Eubacterium_Xylanophilum, Clostridia, Ruminococcus, Paraprevotella, and Rikenellaceae (Table 4). A reduction in Clostridia was observed in RA patients using Etanercept or Sulfasalazine, drugs used to treat RA [38,39]. In this study, mice receiving TDAG8 deficiency had a decreased number of Clostridia. It suggested that the TDAG8 treatment of RA could be responsible for the reduction in bacterial numbers and could be potentially beneficial to RA. In previous findings, the Ruminococcus content was found to be correlated with intestinal inflammation and a variety of other inflammatory diseases. The inflammatory glucorhamnan polysaccharide was mainly found in Ruminococcus [40,41]. Additionally, RA patients showed an increased content of the genus Rikenellaceae [42]. The results indicated that Clostridia, Ruminococcus, and Rikenellaceae could be proinflammation-related microorganisms promoting RA disease progression. TDAG8 deficiency was demonstrated to reduce the number of satellite glial cells and proinflammatory macrophages that could be the cause of the change in the microbiome. Thus, TDAG8-deficient RA mice showing a reduced disease severity and RA pain could be due to the modulation of gut microorganisms affecting the pathogenesis of RA.
RA patients have chronic inflammation and persistent pain hypersensitivity to mechanical and thermal stimuli [43]. However, it is not easy to establish an animal model which reproduces all RA clinical features. In current RA models, some only have short-term inflammation, some only show unilateral hypersensitivity, some models have persistent mechanical hypersensitivity but short-term thermal hypersensitivity, and some models are not suitable in mice. Our model was adopted and modified from the model established by Gauldie et al. in 2004. Our RA mice displayed long-term inflammation and long-term bilateral pain hypersensitivity to mechanical and thermal stimuli [15,44]. RA clinical features were also found in our RA mice, such as a high concentration of [H+] in synovial fluid, a continuous serum IL-6 production, and an increased synovial macrophage CD68+ number that marked the disease in the chronic inflammatory state. In addition, we successfully established an RA model in both ICR and B6 mice [15,19,20]. Thus, our RA model could reproduce some of the possible mechanisms at play in RA, rather than OA or other arthritis. Our RA model started from the initiation of autoimmunity and lacked the stage of no symptoms or signs of autoimmunity. It had some limitations in the studies of some risk factors.

4. Materials and Methods

4.1. Agents

Complete Freund’s adjuvant was from Sigma-Aldrich (Darmstadt, Germany). A salicylanilide derivative compound, CCL-2d (3-(4-Chloro-2-fluorophenyl)-7-methoxy-2H-benzo[e] [1,3]-oxazine-2,4 (3H)-dione), was synthesized as described [45]. All reagents or compounds were first solved in dimethylsulfoxide, then diluted in saline before injection in animal experiments.

4.2. Animals

Eight to twelve-week-old ICR mice, purchased from BioLASCO Taiwan (Taipei), were housed 3–4 per cage with food and water ad libitum in a temperature- and humidity-controlled environment under a 12 h light/dark cycle (lights on at 7:00 a.m.) at National Yang-Ming Chiao-Tung University, Taiwan. TDAG8−/− and TDAG8+/+ mice on a B6 background were generated as described [19]. The genotyping primer sequences for TDAG8−/− were 5′-GAA CCA TTA GTT TGG CTC ATG TGA CTG/5′-CTT GTG TCA TGC ACA AAG TAG ATG TCC and for TDAG8+/+, 5′-CGA ACT CTA GCT GGC TTT TAT CCA ATA AT/5′-GAA CCA TTA GTT TGG CTC ATG TGA CTG. The experimental procedures were approved by the local animal use committee (IACUC, National Yang-Ming Chiao-Tung University, Taiwan). All animal care followed the Guide for the Use of Laboratory Animals (US National Research Council).

4.3. Arthritis Induction and Drug Treatment

The RA mouse model was induced as described [15]. Briefly, TDAG8−/− or wild-type ICR mice were injected with 5 μg CFA in the right ankle joint once a week for 4 weeks. For CCL-2d-treated mice, CCL-2d (360 μg/kg) was administered orally (with an oral feeding needle, ST-F173 ψ0.9 × L 70 mm) weekly for 9 consecutive weeks after CFA injection. In this study, 29 mice were used; 6/29 were used as healthy controls and 3/29 were used for CCL-2d treatment; 3/29 were the TDAG8−/− mouse model.

4.4. Sample Collection

Fecal samples were collected by using forceps and immediately frozen. The cecum was resected and opened longitudinally. The cecal contents were gently collected by using forceps without scraping the mucus surface. The outer mucus was sucked up by using a peristaltic pump with a head-cut 200 μL tip and transferred to 1 mL 0.5× phosphate-buffered saline. The mucus was immediately frozen. All samples were stored at −80 °C.

4.5. DNA Extraction and Sequencing

Due to the different quantity of extracted DNA from feces and mucosa and the comparison results [46], two DNA extraction kits were used. Microbial DNA from feces or cecal content was extracted by using the QIAamp PowerFecal DNA kit (Qiagen, Hilden, Germany). The extraction of DNA from cecal mucus was performed using MasterPure DNA Purification Kit (Epicentre, Madison, USA). The extracted DNA was analyzed by Health GeneTech Corp. (Taipei) for 16S rDNA gene amplification. The PCR primer set for bacterial 16S rDNA, F515 (5′-GTG CCA GCM GCC GCG GTA A), and R806 (5′-GGA CTA CHV GGG TWT CTA AT) was used to amplify the V4 region [47]. PCR amplification, library construction, and sequencing methods were described previously [48].

4.6. Bioinformatics Analysis

The QIIME2-2019.10 platform was used for microbial analysis [49]. Raw 16S rDNA gene sequences were demultiplexed by using the q2-demux pipeline. The sequences were then denoised and PhiX reads and chimeric sequences were filtered with DADA2 (via q2-dada2) [50]. Single-end sequences were merged by using the DADA2 plugin. Sample metadata containing information such as mouse type, treatment, and various clinical parameters for categorical and numerical formatting were used. For trimming and truncating, the DADA2 plugin was used to remove low-quality regions of sequences; the filter parameters were 19 and 214 for left forward read (R1) and 20 and 156 for right forward read (R2). To create a feature table, two plugins were used: feature-table summarize and feature-table tabulate-seqs in QIIME2. To construct a phylogeny, all amplicon sequence variants were aligned by using mafft (via q2-alignment) [51]. Alpha-diversity metrics, including observed features and Faith’s Phylogenetic Diversity, were calculated by using q2-diversity. Sequences were clustered by using the VSEARCH plugin (q2-vsearch) into operational taxonomical units (OTUs) for each sample, with a 99% sequence similarity cutoff value [52]. A summary of all taxonomic information was generated by using the q2-feature-classifier classify-sklearn naive Bayes taxonomy classifier against the Silva dataset v138 [53,54]. To standardize results, the equivalent number of sequence reads (based on the lowest number of sequences obtained from a single sample) per sample chosen by rarefaction was used for all subsequent comparisons. To determine the core microbiome, genus abundance > 0.1% was used for analysis. Venn diagrams were constructed by using Venny 2.1. Both matrices for the complete and resampled datasets were calculated and compared by applying the Mantel tests implemented in the R v3.6.3 package Vegan. For beta-diversity analysis, we determined the microbial composition diversity between individuals by using weighted UniFrac, unweighted UniFrac, Jaccard, and Bray–Curtis distance in the q2-diversity plugin [55,56]. The linear Principal Component Analysis (PCA) model was also created by using the q2-diversity plugin. Significant differences in beta-diversity were determined with QIIME by PERMANOVA, and PERMDISP was used to check for significant differences in dispersion. For featured taxa selection, we used LEfSe and Calypso [57] to calculate the linear discriminant analysis effect size (LEfSe) and random forest prediction. An LDA score of >3.0 and Kruskal–Wallis α-value of 0.05 were set as thresholds; p < 0.05 was considered statistically significant.

5. Conclusions

In this study, we compared the microbiome composition in feces and mucus samples of complete Freund’s adjuvant-induced arthritis mouse models. Four core bacterial genera, Eubacterium_Ventriosum, Alloprevotella, Rikenella, and Treponema, could be biomarkers of an altered RA microbiome in both fecal and mucosal samples. TDAG8 deficiency decreased the abundance of proinflammation-related Eubacterium_Xylanophilum, Clostridia, Ruminococcus, Paraprevotella, and Rikenellaceae, which reduced local mucosal inflammation to relative RA disease severity and pain. The pharmacological block of TDAG8 function by a salicylanilide derivative partly restored the RA microbiome to a healthy microbiome composition. Understanding the bacterial interaction with the host mucus in the gut and TDAG8 modulation in specific microbiota could facilitate the development of novel microbiota-based therapy.

Supplementary Materials

The following supporting information can be downloaded at: https://www.mdpi.com/article/10.3390/ijms23073527/s1.

Author Contributions

W.-H.S. and S.-L.H. designed the experiments. W.-H.S. and T.-H.C. performed animal experiments and data analysis. N.T.N., P.-C.T., C.-C.C. and S.-L.H. performed the microbial experiments and analyzed data. N.T.N., W.-H.S. and S.-L.H. wrote and revised the manuscript. N.T.N. and S.-L.H. created the conceptual design of approaches to microbiome data analysis. W.-H.S. and S.-L.H. supervised the study. All authors discussed the results and commented on the manuscript. All authors have read and agreed to the published version of the manuscript.

Funding

This research was supported by the Ministry of Science and Technology, Taiwan (MOST 106-2320-B-008-004-MY3 and MOST 109-2320-B-010-027-MY3 to W.-H.S.; MOST 109-2320-B-010-010-MY3 to S.-L.H.), and the National Health Research Institutes, Taiwan (07A1-MGSP08-037 and 08A1-MGGP08-037 to S.-L.H.).

Institutional Review Board Statement

The experimental procedures were approved by the local animal use committee (IACUC, National Yang Ming Chiao Tung University, Taiwan). All animal care followed the Guide for the Use of Laboratory Animals (US National Research Council).

Informed Consent Statement

Not applicable.

Data Availability Statement

The raw sequences for this research were deposited in the Sequence Read Archive (accession no. PRJNA722190).

Conflicts of Interest

The authors declare no conflict of interest.

References

  1. Wells, P.M.; Williams, F.M.K.; Matey-Hernandez, M.L.; Menni, C.; Steves, C.J. RA and the microbiome: Do host genetic factors provide the link? J. Autoimmun. 2019, 99, 104–115. [Google Scholar] [CrossRef] [PubMed]
  2. Scher, J.U.; Abramson, S.B. The microbiome and rheumatoid arthritis. Nat. Rev. Rheumatol. 2011, 7, 569–578. [Google Scholar] [CrossRef] [PubMed]
  3. Vandana, U.K.; Barlaskar, N.H.; Gulzar, A.B.M.; Laskar, I.H.; Kumar, D.; Paul, P.; Pandey, P.; Mazumder, P.B. Linking gut microbiota with the human diseases. Bioinformation 2020, 16, 196–208. [Google Scholar] [CrossRef] [PubMed]
  4. Scherer, H.U.; Haupl, T.; Burmester, G.R. The etiology of rheumatoid arthritis. J. Autoimmun. 2020, 110, 102400. [Google Scholar] [CrossRef] [PubMed]
  5. Konig, M.F. The microbiome in autoimmune rheumatic disease. Best Pract. Res. Clin. Rheumatol. 2020, 34, 101473. [Google Scholar] [CrossRef]
  6. Vaahtovuo, J.; Munukka, E.; Korkeamaki, M.; Luukkainen, R.; Toivanen, P. Fecal microbiota in early rheumatoid arthritis. J. Rheumatol. 2008, 35, 1500–1505. [Google Scholar]
  7. Scher, J.U.; Ubeda, C.; Equinda, M.; Khanin, R.; Buischi, Y.; Viale, A.; Lipuma, L.; Attur, M.; Pillinger, M.H.; Weissmann, G.; et al. Periodontal disease and the oral microbiota in new-onset rheumatoid arthritis. Arthritis Rheum. 2012, 64, 3083–3094. [Google Scholar] [CrossRef] [Green Version]
  8. Zhang, X.; Zhang, D.; Jia, H.; Feng, Q.; Wang, D.; Liang, D.; Wu, X.; Li, J.; Tang, L.; Li, Y.; et al. The oral and gut microbiomes are perturbed in rheumatoid arthritis and partly normalized after treatment. Nat. Med. 2015, 21, 895–905. [Google Scholar] [CrossRef]
  9. Jeong, Y.; Kim, J.W.; You, H.J.; Park, S.J.; Lee, J.; Ju, J.H.; Park, M.S.; Jin, H.; Cho, M.L.; Kwon, B.; et al. Gut Microbial Composition and Function Are Altered in Patients with Early Rheumatoid Arthritis. J. Clin. Med. 2019, 8, 693. [Google Scholar] [CrossRef] [Green Version]
  10. Sun, Y.; Chen, Q.; Lin, P.; Xu, R.; He, D.; Ji, W.; Bian, Y.; Shen, Y.; Li, Q.; Liu, C.; et al. Characteristics of Gut Microbiota in Patients With Rheumatoid Arthritis in Shanghai, China. Front. Cell. Infect. Microbiol. 2019, 9, 369. [Google Scholar] [CrossRef] [Green Version]
  11. Trentham, D.E.; Townes, A.S.; Kang, A.H. Autoimmunity to type II collagen an experimental model of arthritis. J. Exp. Med. 1977, 146, 857–868. [Google Scholar] [CrossRef] [PubMed] [Green Version]
  12. Courtenay, J.S.; Dallman, M.J.; Dayan, A.D.; Martin, A.; Mosedale, B. Immunisation against heterologous type II collagen induces arthritis in mice. Nature 1980, 283, 666–668. [Google Scholar] [CrossRef] [PubMed]
  13. Knight, B.; Katz, D.R.; Isenberg, D.A.; Ibrahim, M.A.; Le Page, S.; Hutchings, P.; Schwartz, R.S.; Cooke, A. Induction of adjuvant arthritis in mice. Clin. Exp. Immunol. 1992, 90, 459–465. [Google Scholar] [CrossRef] [PubMed]
  14. Ditzel, H.J. The K/BxN mouse: A model of human inflammatory arthritis. Trends Mol. Med. 2004, 10, 40–45. [Google Scholar] [CrossRef]
  15. Hsieh, W.S.; Kung, C.C.; Huang, S.L.; Lin, S.C.; Sun, W.H. TDAG8, TRPV1, and ASIC3 involved in establishing hyperalgesic priming in experimental rheumatoid arthritis. Sci. Rep. 2017, 7, 8870. [Google Scholar] [CrossRef] [Green Version]
  16. Barton, N.J.; McQueen, D.S.; Thomson, D.; Gauldie, S.D.; Wilson, A.W.; Salter, D.M.; Chessell, I.P. Attenuation of experimental arthritis in TRPV1R knockout mice. Exp. Mol. Pathol. 2006, 81, 166–170. [Google Scholar] [CrossRef]
  17. Christensen, B.N.; Kochukov, M.; McNearney, T.A.; Taglialatela, G.; Westlund, K.N. Proton-sensing G protein-coupled receptor mobilizes calcium in human synovial cells. Am. J. Physiol. Cell Physiol. 2005, 289, C601–C608. [Google Scholar] [CrossRef] [Green Version]
  18. Ikeuchi, M.; Kolker, S.J.; Burnes, L.A.; Walder, R.Y.; Sluka, K.A. Role of ASIC3 in the primary and secondary hyperalgesia produced by joint inflammation in mice. Pain 2008, 137, 662–669. [Google Scholar] [CrossRef] [Green Version]
  19. Dai, S.P.; Hsieh, W.S.; Chen, C.H.; Lu, Y.H.; Huang, H.S.; Chang, D.M.; Huang, S.L.; Sun, W.H. TDAG8 deficiency reduces satellite glial number and pro-inflammatory macrophage number to relieve rheumatoid arthritis disease severity and chronic pain. J. Neuroinflam. 2020, 17, 170. [Google Scholar] [CrossRef]
  20. Kung, C.C.; Dai, S.P.; Chiang, H.; Huang, H.S.; Sun, W.H. Temporal expression patterns of distinct cytokines and M1/M2 macrophage polarization regulate rheumatoid arthritis progression. Mol. Biol. Rep. 2020, 47, 3423–3437. [Google Scholar] [CrossRef]
  21. Cortes, A.; Hadler, J.; Pointon, J.P.; Robinson, P.C.; Karaderi, T.; Leo, P.; Cremin, K.; Pryce, K.; Harris, J.; Lee, S.; et al. Identification of multiple risk variants for ankylosing spondylitis through high-density genotyping of immune-related loci. Nat. Genet. 2013, 45, 730–738. [Google Scholar] [PubMed] [Green Version]
  22. Al-Mossawi, M.H.; Chen, L.; Fang, H.; Ridley, A.; de Wit, J.; Yager, N.; Hammitzsch, A.; Pulyakhina, I.; Fairfax, B.P.; Simone, D.; et al. Unique transcriptome signatures and GM-CSF expression in lymphocytes from patients with spondyloarthritis. Nat. Commun. 2017, 8, 1510. [Google Scholar] [CrossRef]
  23. Gaublomme, J.T.; Yosef, N.; Lee, Y.; Gertner, R.S.; Yang, L.V.; Wu, C.; Pandolfi, P.P.; Mak, T.; Satija, R.; Shalek, A.K.; et al. Single-Cell Genomics Unveils Critical Regulators of Th17 Cell Pathogenicity. Cell 2015, 163, 1400–1412. [Google Scholar] [CrossRef] [PubMed] [Green Version]
  24. Siddiqui, S.; Bao, D.; Doyle-Meyers, L.; Dufour, J.; Wu, Y.; Liu, Y.Z.; Ling, B. Alterations of the gut bacterial microbiota in rhesus macaques with SIV infection and on short- or long-term antiretroviral therapy. Sci. Rep. 2020, 10, 19056. [Google Scholar] [CrossRef] [PubMed]
  25. Kozik, A.J.; Nakatsu, C.H.; Chun, H.; Jones-Hall, Y.L. Comparison of the fecal, cecal, and mucus microbiome in male and female mice after TNBS-induced colitis. PLoS ONE 2019, 14, e0225079. [Google Scholar] [CrossRef] [PubMed]
  26. Meng, Y.; Li, X.; Zhang, J.; Wang, C.; Lu, F. Effects of Different Diets on Microbiota in The Small Intestine Mucus and Weight Regulation in Rats. Sci. Rep. 2019, 9, 8500. [Google Scholar] [CrossRef]
  27. Peng, J.; Lu, X.; Xie, K.; Xu, Y.; He, R.; Guo, L.; Han, Y.; Wu, S.; Dong, X.; Lu, Y.; et al. Dynamic Alterations in the Gut Microbiota of Collagen-Induced Arthritis Rats Following the Prolonged Administration of Total Glucosides of Paeony. Front. Cell. Infect. Microbiol. 2019, 9, 204. [Google Scholar] [CrossRef] [Green Version]
  28. Lee, J.Y.; Mannaa, M.; Kim, Y.; Kim, J.; Kim, G.T.; Seo, Y.S. Comparative Analysis of Fecal Microbiota Composition Between Rheumatoid Arthritis and Osteoarthritis Patients. Genes 2019, 10, 748. [Google Scholar] [CrossRef] [Green Version]
  29. De Luca, F.; Shoenfeld, Y. The microbiome in autoimmune diseases. Clin. Exp. Immunol. 2019, 195, 74–85. [Google Scholar] [CrossRef] [Green Version]
  30. Bergot, A.S.; Giri, R.; Thomas, R. The microbiome and rheumatoid arthritis. Best Pract. Res. Clin. Rheumatol. 2019, 33, 101497. [Google Scholar] [CrossRef]
  31. Rohr, M.; Narasimhulu, C.A.; Sharma, D.; Doomra, M.; Riad, A.; Naser, S.; Parthasarathy, S. Inflammatory Diseases of the Gut. J. Med. Food 2018, 21, 113–126. [Google Scholar] [CrossRef] [PubMed]
  32. Maeda, Y.; Takeda, K. Role of Gut Microbiota in Rheumatoid Arthritis. J. Clin. Med. 2017, 6, 60. [Google Scholar] [CrossRef] [PubMed]
  33. Rogier, R.; Evans-Marin, H.; Manasson, J.; van der Kraan, P.M.; Walgreen, B.; Helsen, M.M.; van den Bersselaar, L.A.; van de Loo, F.A.; van Lent, P.L.; Abramson, S.B.; et al. Alteration of the intestinal microbiome characterizes preclinical inflammatory arthritis in mice and its modulation attenuates established arthritis. Sci. Rep. 2017, 7, 15613. [Google Scholar] [CrossRef] [PubMed] [Green Version]
  34. Kim, M.; Benayoun, B.A. The microbiome: An emerging key player in aging and longevity. Transl. Med. Aging 2020, 4, 103–116. [Google Scholar] [CrossRef]
  35. Ke, S.; Fang, S.; He, M.; Huang, X.; Yang, H.; Yang, B.; Chen, C.; Huang, L. Age-based dynamic changes of phylogenetic composition and interaction networks of health pig gut microbiome feeding in a uniformed condition. BMC Vet. Res. 2019, 15, 172. [Google Scholar] [CrossRef] [Green Version]
  36. Schwiertz, A.; Taras, D.; Schafer, K.; Beijer, S.; Bos, N.A.; Donus, C.; Hardt, P.D. Microbiota and SCFA in lean and overweight healthy subjects. Obesity 2010, 18, 190–195. [Google Scholar] [CrossRef]
  37. Severijnen, A.J.; van Kleef, R.; Hazenberg, M.P.; van de Merwe, J.P. Chronic arthritis induced in rats by cell wall fragments of Eubacterium species from the human intestinal flora. Infect. Immun. 1990, 58, 523–528. [Google Scholar] [CrossRef] [Green Version]
  38. Bodkhe, R.; Balakrishnan, B.; Taneja, V. The role of microbiome in rheumatoid arthritis treatment. Ther. Adv. Musculoskelet. Dis. 2019, 11, 1759720X19844632. [Google Scholar] [CrossRef]
  39. Picchianti-Diamanti, A.; Panebianco, C.; Salemi, S.; Sorgi, M.L.; Di Rosa, R.; Tropea, A.; Sgrulletti, M.; Salerno, G.; Terracciano, F.; D’Amelio, R.; et al. Analysis of Gut Microbiota in Rheumatoid Arthritis Patients: Disease-Related Dysbiosis and Modifications Induced by Etanercept. Int. J. Mol. Sci. 2018, 19, 2938. [Google Scholar] [CrossRef] [Green Version]
  40. Henke, M.T.; Kenny, D.J.; Cassilly, C.D.; Vlamakis, H.; Xavier, R.J.; Clardy, J. Ruminococcus gnavus, a member of the human gut microbiome associated with Crohn’s disease, produces an inflammatory polysaccharide. Proc. Natl. Acad. Sci. USA 2019, 116, 12672–12677. [Google Scholar] [CrossRef] [Green Version]
  41. Nishino, K.; Nishida, A.; Inoue, R.; Kawada, Y.; Ohno, M.; Sakai, S.; Inatomi, O.; Bamba, S.; Sugimoto, M.; Kawahara, M.; et al. Analysis of endoscopic brush samples identified mucosa-associated dysbiosis in inflammatory bowel disease. J. Gastroenterol. 2018, 53, 95–106. [Google Scholar] [CrossRef] [PubMed] [Green Version]
  42. Costello, M.E.; Ciccia, F.; Willner, D.; Warrington, N.; Robinson, P.C.; Gardiner, B.; Marshall, M.; Kenna, T.J.; Triolo, G.; Brown, M.A. Brief Report: Intestinal Dysbiosis in Ankylosing Spondylitis. Arthritis Rheumatol. 2015, 67, 686–691. [Google Scholar] [CrossRef] [PubMed]
  43. Edwards, R.R.; Wasan, A.D.; Bingham, C.O., 3rd; Bathon, J.; Haythornthwaite, J.A.; Smith, M.T.; Page, G.G. Enhanced reactivity to pain in patients with rheumatoid arthritis. Arthritis Res. Ther. 2009, 11, R61. [Google Scholar] [CrossRef] [PubMed] [Green Version]
  44. Gauldie, S.D.; McQueen, D.S.; Clarke, C.J.; Chessell, I.P. A robust model of adjuvant-induced chronic unilateral arthritis in two mouse strains. J. Neurosci. Methods 2004, 139, 281–291. [Google Scholar] [CrossRef]
  45. Chen, C.L.; Liu, F.L.; Lee, C.C.; Chen, T.C.; Ahmed Ali, A.A.; Sytwu, H.K.; Chang, D.M.; Huang, H.S. Modified salicylanilide and 3-phenyl-2H-benzo[e][1,3]oxazine-2,4(3H)-dione derivatives as novel inhibitors of osteoclast differentiation and bone resorption. J. Med. Chem. 2014, 57, 8072–8085. [Google Scholar] [CrossRef]
  46. Biesbroek, G.; Sanders, E.A.; Roeselers, G.; Wang, X.; Caspers, M.P.; Trzcinski, K.; Bogaert, D.; Keijser, B.J. Deep sequencing analyses of low density microbial communities: Working at the boundary of accurate microbiota detection. PLoS ONE 2012, 7, e32942. [Google Scholar] [CrossRef] [Green Version]
  47. Caporaso, J.G.; Lauber, C.L.; Walters, W.A.; Berg-Lyons, D.; Lozupone, C.A.; Turnbaugh, P.J.; Fierer, N.; Knight, R. Global patterns of 16S rRNA diversity at a depth of millions of sequences per sample. Proc. Natl. Acad. Sci. USA 2011, 108 (Suppl. S1), 4516–4522. [Google Scholar] [CrossRef] [Green Version]
  48. Wu, A.R.; Neff, N.F.; Kalisky, T.; Dalerba, P.; Treutlein, B.; Rothenberg, M.E.; Mburu, F.M.; Mantalas, G.L.; Sim, S.; Clarke, M.F.; et al. Quantitative assessment of single-cell RNA-sequencing methods. Nat. Methods 2014, 11, 41–46. [Google Scholar] [CrossRef] [Green Version]
  49. Bolyen, E.; Rideout, J.R.; Dillon, M.R.; Bokulich, N.A.; Abnet, C.C.; Al-Ghalith, G.A.; Alexander, H.; Alm, E.J.; Arumugam, M.; Asnicar, F.; et al. Reproducible, interactive, scalable and extensible microbiome data science using QIIME 2. Nat. Biotechnol. 2019, 37, 852–857. [Google Scholar] [CrossRef]
  50. Callahan, B.J.; McMurdie, P.J.; Rosen, M.J.; Han, A.W.; Johnson, A.J.; Holmes, S.P. DADA2: High-resolution sample inference from Illumina amplicon data. Nat. Methods 2016, 13, 581–583. [Google Scholar] [CrossRef] [Green Version]
  51. Katoh, K.; Misawa, K.; Kuma, K.; Miyata, T. MAFFT: A novel method for rapid multiple sequence alignment based on fast Fourier transform. Nucleic Acids Res. 2002, 30, 3059–3066. [Google Scholar] [CrossRef] [PubMed] [Green Version]
  52. Rognes, T.; Flouri, T.; Nichols, B.; Quince, C.; Mahe, F. VSEARCH: A versatile open source tool for metagenomics. PeerJ 2016, 4, e2584. [Google Scholar] [CrossRef] [PubMed]
  53. Bokulich, N.A.; Kaehler, B.D.; Rideout, J.R.; Dillon, M.; Bolyen, E.; Knight, R.; Huttley, G.A.; Gregory Caporaso, J. Optimizing taxonomic classification of marker-gene amplicon sequences with QIIME 2’s q2-feature-classifier plugin. Microbiome 2018, 6, 90. [Google Scholar] [CrossRef] [PubMed]
  54. Quast, C.; Pruesse, E.; Yilmaz, P.; Gerken, J.; Schweer, T.; Yarza, P.; Peplies, J.; Glockner, F.O. The SILVA ribosomal RNA gene database project: Improved data processing and web-based tools. Nucleic Acids Res. 2013, 41, D590–D596. [Google Scholar] [CrossRef]
  55. Lozupone, C.A.; Hamady, M.; Kelley, S.T.; Knight, R. Quantitative and qualitative beta diversity measures lead to different insights into factors that structure microbial communities. Appl. Environ. Microbiol. 2007, 73, 1576–1585. [Google Scholar] [CrossRef] [Green Version]
  56. Lozupone, C.; Knight, R. UniFrac: A new phylogenetic method for comparing microbial communities. Appl. Environ. Microbiol. 2005, 71, 8228–8235. [Google Scholar] [CrossRef] [Green Version]
  57. Zakrzewski, M.; Proietti, C.; Ellis, J.J.; Hasan, S.; Brion, M.J.; Berger, B.; Krause, L. Calypso: A user-friendly web-server for mining and visualizing microbiome-environment interactions. Bioinformatics 2017, 33, 782–783. [Google Scholar] [CrossRef] [Green Version]
Figure 1. Alpha- and β-diversity analysis between RA and healthy ICR mice. (A) Rarefaction analysis of 16S rDNA data from RA mice and healthy controls. Each line represents fecal, cecal content and cecal mucus samples. Samples were rarified at an even depth of 31,794 sequences per sample for further analysis. Operational taxonomical units (OTUs) in this analysis were defined at 99% similarity. (B) Faith’s Phylogenetic Diversity comparisons were calculated by Kruskal–Wallis test. Data are median (horizontal line), interquartile range (box edges) and range (whiskers). * p < 0.05, ** p < 0.01, *** p < 0.001. (C) Principal coordinate analysis plot constructed by using the Bray–Curtis distance matrix. (D) Principal coordinate analysis plot constructed by using the weighted-UniFrac distance matrix. CT, healthy controls; RA, rheumatoid arthritis; CM, cecal mucus; CC, cecal content; F, fecal. All mice were from ICR background.
Ijms 23 03527 g001
Figure 2. Venn diagram of bacterial content. (A) Common and unique OTUs between healthy control and RA mouse samples in each intestinal location. (B) Common and unique genera across two intestinal sites.
Ijms 23 03527 g002
Figure 3. Linear discriminant analysis effect size (LEfSe) analysis of fecal microbiome in healthy control and RA mouse samples. (A) Cladogram constructed by LEfSe indicating alternations between healthy control and RA samples. Regions in green indicate taxa enriched in healthy controls and regions in red indicate taxa enriched in RA mice. The bottom of the cladogram shows the differing taxa. (B) LDA scores are described in a bar graph.
Ijms 23 03527 g003
Figure 4. LEfSe analysis of cecal mucosa microbiome in healthy control and RA mouse samples. (A) Cladogram constructed by LEfSe indicating alternations between healthy control and RA samples. Regions in green indicate taxa enriched in healthy controls and regions in red indicate taxa enriched in RA mice. The bottom of the cladogram shows the differing taxa. (B) LDA scores are described in a bar graph.
Ijms 23 03527 g004
Figure 5. Composition of gut microbiome in healthy controls and RA mice. (A) The ratio of Firmicutes to Bacteroidetes in cecal mucus samples. (B) Significantly abundant genera in fecal samples. (C) Significantly abundant genera in cecal samples. Data are median (horizontal line), interquartile range (box edges) and range (whiskers). * p < 0.05; ** p < 0.01; *** p < 0.001, Wilcoxon rank-sum test. The same genera between fecal samples and cecal mucus samples are indicated by #.
Ijms 23 03527 g005
Figure 6. Composition of the cecal mucosa microbiome in healthy control, RA, TDAG8-deficient, and CCL-2d-treated mice at week 12. (A) Significantly abundant genera in RA and TDAG8-deficient B6 mice. (B) Significantly abundant genera in healthy control, RA, and CCL-2d treated ICR mice. Data are median (horizontal line), interquartile range (box edges) and range (whiskers). * p < 0.05; ** p < 0.01; *** p < 0.001, Wilcoxon rank-sum test.
Ijms 23 03527 g006
Table 1. Alpha-biodiversity for the complete datasets and the resampled datasets based on an equal number of 31,794 sequences per sample (the lowest one corresponding to CT5-Feces).
SampleBody SiteRATime aSequences bComplete DatasetsResampled Datasets
NFaith_pdShannonPielou_eNFaith_pdShannonPielou_e
CT1-CCCecum ContentNo074,63525315.176.760.8525215.166.760.85
CT2-CCCecum ContentNo040,68321313.246.830.8821313.246.830.88
CT3-CCCecum ContentNo044,22223015.476.820.8723015.476.820.87
CT4-CCCecum ContentNo1232,78221317.996.750.8721317.996.750.87
CT5-CCCecum ContentNo1236,20721117.826.640.8621117.826.640.86
CT6-CCCecum ContentNo1240,82523014.546.770.8623014.546.770.86
CT1-CMCecum MucosaNo089,67633518.957.000.8433118.687.000.84
CT2-CMCecum MucosaNo086,44431217.836.850.8331117.826.850.83
CT3-CMCecum MucosaNo048,21023716.396.980.8823616.346.970.88
CT4-CMCecum MucosaNo045,74821816.046.860.8821816.046.860.88
CT5-CMCecum MucosaNo044,07124618.346.930.8724618.346.930.87
CT6-CMCecum MucosaNo046,71723615.266.880.8723615.266.890.87
CT7-CMCecum MucosaNo1234,82122317.596.870.8822317.596.880.88
CT8-CMCecum MucosaNo1236,53921516.796.700.8621516.796.700.87
CT9-CMCecum MucosaNo1254,31733522.067.400.8833522.067.390.88
CT10-CMCecum MucosaNo1240,31325017.646.740.8525017.646.740.85
CT11-CMCecum MucosaNo1243,22323615.626.870.8723615.626.870.87
CT1-FecesFecesNo084,73328016.326.870.8527616.266.860.85
CT2-FecesFecesNo033,06016713.066.310.8516713.066.310.85
CT3-FecesFecesNo036,22520314.086.720.8820314.086.720.88
CT4-FecesFecesNo056,86617813.775.670.7617813.775.670.76
CT5-FecesFecesNo1232,04514312.156.130.8614312.156.130.86
CT6-FecesFecesNo1236,84320316.316.590.8620316.316.600.86
CT7-FecesFecesNo1241,52120615.426.580.8620615.426.580.86
RA1-CCCecum ContentYes438,23712810.955.870.8412810.955.870.84
RA2-CCCecum ContentYes876,01725114.366.860.8625014.366.860.86
RA3-CCCecum ContentYes1234,00112411.425.880.8512411.425.880.85
RA1-CMCecum MucosaYes487,62828317.096.650.8228117.096.640.82
RA2-CMCecum MucosaYes478,40422915.356.520.8322915.356.510.83
RA3-CMCecum MucosaYes8105,85336019.197.270.8635919.197.260.86
RA4-CMCecum MucosaYes8102,65035219.607.260.8635119.607.260.86
RA5-CMCecum MucosaYes1293,78327917.096.390.7927617.086.370.79
RA6-CMCecum MucosaYes1290,62929917.247.040.8629717.237.030.86
RA7-CMCecum MucosaYes1299,63233616.827.330.8733516.817.310.87
RA8-CMCecum MucosaYes1284,48229716.117.040.8629716.117.040.86
RA9-CMCecum MucosaYes1279,89329615.766.960.8529215.646.950.85
RA10-CMCecum MucosaYes1279,59129516.507.080.8629416.477.080.86
RA11-CMCecum MucosaYes1269,99718112.526.360.8518112.526.360.85
RA12-CMCecum MucosaYes1269,81618713.416.290.8318713.416.300.83
RA1-FecesFecesYes176,43217013.835.990.8117013.835.980.81
RA2-FecesFecesYes157,33317013.155.780.7817013.155.770.78
RA3-FecesFecesYes269,42019014.016.430.8519014.016.420.85
RA4-FecesFecesYes353,83913111.525.900.8413011.295.900.84
RA5-FecesFecesYes464,20016212.785.820.7916212.785.830.79
RA6-FecesFecesYes445,97010010.285.510.8310010.285.500.83
RA7-FecesFecesYes454,93116912.505.770.7816912.505.780.78
RA8-FecesFecesYes553,0779510.075.390.829510.075.390.82
RA9-FecesFecesYes657,49216012.815.980.8216012.815.980.82
RA10-FecesFecesYes755,93412012.365.790.8412012.365.780.84
RA11-FecesFecesYes869,79122614.586.610.8522614.586.620.85
RA12-FecesFecesYes852,32011510.935.740.8411510.935.730.84
RA13-FecesFecesYes857,35517713.045.950.8017713.045.930.79
RA14-FecesFecesYes956,10912311.875.570.8012311.875.560.80
RA15-FecesFecesYes1047,29212311.065.840.8412311.065.840.84
RA16-FecesFecesYes1144,69310611.325.550.8310611.325.540.82
RA17-FecesFecesYes1287,82926615.157.010.8726515.157.000.87
RA18-FecesFecesYes1259,65722214.216.730.8622214.216.740.86
RA19-FecesFecesYes1246,10811910.885.540.8011910.885.530.80
N is the number of operational taxonomical units. CT, RA, CC and CM indicate wild-type, rheumatoid arthritis, cecal content and cecal mucosa, respectively. Mice (8–12 weeks old) were injected with 5 µL of 100% CFA (5 µg) in the right ankle joint (ipsilateral joint) four times at 1-week intervals, followed by mechanical or thermal behavioral tests. a Weeks since experiment start. b Number of sequences.
Table 2. Differentially enriched taxa in mice with rheumatoid arthritis and healthy controls.
Taxa (Phylum)p ValueFDRBonferroniAUC95% CIOR No/Yes95% CIDeltaFold-Change in ExpressionMean CTMean RA
Fecal sample
Spirochaetes0.000130.00160.00160.830.63–1383.65–1005.622.15159,762.91.120
Patescibacteria0.00130.00750.0140.950.84–1202.39–447.711.932.561.910.75
Proteobacteria0.00740.030.0740.870.73–10.050–0.421.41−2.220.71.56
Desulfobacterota0.0380.120.350.790.6–0.970.090–0.681.23−1.591.282.04
Mucus sample
Parabasalia0.00470.020.0650.770.62–0.9313.21.66–287.141.5811,023.730.090
Bacteroidetes0.00510.020.0660.850.69–113.332.07–130.861.341.15.825.29
Spirochaetes0.0260.0830.310.760.55–0.9619.252.4–425.961.688.981.320.15
Deferribacteres0.0000670.00110.00110.950.87–10.030–0.282.16−2.440.631.54
Campilobacterota0.00280.020.0420.870.71–10.040–0.311.72−1.491.992.96
FDR, false discovery rate; AUC, area under the receiver operating characteristic curve; CI, confidence interval; CT, healthy control; RA, rheumatoid arthritis.
Table 3. Composition of the fecal microbiome at weeks 1–12.
PhylumGenusCT–RAp ValueGenusCT–RAp Value
FirmicutesEubacterium_Ventriosum Ijms 23 03527 i0010.01Roseburia Ijms 23 03527 i0020.01
Lachnospiraceae_UCG001 Ijms 23 03527 i0030.05Ruminococcus Ijms 23 03527 i0040.01
Monoglobus Ijms 23 03527 i0050.05Turicibacter Ijms 23 03527 i0060.05
Oscillospiraceae_NK4A214 Ijms 23 03527 i0070.05Tuzzerella Ijms 23 03527 i0080.05
Bacilli_RF39 Ijms 23 03527 i0090.05
BacteroidetesAlistipes Ijms 23 03527 i0100.05Odoribacter Ijms 23 03527 i0110.01
Alloprevotella Ijms 23 03527 i0120.05Parabacteroides Ijms 23 03527 i0130.05
Rikenella Ijms 23 03527 i0140.01Rikenellaceae_RC9 Ijms 23 03527 i0150.05
Muribaculum Ijms 23 03527 i0160.01
ProteobacteriaParasutterella Ijms 23 03527 i0170.01
SpirochaetesTreponema Ijms 23 03527 i0180.005Brachyspira Ijms 23 03527 i0190.05
PatescibacteriaCandidatus_Saccharimonas Ijms 23 03527 i0200.05Candidatus_Arthromis Ijms 23 03527 i0210.01
CT–RA, comparison of control and rheumatoid arthritis samples.
Table 4. Composition of the cecal mucus microbiome at weeks 1–12 and 12.
PhylumGenusWeek 1–12Week 12
CT–RA
(ICR Mice)
p ValueTDAG8KO-RA
(B6 Mice)
p valueCT–RA–CCL2d
(ICR Mice)
p Value
FirmicutesNegativibacillus Ijms 23 03527 i0220.01NANA Ijms 23 03527 i0230.05
Eubacterium_Brachy Ijms 23 03527 i0240.05NANA Ijms 23 03527 i0250.05
Eubacterium_Siraeum Ijms 23 03527 i0260.005 Ijms 23 03527 i0270.05 Ijms 23 03527 i0280.05
Eubacterium_XylanophilumNANA Ijms 23 03527 i0290.001 Ijms 23 03527 i0300.05
Intestinimonas Ijms 23 03527 i0310.05NANA Ijms 23 03527 i0320.05
Lachnospiraceae_A2 Ijms 23 03527 i0330.05 Ijms 23 03527 i0340.05 Ijms 23 03527 i0350.05
Anaeroplasma Ijms 23 03527 i0360.01NANA Ijms 23 03527 i0370.05
Blautia Ijms 23 03527 i0380.05NANA Ijms 23 03527 i0390.01
Lachnoclostridium Ijms 23 03527 i0400.05 Ijms 23 03527 i0410.05NANA
Anaerovoracaceae_UCG001 Ijms 23 03527 i042NANANA Ijms 23 03527 i0430.05
Marvinbryantia Ijms 23 03527 i0440.005NANA Ijms 23 03527 i0450.05
ClostridiaNANA Ijms 23 03527 i0460.05 Ijms 23 03527 i0470.05
OscillospiraceaeNANA Ijms 23 03527 i0480.01 Ijms 23 03527 i0490.05
RuminococcusNANA Ijms 23 03527 i0500.05 Ijms 23 03527 i0510.05
BacteroidetesParaprevotellaNANA Ijms 23 03527 i0520.05 Ijms 23 03527 i0530.01
Alloprevotella Ijms 23 03527 i0540.05NANA Ijms 23 03527 i0550.05
Muribaculaceae Ijms 23 03527 i0560.01NANA Ijms 23 03527 i0570.05
RikenellaceaeNANA Ijms 23 03527 i0580.05 Ijms 23 03527 i0590.01
ProteobacteriaMitochondria Ijms 23 03527 i0600.01NANA Ijms 23 03527 i0610.01
Pseudomonas Ijms 23 03527 i0620.01NANA Ijms 23 03527 i0630.01
SpirochaetesTreponema Ijms 23 03527 i0640.005NANA Ijms 23 03527 i0650.01
CampilobacterotHelicobacter Ijms 23 03527 i0660.01NANA Ijms 23 03527 i0670.01
DeferribacteresMucispirillum Ijms 23 03527 i0680.005NANA Ijms 23 03527 i0690.01
CT–RA (ICR mice), comparison of control and rheumatoid arthritis; TDAG8KO-RA (B6 mice), comparison of rheumatoid arthritis and T-cell death-associated gene 8 deficiency; CT–RA–CCL2d (ICR mice), comparison of control and rheumatoid arthritis and salicylanilide derivative.
Publisher’s Note: MDPI stays neutral with regard to jurisdictional claims in published maps and institutional affiliations.

