
Metabolomic and Transcript Analysis Revealed a Sex-Specific Effect of Glyphosate in Zebrafish Liver

 ,
,  , and
, and
Abstract
:1. Introduction
2. Results
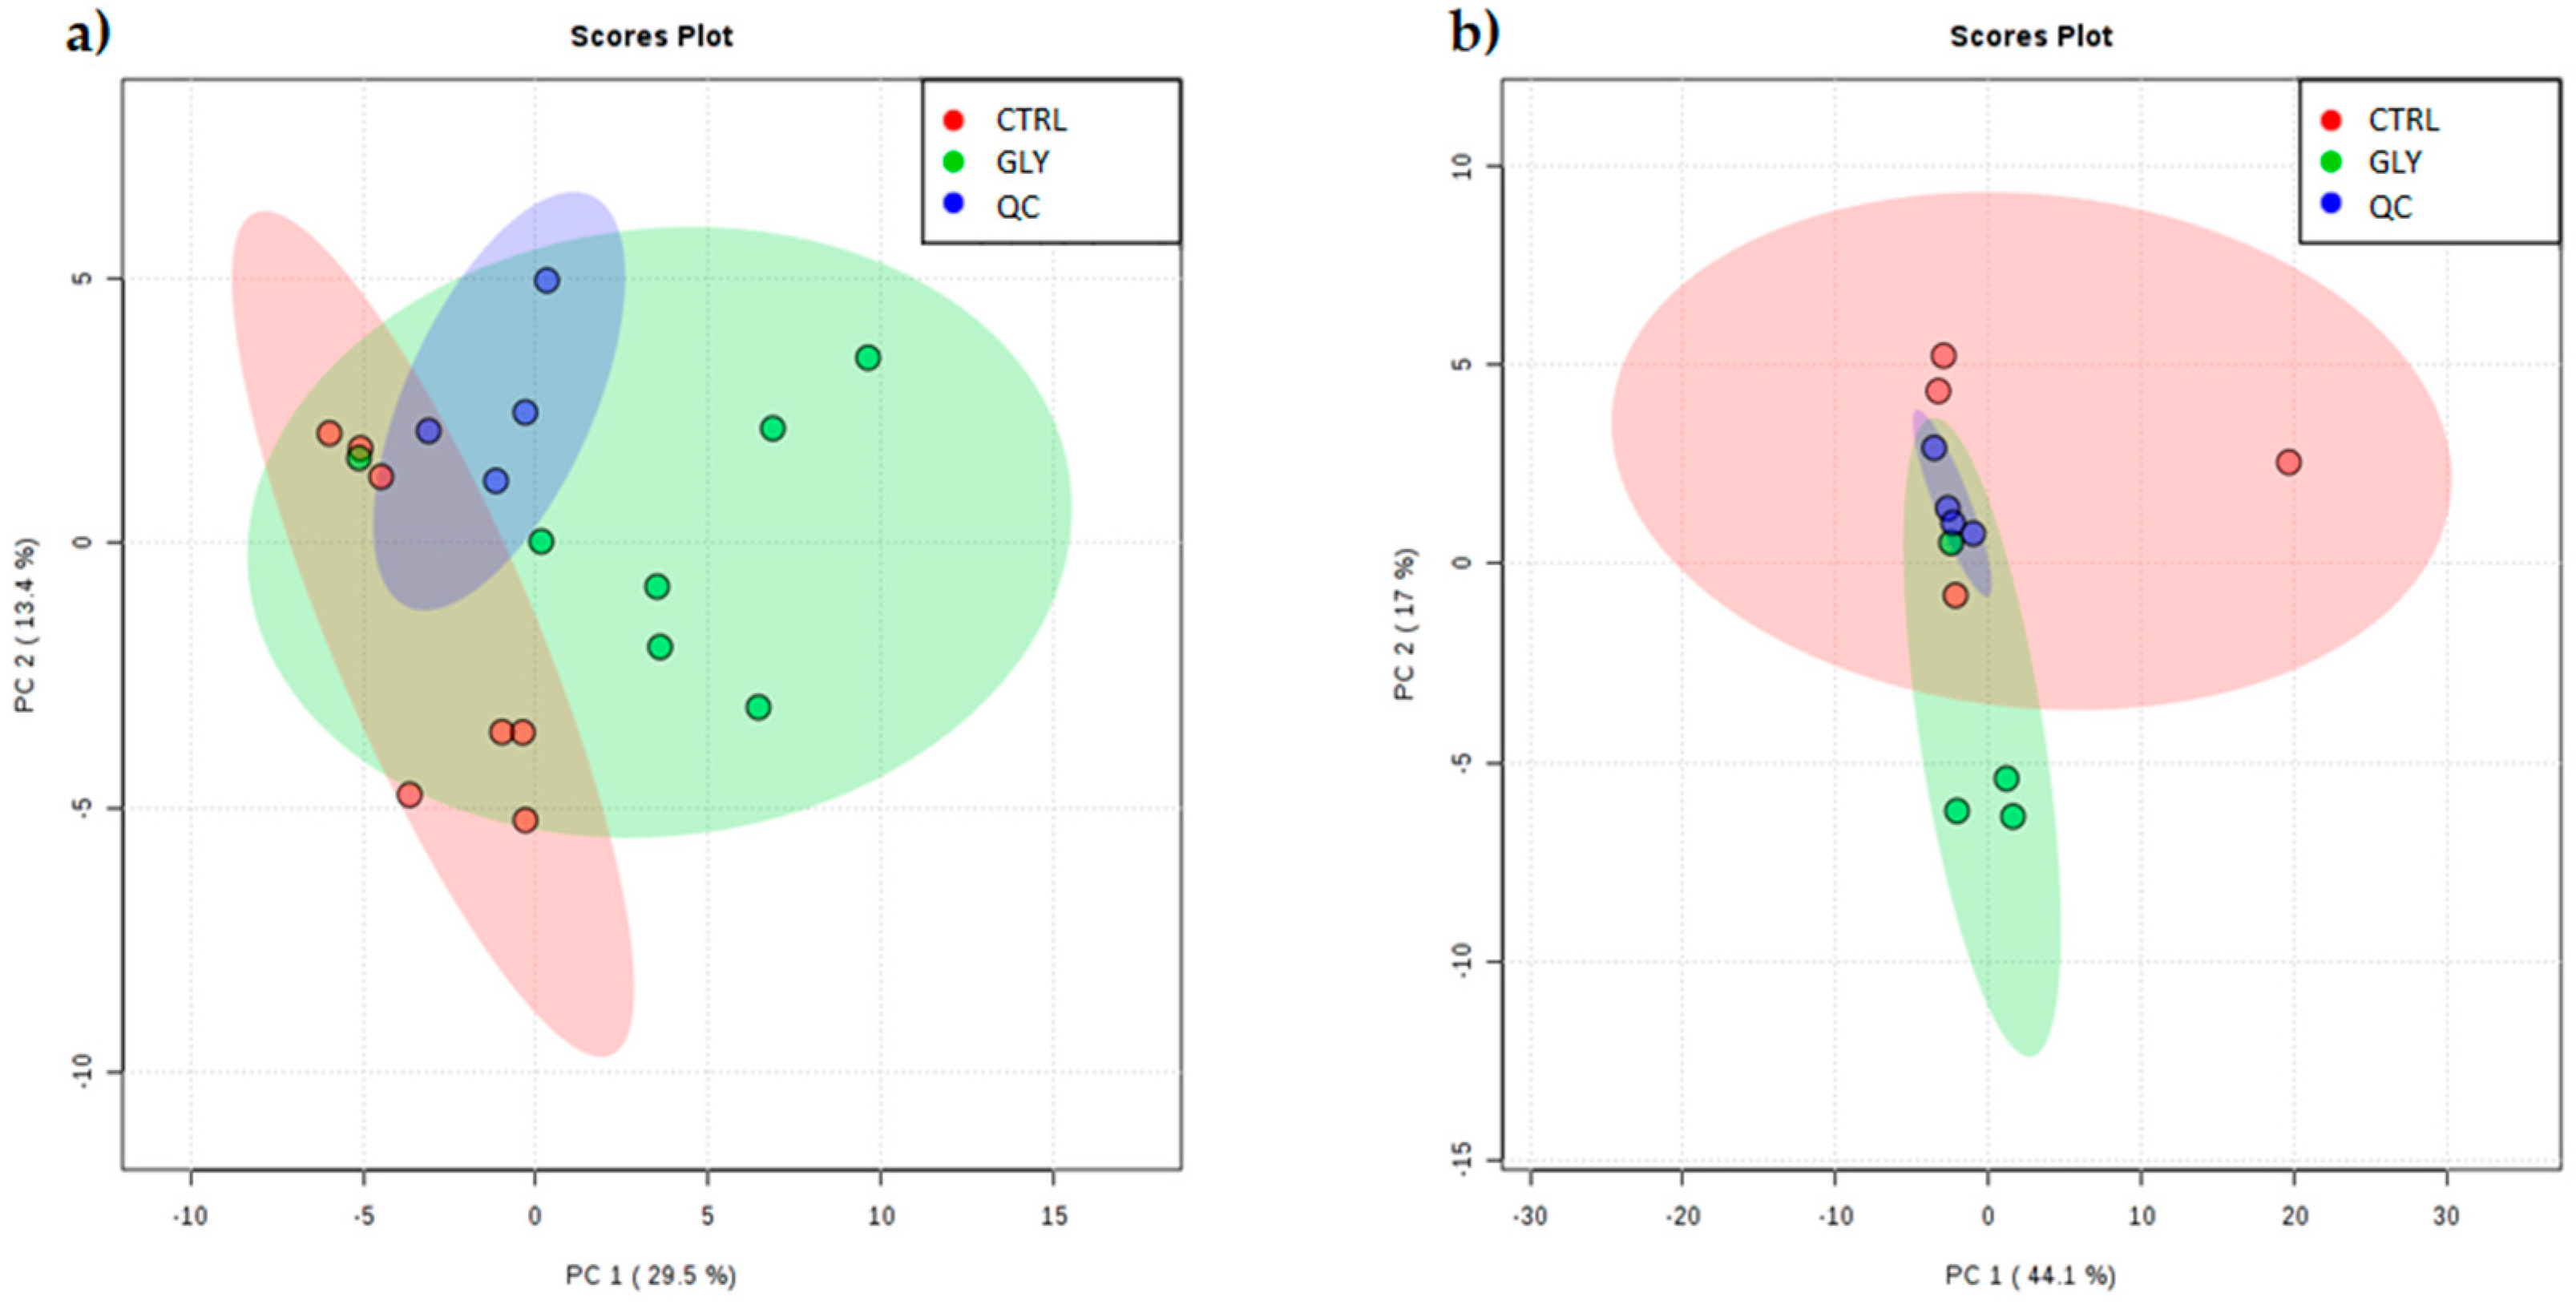
2.1. Metabolomic Characterization of the Liver
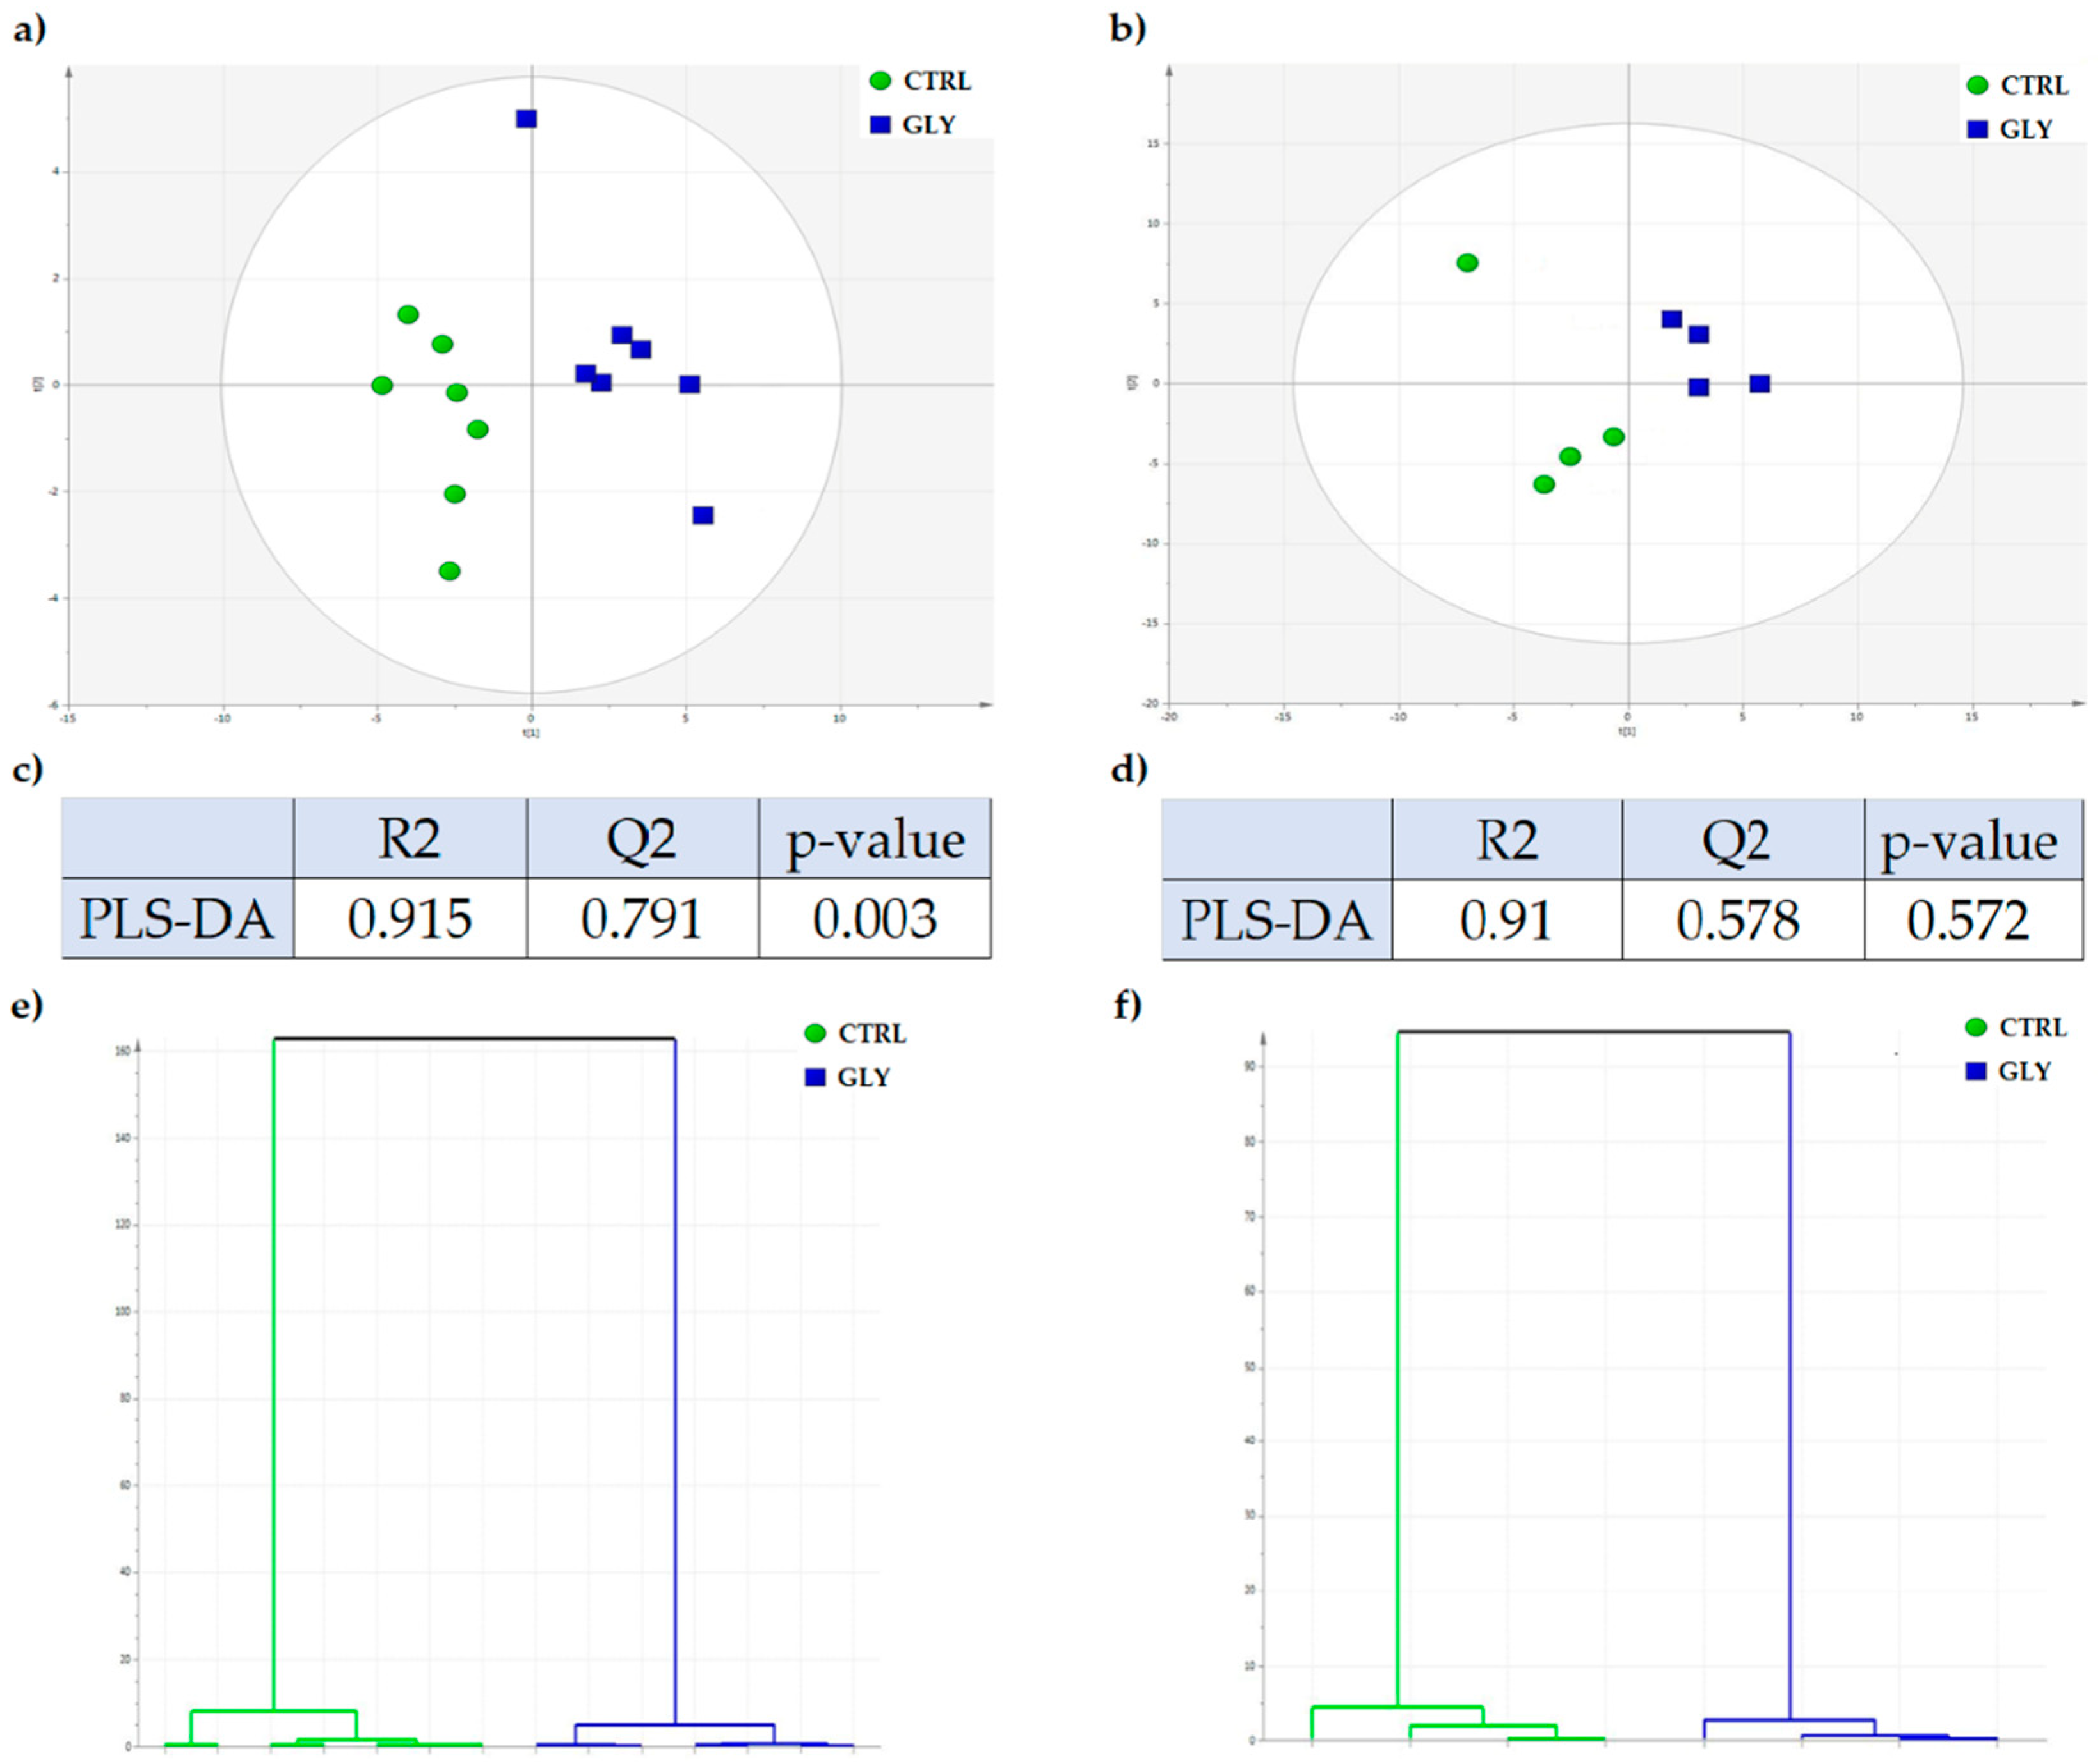
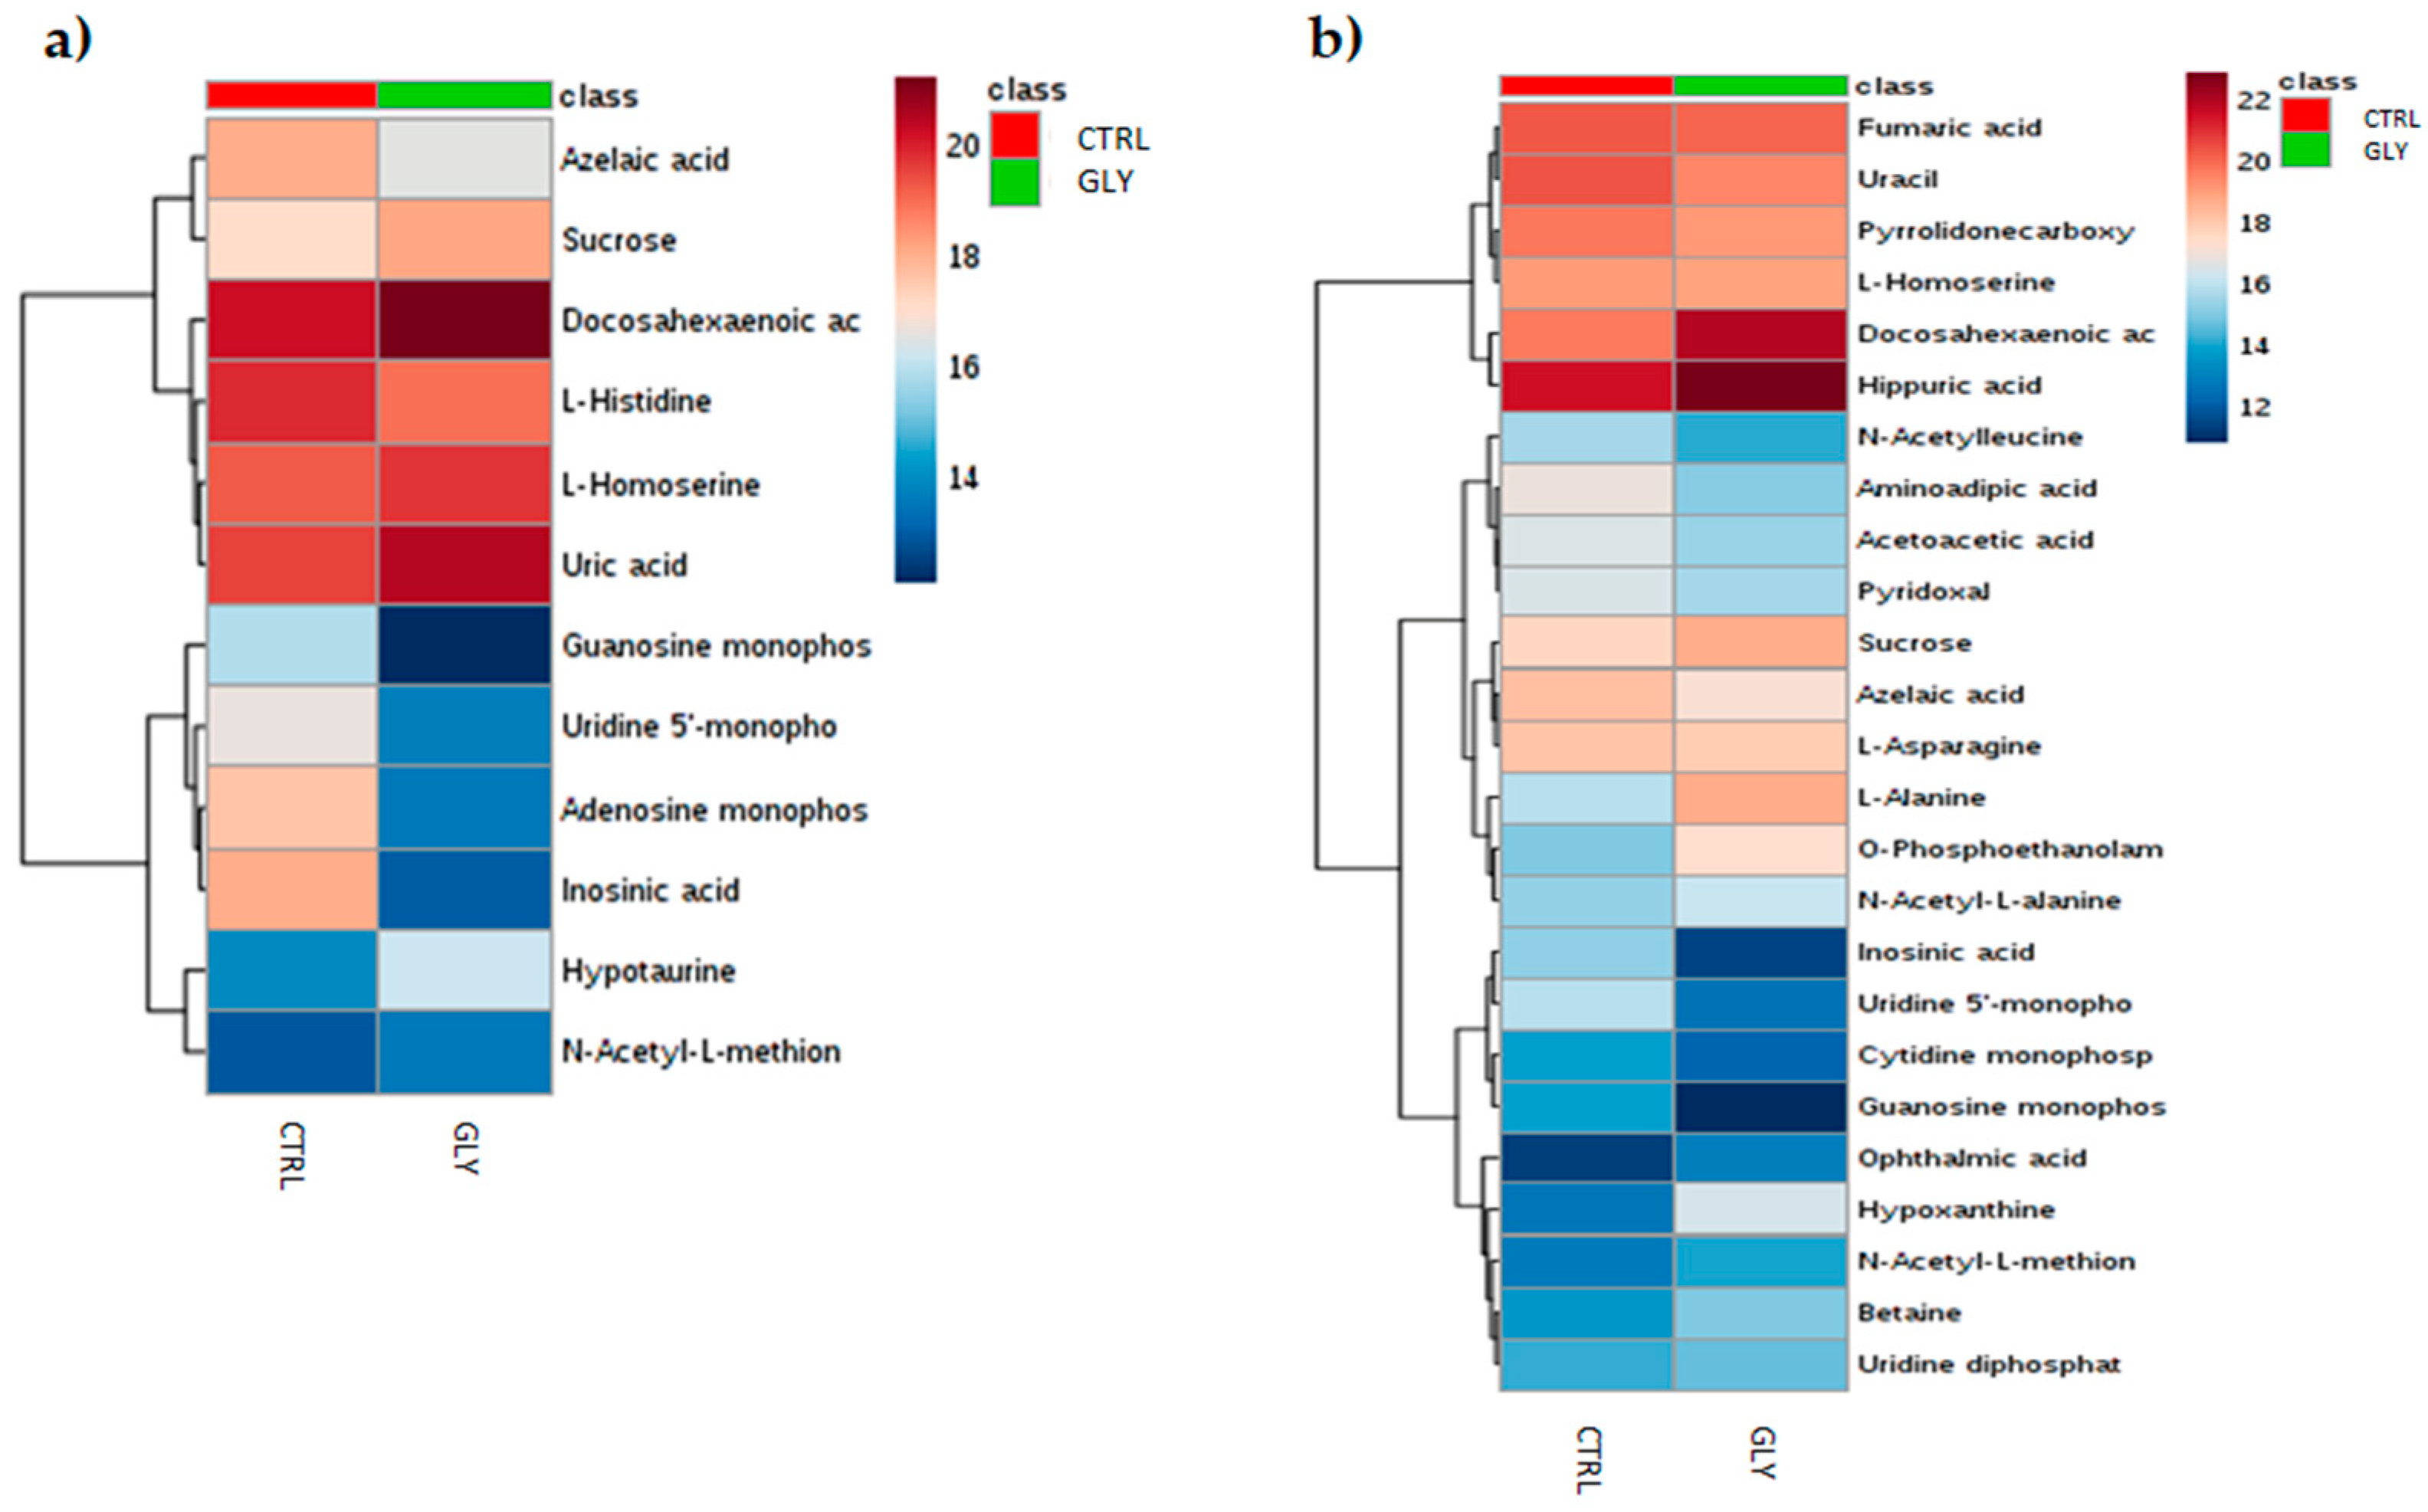
2.2. Univariate Analysis to Identify Metabolic Profiles
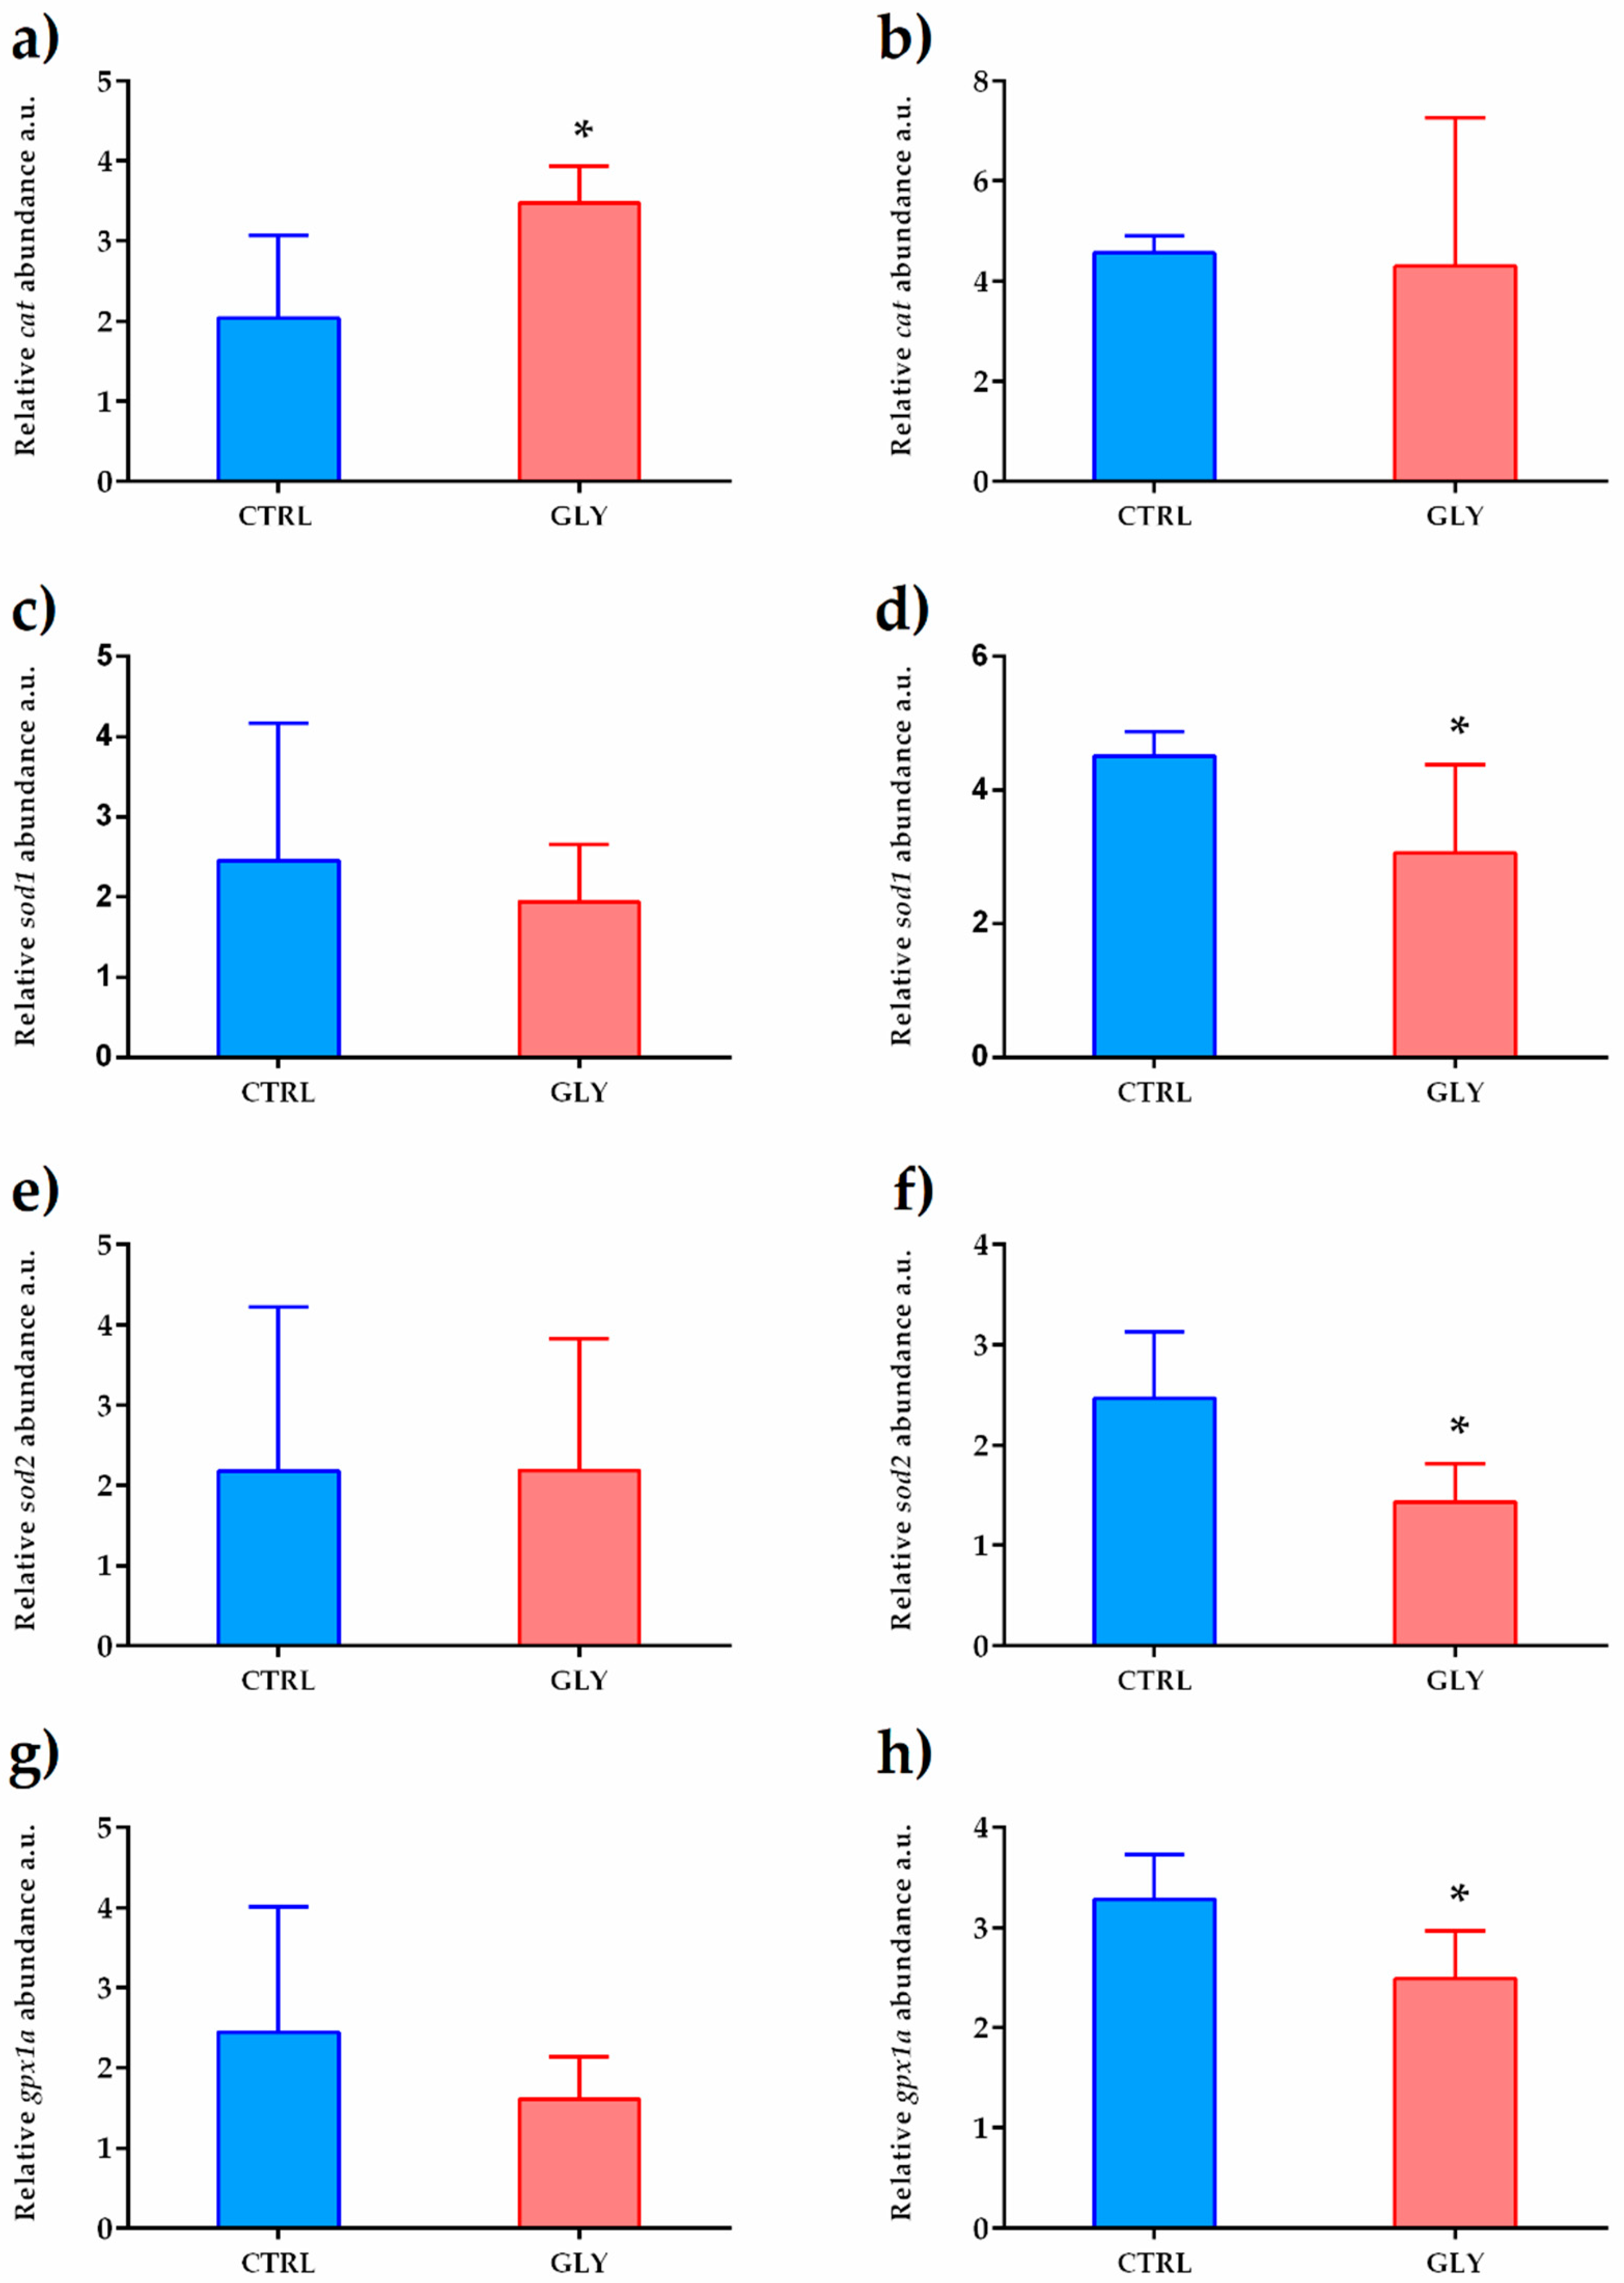
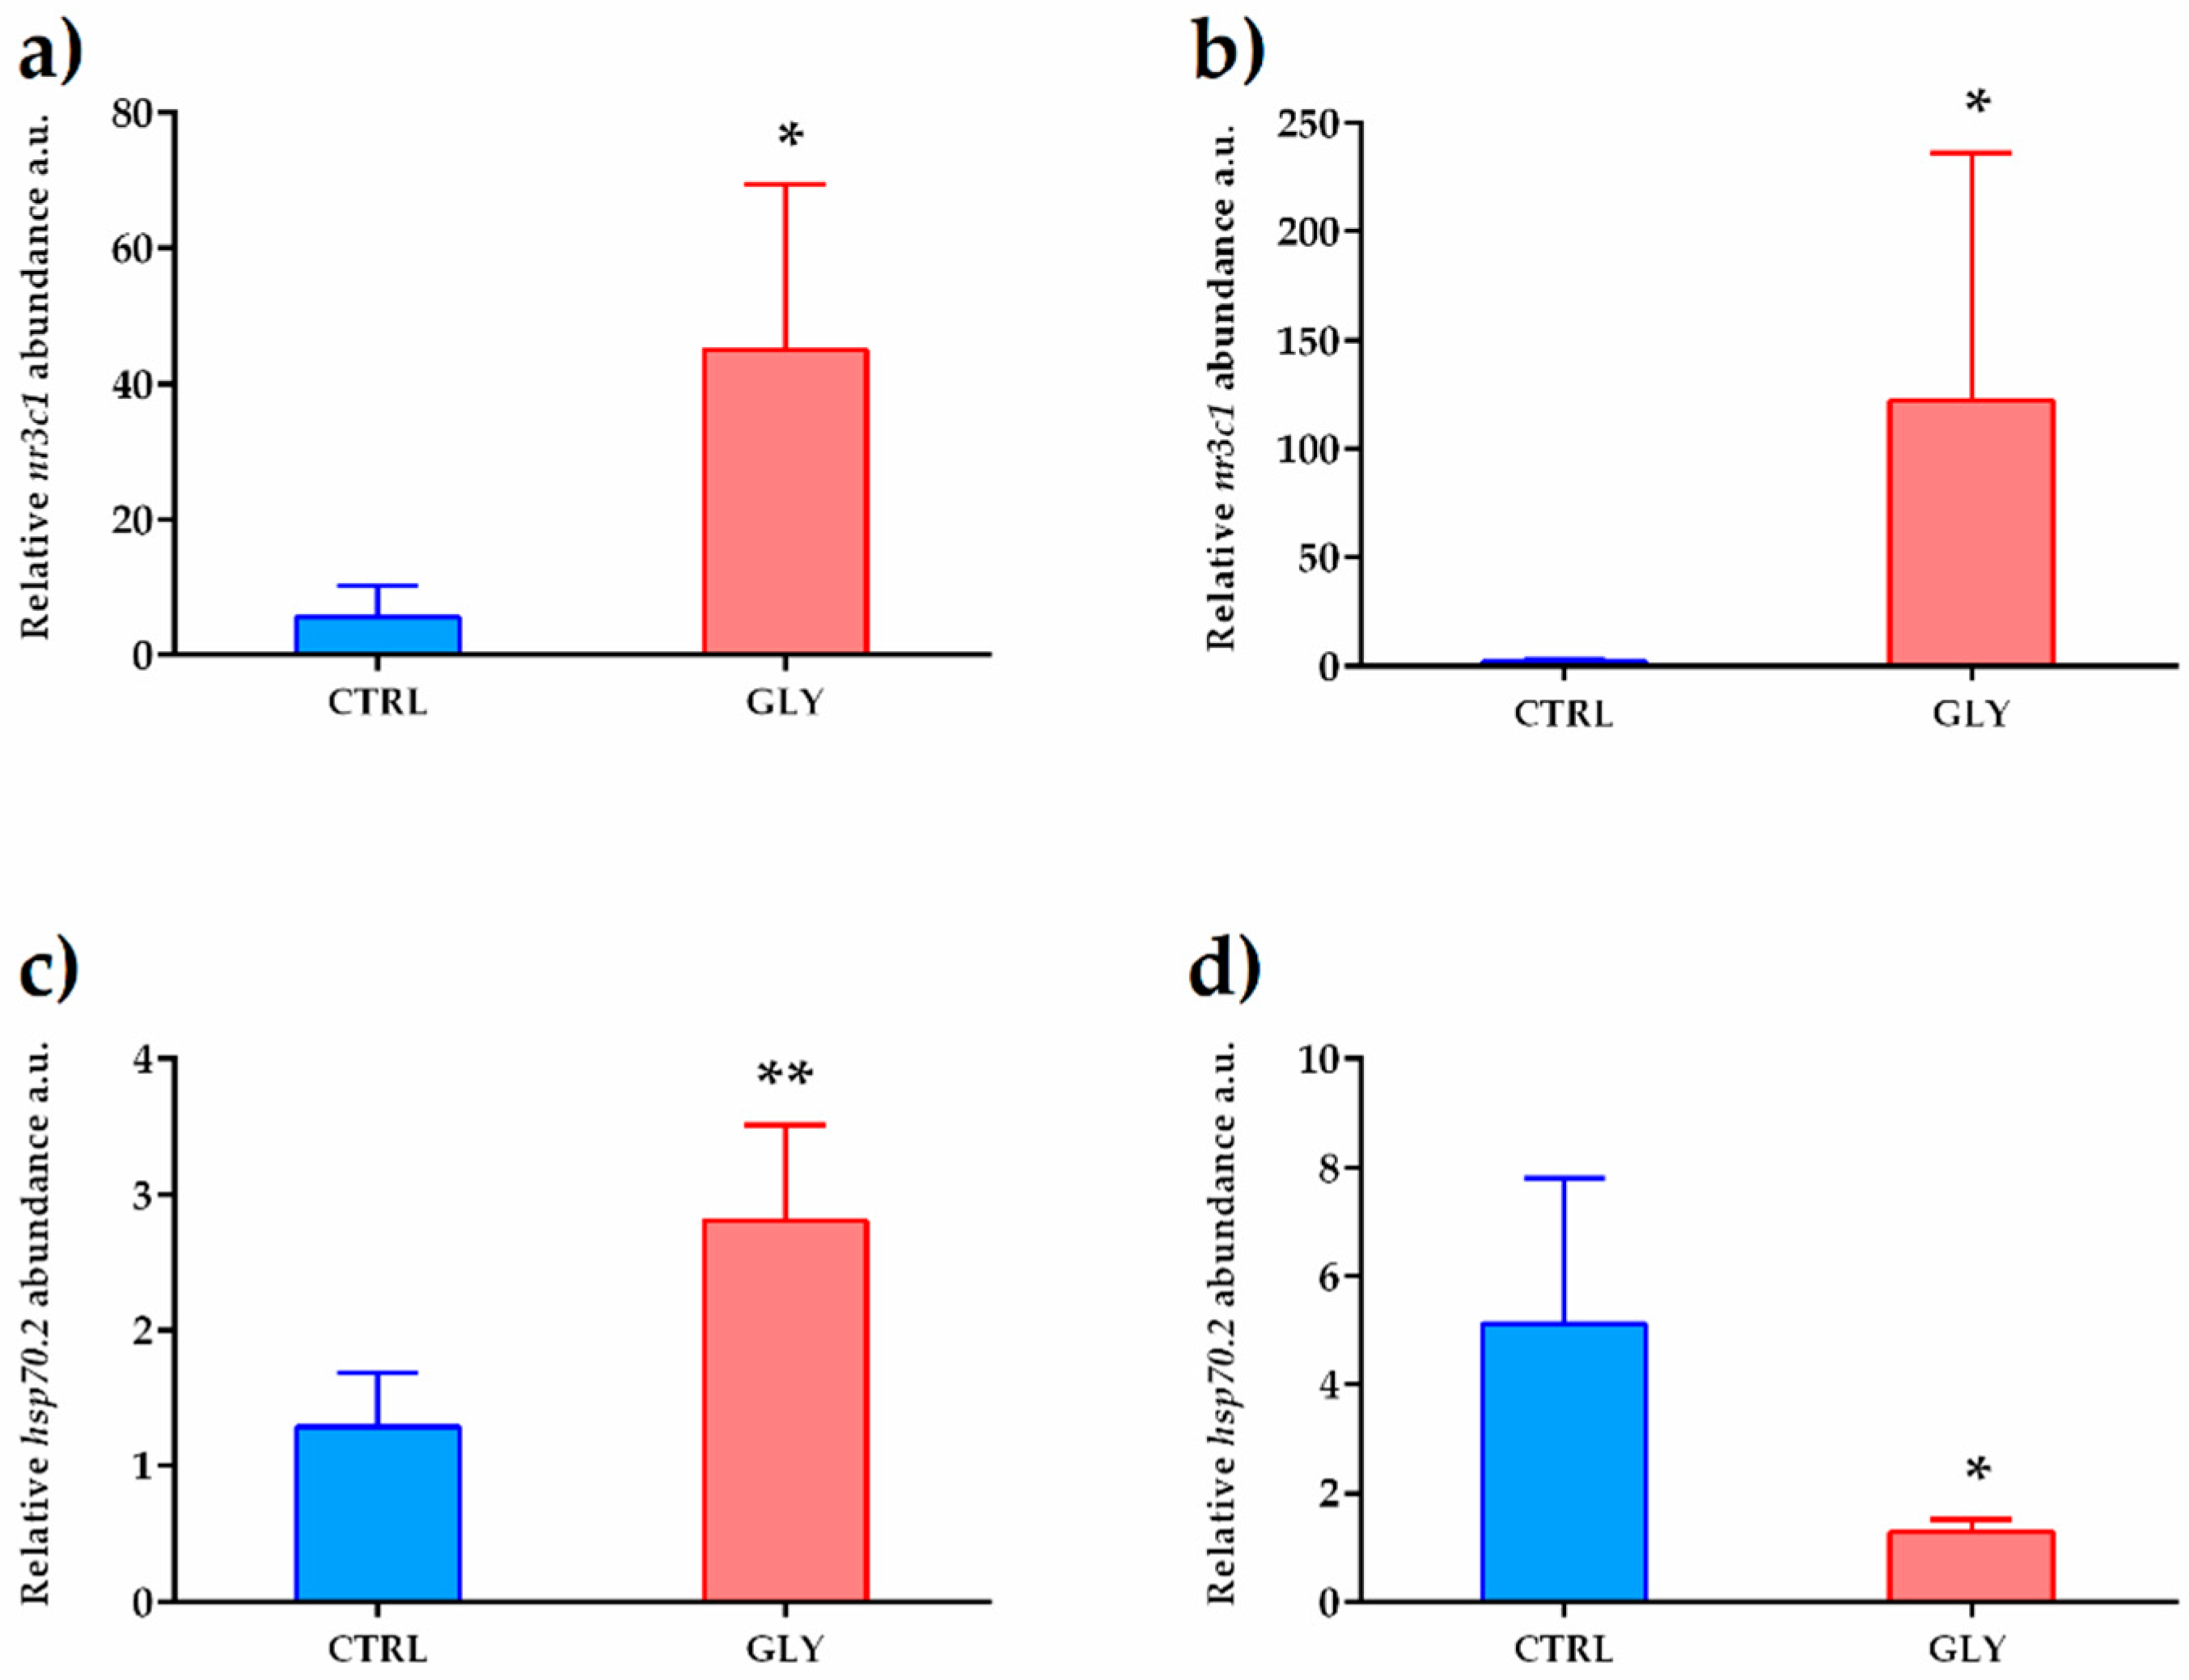
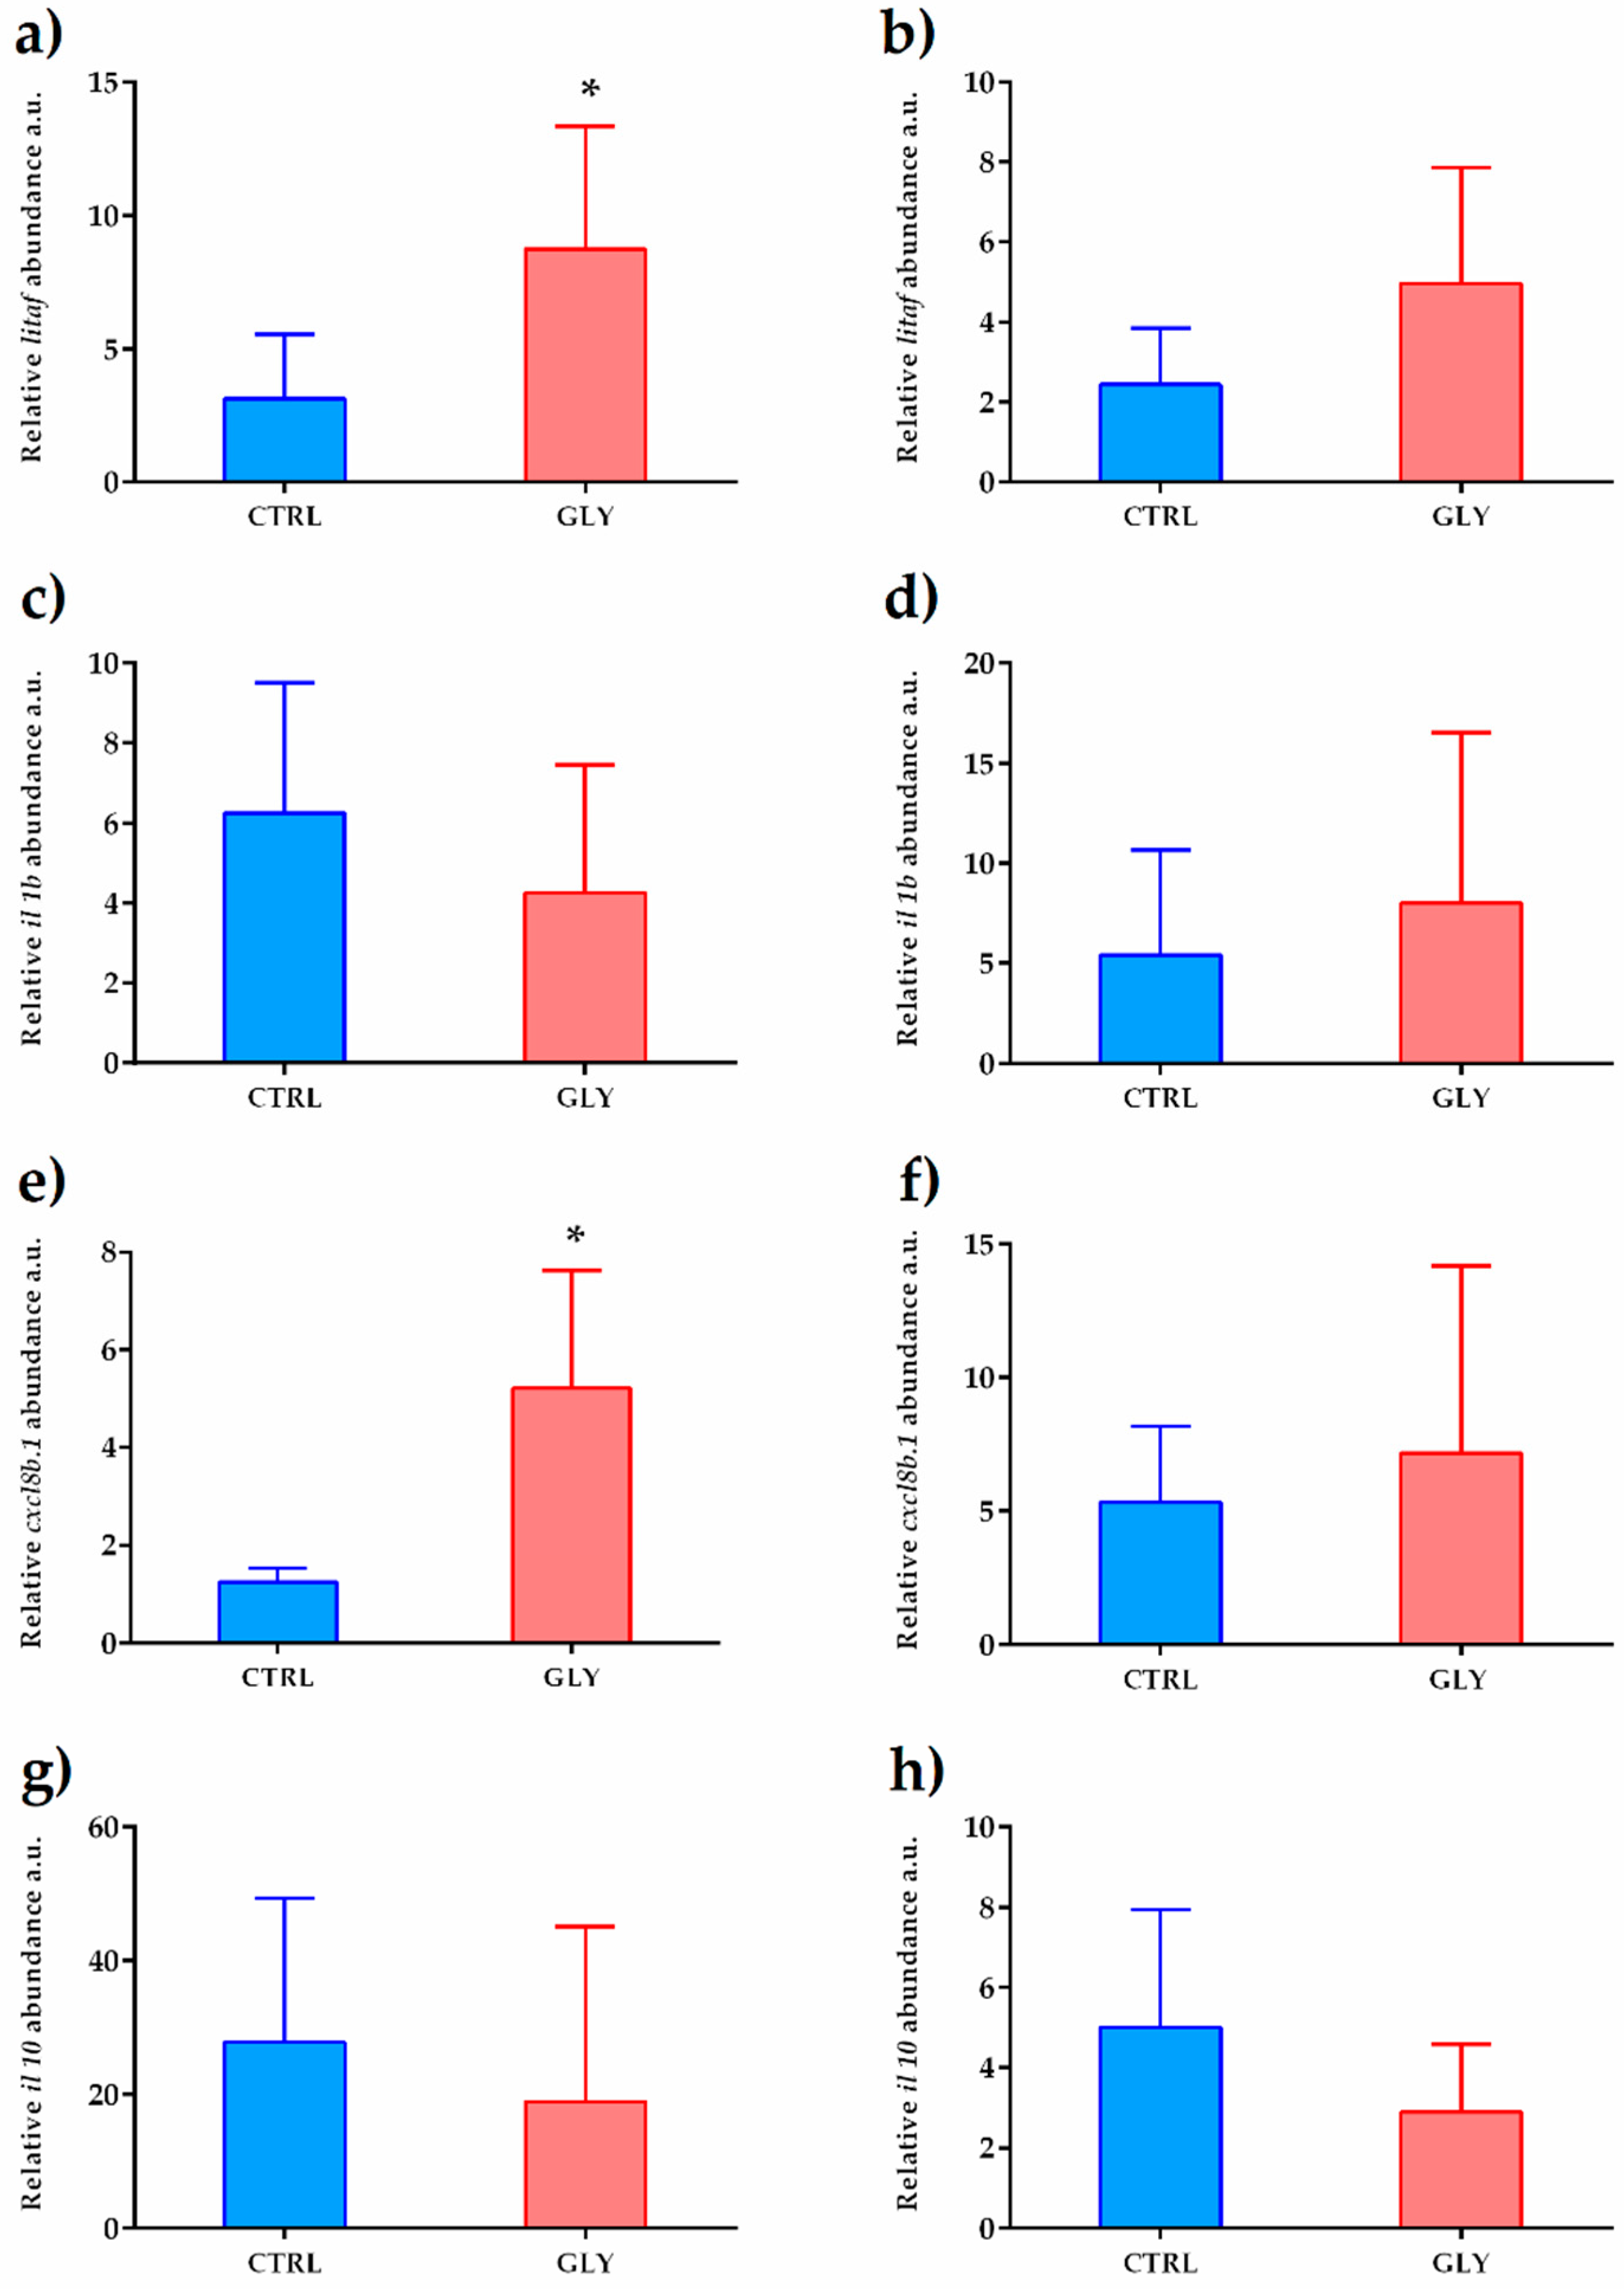
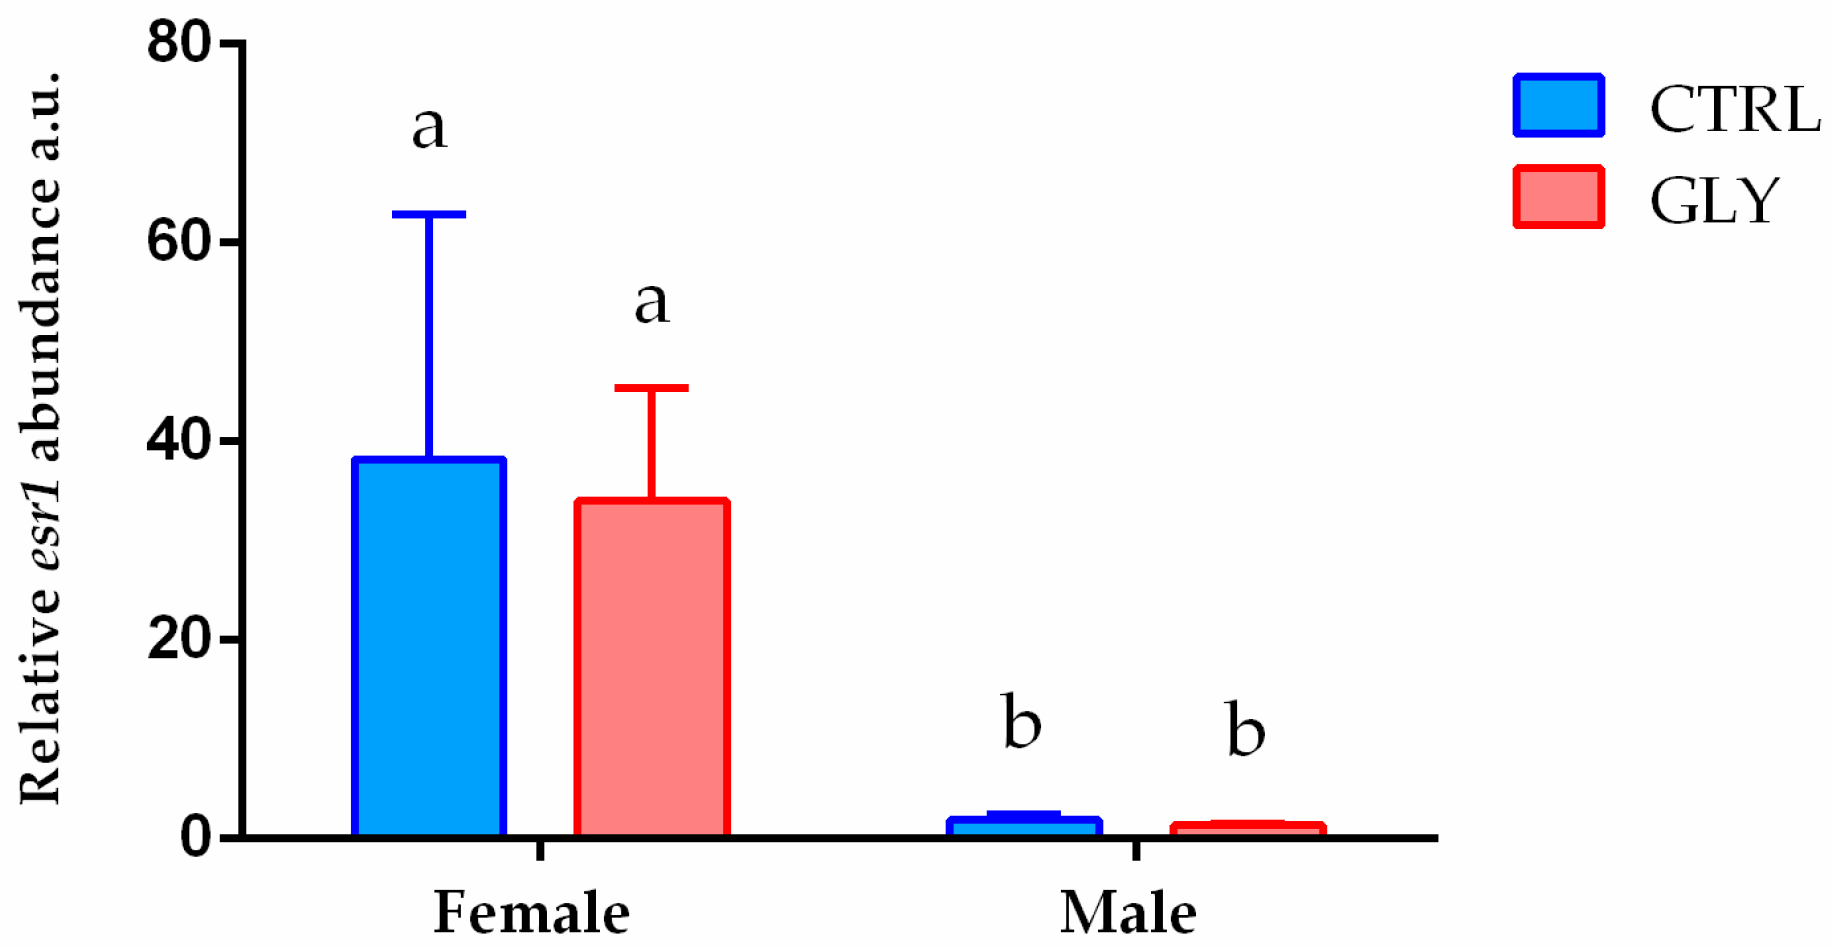
2.3. Liver Transcript Analysis
3. Discussion
4. Materials and Methods
4.1. Animal Treatment and Maintenance
4.2. Metabolite Extraction and UHPLC-ESI-MS Analysis
4.3. RNA Extraction and cDNA Synthesis
4.4. Real-Time PCR
4.5. Statistical Analysis
4.5.1. Metabolomic Statistical Analysis
4.5.2. Pathway Analysis
4.5.3. Gene Expression Statistical Analysis
Author Contributions
Funding
Institutional Review Board Statement
Informed Consent Statement
Data Availability Statement
Acknowledgments
Conflicts of Interest
References
- Sikorski, J.A.; Gruys, K.J. Understanding Glyphosate’s Molecular Mode of Action with EPSP Synthase: Evidence Favoring an Allosteric Inhibitor Model. Acc. Chem. Res. 1997, 30, 2–8. [Google Scholar] [CrossRef]
- Forner-Piquer, I.; Faucherre, A.; Byram, J.; Blaquiere, M.; de Bock, F.; Gamet-Payrastre, L.; Ellero-Simatos, S.; Audinat, E.; Jopling, C.; Marchi, N. Differential impact of dose-range glyphosate on locomotor behavior, neuronal activity, glio-cerebrovascular structures, and transcript regulations in zebrafish larvae. Chemosphere 2021, 267, 128986. [Google Scholar] [CrossRef] [PubMed]
- Milić, M.; Žunec, S.; Micek, V.; Kašuba, V.; Mikolić, A.; Lovaković, B.T.; Semren, T.Ž.; Pavičić, I.; Čermak, A.M.M.; Pizent, A.; et al. Oxidative stress, cholinesterase activity, and DNA damage in the liver, whole blood, and plasma of Wistar rats following a 28-day exposure to glyphosate. Arh. Hig. Rada Toksikol. 2018, 69, 154–168. [Google Scholar] [CrossRef] [Green Version]
- Mutwedu, V.B.; Nyongesa, A.W.; Azine, P.C.; Chiregereza, D.K.; Ngoumtsop, V.H.; Mugumaarhahama, Y.; Ayagirwe, R.B.B. Growth performance and reproductive function impairment of glyphosate-based herbicide in male guinea pig (Cavia porcellus). Vet. Med. Sci. 2021, 7, 1047–1055. [Google Scholar] [CrossRef]
- Mesnage, R.; Renney, G.; Séralini, G.E.; Ward, M.; Antoniou, M.N. Multiomics reveal non-alcoholic fatty liver disease in rats following chronic exposure to an ultra-low dose of Roundup herbicide. Sci. Rep. 2017, 7, 39328. [Google Scholar] [CrossRef] [PubMed] [Green Version]
- Zheng, T.; Jia, R.; Cao, L.; Du, J.; Gu, Z.; He, Q.; Xu, P.; Yin, G. Effects of chronic glyphosate exposure on antioxdative status, metabolism and immune response in tilapia (GIFT, Oreochromis niloticus). Comp. Biochem. Physiol. Part C Toxicol. Pharmacol. 2021, 239, 108878. [Google Scholar] [CrossRef]
- Le Du-Carrée, J.; Saliou, F.; Cachot, J.; Morin, T.; Danion, M. Developmental effect of parental or direct chronic exposure to environmental concentration of glyphosate on the larvae of rainbow trout, Oncorhynchus mykiss. Aquat. Toxicol. 2021, 237, 105894. [Google Scholar] [CrossRef]
- Le Du-Carrée, J.; Boukhari, R.; Cachot, J.; Cabon, J.; Louboutin, L.; Morin, T.; Danion, M. Generational effects of a chronic exposure to a low environmentally relevant concentration of glyphosate on rainbow trout, Oncorhynchus mykiss. Sci. Total Environ. 2021, 801, 149462. [Google Scholar] [CrossRef]
- Du-Carrée, J.L.; Morin, T.; Danion, M. Impact of chronic exposure of rainbow trout, Oncorhynchus mykiss, to low doses of glyphosate or glyphosate-based herbicides. Aquat. Toxicol. 2021, 230, 105687. [Google Scholar] [CrossRef]
- Weeks Santos, S.; Gonzalez, P.; Cormier, B.; Mazzella, N.; Bonnaud, B.; Morin, S.; Clérandeau, C.; Morin, B.; Cachot, J. A glyphosate-based herbicide induces sub-lethal effects in early life stages and liver cell line of rainbow trout, Oncorhynchus mykiss. Aquat. Toxicol. 2019, 216, 105291. [Google Scholar] [CrossRef]
- Gillezeau, C.; Van Gerwen, M.; Shaffer, R.M.; Rana, I.; Zhang, L.; Sheppard, L.; Taioli, E. The evidence of human exposure to glyphosate: A review. Environ. Health 2019, 18, 2. [Google Scholar] [CrossRef] [PubMed] [Green Version]
- Van Bruggen, A.H.C.; He, M.M.; Shin, K.; Mai, V.; Jeong, K.C.; Finckh, M.R.; Morris, J.G. Environmental and health effects of the herbicide glyphosate. Sci. Total Environ. 2018, 616–617, 255–268. [Google Scholar] [CrossRef] [PubMed]
- Hove-Jensen, B.; Andersen, K.R.; Kilstrup, M.; Martinussen, J.; Switzer, R.L.; Willemoës, M. Phosphoribosyl Diphosphate (PRPP): Biosynthesis, Enzymology, Utilization, and Metabolic Significance. Microbiol. Mol. Biol. Rev. 2016, 81, e00040-16. [Google Scholar] [CrossRef] [PubMed] [Green Version]
- George, C.; Minter, D.A. Hyperuricemia. In Urology at a Glance; Springer: Berlin/Heidelberg, Germany, 2021; pp. 107–109. [Google Scholar] [CrossRef]
- Li, M.H.; Ruan, L.Y.; Zhou, J.W.; Fu, Y.H.; Jiang, L.; Zhao, H.; Wang, J.S. Metabolic profiling of goldfish (Carassius auratis) after long-term glyphosate-based herbicide exposure. Aquat. Toxicol. 2017, 188, 159–169. [Google Scholar] [CrossRef] [PubMed]
- Holeček, M. Histidine in Health and Disease: Metabolism, Physiological Importance, and Use as a Supplement Milan. Nutrients 2020, 12, 848. [Google Scholar] [CrossRef] [Green Version]
- Gao, Y.J.; Liu, Y.J.; Chen, X.Q.; Yang, H.J.; Li, X.F.; Tian, L.X. Effects of graded levels of histidine on growth performance, digested enzymes activities, erythrocyte osmotic fragility and hypoxia-tolerance of juvenile grass carp Ctenopharyngodon idella. Aquaculture 2016, 452, 388–394. [Google Scholar] [CrossRef]
- Liu, W.-h.; Liu, T.-c.; Yin, M. chin Beneficial effects of histidine and carnosine on ethanol-induced chronic liver injury. Food Chem. Toxicol. 2008, 46, 1503–1509. [Google Scholar] [CrossRef]
- Yan, S.L.; Wu, S.T.; Yin, M.C.; Chen, H.T.; Chen, H.C. Protective effects from carnosine and histidine on acetaminophen-induced liver injury. J. Food Sci. 2009, 74, H259–H265. [Google Scholar] [CrossRef]
- Baseggio Conrado, A.; D’Angelantonio, M.; D’Erme, M.; Pecci, L.; Fontana, M. The Interaction of Hypotaurine and Other Sulfinates with Reactive Oxygen and Nitrogen Species: A Survey of Reaction Mechanisms. Adv. Exp. Med. Biol. 2017, 975, 573–583. [Google Scholar] [CrossRef] [Green Version]
- Yancey, P.H. Organic osmolytes as compatible, metabolic and counteracting cytoprotectants in high osmolarity and other stresses. J. Exp. Biol. 2005, 208, 2819–2830. [Google Scholar] [CrossRef] [Green Version]
- Kwon, D.Y.; Jung, Y.S.; Kim, S.J.; Park, H.K.; Park, J.H.; Kim, Y.C. Impaired sulfur-amino acid metabolism and oxidative stress in nonalcoholic fatty liver are alleviated by betaine supplementation in rats. J. Nutr. 2009, 139, 63–68. [Google Scholar] [CrossRef] [PubMed] [Green Version]
- Mizota, T.; Hishiki, T.; Shinoda, M.; Naito, Y.; Hirukawa, K.; Masugi, Y.; Itano, O.; Obara, H.; Kitago, M.; Yagi, H.; et al. The hypotaurine-taurine pathway as an antioxidative mechanism in patients with acute liver failure. J. Clin. Biochem. Nutr. 2022, 70, 54–63. [Google Scholar] [CrossRef] [PubMed]
- Avci, B.; Bilge, S.S.; Arslan, G.; Alici, O.; Darakci, O.; Baratzada, T.; Ciftcioglu, E.; Yardan, T.; Bozkurt, A. Protective effects of dietary omega-3 fatty acid supplementation on organophosphate poisoning. Toxicol. Ind. Health 2018, 34, 69–82. [Google Scholar] [CrossRef] [PubMed]
- He, J.; Bai, K.; Hong, B.; Zhang, F.; Zheng, S. Docosahexaenoic acid attenuates carbon tetrachloride-induced hepatic fibrosis in rats. Int. Immunopharmacol. 2017, 53, 56–62. [Google Scholar] [CrossRef]
- Malandrakis, E.E.; Dadali, O.; Golomazou, E.; Kavouras, M.; Dailianis, S.; Chadio, S.; Exadactylos, A.; Panagiotaki, P. DNA damage and differential gene expression associated with physical stress in gilthead seabream (Sparus aurata). Gen. Comp. Endocrinol. 2016, 236, 98–104. [Google Scholar] [CrossRef]
- Alves, R.N.; Cordeiro, O.; Silva, T.S.; Richard, N.; de Vareilles, M.; Marino, G.; Di Marco, P.; Rodrigues, P.M.; Conceição, L.E.C. Metabolic molecular indicators of chronic stress in gilthead seabream (Sparus aurata) using comparative proteomics. Aquaculture 2010, 299, 57–66. [Google Scholar] [CrossRef]
- Traversi, I.; Gioacchini, G.; Scorolli, A.; Mita, D.G.; Carnevali, O.; Mandich, A. Alkylphenolic contaminants in the diet: Sparus aurata juveniles hepatic response. Gen. Comp. Endocrinol. 2014, 205, 185–196. [Google Scholar] [CrossRef]
- Stankiewicz, A.R.; Lachapelle, G.; Foo, C.P.Z.; Radicioni, S.M.; Mosser, D.D. Hsp70 inhibits heat-induced apoptosis upstream of mitochondria by preventing Bax translocation. J. Biol. Chem. 2005, 280, 38729–38739. [Google Scholar] [CrossRef] [Green Version]
- Migliarini, B.; Campisi, A.M.; Maradonna, F.; Truzzi, C.; Annibaldi, A.; Scarponi, G.; Carnevali, O. Effects of cadmium exposure on testis apoptosis in the marine teleost Gobius niger. Gen. Comp. Endocrinol. 2005, 142, 241–247. [Google Scholar] [CrossRef]
- Carnevali, O.; Maradonna, F. Exposure to xenobiotic compounds: Looking for new biomarkers. Gen. Comp. Endocrinol. 2003, 131, 203–208. [Google Scholar] [CrossRef]
- Maradonna, F.; Carnevali, O. Vitellogenin, zona radiata protein, cathepsin D and heat shock protein 70 as biomarkers of exposure to xenobiotics. Biomarkers 2007, 12, 240–255. [Google Scholar] [CrossRef] [PubMed]
- Randazzo, B.; Chemello, G.; Tortarolo, I.; Chiarello, G.L.; Zalas, M.; Santini, A.; Liberatore, M.; Liberatore, M.; Selli, E.; Olivotto, I. A Novel Photocatalytic Purification System for Fish Culture. Zebrafish 2017, 14, 411–421. [Google Scholar] [CrossRef] [PubMed]
- Gioacchini, G.; Giorgini, E.; Olivotto, I.; Maradonna, F.; Merrifield, D.L.; Carnevali, O. The influence of probiotics on zebrafish Danio rerio innate immunity and hepatic stress. Zebrafish 2014, 11, 98–106. [Google Scholar] [CrossRef]
- Soudani, N.; Chaâbane, M.; Ghorbel, I.; Elwej, A.; Boudawara, T.; Zeghal, N. Glyphosate disrupts redox status and up-regulates metallothionein I and II genes expression in the liver of adult rats. Alleviation by quercetin. Gen. Physiol. Biophys. 2019, 38, 123–134. [Google Scholar] [CrossRef] [PubMed]
- Modesto, K.A.; Martinez, C.B.R. Roundup causes oxidative stress in liver and inhibits acetylcholinesterase in muscle and brain of the fish Prochilodus lineatus. Chemosphere 2010, 78, 294–299. [Google Scholar] [CrossRef] [PubMed]
- Muñoz, J.P.; Bleak, T.C.; Calaf, G.M. Glyphosate and the key characteristics of an endocrine disruptor: A review. Chemosphere 2021, 270, 128619. [Google Scholar] [CrossRef]
- Zhu, D.; Zhao, Z.; Cui, G.; Chang, S.; Hu, L.; See, Y.X.; Lim, M.G.L.; Guo, D.; Chen, X.; Robson, P.; et al. Single-Cell Transcriptome Analysis Reveals Estrogen Signaling Coordinately Augments One-Carbon, Polyamine, and Purine Synthesis in Breast Cancer. Cell Rep. 2018, 25, 2285–2298.e4. [Google Scholar] [CrossRef] [Green Version]
- Tang, Z.R.; Zhang, R.; Lian, Z.X.; Deng, S.L.; Yu, K. Estrogen-Receptor Expression and Function in Female Reproductive Disease. Cells 2019, 8, 1123. [Google Scholar] [CrossRef] [Green Version]
- Hussain, Y.; Ding, Q.; Connelly, P.W.; Brunt, J.H.; Ban, M.R.; McIntyre, A.D.; Huff, M.W.; Gros, R.; Hegele, R.A.; Feldman, R.D. G-protein estrogen receptor as a regulator of low-density lipoprotein cholesterol metabolism: Cellular and population genetic studies. Arterioscler. Thromb. Vasc. Biol. 2015, 35, 213–221. [Google Scholar] [CrossRef] [Green Version]
- Avtanski, D.; Novaira, H.J.; Wu, S.; Romero, C.J.; Kineman, R.; Luque, R.M.; Wondisford, F.; Radovick, S. Both estrogen receptor α and β stimulate pituitary GH gene expression. Mol. Endocrinol. 2014, 28, 40–52. [Google Scholar] [CrossRef]
- Zhang, Z.C.; Liu, Y.; Xiao, L.L.; Li, S.F.; Jiang, J.H.; Zhao, Y.; Qian, S.W.; Tang, Q.Q.; Li, X. Upregulation of miR-125b by estrogen protects against non-alcoholic fatty liver in female mice. J. Hepatol. 2015, 63, 1466–1475. [Google Scholar] [CrossRef] [PubMed]
- Ladisa, C.; Ma, Y.; Habibi, H.R. Seasonally related metabolic changes and energy allocation associated with growth and reproductive phases in the liver of male goldfish (Carassius auratus). J. Proteomics 2021, 241, 104237. [Google Scholar] [CrossRef] [PubMed]
- Giommi, C.; Habibi, H.R.; Candelma, M.; Carnevali, O.; Maradonna, F. Probiotic Administration Mitigates Bisphenol A Reproductive Toxicity in Zebrafish. Int. J. Mol. Sci. 2021, 22, 9314. [Google Scholar] [CrossRef] [PubMed]

| (a) | (b) | ||
| Metabolites | VIP (12) | Metabolites | VIP (25) |
| N-Acetyl-L-methionine | 1.3711 | Hippuric acid | 1.98682 |
| Docosahexaenoic acid | 1.29572 | Aminoadipic acid | 1.86273 |
| Sucrose | 1.26731 | Docosahexaenoic acid | 1.68523 |
| L-Homoserine | 1.25124 | N-Acetylleucine | 1.66798 |
| Azelaic acid | 1.23396 | Cytidine monophosphate | 1.65299 |
| Hypotaurine | 1.23293 | Uracil | 1.64123 |
| Adenosine monophosphate | 1.13408 | N-Acetyl-L-alanine | 1.63765 |
| Uridine 5′-monophosphate | 1.07566 | Uridine 5′-monophosphate | 1.61569 |
| Guanosine monophosphate | 1.038 | Hypoxanthine | 1.58986 |
| Uric acid | 1.02329 | Sucrose | 1.57968 |
| L-Histidine | 1.02007 | Acetoacetic acid | 1.57219 |
| Inosinic acid | 1.00379 | L-Alanine | 1.44502 |
| Betaine | 1.32999 | ||
| Pyrrolidonecarboxylic acid | 1.29793 | ||
| N-Acetyl-L-methionine | 1.21579 | ||
| Pyridoxal | 1.15716 | ||
| Azelaic acid | 1.11747 | ||
| Uridine diphosphate-N-acetylglucosamine | 1.09991 | ||
| L-Asparagine | 1.06611 | ||
| Inosinic acid | 1.04028 | ||
| Ophthalmic acid | 1.03219 | ||
| Guanosine monophosphate | 1.03092 | ||
| O-Phosphoethanolamine | 1.01278 | ||
| L-Homoserine | 1.01177 | ||
| Fumaric acid | 1.00205 | ||
| (a) | (b) | ||||||
| Metabolite Name | p-Value | FDR | Metabolite Name | p-Value | FDR | ||
| Sucrose | 0.001231 | 0.008438 | ↑ | Aminoadipic acid | 0.000236 | 0.0017 | ↓ |
| Azelaic acid | 0.001406 | 0.008438 | ↓ | ||||
| Hypotaurine | 0.002545 | 0.01018 | ↑ | ||||
| L-Homoserine | 0.005126 | 0.012943 | ↑ | ||||
| Uric acid | 0.005954 | 0.012943 | ↑ | ||||
| Adenosine monophosphate | 0.006472 | 0.012943 | ↓ | ||||
| Uridine 5′-monophosphate | 0.010393 | 0.015703 | ↓ | ||||
| L-Histidine | 0.010824 | 0.015703 | ↓ | ||||
| Docosahexaenoic acid | 0.011778 | 0.015703 | ↑ | ||||
| Guanosine monophosphate | 0.018083 | 0.019942 | ↓ | ||||
| Inosinic acid | 0.01828 | 0.019942 | ↓ | ||||
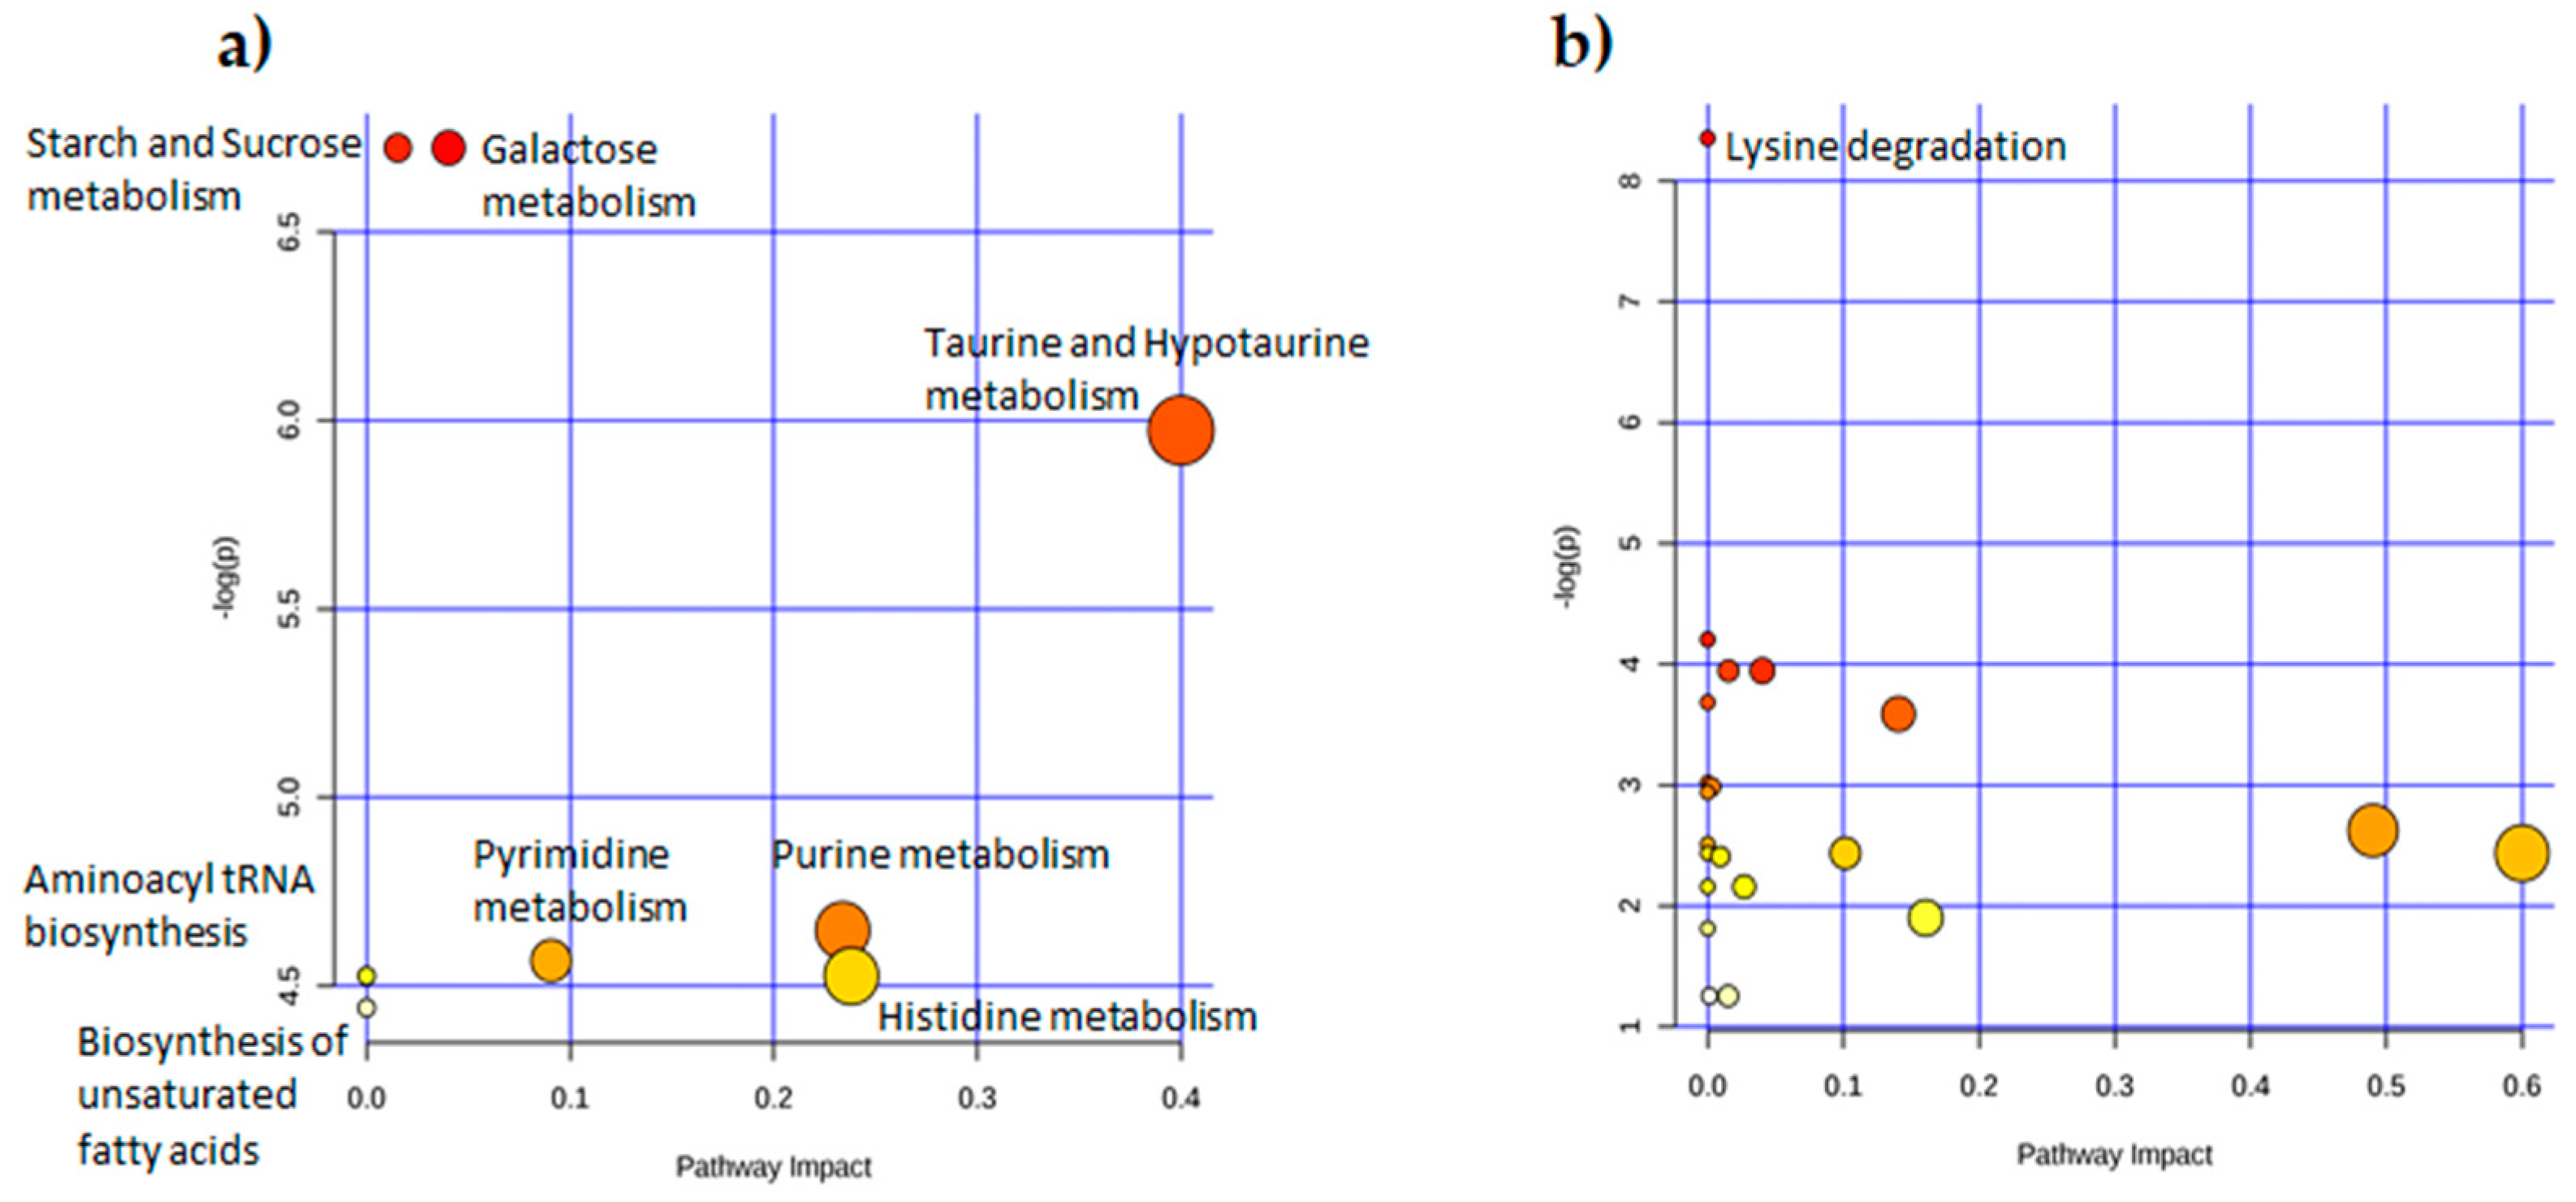
| (a) | (b) | ||||
| Pathway Name | FDR | Impact | Pathway Name | FDR | Impact |
| Galactose metabolism | 0.005414 | 0.04029 | Lysine degradation | 0.0051841 | 0 |
| Starch and sucrose metabolism | 0.005414 | 0.01534 | |||
| Taurine and hypotaurine metabolism | 0.0076346 | 0.4 | |||
| Purine metabolism | 0.011778 | 0.23384 | |||
| Pyrimidine metabolism | 0.011778 | 0.09066 | |||
| Histidine metabolism | 0.011778 | 0.2381 | |||
| Nitrogen metabolism | 0.011778 | 0 | |||
| Aminoacyl-tRNA biosynthesis | 0.011778 | 0 | |||
| Biosynthesis of unsaturated fatty acids | 0.011778 | 0 | |||
| Name | Forword | Reverse | Efficiency (Tm°) | Accession Number |
|---|---|---|---|---|
| cat | CCAAGGTCTGGTCCCATAAA | GCACATGGGTCCATCTCTC | 60° | NM_130912 |
| sod1 | GTCGTCTGGCTTGTGGAGTG | TGTCAGCGGGCTAGTGCTT | 60° | NM_131294 |
| sod2 | CCGGACTATGTTAAGGCCATCT | ACACTCGGTTGCTCTCTTTTCTCT | 60° | NM_199976 |
| gpx1a | ACCTGTCCGCGAAACTATTG | TGACTGTTGTGCCTCAAAG | 59° | NM_001007281.2 |
| nr3c1 | CGCCTTTAATCATGGGAGAA | AGACCTTGGTCCCCTTCACT | 58° | NM_001020711.3 |
| hsp70.2 | TGTTCAGTTCTCTGCCGTTG | AAAGCACTGAGGGACGCTAA | 58° | NM_001362360.1 |
| litaf | TTGTGGTGGGGTTTGATG | TTGGGGCATTTTATTTTGTAAG | 53° | NM_001002184.1 |
| il 1b | GTGGATTGGGGTTTGATGTG | GCTGGGGATGTGGACTTC | 54° | NM_212844.2 |
| cxcl8b.1 | ACTCGGACTGAAGGTGACTC | CCACGTCTCGGTAGGATTGAG | 58° | NM_001327985 |
| il 10 | GCCGTGGAGCAGGTGAAG | GAAGATGTCAAACTCACTCATGGCT | 58° | NM_001020785 |
| esr1 | GGTCCAGTGTGGTGTCCTCT | AGAAAGCTTTGCATCCCTCA | 58° | NM_152959.1 |
| rpl13a | TCTGGAGACTGTAAGAGGTATGC | AGACGCACAATCTTGAGAGCAG | 59° | NM_198143 |
| rplp0 | CTGAACATCTCGCCCTTCTC | TAGCCGATCTGCAGACACAC | 60° | NM_131580 |
Publisher’s Note: MDPI stays neutral with regard to jurisdictional claims in published maps and institutional affiliations. |
© 2022 by the authors. Licensee MDPI, Basel, Switzerland. This article is an open access article distributed under the terms and conditions of the Creative Commons Attribution (CC BY) license (https://creativecommons.org/licenses/by/4.0/).
Share and Cite
Giommi, C.; Ladisa, C.; Carnevali, O.; Maradonna, F.; Habibi, H.R. Metabolomic and Transcript Analysis Revealed a Sex-Specific Effect of Glyphosate in Zebrafish Liver. Int. J. Mol. Sci. 2022, 23, 2724. https://doi.org/10.3390/ijms23052724
Giommi C, Ladisa C, Carnevali O, Maradonna F, Habibi HR. Metabolomic and Transcript Analysis Revealed a Sex-Specific Effect of Glyphosate in Zebrafish Liver. International Journal of Molecular Sciences. 2022; 23(5):2724. https://doi.org/10.3390/ijms23052724
Chicago/Turabian StyleGiommi, Christian, Claudia Ladisa, Oliana Carnevali, Francesca Maradonna, and Hamid R. Habibi. 2022. "Metabolomic and Transcript Analysis Revealed a Sex-Specific Effect of Glyphosate in Zebrafish Liver" International Journal of Molecular Sciences 23, no. 5: 2724. https://doi.org/10.3390/ijms23052724
APA StyleGiommi, C., Ladisa, C., Carnevali, O., Maradonna, F., & Habibi, H. R. (2022). Metabolomic and Transcript Analysis Revealed a Sex-Specific Effect of Glyphosate in Zebrafish Liver. International Journal of Molecular Sciences, 23(5), 2724. https://doi.org/10.3390/ijms23052724