Article

Quantitative Trait Locus Mapping of Salt Tolerance in Wild Rice Oryza longistaminata

1
State Key Laboratory of Hybrid Rice, Hongshan Laboratory of Hubei Province, Key Laboratory for Research and Utilization of Heterosis in Indica Rice of Ministry of Agriculture, Engineering Research Center for Plant Biotechnology and Germplasm Utilization of Ministry of Education, College of Life Science, Wuhan University, Wuhan 430072, China
2
Hubei Provincial Key Laboratory for Protection and Application of Special Plants in Wuling Area of China, College of Life Sciences, South-Central University for Nationalities, Wuhan 430074, China
3
State Key Laboratory for Conservation and Utilization of Subtropical Agro-Bioresour, College of Agriculture, Guangxi University, Nanning 530004, China
*
Author to whom correspondence should be addressed.
Int. J. Mol. Sci. 2022, 23(4), 2379; https://doi.org/10.3390/ijms23042379
Submission received: 26 January 2022 / Revised: 17 February 2022 / Accepted: 18 February 2022 / Published: 21 February 2022
(This article belongs to the Topic Plant Responses and Tolerance to Salinity Stress)

Abstract

:
Salt stress is one of the most severe adverse environments in rice production; increasing salinization is seriously endangering rice production around the world. In this study, a rice backcross inbred line (BIL) population derived from the cross of 9311 and wild rice Oryza longistaminata was employed to identify the favorable genetic loci of O. longistaminata for salt tolerance. A total of 27 quantitative trait loci (QTLs) related to salt tolerance were identified in 140 rice BILs, and 17 QTLs formed seven QTL clusters on different chromosomes, of which 18 QTLs were derived from O. longistaminata, and a QTL for salt injury score (SIS), water content of seedlings (WCS) under salt treatment, and relative water content of seedlings (RWCS) was repeatedly detected and colocalized at the same site on chromosome 2, and a cytochrome P450 86B1 (MH02t0466900) was suggested as the potential candidate gene responsible for the salt tolerance based on sequence and expression analysis. These findings laid the foundation for further improving rice salt tolerance through molecular breeding in the future.

1. Introduction

Soil salinity is one of the major environmental stress factors limiting the growth and yield of rice around the world [1], more than one third of the world’s irrigated lands are salinized to varying degrees [2]. Rice, which feeds more than half of the world’s population, is the most salt-sensitive cereal crop plant [3]. Salt stress not only causes osmotic stress and ionic toxicity in plants [4], but also induces oxidative stress [5], leading to leaf damage and yield reduction, or even death. Developing salt-tolerant rice varieties is the most effective and economical way to improve yield and expand rice production in salinized areas. Usually, rice responds differently to salt stress at different growth stages; seedling and reproductive stages are relatively more sensitive, and germination, tillering, and maturity stages are relatively more tolerant to salt stress [6].
Salt tolerance is a comprehensive trait, and various physiological and biochemical responses to salt stress are controlled by a variety of genes, which has a complex genetic basis. Identification of salt tolerance loci in rice, especially in the seedling stage, will help to promote the development of salt-tolerant rice, just as exemplified by the RIL FL478 and Saltol derived from IR29 and Pokkali [7]. So far, a large number of salt-tolerant associated QTLs have been identified using different populations, such as recombinant inbred lines (RILs) [8,9,10,11], and a few influential salt-tolerant loci, such as SKC1, have been fine mapped or cloned using map-based cloning strategies [10,12]. However, less QTLs related to salt tolerance have been reported from wild rice Oryza longistaminata.
Wild rice is an important gene pool for rice yield, quality, and resistance improvement [13,14]. O. longistaminata, an African wild rice species variety of AA genome, has a good performance in abiotic tolerance, but only a few genes have been discovered and there is little research on rice breeding [15,16,17,18]. In order to further explore the alien genes related to salt tolerance and broaden the genetic diversity of rice, 140 backcross inbred lines (BILs) derived from the cross of 9311 and wild rice O. longistaminata were investigated, and the salt injury indexes were scored based on evaluation of the characteristics, including seedling length, root length, seedling weight, and root weight. A total of 27 QTLs for seven salt-tolerant traits were identified in the BIL population in two separate experiments, of which 18 QTLs were derived from O. longistaminata, and 17 loci formed seven QTL clusters on different chromosomes. These findings will effectively broaden the genetic resources and help to improve the salt tolerance of rice.

2. Results

2.1. Phenotype Observation of the BIL Population under Salt Treatment

In order to know if the wild rice O. longistaminata harbor favorable genes for salt tolerance, we investigated the performance of the O. longistaminata BIL lines treated with 150 mM NaCl solution for seven days at seedling stage, using the parent 9311 as a control. Results showed that the BILs exhibited significant differences for salt tolerance; the salt injury scores ranged among 3–9 (Table 1) and showed very large coefficient of variation in BILs, indicating that the BILs had rich genetic diversity (Table S1). In the first test, the seedling length of the control ranged from 17.31 to 54.62 cm, with an average of 30.61 cm, while the seedling length of the treatment ranged from 13.57 to 34.71 cm, with an average of 21.40 cm. The average root length was 8.38 cm for the control and 8.02 cm for the salt treatment. In the second test, the average seedling length was 28.70 cm and 22.46 cm for the control and salt treatment, respectively. The average root length was 7.05 cm for the control and 6.32 cm for the salt treatment. The root length was apparently less damaged relative to the shoots in the two tests, reflecting that the shoot is more sensitive to salt stress than the root.
In the first test, the average shoot fresh weight was 229.62 mg and 62.10mg for the control and salt treatment, respectively. The average shoot dry weight was 33.58 mg for the control and 22.00 mg for the salt treatment, and the average root dry weight was 4.71 mg for the control and 3.36 mg for treatment (Table S1). In the second test, the average shoot fresh weight was 196.75 mg and 45.72 mg for the control and salt treatment, respectively. The average shoot dry weight was 26.97 mg for the control and 18.49 mg for the salt treatment, and the average root dry weight was 4.00 mg and 3.07 mg for the control and salt treatment, respectively (Table S1). Among the three investigated traits, fresh weight was the most vulnerable, implying that maintaining high content of water in rice tissues may play a central role in enhancing the resistance of rice against salt stress.
Further analysis showed that the salt-related trait of the BILs exhibited a normal or skewed distribution pattern (Figure 1). All the investigated characters showed a similar trend in the two experiments, although the salt injury score (SIS), water content of seedling under salt treatment (WCSST), relative water content of seedling (RWCS), relative root length (RRL), and relative shoot fresh weight (RSFW) in the first test were slightly higher than the second, while the relative shoot length (RSL), relative shoot dry weight (RSDW), and relative root dry weight (RRDW) were slightly lower, suggesting that the data are consistent in the two tests, which could be well used for further QTL analysis (Table 1).

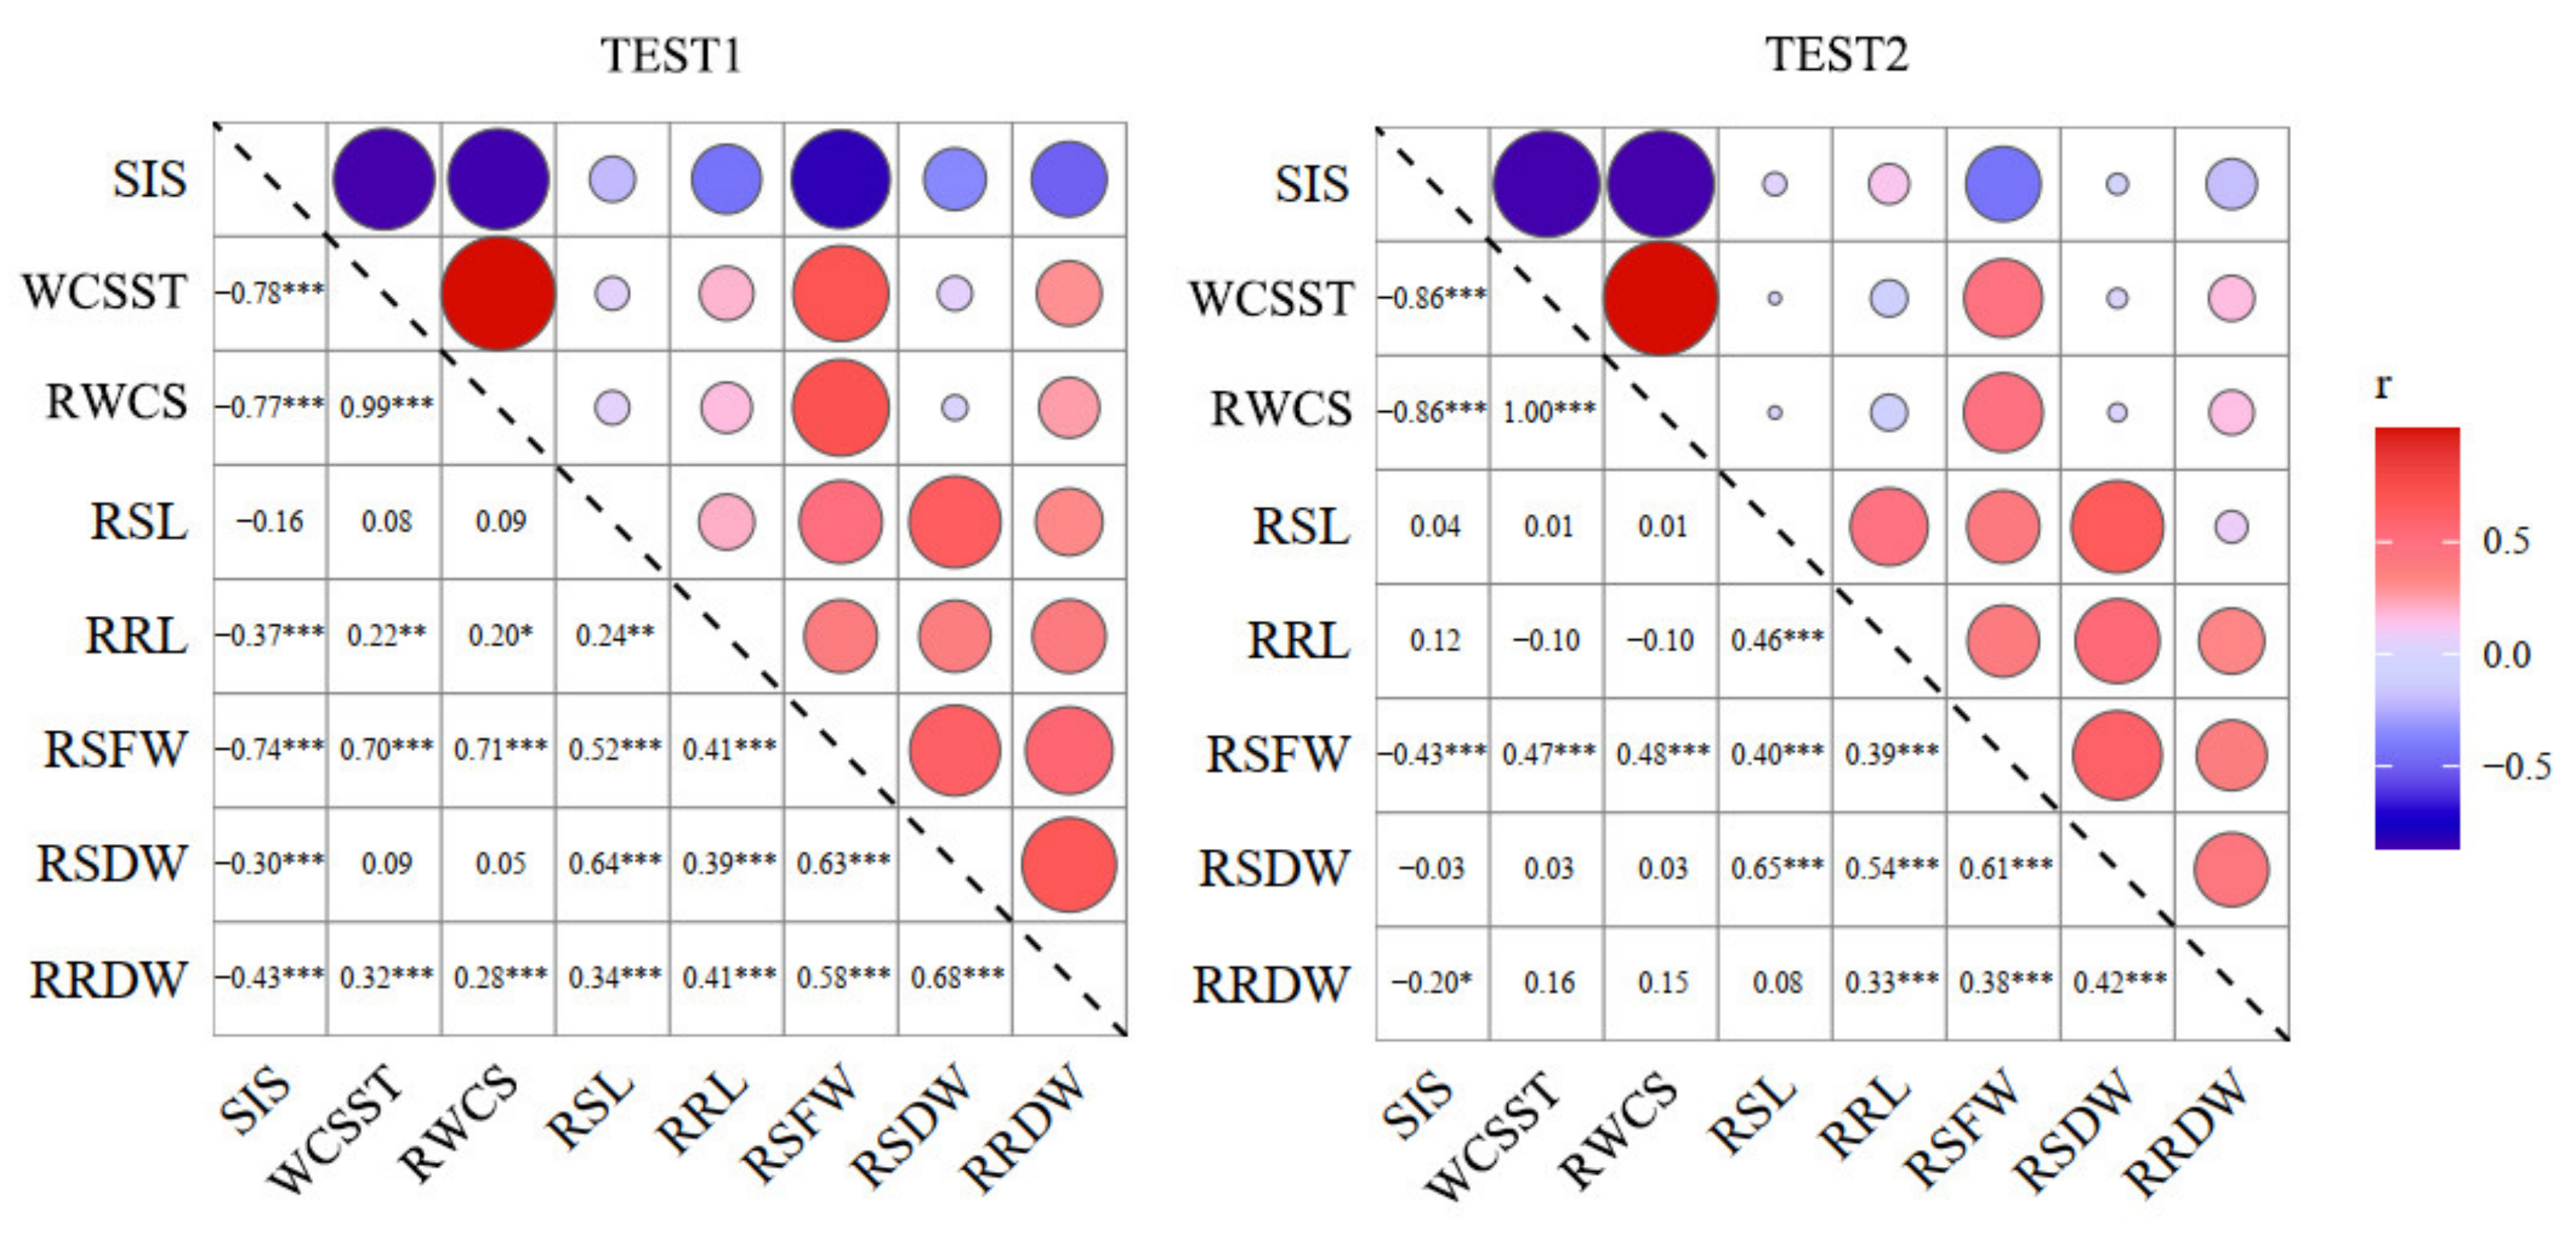
2.2. Correlation of the Salt-Tolerance-Related Traits

In order to further understand the potential relationship of the salt-tolerant traits, the correlation of eight traits of 140 BILs was analyzed. Results showed that most of the traits were significantly correlated; the RSFW showed a significant correlation with all the other traits in the two tests. SIS was negatively correlated with all other traits except for RSL and RRL, indicating that, as salt injury increases, shoot and root growth are stunted, which ultimately leads to seedling death (Figure 2). The correlation between SIS and WCSST was extremely significant in the two tests, with a maximum of −0.863, which translates to higher water content rate of plants with the least injury. Meanwhile, WCSST and RWCS were almost 100% correlated to each other (Figure 2), meaning that any of them can replace each other in scoring the salt tolerance of rice seedlings.

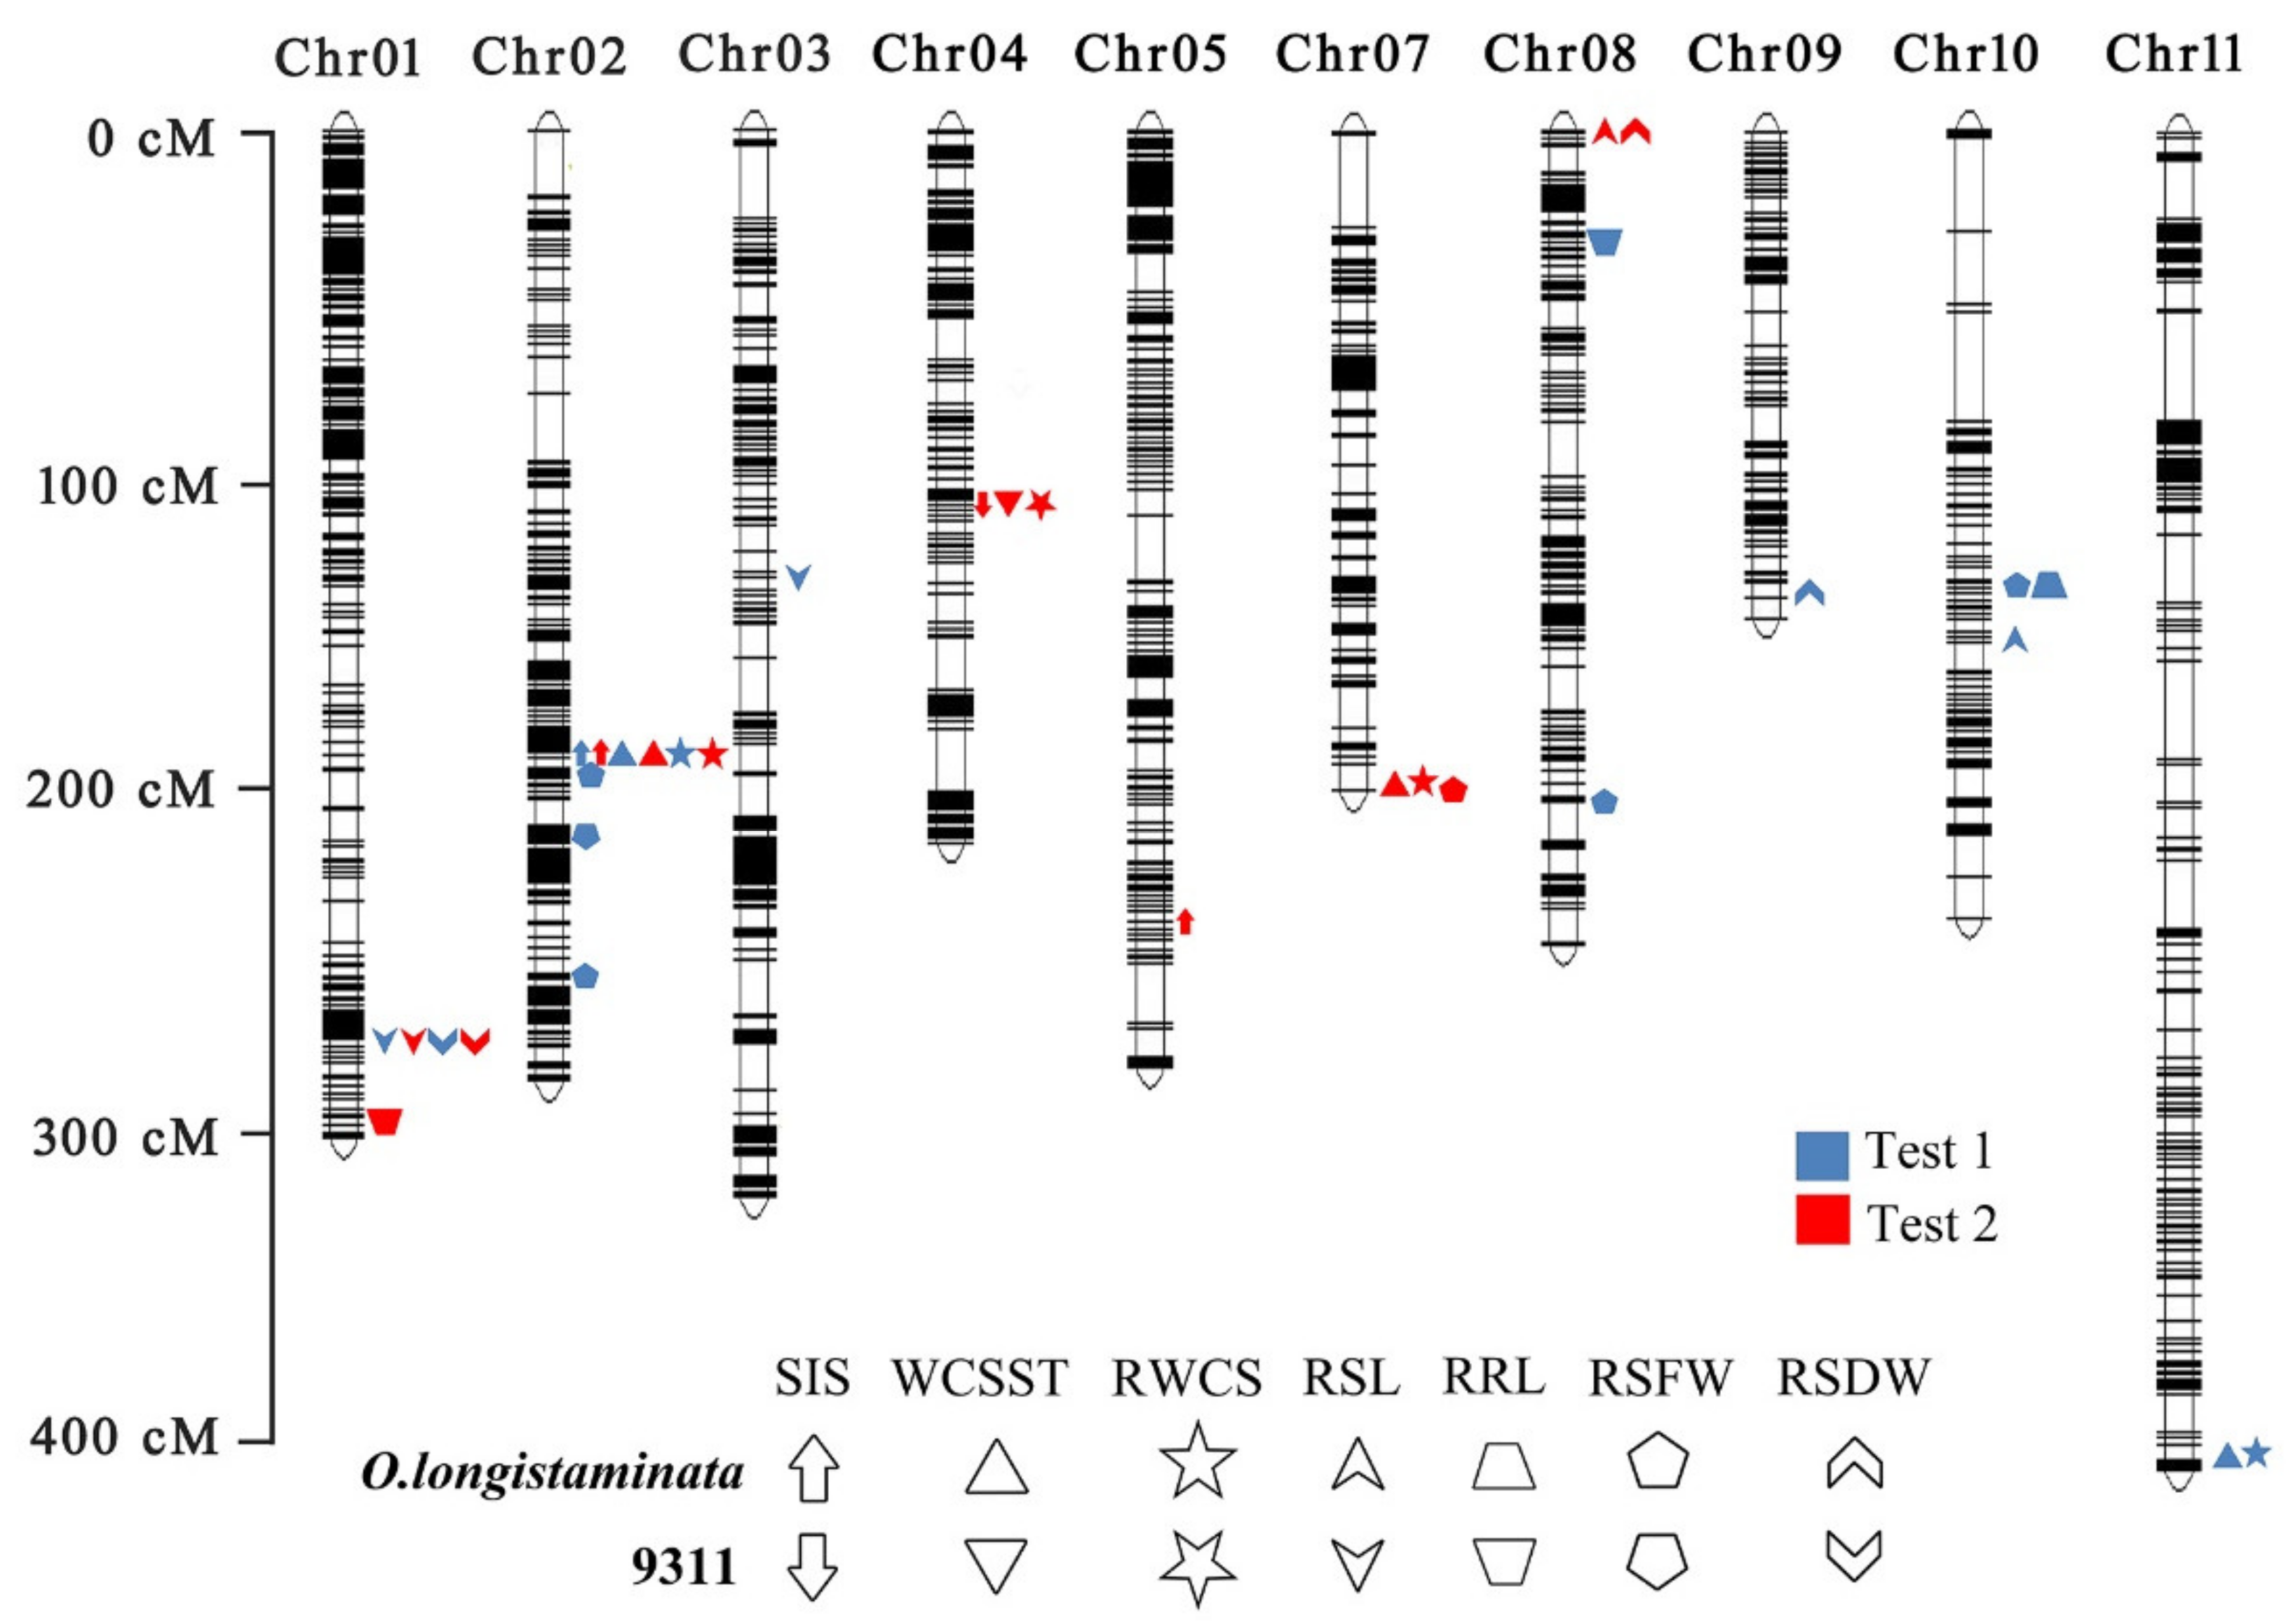
2.3. QTL Mapping of the Salt Tolerance of the O. longistaminata BIL Population

In total, 27 QTLs were identified for seven physiological and morphological traits from the O. longistaminata BIL population at the seedling stage, which were located on all chromosomes except chromosome 6 and 12 (Figure 3 and Table S2). Among them, 18 QTLs were derived from wild rice O. longistaminata; two QTLs for the salt injury score, named as qSIS2 and qSIS5, were mapped on chromosome 2 and 5 and explained 20.5% and 6.9% of the phenotypic variations, respectively (Table S2). Three QTLs for water content of seedling, qWCSST2, qWCSST7, and qWCSST11, which were mapped on chromosomes 2, 7, and 11, explained 20.4%, 5.0%, and 8.5% of the phenotypic variations, respectively. There were three QTLs for relative water content of seedling, named as qRWCS2, qRWCS7, and qRWCS11, that explained phenotypic variations of 22.3%, 4.9%, and 8.3%, respectively. Two QTLs, named as qRSL8 and qRSL10, were detected for relative shoot length and explained the phenotypic variations of 6.4% and 10.0%, respectively. Only one QTL was found for relative root length, qRRL10, which explained 8.3% of the phenotypic variations. There were five QTLs, qRSFW2.1, qRSFW2.3, qRSFW7, qRSFW8, and qRSFW10, detected for the relative shoot fresh weight, explaining 8.3%, 10.1%, 10.7%, 9.6%, and 13.6% of the phenotypic variations, respectively. Two QTLs, qRSDW8 and qRSDW9, responsible for relative shoot dry weight explained phenotypic variations of 7.8% and 6.9%, respectively. Of these, the qSIS2, qWCSST2, and qRWCS2 from O. longistaminata flanked by Bin 2-116 and Bin 2-117 on chromosome 2 were repeatedly identified in the two tests, the qRRL10 and qRSFW10 were found overlapped and flanked by Bin 10-10 and Bin 10-11, and both the qRSL8 and qRSDW8 were also mapped in one locus, indicating that these loci from O. longistaminata have pleiotropic effects, and show potentially important value in rice breeding practice.
Additionally, there were nine QTLs, including qRSL1, qRSDW1, qSIS4, qWCSST4, qRWCS4, qRSL3, qRSFW2.2, qRRL1, and qRRL8, for salt tolerance identified from 9311 (Figure 3 and Table S2), of which qSIS4, qWCSST4, and qRWCS4, explaining the phenotypic variations ranging from 6.9% to 11.2%, were overlapped on chromosome 4. The qRSL1 and qRSDW1 were detected in the two tests, suggesting that this locus may also have strong functions in salt tolerance.

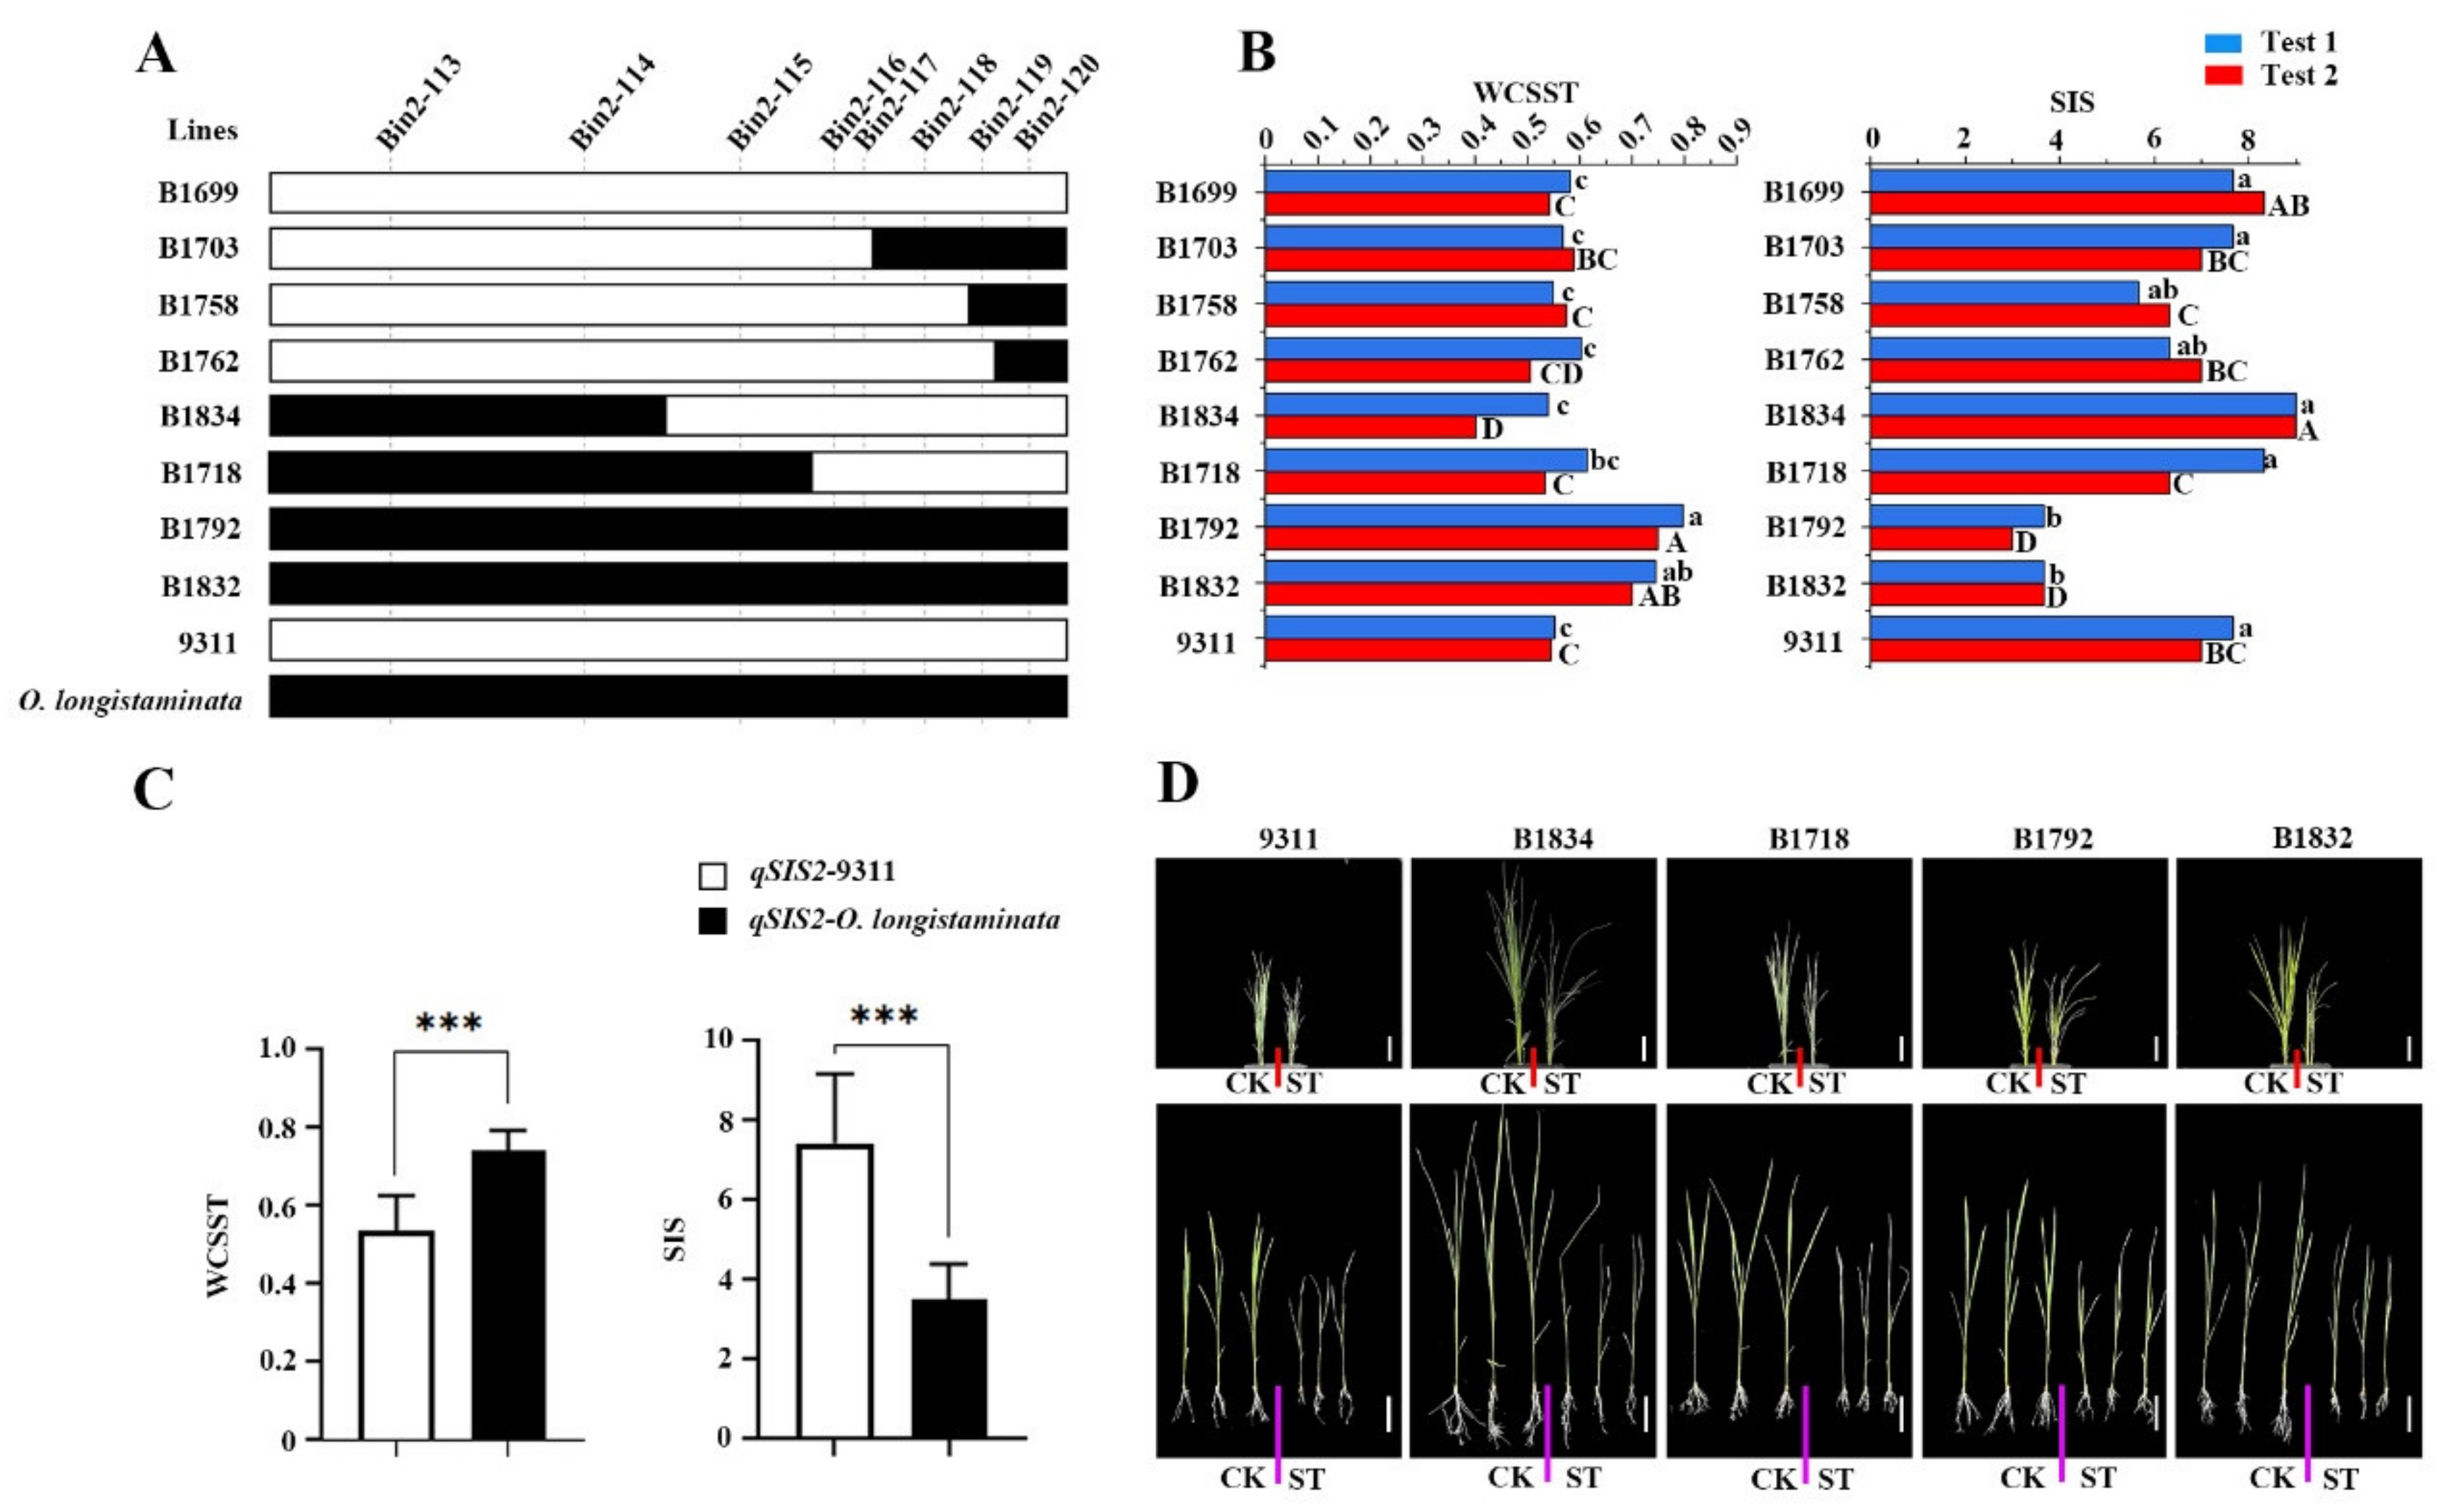
2.4. Confirmation of the QTLs for Salt Tolerance

To further verify the function of the novel QTLs for salt tolerance from O. longistamianta, we compared the genotypes and genetic effects between the representative BIL lines with and without qSIS2/qWCSST2/qRWCS2. Results showed that the Bin 2-116 and Bin 2-117 well determined the core interval of qSIS2/qWCSST2/qRWCS2 in the BIL lines (Figure 4A); the BIL line 1792 and 1832, which harbor qSIS2/qWCSST2/qRWCS2, showed significantly higher water content of shoot under stress treatment and less injury scores than the BIL lines, such as BIL1699, 1703, 1758, 1762, 1834, and 1718, without the corresponding QTLs (Figure 4B). Meanwhile, the average water content under treatment of the BIL 1792 and 1832 were about 21% higher than that of the lines 1699, 1703, 1758, 1762, 1834, and 1718, and the SIS of the lines 1792 and 1807 was also significantly lower than that of BIL1699, 1703, 1758, 1762, 1834, and 1718 (Figure 4C), indicating that the qSIS2/qWCSST2/qRWCS2 from O. longistaminata could significantly improve the salt tolerance of rice (Figure 4D).
Genomic structural analysis showed that qSIS2/qWCSST2/qRWCS2 delimited by Bin 2-116 and Bin 2-117 was about 89 Kb referenced to the MH63 genome (https://rice.hzau.edu.cn/rice_rs1/ (accessed on 17 September 2021)), and a total of 15 candidate genes, including 2 homologous genes, 3 hypothetical proteins, 1 expressed protein, and 10 annotated genes, were found within the region (Table 2). qRT-PCR analysis showed that the MH02t0466900 were highly induced in the tolerant BIL seedlings after 4 days of salt treatment (Figure 5), while no change or a slight decrease was observed in the parent 9311 and the BILs without the corresponding QTL (Figure S1). The MH02t0466900, which encodes a cytochrome P450 86B1, increased over at least 15 folds relative to the untreated controls in the BIL lines with qSIS2/qWCSST2/qRWCS2. The MH02t0466900 gene sequence does not contain introns, and its coding sequence is consistent with the genome sequence. Sequence analysis showed that the coding region of MH02t0466900 had great number of variations between 9311 and O. longistaminata (Figure S2), which lead to seven amino acid mutations and eight more amino acids in the posterior segment of the cytochrome P450 86B1 in 9311 (Figure S3), and further great difference of the protein structure between 9311 and O. longistaminata (Figure S4). These differences may result in the functional variation of MH02t0466900 between 9311 and O. longistaminata, and, hence, the increase in salt tolerance of BIL lines with qSIS2/qWCSST2/qRWCS2.

3. Discussion

At present, there are many indicators suggested to evaluate salt tolerance; the most direct method is to measure the content of Na+, K+, and Na+/K+ ratio. Other indicators commonly used include salt injury score, shoot length, root length, relative shoot length, relative root length, dry weight and relative dry weight, and biomass [19,20]. Here, we found that the water content is the most sensitive to the salt treatment than the others (Table 1); correlation analysis revealed that the water content not only showed the highest coefficient of variation with the salt injure score, but also showed a relatively stable and high correlation with the other five indicators (Figure 2), meaning that the water content in rice tissues is easily disturbed by the salt stress. Importantly, the qSIS2 for salt injury score and the qWCSST2 for water content were overlapped in our research (Figure 4), indicating that the water content can well reflect the injury status of rice under salt stress and could be used as a critical indicator for rice salt-tolerance evaluation [21].
In previous studies, a great number of QTLs associated with salt tolerance have been identified, and most of them are discovered in cultivated rice [22,23,24,25], although a few QTLs related to salt injury are found in wild rice. Tian et al. (2011) identified 13 QTLs for salt tolerance using a set of introgression lines derived from common wild rice O. rufipogon, which could improve salt tolerance in the background of cultivated rice Teqiing, and the qSTS2 for salt tolerance score explained 9% of the phenotypic variance that was mapped on chromosome 2 [26]. Similarly, another QTL for salt tolerance score, named as qSIS2, which explained 6.6% of the phenotypic variance, was also detected on chromosome 2 in wild rice by Amoah et al. [27]; both of the QTLs for salt tolerance were very close to the qSIS2.1 detected in our study (Figure 3, Table 2), implying that this locus may be a critical region for clustering of the important genes against salt stress in rice.
At present, many salt tolerance genes have been reported in plants, and also found in rice. Plant responses to salt stress are pleiotropic, occurring at the organismic, cellular, and molecular levels. These genes have the functions of ion homeostasis, osmotic regulation, scavenging of reactive oxygen species, and nutrient balance, and also regulate various traits of plants under salt stress [28]. With overexpressed rice Na+/H+ exchangers (OsNHX1) and H+-pyrophosphatase in tonoplasts (OsVP1) in a japonica elite rice cultivar, Zhonghua 11, the transgenic plants had stronger salt tolerance and higher survival rate. The seedling height, root length, and fresh weight of the transformed lines were also significantly increased, and the concentration of Na+ in leaves was lower than WT [29]. The OsDRAP1 gene, which encodes an ERF transcription factor, when overexpressed, improved salt tolerance and increased the survival rate of rice seedling under salt stress [30].
In this study, the qSIS2/qWCSST2/qRWCS2 was repeatedly detected in the BIL population, indicating that this locus has pleiotropic and stable genetic effects on rice salt tolerance. Expression analysis showed that MH02t0466900, which encodes a cytochrome P450 86B1, was highly induced by salt stress (Figure 5). Correspondingly, the amino acid and protein structure encoded by MH02t0466900 exhibit great variations between the wild rice and 9311 (Figure S3 and S4). Interestingly, the cytochrome P450 CYP86A1 encodes a fatty acid omega-hydroxylase involved in suberin monomer biosynthesis in Arabidopsis [31]. Suberin deposition affects root epidermal formation, regulates Na+ penetration, and affects plant salt tolerance by affecting ion homeostasis. The expression of OS03T0140200-01 (cytochrome P450 86B1-like) gene in rice was upregulated in salt stress [32]; recent reports have reported that heterologous expression of cytochrome P450 94B1 increased the salt tolerance and root suberin deposition in Arabidopsis and rice (Oryza sativa) seedlings [33]. These findings mean that MH02t0466900 from O. longistaminata is most possibly responsible for the increase in salt tolerance in rice; we will verify this result in future experiments using transgenic plants. Wild rice backcross inbred line has been suggested as a powerful tool for rice improvement; the QTLs found in wild rice O. longistaminata in our study can be directly transferred to cultivated rice by crossing the BIL lines, and it will greatly enrich the genetic basis if we employed them in rice breeding practice.

4. Materials and Methods

4.1. Plant Materials and Salt Treatments

A set of 140 BC2F20 BIL lines derived from O. longistaminata and acceptor parent 9311 were used in the experiment [16,17,18]. The seeds of the 9311 and BILs were placed in an oven at 50 °C for 5 days to break the possible dormancy, then germinated at room temperature for 48 h after surface sterilization with 2% sodium hypochlorite solution for 10 min and rinsing well with distilled water. The 96-well (12 × 8) PCR plates with removed well bottoms were used for sowing, and a total of 8 seeds were sown in one row of each line as a technical replicate. These plates were transferred into Yoshida’s nutrient solution [34] after floating on water for 3 days. The culture solution was refreshed every three days and the pH was maintained at 5.4. The seedlings were grown in a 12-h light/12-h dark photoperiod at 28 °C. Each line was planted with three technical replications according to completely randomized designs; the average of individual replicates was treated as the phenotypic value. The whole experiment was biologically replicated twice.

4.2. Phenotype Scores and Correlation Analysis

After sowing of 15 days, the seedlings were divided into two sets. One set of seedlings was transferred to cultural solution with 150 mM NaCl, and the other set of seedlings was kept in Yoshida’s solution as a control [34]. After 7 days of treatment, the backcross inbred lines were scored for visual salt injury score (SIS) based on a modified standard evaluation system at seedling stage [35]. The score is based on the following: score 1—normal growth, no leaf symptoms; score 3—nearly normal growth, only the tips of few leaves whitish and rolled; score 5—growth severely retarded, most leaves rolled, only a few are elongating; score 7—complete cessation of growth, most leaves dry, some plants dying; score 9—almost all plants dead or dying. The seedling length (SL), root length (RL), and shoot fresh weight (SFW) of each line of salt treatment and control group were subsequently measured. The shoots and roots were then rinsed with distilled water several times, packed in craft paper bags, respectively, and dried at 80 °C for 5 days. Then, the shoot dry weight (SDW) and root dry weight (RDW) of the control group and salt treatment were measured separately.
Water content of seedlings (WCS) was calculated according to the following formula: WCS (%) = (SFW − SDW)/SFW × 100. Relative water content of seedlings (RWCS), relative shoot length (RSL), relative root length (RRL), relative shoot fresh weight (RSFW), relative shoot dry weight (RSDW), and relative root dry weight (RRDW) were calculated according to the following formula: relative value (%) = (trait value under salt stress)/(trait value under control) × 100.
The statistical analyses were performed with SPSS Statistics 20 (IBM, Armonk, NY, U.S.A.). Correlation analysis was calculated using R-studio. The R Corrplot package was installed and loeaded to analyze the correlation coefficients between the two variables. Correlation among traits was computed at p < 0.05 and p < 0.01, respectively.

4.3. QTL Mapping

A total of 2432 bin markers were used to construct the genetic linkage map covering the whole-genome sequencing (unpublished data). The DNA extraction, single nucleotide polymorphism (SNP) calling, genotyping, bin map, and genetic linkage map construction were all performed following previous reports [16,17,18]. The QTL IciMapping v4.1 software (Chinese Academy of Agricultural Sciences, Beijing, China) was used to construct the linkage map and QTL analysis [36], and the limit of detection (LOD) threshold was set at 2.5.

4.4. Real-Time Quantitative PCR

The total RNA from the shoots of rice was extracted using the RNAprep Pure Plant Kit (Tiangen, Beijing, China). The cDNA for real-time PCR was reverse-transcribed from 2 μg of total RNA using the Hifair® II 1st Strand cDNA Synthesis Kit (gDNA digester plus) (Yeasen, Shanghai, China), and the real-time PCR was carried out using a Hieff® qPCR SYBR Green Master Mix (No Rox) (Yeasen, Shanghai, China) in Real-Time PCR machine (Bio-Rad, Hercules, CA, USA) according to the manufacturer’s instructions. The rice Ubi was selected as the internal control. Primers used for qRT-PCR analysis are listed in Table S3.

4.5. Gene Sequence Comparison and Protein Structure Prediction

Genomic DNA of 9311 and O. longistaminata was extracted by CTAB method. Primers were designed in 3′ UTR, 5′ UTR regions, and the middle of the gene sequences, and the gene sequences were divided into several segments for PCR amplification, which was about 1kb in length. Primers used for PCR amplification are listed in Table S4. After sequencing, the software DNAMAN was used to compare the assembled genome sequence between 9311 and O. longistaminata, and the amino acid sequence was predicted for comparison. Protein structure prediction is performed on the website (https://swissmodel.expasy.org/ (accessed on 24 January 2022)).

Supplementary Materials

The following supporting information can be downloaded at: https://www.mdpi.com/article/10.3390/ijms23042379/s1.

Author Contributions

S.L. designed the research; L.Y., L.Z., X.W., R.W., N.L., G.C. and S.H. performed the experiments and QTL analysis; L.Y., F.F., J.L. and S.L. analyzed data and wrote the manuscript. All authors have read and agreed to the published version of the manuscript.

Funding

This research was supported by the National Natural Science Foundation (U20A2023, 32101667) of China, the Creative Research Groups of the Natural Science Foundation of Hubei Province (2020CFA009), and the earmarked fund for China Agriculture Research System (CARS-01-08).

Institutional Review Board Statement

Not applicable.

Informed Consent Statement

Not applicable.

Data Availability Statement

The data presented in this study are available in the article.

Conflicts of Interest

The authors declare no conflict of interest.

Abbreviations

SISsalt injury score
WCSSTwater content of seedlings under salt treatment
RWCSrelative water content of seedling
RSLrelative shoot length
RRLrelative root length
RSFWrelative shoot fresh weight
RSDWrelative shoot dry weight
RRDWrelative root dry weight
SDstandard deviation
CVcoefficient of variation

References

  1. Hoang, T.M.L.; Tran, T.N.; Nguyen, T.K.T.; Williams, B.; Wurm, P.; Bellairs, S.; Mundree, S. Improvement of salinity stress tolerance in rice: Challenges and opportunities. Agronomy 2016, 6, 54. [Google Scholar] [CrossRef]
  2. Zhao, C.; Zhang, H.; Song, C.; Zhu, J.K.; Shabala, S. Mechanisms of plant responses and adaptation to soil salinity. Innovation 2020, 1, 100017. [Google Scholar] [CrossRef] [PubMed]
  3. Munns, R.; Tester, M. Mechanisms of salinity tolerance. Annu. Rev. Plant. Biol. 2008, 59, 651–681. [Google Scholar] [CrossRef] [PubMed] [Green Version]
  4. Yang, Z.; Wang, C.; Xue, Y.; Liu, X.; Chen, S.; Song, C.; Yang, Y.; Guo, Y. Calcium-activated 14-3-3 proteins as a molecular switch in salt stress tolerance. Nat. Commun. 2019, 10, 1199. [Google Scholar] [CrossRef] [Green Version]
  5. Xu, N.; Chu, Y.; Chen, H.; Li, X.; Wu, Q.; Jin, L.; Wang, G.; Huang, J.; Muday, G.K. Rice transcription factor OsMADS25 modulates root growth and confers salinity tolerance via the ABA–mediated regulatory pathway and ROS scavenging. PLoS Genet. 2018, 14, e1007662. [Google Scholar] [CrossRef] [Green Version]
  6. Singh, R.K.; Gregorio, G.B.; Jain, R.K. QTL mapping for salinity tolerance in rice. Physol. Mol. Biol. Pla. 2007, 13, 87–99. [Google Scholar]
  7. Walia, H.; Wilson, C.; Condamine, P.; Liu, X.; Ismail, A.M.; Zeng, L.; Wanamaker, S.I.; Mandal, J.; Xu, J.; Cui, X.; et al. Comparative transcriptional profiling of two contrasting rice genotypes under salinity stress during the vegetative growth stage. Plant Physiol. 2005, 139, 822–835. [Google Scholar] [CrossRef] [Green Version]
  8. Sun, J.; Zou, D.T.; Luan, F.S.; Zhao, H.W.; Wang, J.G.; Liu, H.L.; Xie, D.W.; Su, D.Q.; Ma, J.; Liu, Z.L. Dynamic QTL analysis of the Na+ content, K+ content, and Na+/K+ ratio in rice roots during the field growth under salt stress. Biol. Plant. 2014, 58, 689–696. [Google Scholar] [CrossRef]
  9. Lei, L.; Zheng, H.; Bi, Y.; Yang, L.; Liu, H.; Wang, J.; Sun, J.; Zhao, H.; Li, X.; Li, J.; et al. Identification of a major QTL and candidate gene analysis of salt tolerance at the bud burst stage in rice (Oryza sativa L.) using QTL-Seq and RNA-seq. Rice 2020, 13, 55. [Google Scholar] [CrossRef]
  10. Lin, H.X.; Zhu, M.Z.; Yano, M.; Gao, J.P.; Liang, Z.W.; Su, W.A.; Hu, X.H.; Ren, Z.H.; Chao, D.Y. QTLs for Na+ and K+ uptake of the shoots and roots controlling rice salt tolerance. Appl. Genet. 2004, 108, 253–260. [Google Scholar] [CrossRef]
  11. Tiwari, S.; Sl, K.; Kumar, V.; Singh, B.; Singh, N.K. Mapping QTLs for Salt Tolerance in Rice (Oryza sativa L.) by Bulked segregant analysis of recombinant inbred lines using 50K SNP Chip. PLoS ONE 2016, 11, e0153610. [Google Scholar] [CrossRef] [Green Version]
  12. Ren, Z.H.; Gao, J.P.; Li, L.G.; Cai, X.L.; Huang, W.; Chao, D.Y.; Zhu, M.Z.; Wang, Z.Y.; Luan, S.; Lin, H.X. A rice quantitative trait locus for salt tolerance encodes a sodium transporter. Nat. Genet. 2005, 37, 1141–1146. [Google Scholar] [CrossRef]
  13. Brar, D.S.; Khush, G.S. Alien introgression in rice. Plant Mol. Biol. 1997, 35, 35–47. [Google Scholar] [CrossRef]
  14. Ram, T.; Majumder, N.D.; Mishra, B.; Ansari, M.M.; Padmavathi, G. Introgression of broad-spectrum blast resistance gene(s) into cultivated rice (Oryza sativa ssp. indica) from wild rice O. rufipogon. Curr. Sci. India 2007, 92, 225–230. [Google Scholar]
  15. Khush, G.S. Origin, dispersal, cultivation and variation of rice. In Oryza: From Molecule to Plant; Sasaki, T., Moore, G., Eds.; Springer: Dordrecht, The Netherlands, 1997; pp. 25–34. [Google Scholar]
  16. Fan, F.; Long, W.; Liu, M.; Yuan, H.; Pan, G.; Li, N.; Li, S. Quantitative trait locus mapping of the combining ability for yield-related traits in wild rice Oryza longistaminata. J. Ag.r Food. Chem. 2019, 67, 8766–8772. [Google Scholar] [CrossRef]
  17. Jin, J.; Long, W.; Wang, L.; Liu, X.; Pan, G.; Xiang, W.; Li, N.; Li, S. QTL Mapping of seed vigor of backcross inbred lines derived from Oryza longistaminata under artificial aging. Front. Plant. Sci. 2018, 9, 1909. [Google Scholar] [CrossRef] [Green Version]
  18. Liu, X.; Fan, F.; Liu, M.; Long, W.; Yu, Y.; Yuan, H.; Pan, G.; Li, N.; Li, S.; Liu, J. Quantitative trait loci mapping of mineral element contents in brown rice using backcross inbred lines derived from Oryza longistaminata. Front. Plant. Sci. 2020, 11, 1229. [Google Scholar] [CrossRef]
  19. Chen, T.; Zhu, Y.; Chen, K.; Shen, C.; Zhou, M. Identification of new QTL for salt tolerance from rice variety Pokkali. J. Agron. Crop. Sci. 2019, 206, 202–213. [Google Scholar] [CrossRef]
  20. Javed, M.A.; Huyop, F.Z.; Wagiran, A.; Salleh, F.M. Identification of QTLs for morph-physiological traits related to salinity tolerance at seedling stage in Indica rice. Procedia Environ. Sci. 2011, 8, 389–395. [Google Scholar] [CrossRef] [Green Version]
  21. Nayyeripasand, L.; Garoosi, G.A.; Ahmadikhah, A. Genome-wide association study (GWAS) to identify salt-tolerance QTLs carrying novel candidate genes in rice during early vegetative stage. Rice 2021, 14, 9. [Google Scholar] [CrossRef]
  22. Thomson, M.J.; Ocampo, M.; Egdane, J.; Rahman, M.A.; Sajise, A.G.; Adorada, D.L.; Tumimbang-Raiz, E.; Blumwald, E.; Seraj, Z.I.; Singh, R.K. Characterizing the Saltol quantitative trait locus for salinity tolerance in rice. Rice 2010, 3, 148–160. [Google Scholar] [CrossRef] [Green Version]
  23. Prasad, S.R.; Bagali, P.G.; Hittalmani, S.; Shashidhar, H.E. Molecular mapping of quantitative trait loci associated with seedling tolerance to salt stress in rice (Oryza sativa L.). Curr. Sci. India 2000, 78, 162–164. [Google Scholar]
  24. Yuan, J.; Wang, X.; Zhao, Y.; Khan, N.U.; Zhao, Z.; Zhang, Y.; Wen, X.; Tang, F.; Wang, F.; Li, Z. Genetic basis and identification of candidate genes for salt tolerance in rice by GWAS. Sci. Rep. 2020, 10, 9958. [Google Scholar] [CrossRef] [PubMed]
  25. Cheng, L.; Wang, Y.; Meng, L.; Hu, X.; Cui, Y.; Sun, Y.; Zhu, L.; Ali, J.; Xu, J.; Li, Z. Identification of salt-tolerant QTLs with strong genetic background effect using two sets of reciprocal introgression lines in rice. Genome 2012, 55, 45–55. [Google Scholar] [CrossRef] [PubMed]
  26. Tian, L.; Tan, L.; Liu, F.; Cai, H.; Sun, C. Identification of quantitative trait loci associated with salt tolerance at seedling stage from Oryza rufipogon. J. Genet. Genom. 2011, 38, 593–601. [Google Scholar] [CrossRef] [PubMed]
  27. Amoah, N.K.A.; Akromah, R.; Kena, A.W.; Manneh, B.; Dieng, I.; Bimpong, I.K. Mapping QTLs for tolerance to salt stress at the early seedling stage in rice (Oryza sativa L.) using a newly identified donor “Madina Koyo”. Euphytica 2020, 216, 156. [Google Scholar] [CrossRef]
  28. Liu, C.; Mao, B.; Yuan, D.; Chu, C.; Duan, M. Salt tolerance in rice: Physiological responses and molecular mechanisms. Crop J. 2022, 10, 13–25. [Google Scholar] [CrossRef]
  29. Liu, S.; Zheng, L.; Xue, Y.; Zhang, Q.; Wang, L.; Shou, H. Overexpression of OsVP1 and OsNHX1 increases tolerance to drought and salinity in rice. J. Plant. Biol. 2010, 53, 444–452. [Google Scholar] [CrossRef]
  30. Wang, Y.; Huang, L.; Du, F.; Wang, J.; Zhao, X.; Li, Z.; Wang, W.; Xu, J.; Fu, B. Comparative transcriptome and metabolome profiling reveal molecular mechanisms underlying OsDRAP1-mediated salt tolerance in rice. Sci. Rep. 2021, 11, 5166. [Google Scholar] [CrossRef]
  31. Höfer, R.; Briesen, I.; Beck, M.; Pinot, F.; Schreiber, L.; Franke, R. The arabidopsis cytochrome P450 CYP86A1 encodes a fatty acid omega-hydroxylase involved in suberin monomer biosynthesis. J. Exp. Bot. 2008, 59, 2347–2360. [Google Scholar] [CrossRef] [Green Version]
  32. Nogueira do Amaral, M.; Arge, L.W.P.; Benitez, L.C.; Danielowski, R.; Ferreira da Silveira Silveira, S.; da Rosa Farias, D.; de Oliveira, A.C.; da Maia, L.C.; Braga, E.J.B. Comparative transcriptomics of rice plants under cold, iron, and salt stresses. Funct. Integr. Genom. 2016, 16, 567–579. [Google Scholar] [CrossRef]
  33. Krishnamurthy, P.; Vishal, B.; Ho, W.J.; Lok, F.C.J.; Lee, F.S.M.; Kumar, P.P. Regulation of a cytochrome P450 gene CYP94B1 by WRKY33 transcription factor controls apoplastic barrier formation in roots to confer salt tolerance. Plant Physiol. 2020, 184, 2199–2215. [Google Scholar] [CrossRef]
  34. Yoshida, S.; Forno, D.A.; Cock, J.H.; Gomez, K.A. Laboratory manual for physiological studies of rice. Int. Rice Res. Inst. 1971, 17, 62. [Google Scholar]
  35. Gregorio, G.; Senadhira, D.; Mendoza, R. Screening rice for salinity tolerance. Int. Rice Res. Inst. 1997, 22, 13. [Google Scholar]
  36. Meng, L.; Li, H.; Zhang, L.; Wang, J. QTL IciMapping: Integrated software for genetic linkage map construction and quantitative trait locus mapping in biparental populations. Crop J. 2015, 3, 269–283. [Google Scholar] [CrossRef] [Green Version]
Figure 1. Frequency distribution of eight traits related to salinity tolerance of the 140 BILs seedlings. (A), the X-axis represents the salt injury score; (BH), the X-axis represents the relative value of different traits, respectively. (AH), the Y-axis shows the number of BILs. Arrows indicate the phenotypes of 9311.
Ijms 23 02379 g001
Figure 2. Correlation analysis of salt-tolerant traits of BILs. Notes: SIS, salt injury score; WCSST, water content of seedling under salt treatment; RWCS, relative water content of seedling; RSL, relative shoot length; RRL, relative root length; RSFW, relative shoot fresh weight; RSDW, relative shoot dry weight; RRDW, relative root dry weight. *, ** and *** means significance at the 0.05, 0.01 and 0.001 level, respectively (2-tailed); r, correlation.
Ijms 23 02379 g002
Figure 3. QTLs identified in the O. longistaminata for salt tolerance. Left is the scale for the genetic length of each chromosome. The upward direction indicates the locus comes from O. longistaminata, while the downward direction indicates the locus comes from 9311. The blue indicates QTLs detected in the first experiment and the red indicates QTLs detected in the second experiment. cM, centi-Morgan.
Ijms 23 02379 g003
Figure 4. Validation of the function of qWCSST2/qSIS2/qRWCS2. (A) Genotype of the representative BIL lines. (B) Phenotypic value corresponding to BILs. (C) Average of the WCSST and SIS value of the representative BIL lines with and without qWCSST2/qSIS2/qRWCS2. The white rectangle shows the homozygous genotype from parent 9311, including BIL 1699, 1703, 1758, B1762, 1834, 1718. The black rectangle indicates the heterozygote genotype, and contains BIL 1792 and 1832. *** p < 0.001. (D) The phenotype of the representative BILs and the parent 9311, bar = 5 cm. The red and purple lines separate control and salt-treated seedlings, with the control seedlings on the left and the salt-treated seedlings on the right.
Ijms 23 02379 g004
Figure 5. qPCR analysis of the expression of candidate gene MH02t0466900 in seedlings under salt stress. The BIL lines of B1792 and B1832 contained qSIS2/qWCSST2/qRWCS2 locus, while the 1834 and 1718 did not contain the QTL.
Ijms 23 02379 g005
Table 1. The main performance of O. longistaminata BILs under salt treatment at seedling stage.
TestsItems9311BILs
Mean ± SDCV (%)Range
Test 1SIS7.006.83 ± 1.4521.243.00–9.00
WCSST (%)55.2262.09 ± 7.6312.2942.82–79.69
RWCS (%)64.4072.78 ± 8.9912.3549.95–94.60
RSL (%)79.1370.88 ± 7.6410.7853.25–89.91
RRL (%)120.7196.43 ± 12.512.9763.28–135.45
RSFW (%)25.3528.89 ± 9.7633.7912.14–56.19
RSDW (%)78.9070.06 ± 16.1523.0635.16–114.39
RRDW (%)81.7377.28 ± 25.1532.5426.85–177.20
Test 2SIS7.006.71 ± 1.6324.223.00–9.00
WCSST (%)54.5057.65 ± 6.5211.3040.23–77.33
RWCS (%)64.3966.98 ± 7.5111.2147.32–89.48
RSL (%)79.1578.63 ± 9.7612.4152.35–97.03
RRL (%)95.2991.24 ± 12.4613.6661.72–117.00
RSFW (%)27.2024.51 ± 6.9828.4612.30–44.70
RSDW (%)81.4371.00 ± 13.9519.6542.04–114.39
RRDW (%)88.3780.44 ± 18.7723.3335.76–139.68
Note: SIS, salt injury score; WCSST, water content of seedlings under salt treatment; RWCS, relative water content of seedling; RSL, relative shoot length; RRL, relative root length; RSFW, relative shoot fresh weight; RSDW, relative shoot dry weight; RRDW, relative root dry weight; SD, standard deviation; CV, coefficient of variation.
Table 2. The predicted functional genes at the loci of qSIS2/qWCSST2/qRWCS2.
LociGene NamesFunctional Annotation
qSIS2MH02t0465500NAC domain-containing protein 8
MH02t0465600,
MH02g0465700
Beta-1,4-mannosyl-glycoprotein, 4-beta-N-acetylglucosaminyltransferase
MH02t0465800hypothetical protein OsI_07895
MH02t0465900hypothetical protein OsI_07896
MH02t0466000unnamed protein product
MH02g0466100Isocitrate dehydrogenase (NAD) regulatory subunit 1, mitochondrial
MH02g0466200Hypothetical protein
MH02g0466300Elongation factor Tu, chloroplastic
MH02t0466400Putative eukaryotic translation initiation factor
MH02t0466500High-affinity nitrate transporter 3.1 Partner protein for high-affinity nitrate transport OsNAR2.1
MH02t0466600Rhodanese-like domain-containing protein 11, chloroplastic
MH02t0466700Nucleoporin GLE1
MH02t0466800Endoglucanase E1
MH02t0466900Cytochrome P450 86B1
Publisher’s Note: MDPI stays neutral with regard to jurisdictional claims in published maps and institutional affiliations.

