Article

A Novel Role of Arrhythmia-Related Gene KCNQ1 Revealed by Multi-Omic Analysis: Theragnostic Value and Potential Mechanisms in Lung Adenocarcinoma

1
Department of Emergency Medicine, Show Chwan Memorial Hospital, Changhua 500, Taiwan
2
Research Assistant Center, Show Chwan Memorial Hospital, Changhua 500, Taiwan
3
Department of Biology, National Changhua University of Education, Changhua 500, Taiwan
4
Shueiduei Elementary School, Gukeng Township, Yulin 646, Taiwan
5
Department of Surgery, Show Chwan Memorial Hospital, Changhua 500, Taiwan
6
Graduate Institute of Biomedical Engineering, National Chung Hsing University, Taichung 402, Taiwan
*
Authors to whom correspondence should be addressed.
Int. J. Mol. Sci. 2022, 23(4), 2279; https://doi.org/10.3390/ijms23042279
Submission received: 28 January 2022 / Revised: 8 February 2022 / Accepted: 17 February 2022 / Published: 18 February 2022
(This article belongs to the Special Issue Integrative Omics Approaches to Decipher Cancer Signaling)

Abstract

:
The early diagnosis, prognostic prediction, and personalized therapy of lung adenocarcinoma (LUAD) remains a challenging issue. KCNQ1 (potassium voltage-gated channel subfamily Q Member 1) is implicated in long QT syndrome (LQTS) and cardiac arrhythmia, while its significance in LUAD remains unclear. In this study, we aimed to explore the significance of KCNQ1 in terms of clinical value, tumor immunity, underlying mechanisms, and a precision medicine approach by means of multi-omics analysis. The association of KCNQ1 with LUAD was first explored. Both altered variants and high expression of KCNQ1 in a TCGA-LUAD cohort indicated a favorable outcome. KCNQ1 levels had a negative correlation with tumor proliferation index Ki67 levels. siRNA-knockdown of KCNQ1 promoted the migration ability of lung cancer cells. KCNQ1 levels were decreased in LUAD tissue compared to normal tissue. A receiver operating characteristic (ROC) curve indicated good diagnostic efficiency of KCNQ1. High KCNQ1 is associated with an immunoactive profile of immune infiltration and immunomodulators and is involved in the inhibition of the cell cycle and DNA replication. Lapatinib was identified as a potent drug for LUAD in the context of low KCNQ1. This study unveiled the significance of KCNQ1 in diagnosis and prognosis and provided a corresponding precision medicine strategy for LUAD.

1. Introduction

Lung cancer is the second most diagnosed cancer and the leading cause of global cancer-related deaths [1]. Non-small cell lung carcinoma (NSCLC) and small-cell lung carcinoma (SCLC) are the two main groups of lung cancer. NSCLC is the most common subtype, 40% of which accounts for lung adenocarcinoma (LUAD), 25% for squamous cell carcinoma (SCC), 15% for large cell carcinoma (LCC), and the remaining 20% for unspecified cancers [2]. When diagnosed, most patients are in the advanced stages [3]. Metastasis accounts for the primary cause of death. The identification of targetable alterations to, e.g., EGFR (epidermal growth factor receptor), ALK (anaplastic lymphoma kinase), PI3KCA/AKT1/mTOR (phosphatidylinositol-4,5-bisphosphate 3-kinase catalytic subunit alpha/AKT serine/threonine kinase 1/ mechanistic target of rapamycin kinase), RAS-MAPK (mitogen-activated protein kinases), RET (ret proto-oncogene), MET (MET proto-oncogene), BRAF (B-Raf proto-oncogene), and NTRK/ROS1 (Neurotrophic Receptor Tyrosine Kinase/ROS Proto-Oncogene 1), along with immunotherapy, has evolved the treatment paradigm in patients with advanced disease [4,5,6]. Despite these new therapeutic options, there continue to be significant challenges, as resistance development and disease progression occurs in most of these patients [7].
The KCNQ1 (potassium voltage-gated channel subfamily Q Member 1) gene is located on chromosome 11 and consists of 17 exons of different lengths. KCNQ1 encodes for the pore-forming alpha subunit of a voltage-gated potassium channel that enables a K+ current after electrical depolarization of the cell membrane. KCNQ1 is predominantly expressed in the cells of the lungs, heart, inner ear, stomach, intestine and pancreas, in which KCNQ1 expression is critical for ion homeostasis [8,9]. In human lung cancer cells, KCNQ1 acts to regulate basal cAMP-stimulated Cl secretion through the cystic fibrosis transmembrane conductance regulator (CFTR) [8,10,11,12]. In addition, mutations in cardiac KCNQ1 channels account for the most common congenital defects that cause long QT syndrome (LQTS) [13,14,15], which is a heart disorder resulting in cardiac arrhythmias and about 3000 sudden deaths [16,17].
An increasing volume of studies have documented the involvement of KCNQ1 in human cancers, including colorectal cancer, hepatocellular carcinoma, esophageal cancer, and renal cell carcinoma [18,19,20]. However, the clinical significance and biological role of KCNQ1 in LUAD remains unclear. The aim of this study was to explore the theragnostic significance of KCNQ1 by multi-omic analysis. Firstly, we analyzed the association between KCNQ1 and cancers and confirmed its tumor suppression role in LUAD. Secondly, we investigated the diagnostic and prognostic vale of KCNQ1. Thirdly, its potential role in tumor immunity and underlying molecular basis were examined. Finally, we employed the genomics of a Drug Sensitivity in Cancer (GDSC)-based analysis to identify lapatinib as a potential candidate for the treatment of LUAD in the context of low KCNQ1 expression.

2. Results

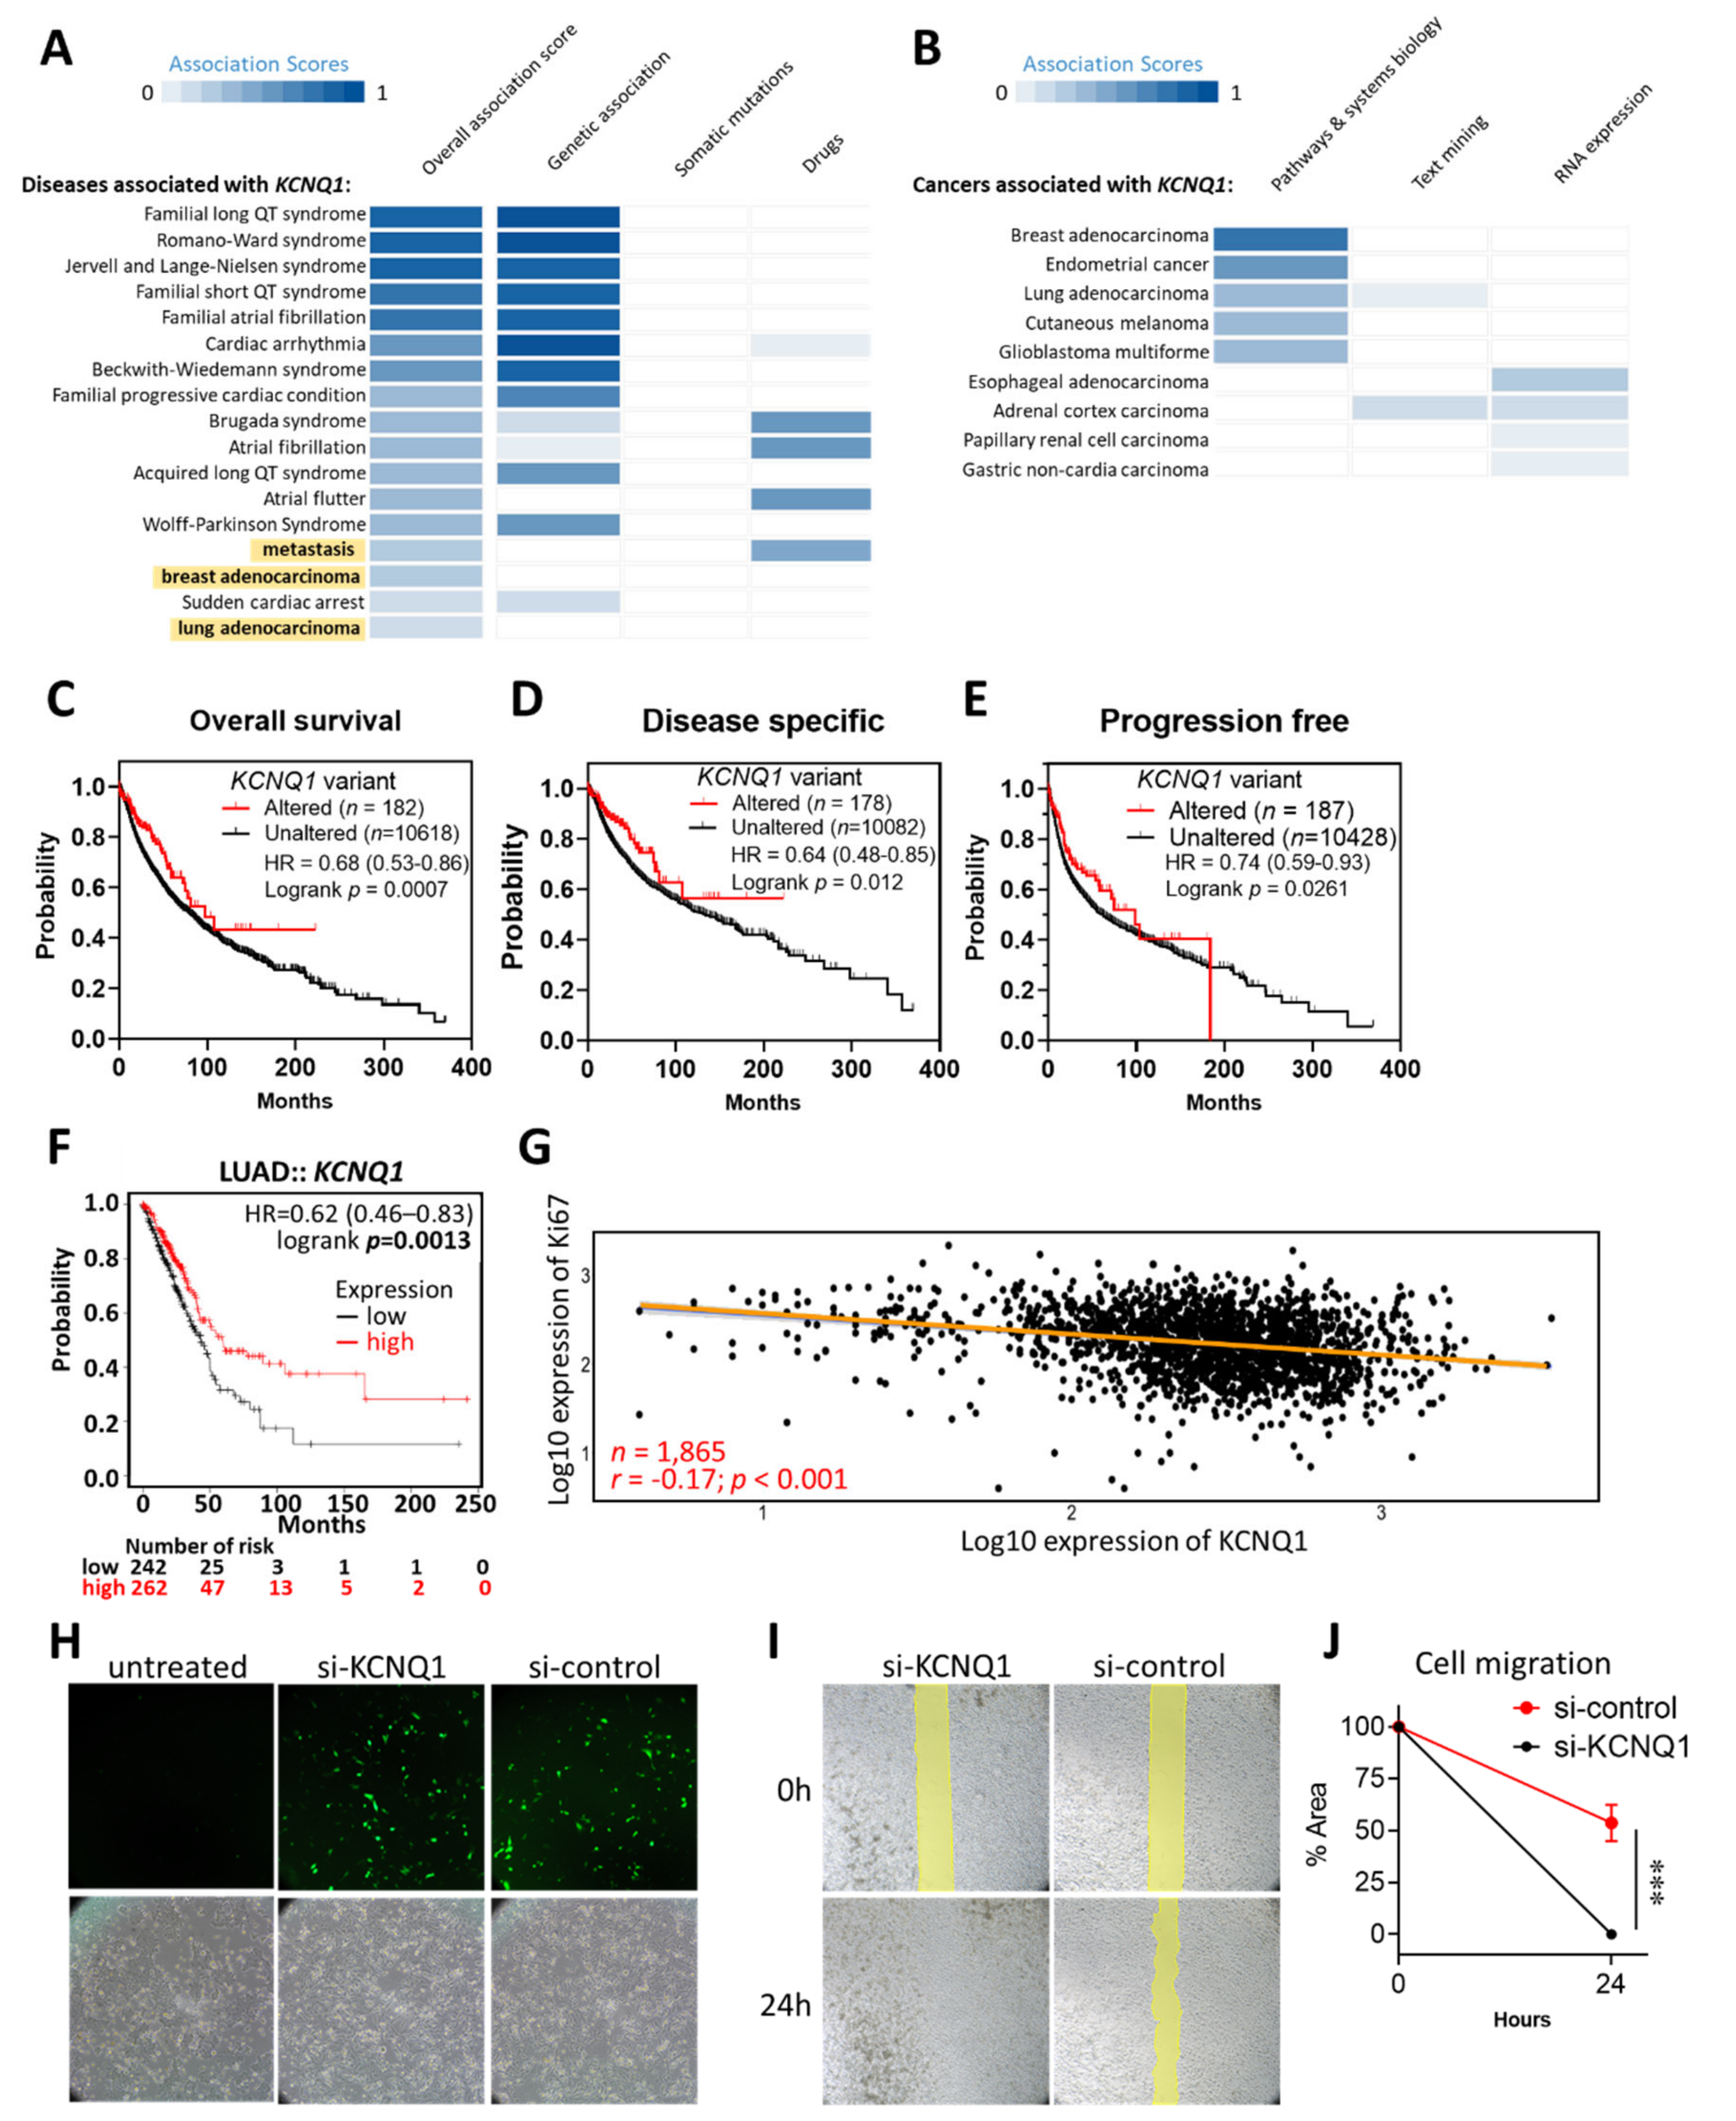
2.1. KCNQ1 as an Independent Risk Factor and a Tumor Suppressor in LUAD

We firstly illustrated the functional involvement of KCNQ1 in human diseases using the Open Target Platform, which integrates evidence from genetics, genomics, transcriptomics, drugs, animal models, and scientific literature relevant to the association between targets and diseases [21,22]. We noted that KCNQ1 was implicated in disease items “metastasis”, “breast adenocarcinoma”, and “lung adenocarcinoma”, aside from its previously recognized role in LQTS (Figure 1A). In light of this, we further examined the associations between KCNQ1 and tumors and revealed some cancer types, including breast adenocarcinoma, endometrial cancer, lung adenocarcinoma, cutaneous melanoma, and glioblastoma multiforme (Figure 1B). As KCNQ1 variants have been shown to have an association with pancreatic cancer risk [23], we then examined its impact on the progression of LUAD by accessing the cBioPortal web server. As shown in Figure 1C–E, cancer patients with altered KCNQ1 variants showed significant longer overall survival, disease specific survival, and progression free survival. Notably, we found that high expression of KCNQ1 indicated longer overall survival time in LUAD (Figure 1F). We then asked whether KCNQ1 is associated with tumor proliferation by analyzing Pearson correlation coefficients of KCNQ1 with Ki67. As shown in Figure 1G, KCNQ1 was positively correlated with Ki67 in 1865 LUAD samples (r = −0.17, p < 0.0001) (Figure 1G). We further used a siRNA-based approach to confirm the role of KCNQ1 in an A549 human lung adenocarcinoma epithelial cell line. The transfection efficiency of FAM-labeled siRNAs was visualized under a fluorescence microscope (Figure 1H). Then, the wound healing assay showed that cells treated with si-KCNQ1 had superior migration abilities compared to cells with si-control (Figure 1I,J), thereby verifying the anti-tumor effect of KCNQ1.

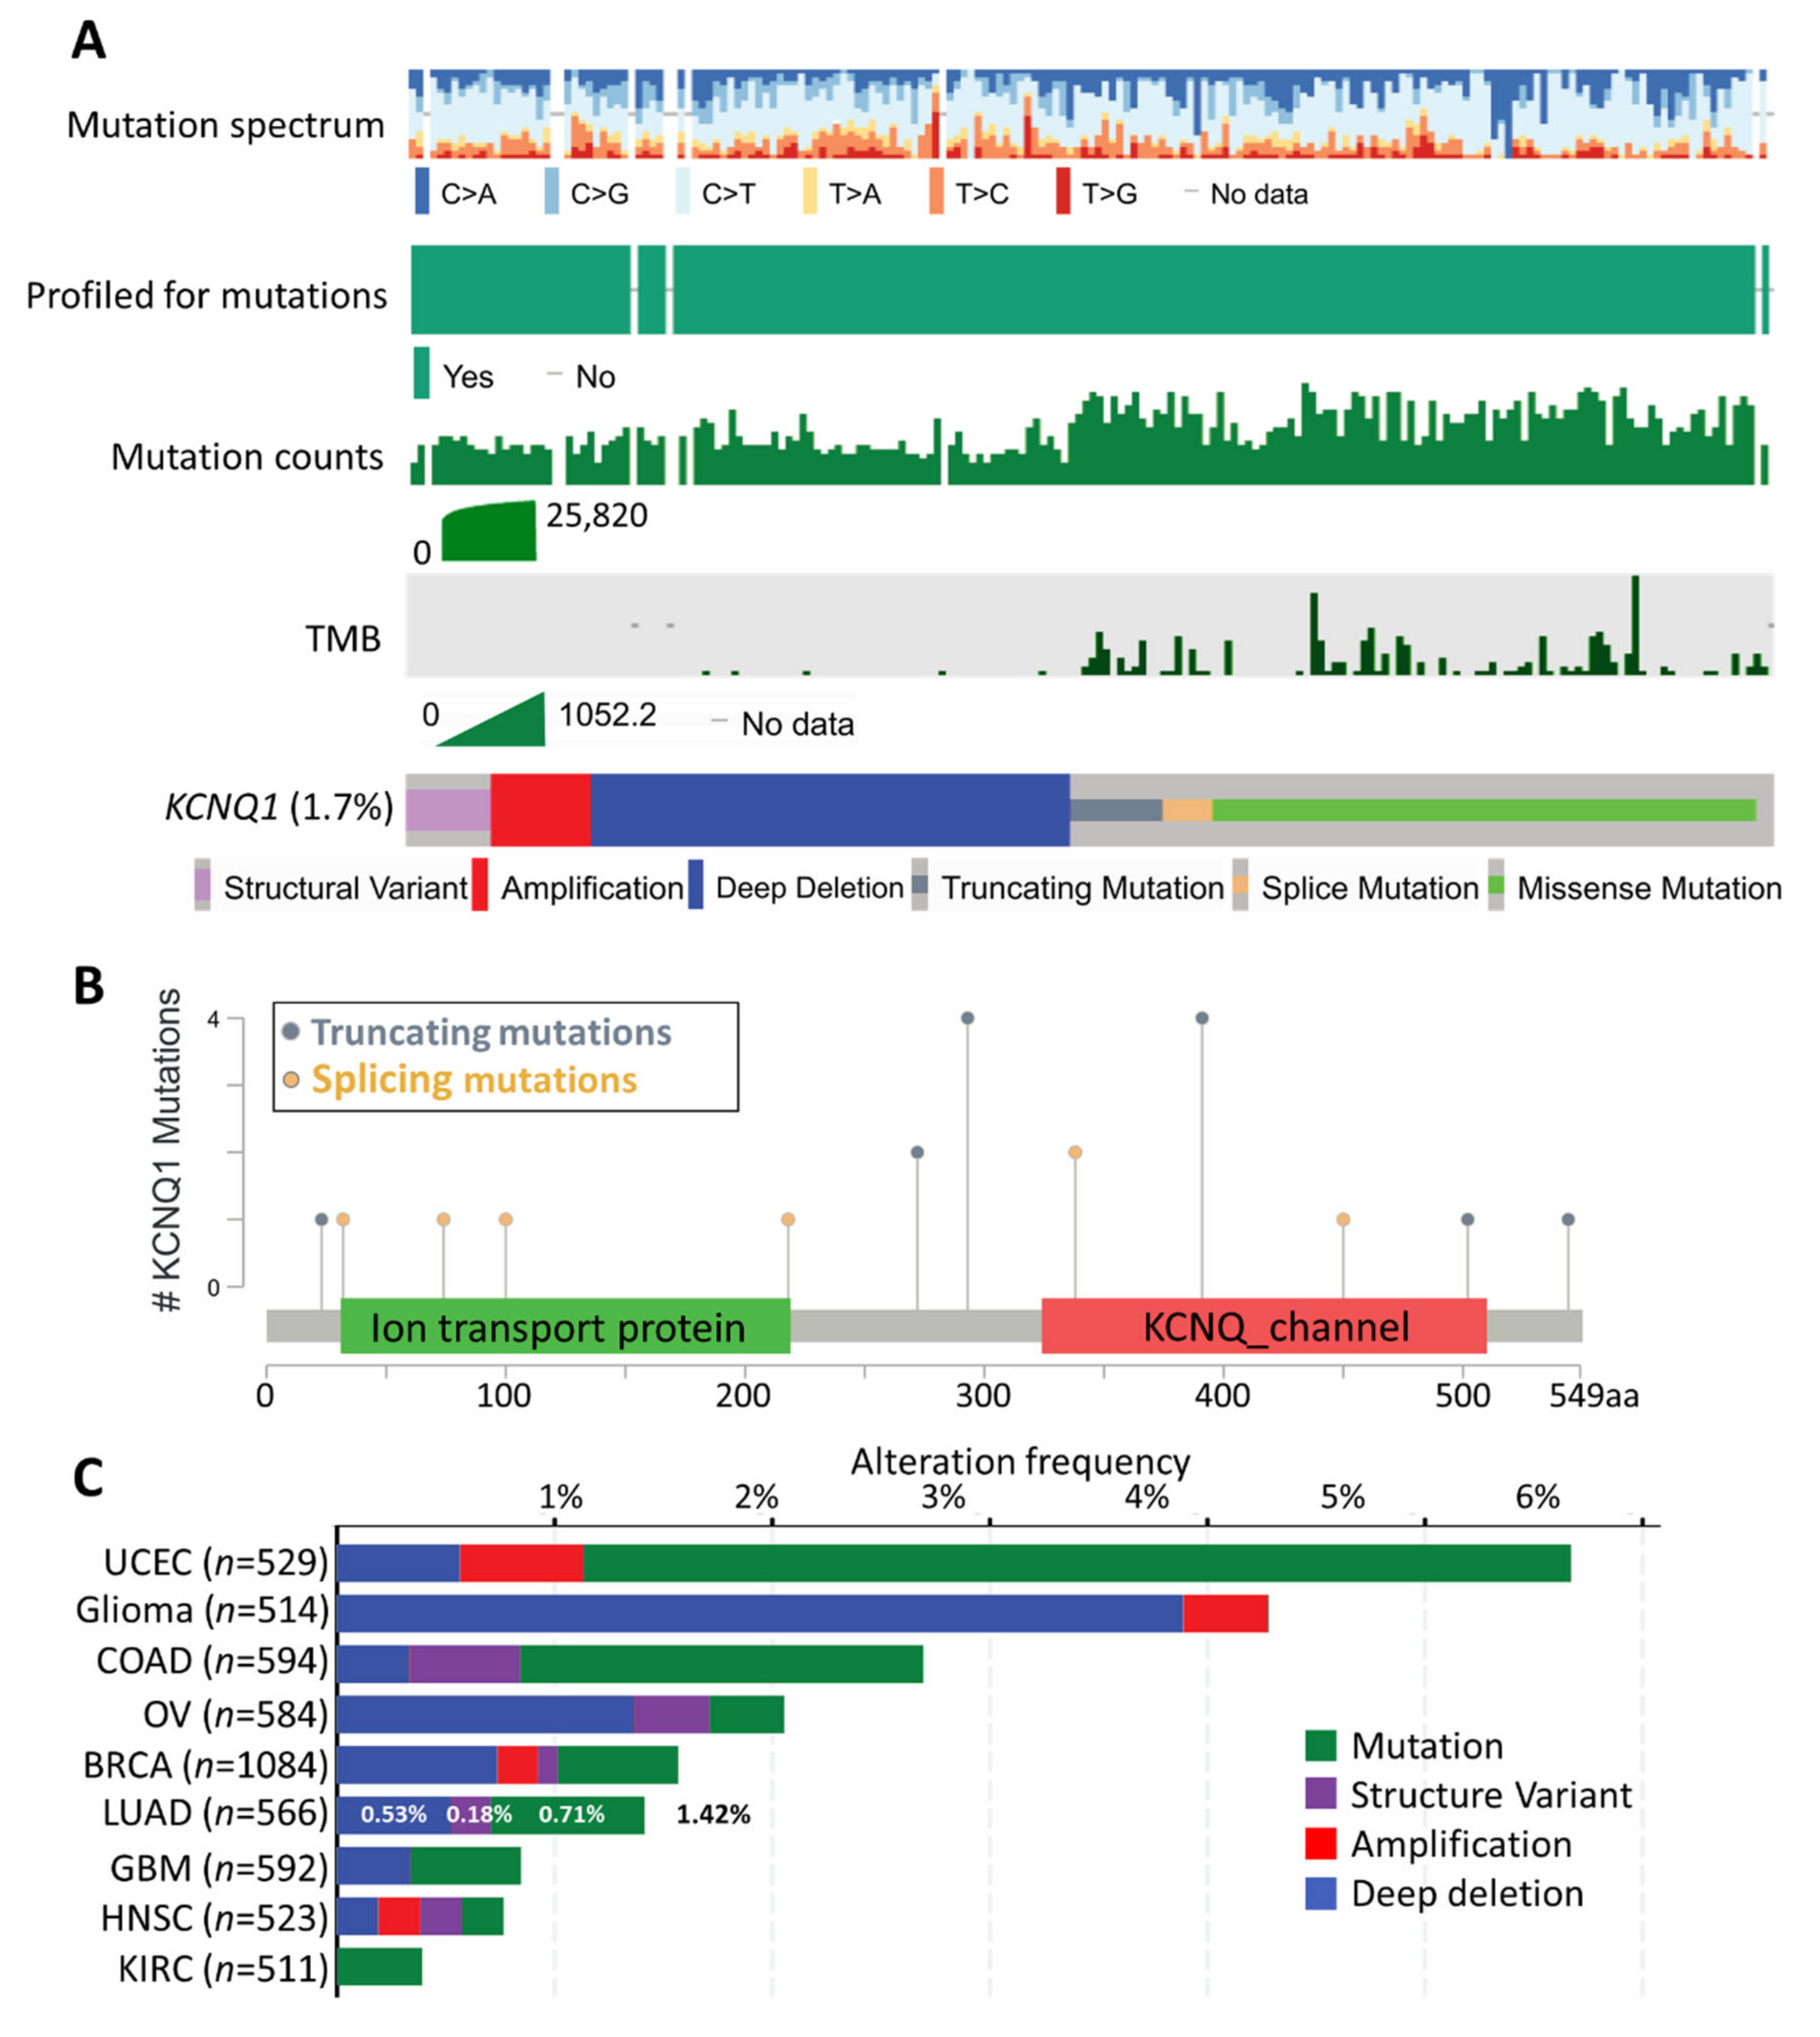
2.2. Mutation Landscape of KCNQ1

The mutational landscape of KCNQ1 in 10,395 patients was accessed by cBioPortal analysis. As shown in Figure 2A, the mutation spectra/count of KCNQ1 was not in synchronicity with the corresponding tumor mutational burden (TMB). The genetic alteration frequency of KCNQ1 was 1.7%, composed of structural variants, amplification, deep deletion, truncated mutation, splicing mutation, and missense mutation. Interestingly, we observed that the occurrence of TMB was primarily accompanied by the truncated mutation, splicing mutation, and missense mutation of KCNQ1 (Figure 2A). The number and the distribution of truncating mutations and splicing mutations across the 549 amino acid KCNQ1 is illustrated in Figure 2B. The KCNQ1 alteration frequency in 566 LUAD cases was 1.42% (8 cases), which consists of 0.53% (3 cases) deep deletions, 0.18% (1 case) structural variants, and 0.71% (4 cases) mutations (Figure 2C).

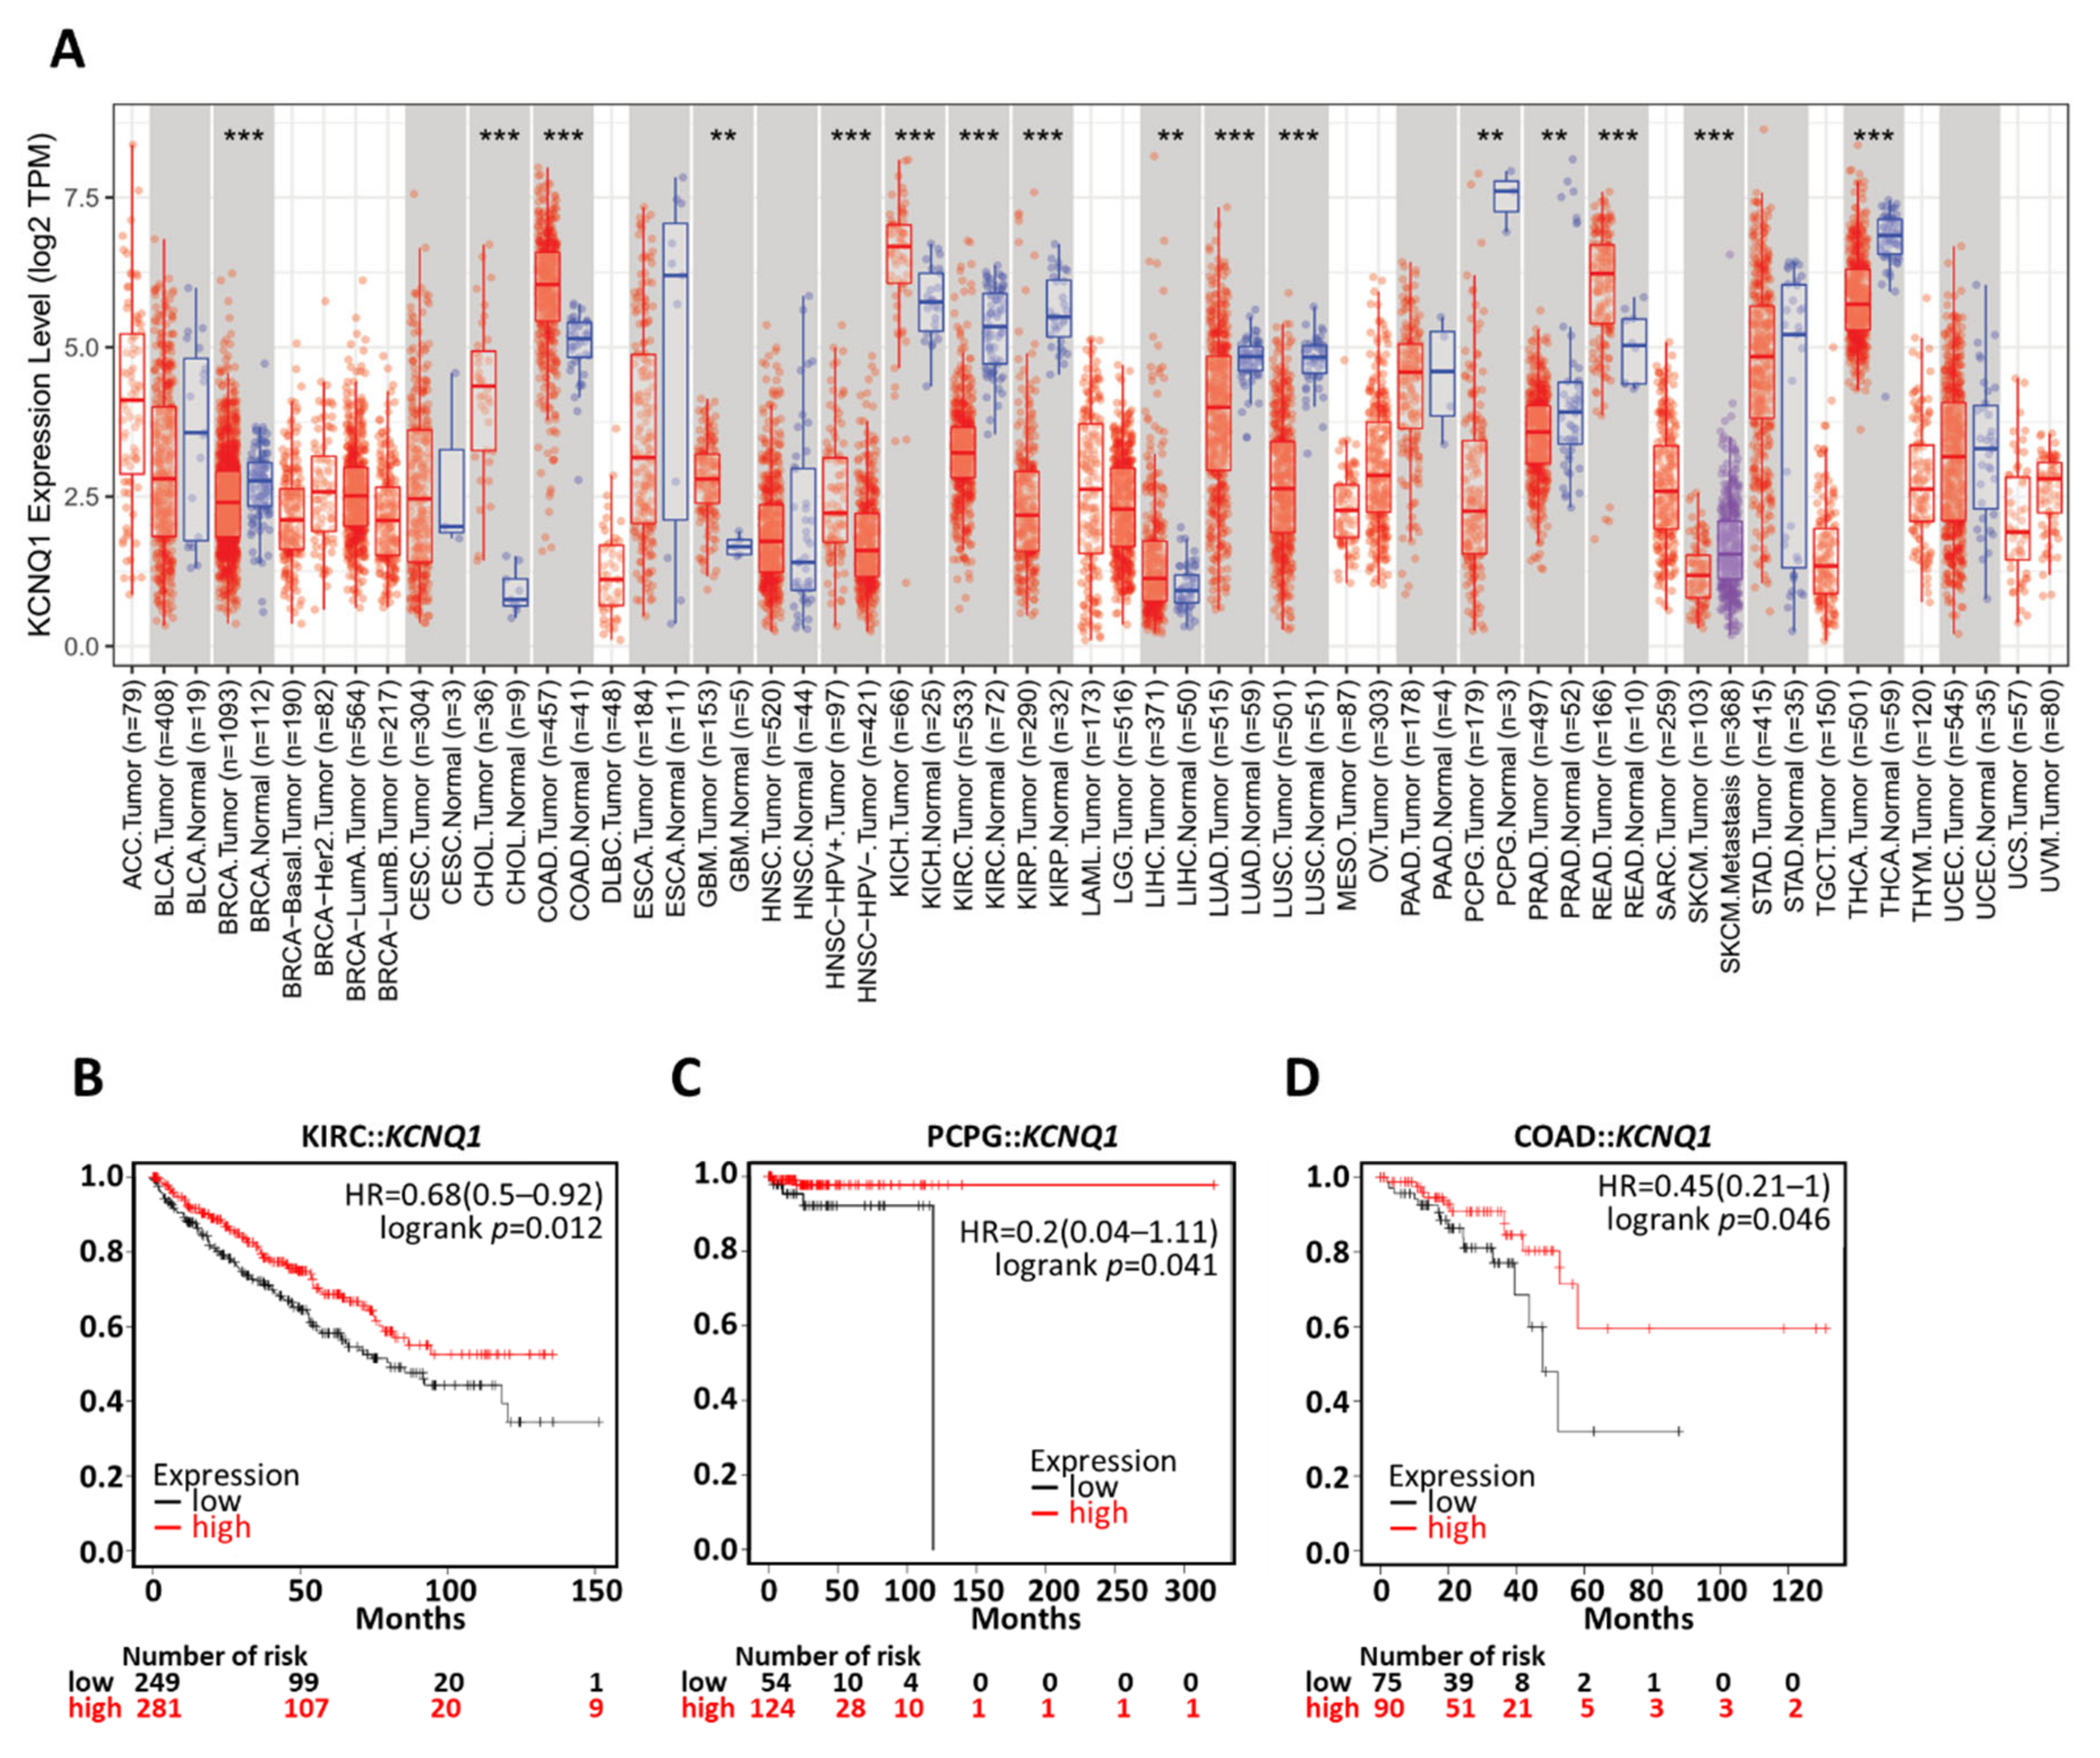
2.3. Differential Expression Profile and Diagnostic Efficacy of KCNQ1

The gene chip-based Gene Expression Omnibus (GEO) datasets revealed that LUAD tumors had lower KCNQ1 expression levels than normal tissues (Figure 3A). The RNA seq-based The Cancer Genome Atlas (TCGA) datasets showed a similar pattern (Figure 3B). In addition, immunohistochemistry (IHC) staining confirmed that LUAD tumors presented lower KCNQ1 protein expression levels than normal (Figure 3C). We further verified the aforementioned observation by means of GSE11502 datasets. Similarly, KCNQ1 expression levels were decreased in LUAD tumors compared to normal tissue (Figure 3D). To determine the diagnostic efficiency for LUAD, we constructed a receiver operating characteristic (ROC) curve and noted that KCNQ1 expression levels presented good diagnostic accuracy for the discrimination of disease, with an area under the curve (AUC) of 0.79 (95% CI: 0.69–0.89, p < 0.0001) (Figure 3E).

2.4. Prognostic Value of KCNQ1

To gain more prognostic insight, the correlation between KCNQ1 expression and corresponding clinical follow-up information was analyzed by means of Kaplan–Meier curves and the log-rank test. High KCNQ1 expression was found to be significantly associated with increased overall survival time in LUAD patients with stage 1 cancer, but not stages 2, 3, and 4 (Figure 4A–D). In addition, this tendency was observed in patients with AJCC stage T1 and N0, but not in AJCC stage T2 and N1 (Figure 4E–H). This indicates KCNQ1′s prognostic value preferentially in the early stage of LUAD.
We further scrutinized the prognostic significance of KCNQ1 expression levels in various immune cell contents. As shown in the forest plot in Figure 4I, high KCNQ1 expression did not statistically indicate longer overall survival time compared to low KCNQ1 expression when LUAD tumors harbored enriched type 1 helper T cells (Th1) (p = 0.056), decreased type 2 helper T cells (Th2) (p = 0.11), decreased mesenchymal stem cells (MSC) (p = 0.12), decreased macrophages (p = 0.093), and enriched natural killer T cells (NKT). Moreover, we noted that KCNQ1 expression exhibited no prognostic significance in tumors with high TMB. Interestingly, high KCNQ1 expression turned out to indicate shorter overall survival time when LUAD simultaneously harbored high TMB and decreased MSC (Figure 4J,K). Together, high KCNQ1 expression levels feature prognostic value by predicting a favorable outcome in LUAD patients, while the contents of Th1, Th2, MSC, macrophages, NKT, and TMB can counteract the significance.

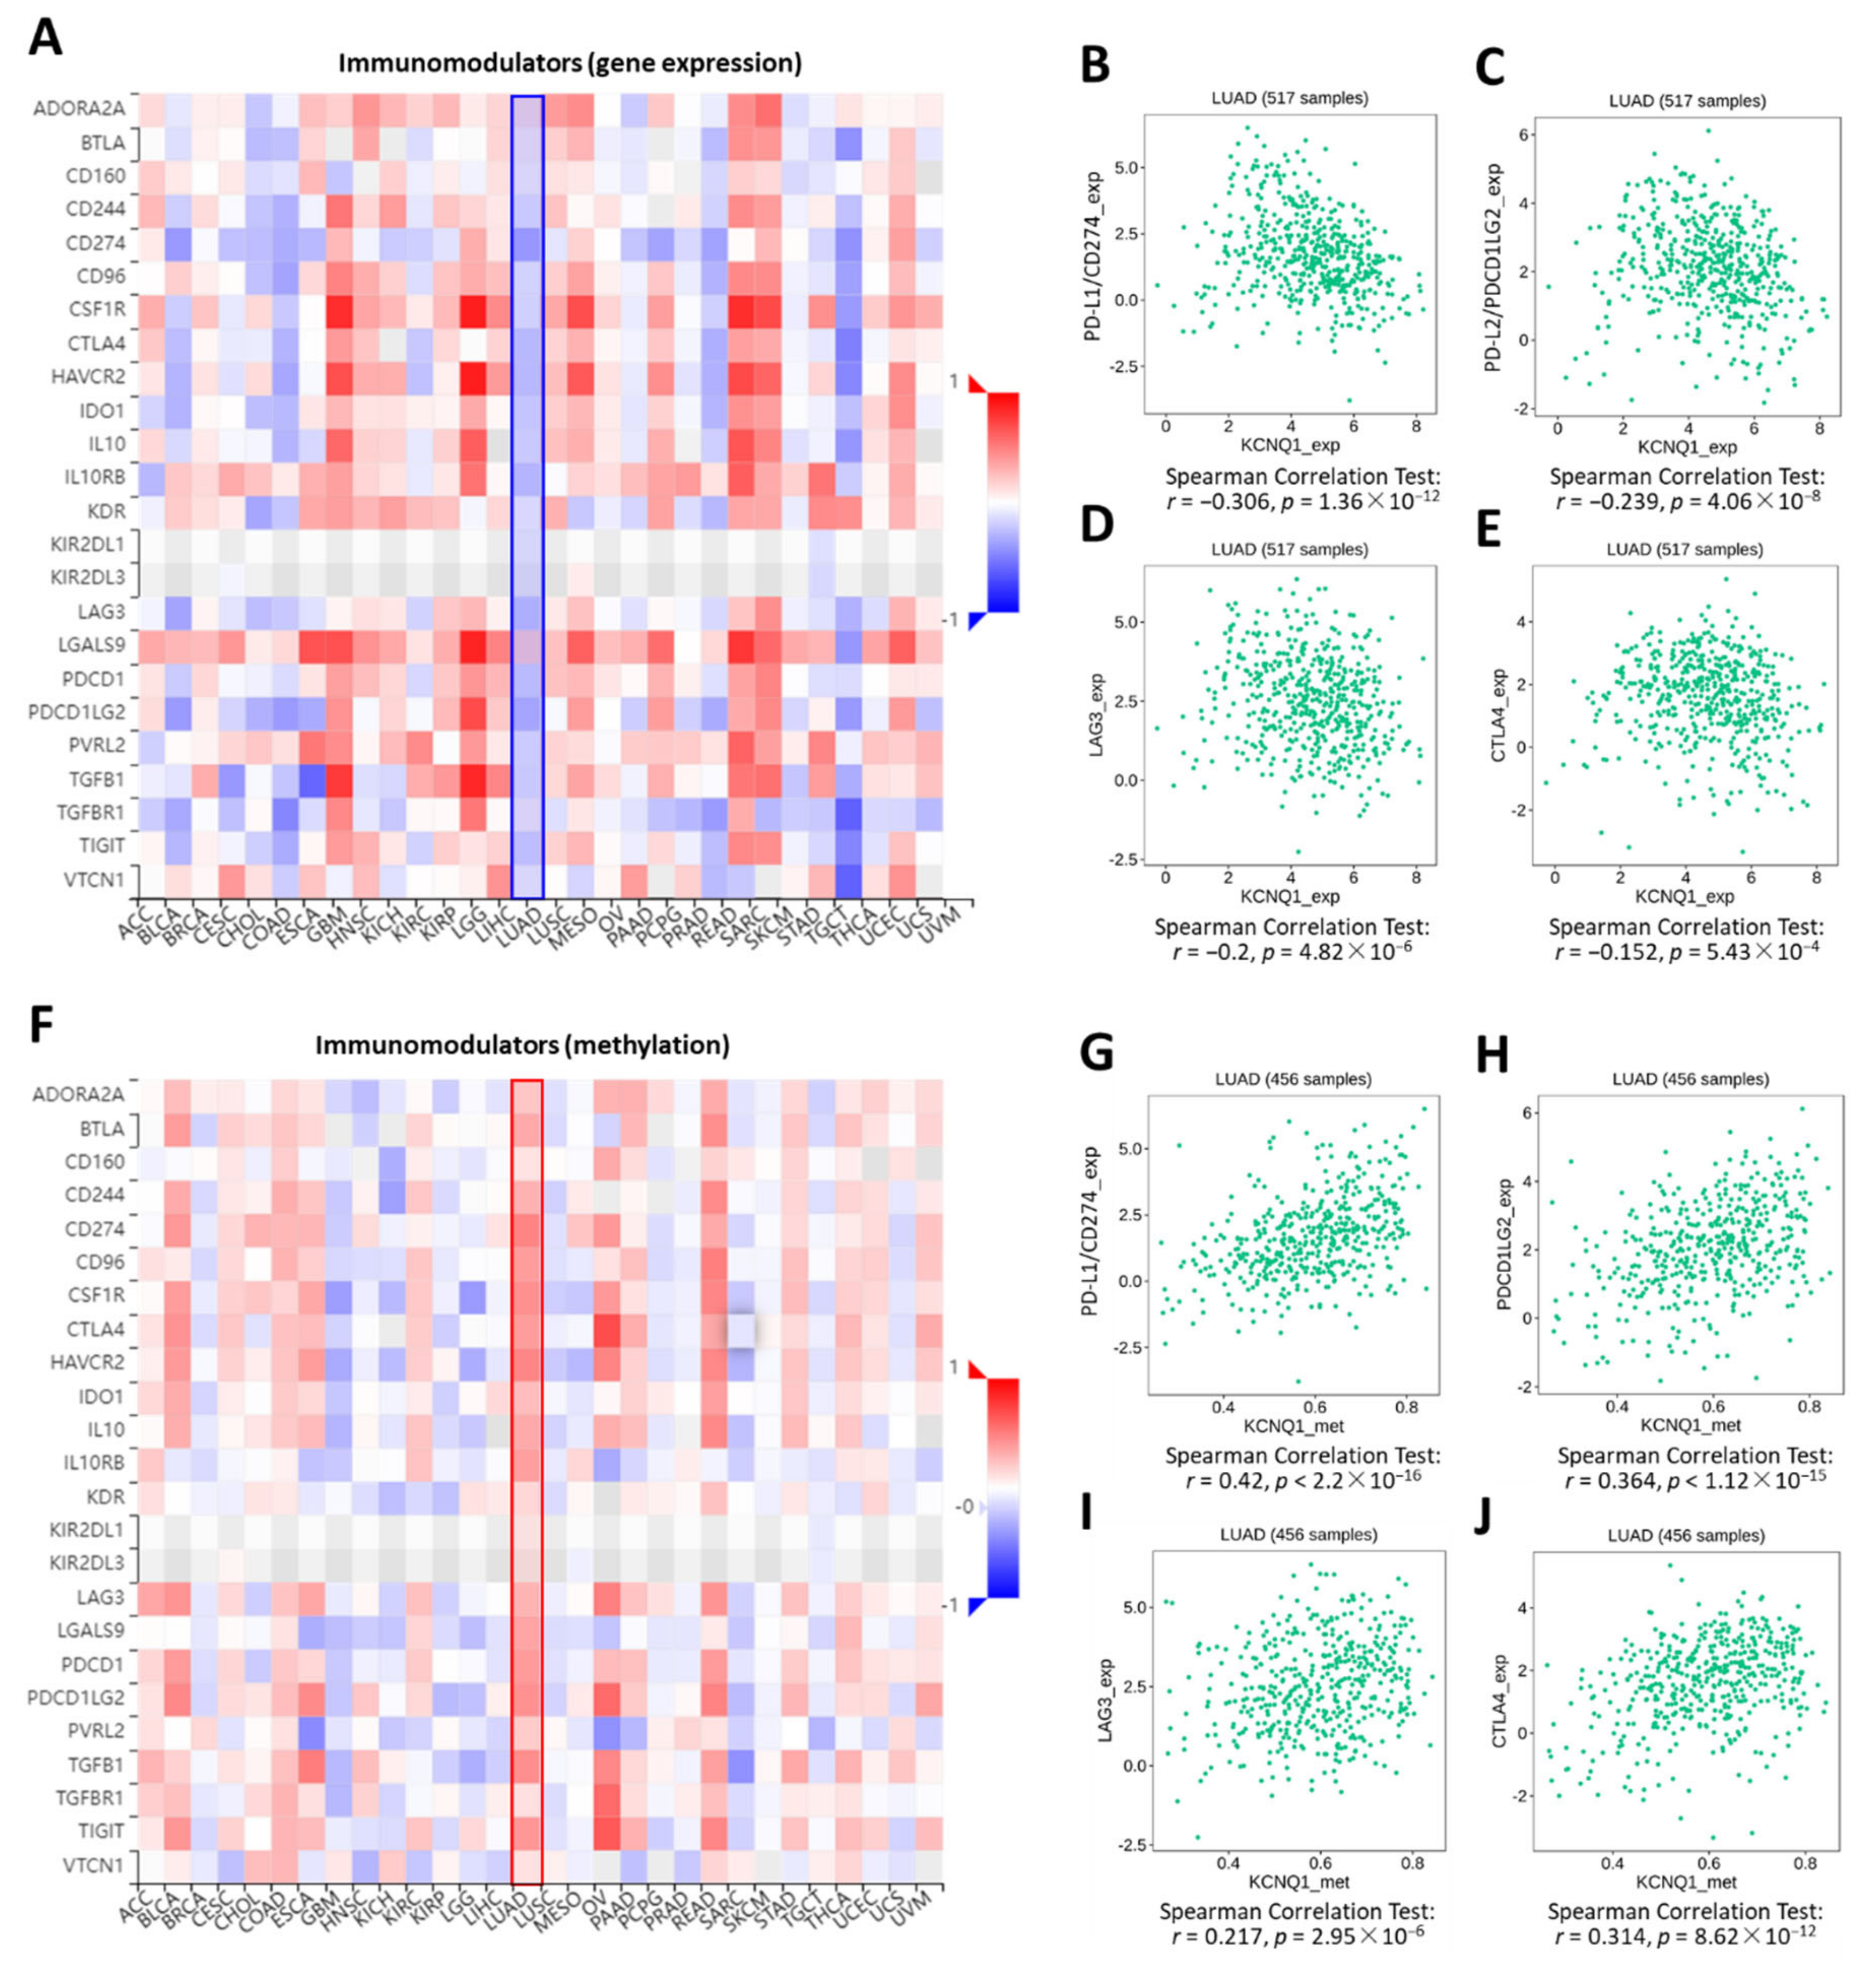
2.5. Relationship of KCNQ1 Expression with Immune Infiltration and Immunomodulators

Estimation of STromal and Immune cells in MAlignant Tumor tissues using Expression data (ESTIMATE) analysis was employed to determine the stromal score, immune score, and ESTIMATE score between a high KCNQ1 group and a low KCNQ1 group in a TCGA-LUAD cohort [24]. The high KCNQ1 group a had lower stromal score (p < 0.01), immune score (p < 0.05), and ESTIMATE score (p < 0.01) (Figure 5A–C and Supplementary File S1). Based on the fact that the ESTIMATE score is inversely correlated with tumor purity [24], this result indicates that high KCNQ1 expression is associated with lower tumor purity, thereby influencing the immune status of the tumor microenvironment. Next, TIMER analysis was used to examine the relationship between the KCNQ1 expression and immune infiltration in LUAD. KCNQ1 expression was significantly correlated with CD8+ T cells (r = 0.169, p = 1.85 × 10⁻⁴), CD4+ T cells (r = 0.24, p = 6.57 × 10⁻⁸), B cells (r = 0.321, p = 2.90 × 10⁻¹³), cancer-associated fibroblasts (r = −0.151, p = 7.73 × 10⁻⁴), M1 macrophages (r = −0.231, p = 2.27 × 10⁻⁷), M2 macrophages (r = 0.242, p = 5.62 × 10⁻⁸), and NK cells (r = 0.226, p = 4.07 × 10⁻⁷) (Figure 5D–J). We further verified the association between particular immune cell contents and overall survival in LUAD patients by Q-omics analysis. Enriched CD8+ T cells, B cells, and M2 macrophages were associated with a favorable outcome (Figure 5K–M). Specifically, TISIDB analysis revealed that the Spearman correlation coefficients for the majority of the immunomodulators were less than zero, indicating that KCNQ1 expression was negatively correlated with the levels of immunomodulators (Figure 6A), such as PD-L1 (Figure 6B), PD-L2 (Figure 6C), LAG3 (Figure 6D), and CTLA4 (Figure 6E). In addition, we noted that KCNQ1 expression was positively correlated with methylation levels of the immunomodulators (Figure 6F–J), suggesting that epigenetic modification may be implicated in the alteration of immune profiling. Overall, the negative correlation of KCNQ1 with immunomodulator profiling and its simultaneous positive correlation with methylation correlation indicates a close relationship between KCNQ1 and immunomodulators.

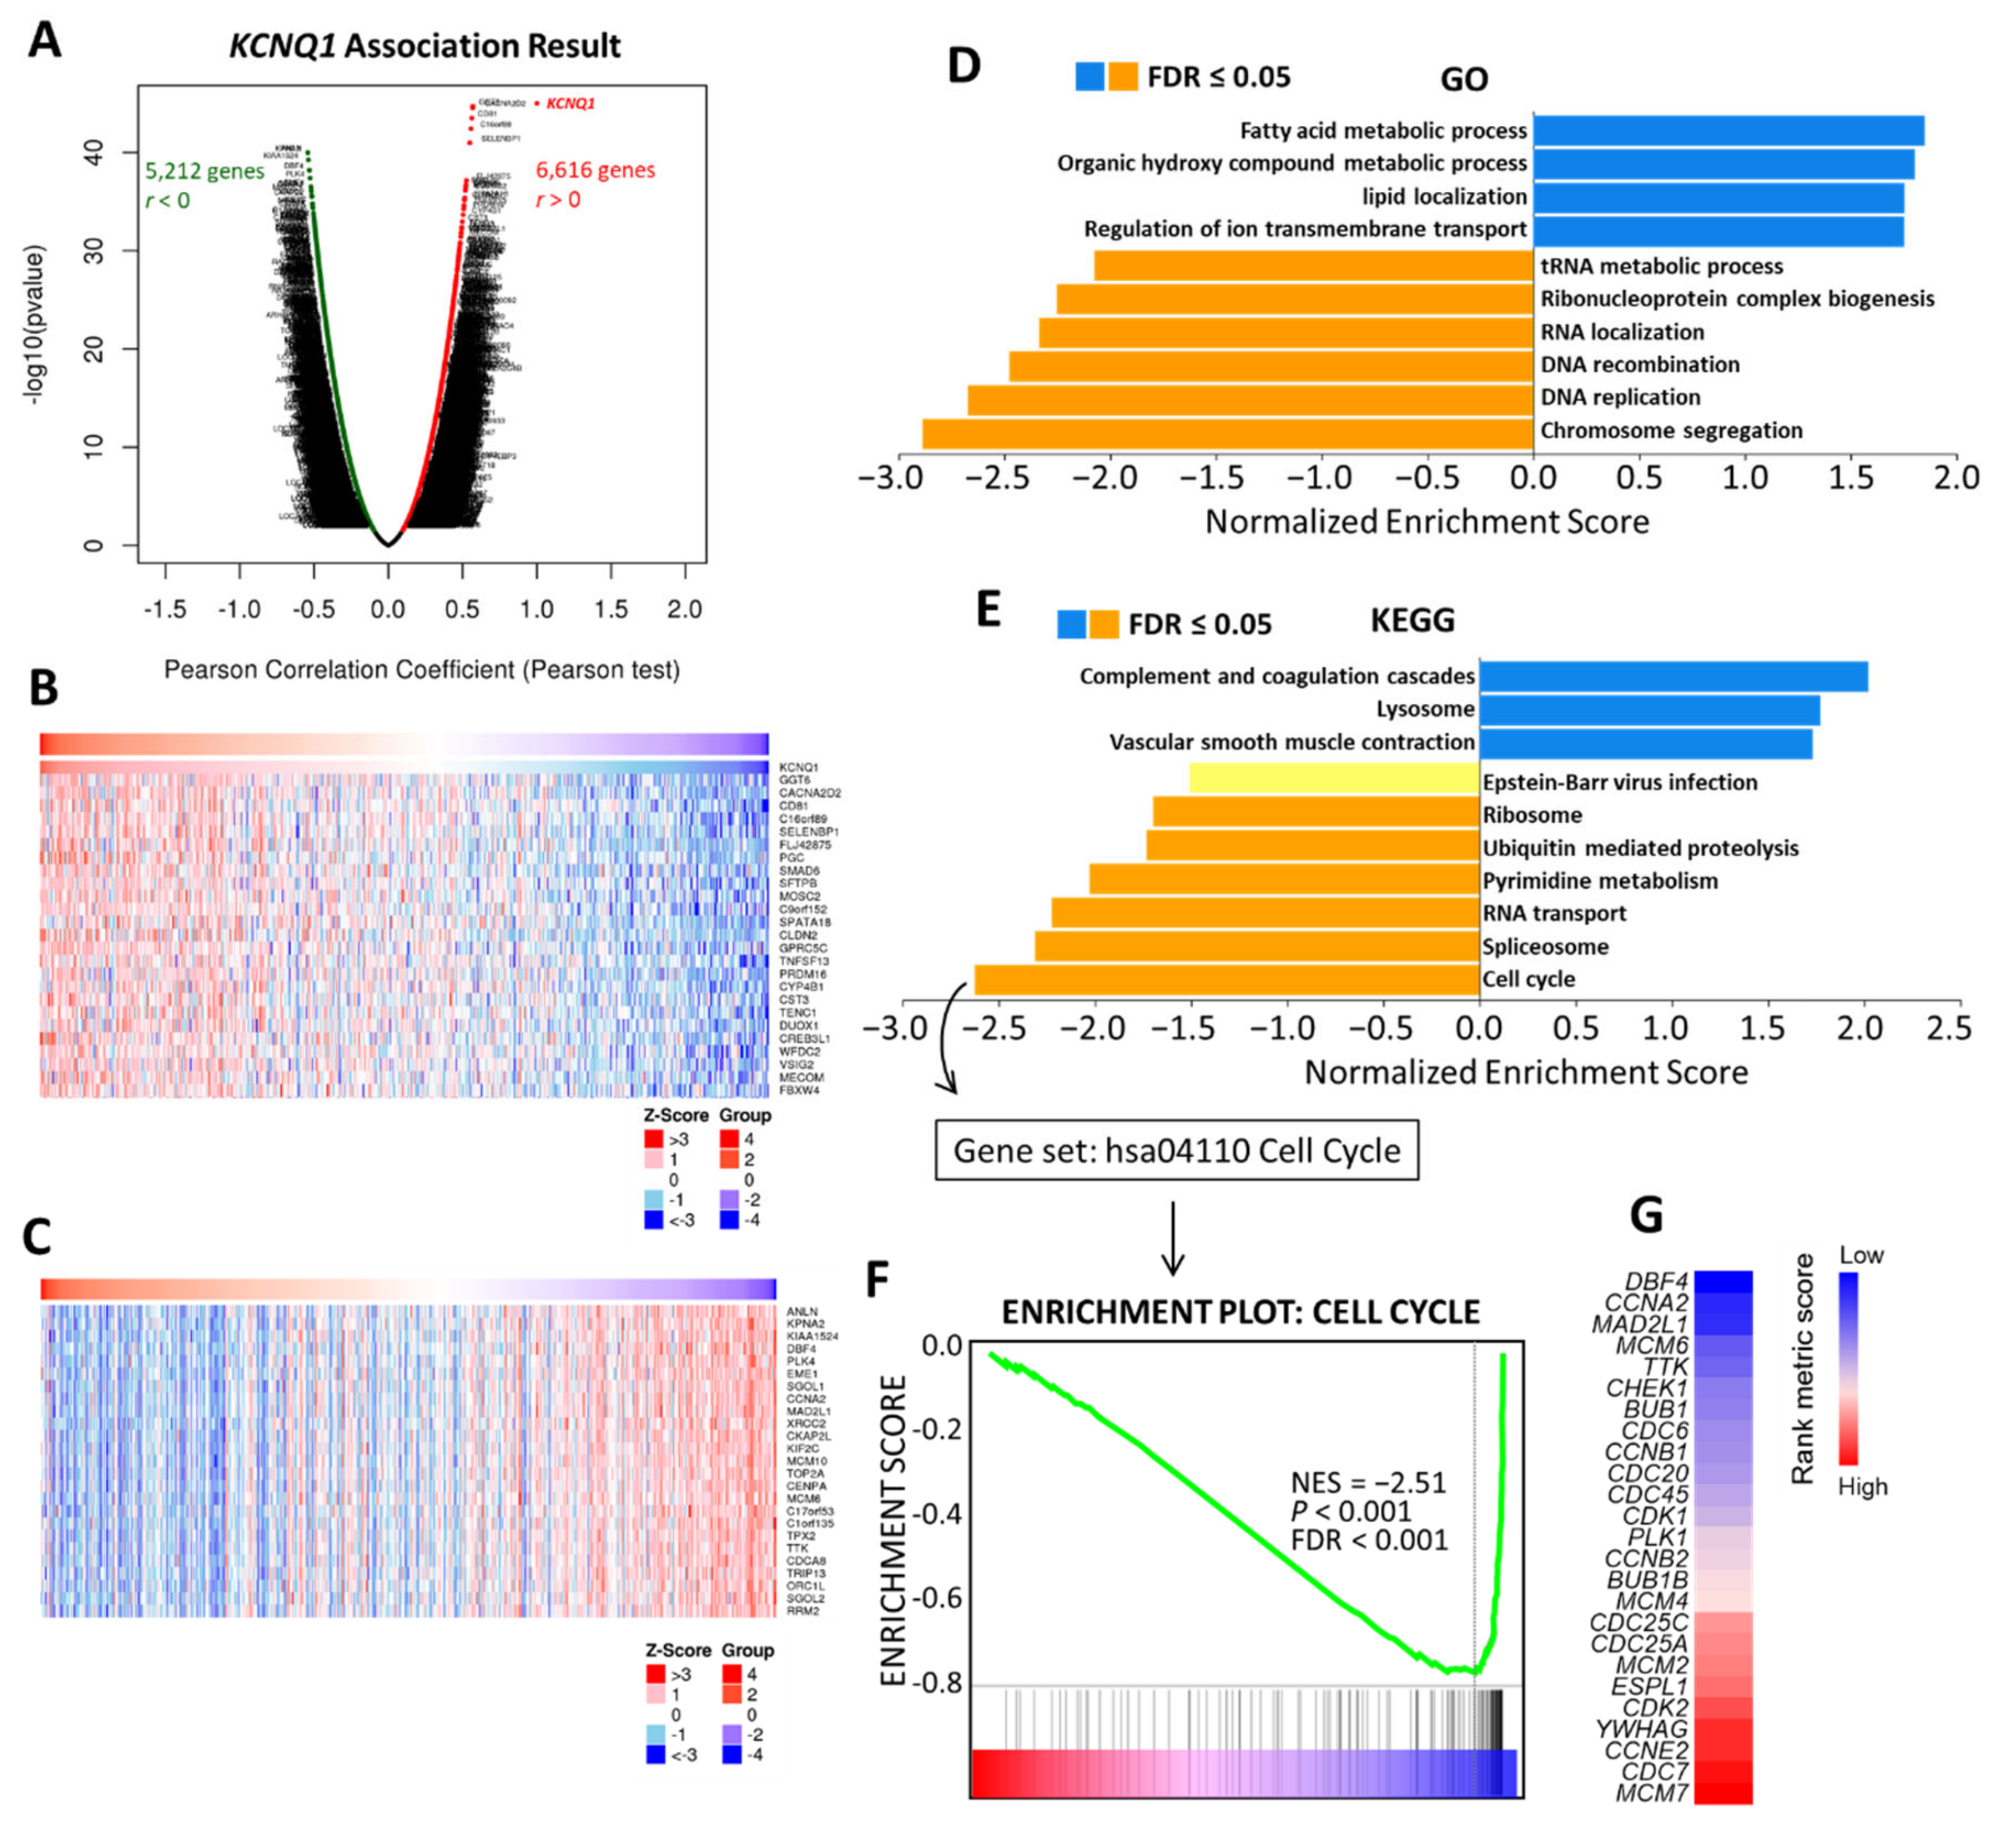
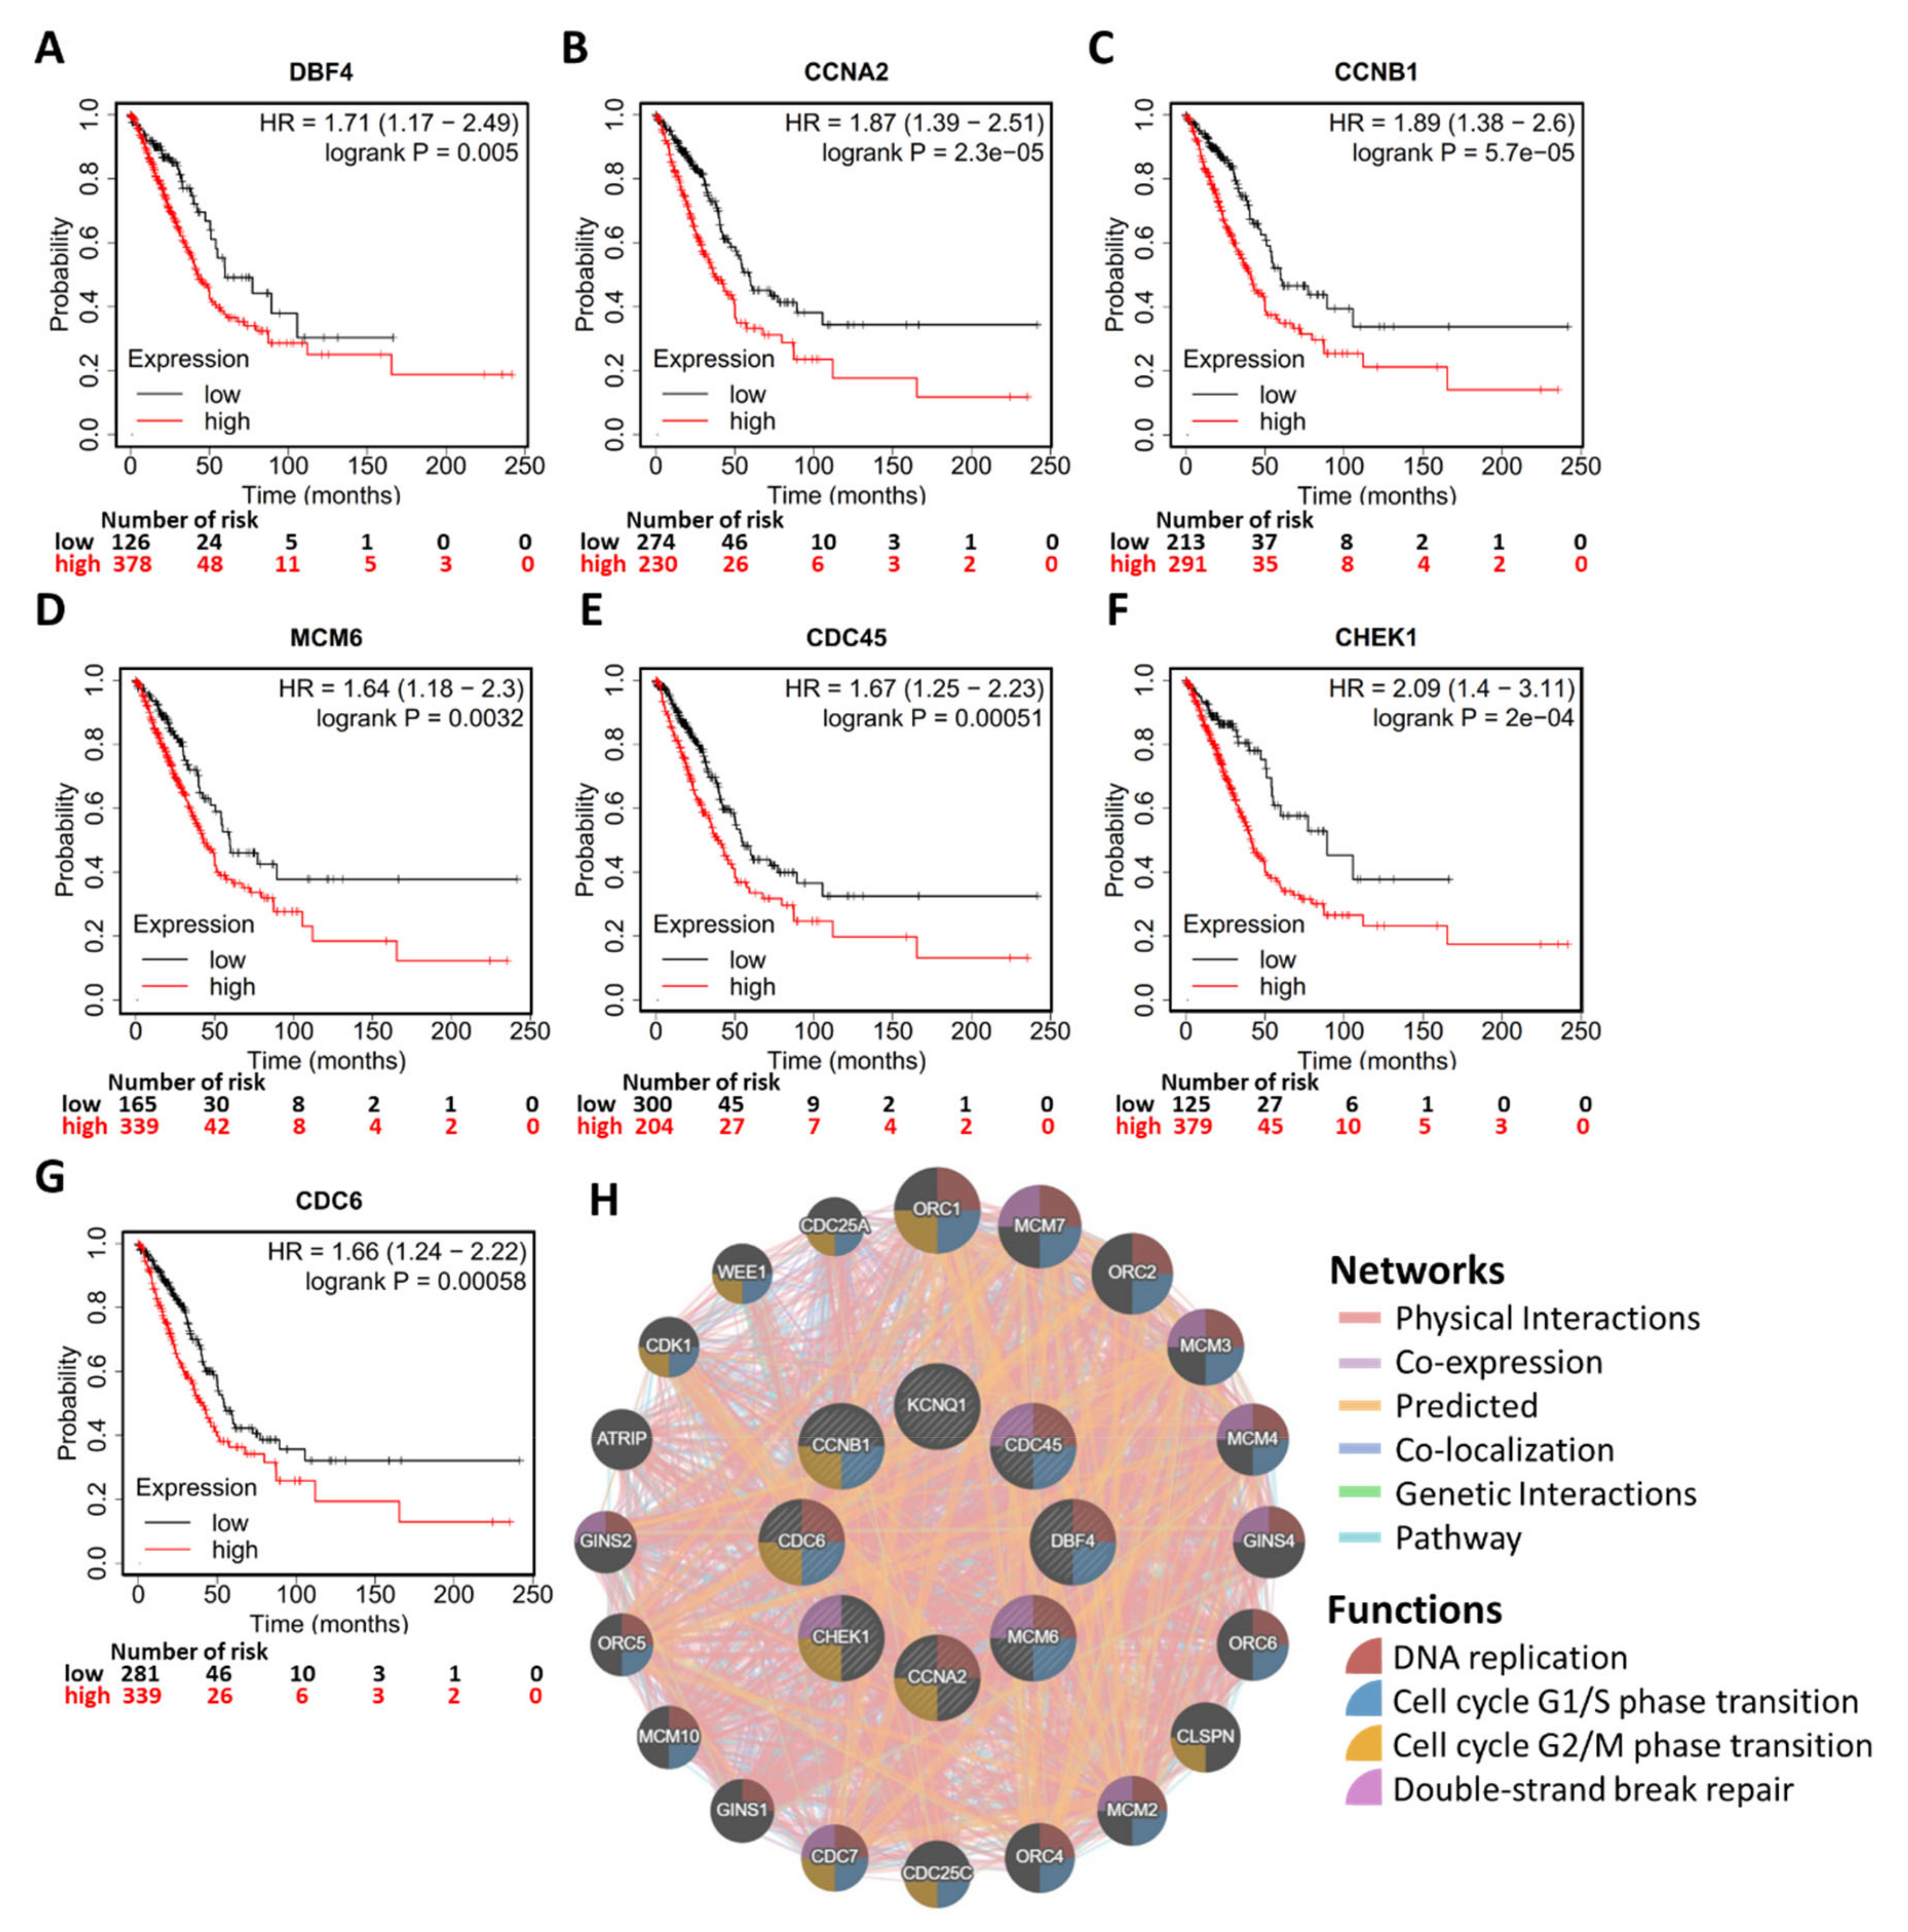
2.6. Potential Mechanism of KCNQ1 Lies in Inhibition of Cell Cycle and DNA Replication

To gain insight into the biological roles of KCNQ1, we subsequently exploited the functional modules in Linkedomics [25] to examine co-expression genes and conduct a functional enrichment analysis for the TGCA-LUAD cohort. A total of 6616 genes showed significant positive correlation with KCNQ1, while 5212 genes had significant negative correlations (Supplementary File S2 and Figure 7A). Heat maps revealed the top 25 genes with the most significant positive and negative correlations with KCNQ1, respectively (Figure 7B,C). As shown in Figure 7D, annotations of significantly enriched gene ontology (GO) terms by gene set enrichment analysis (GSEA) demonstrated that genes co-expressed with KCNQ1 were involved in the activation of the following terms: the fatty acid metabolic process, the organic hydroxy compound metabolic process, lipid localization, and regulation of ion transmembrane transport. On the other hand, activities related to the following terms were inhibited: the tRNA metabolic process, ribonucleoprotein complex biogenesis, RNA localization, DNA recombination, DNA replication, and chromosome segregation (Figure 7D). In terms of the Kyoto Encyclopedia of Genes and Genomes (KEGG) pathway analysis, enriched genes were implicated in activating the following pathways: complement and coagulation cascades, lysosome pathways, and vascular smooth muscle contraction (Figure 7E). In contrast, inhibited pathways include the ribosome pathway, ubiquitin-mediated proteolysis, pyrimidine metabolism, RNA transport, spliceosome, and the cell cycle (Figure 7E). We noted that the resultant inhibited biological functions and pathways indicate that KCNQ1-coexpressed genes may be implicated in perturbations to proliferation and the cell cycle. In view of this, we further examined the cell cycle functional gene set (Figure 7F) (Supplementary File S3) and identified the core enrichment genes (Figure 7G). Then the core enrichment genes underwent Kaplan–Meier analysis. We identified that the high expression of seven genes was associated with longer overall survival time in LUAD patients, including DBF4 (DBF4 zinc finger) (Figure 8A), CCNA2 (cyclin A2) (Figure 8B), CCNB1 (cyclin B1) (Figure 8C), MCM6 (minichromosome maintenance complex component 6) (Figure 8D), CDC45 (cell division cycle 45) (Figure 8E), CHEK1 (checkpoint kinase 1) (Figure 8F), and CDC6 (cell division cycle 6) (Figure 8G). Using the GeneMANIA algorithm, the PPI network was constructed and exhibited that the enriched functions mainly participate in DNA replication, cell cycle G1/S phase transition, cell cycle G2/M phase transition, and double-strand break repair (Figure 8H). The PPI results therefore are in tandem with the results explored at the transcriptomic level. These findings suggest that KCNQ1 may act to inhibit the cell cycle and DNA replication in LUAD.

2.7. Generalization Values of KCNQ1 in Pan-Cancers

To verify whether KCNQ1 has a broad value, we investigated differential expression across cancers and confirmed the prognostic value by means of a Kaplan–Meier analysis. We noted that a number of cancers presented similar expression patterns to LUAD, such as breast cancer (BRCA), kidney renal clear cell carcinoma (KIRC), kidney renal papillary cell carcinoma (KIRP), lung squamous cell carcinoma (LUSC), pheochromocytoma and paraganglioma (PCPG), and thyroid carcinoma (THCA) (Figure 9A). The Kaplan–Meier analysis demonstrated that high KCNQ1 expression had significant associations with longer overall survival time in KIRC (Figure 9B), PCPG (Figure 9C), and COAD (Figure 9D).

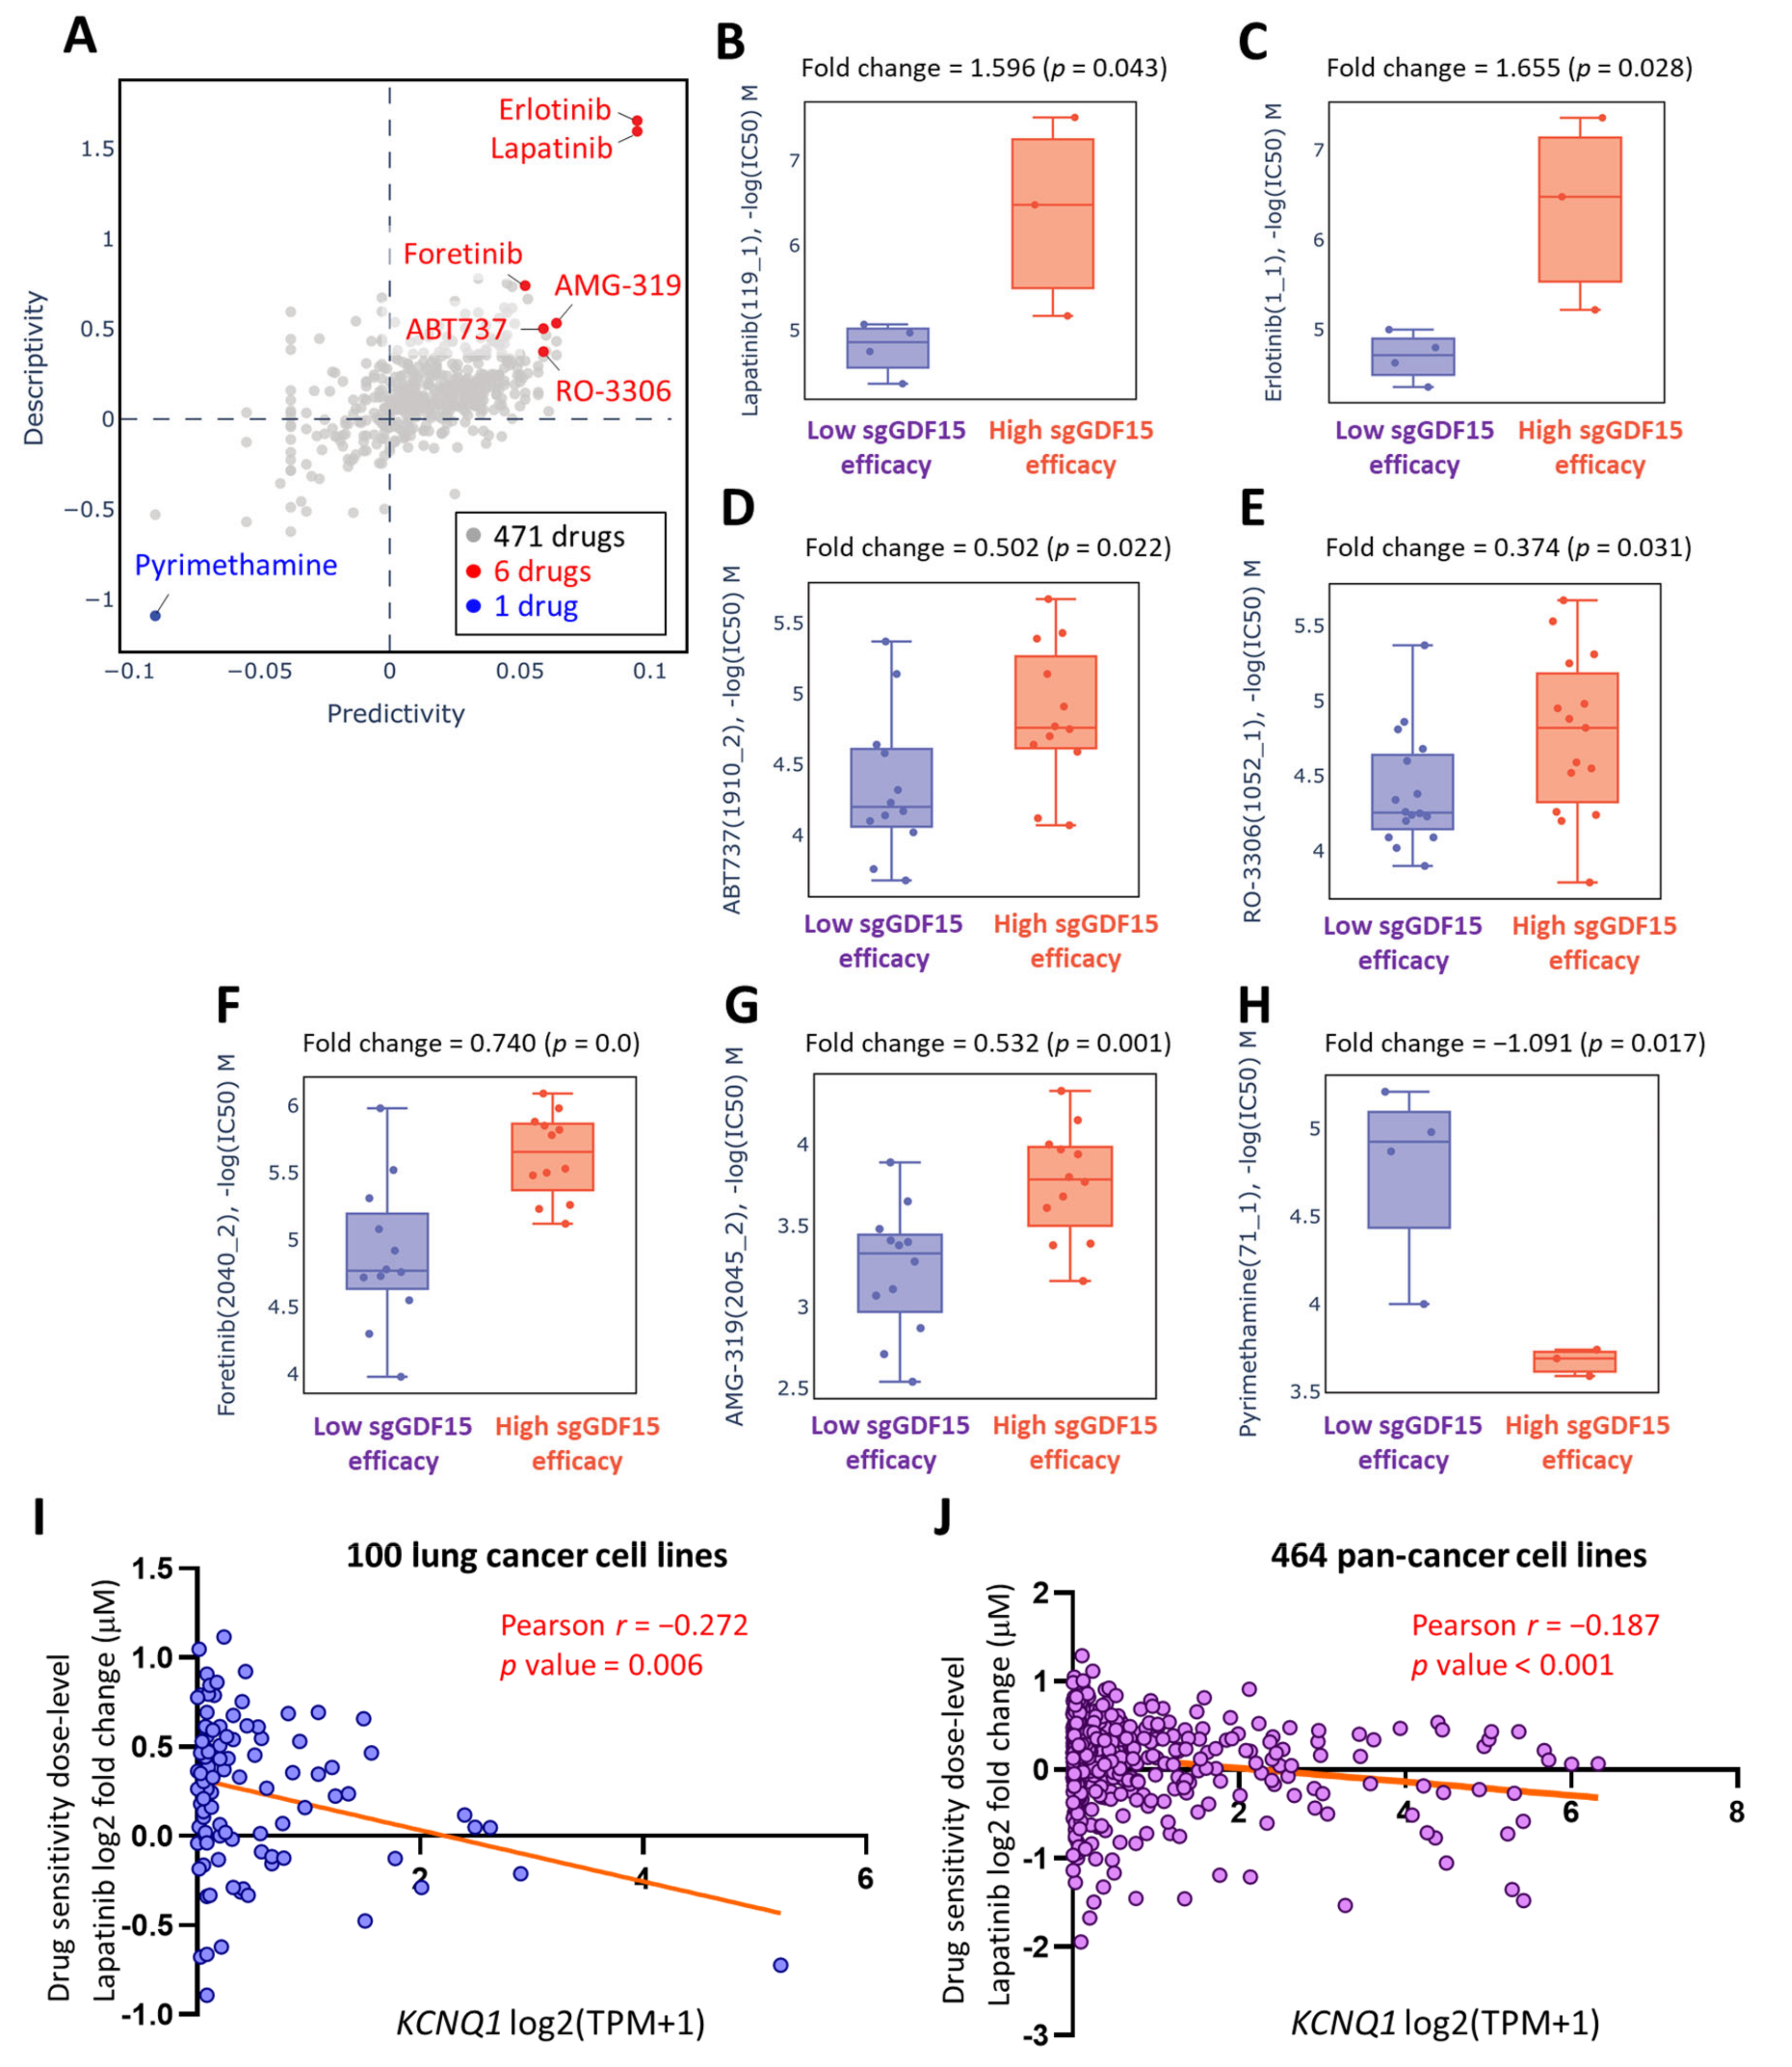
2.8. Lapatinib as a Therapeutic Option in the Context of Low KCNQ1

With a view to exploring possible pharmaceutical approaches that could effectively target LUAD, we utilized the Genomics of Drug Sensitivity in Cancer (GDSC) repository of Q-omics analyses to identify drugs that feature potentiation effects in the context of low KCNQ1 expression. We conducted cross-associations between drug response and single-guide RNA (sgRNA)-mediated knockdown of KCNQ1 using a CRISPR approach in LUAD cell groups. Among 471 drugs, 7 drugs exerting altered potency were identified (Figure 10A and Supplementary File S4). LUAD cells with high sgRNA-GDF15 efficiency exhibited higher log(IC50) values in response to lapatinib (Figure 10B), erlotinib (Figure 10C), ABT737 (Figure 10D), RO-3306 (Figure 10E), foretinib (Figure 10F), and AMG-319 (Figure 10G). In contrast, pyrimethamine showed an inverse effect (Figure 10H). Furthermore, we employed a Cancer Cell Line Encyclopedia (CCLE) analysis to further verify the effect of KCNQ1 expression levels on drug sensitivity in cancer cell lines. The drug sensitivity of lapatinib showed a negative correlation with KCNQ1 expression in 100 lung cancer cell lines (r = −0.272, p value = 0.006) (Figure 10I and Supplementary File S5) as well as 464 pan-cancer cell lines (r = −0.187, p value < 0.001) (Figure 10J and Supplementary File S6).

3. Discussion

KCNQ1 is curated as one of the definitive genes for arrythmia [26], while its clinical implications and biological roles in LUAD remain unclear. In this study, we integrated multi-omics databases and experimental investigation to reveal KCNQ1 as an independent risk predictor and as a diagnostic biomarker for LUAD. KCNQ1 with altered variants had associations with favorable prognosis, while its low expression predicted worse prognosis and negatively correlated with tumor proliferation indicator Ki67. The KCNQ1 mutations were highly associated with TMB. The decreased gene/protein expression of KCNQ1 can serve as a diagnostic biomarker and show good diagnostic efficiency. The KCNQ1 expression preferentially showed prognostic value in the early stage of LUAD. On the other hand, we uncovered that the content of Th1, Th2, macrophages, NKT, MSC, and TMB can counteract the prognostic significance. Low KCNQ1 is closely associated with decreased immune infiltration of CD8+ T cells, B cells, and M2 macrophages, which indicated shorter overall survival among the LUAD cohort. Specifically, KCNQ1 expression negatively correlated with the levels of immunosuppressive molecules, wherein methylation modification may play a role. The potential mechanism of KCNQ1 underlying LUAD progression may lie in the perturbation of genes relevant to the cell cycle and DNA replication. In addition, we showed that the diagnostic and prognostic value of KCNQ1 can be extrapolated to other cancer types, including KIRC, PCPG, and COAD. Importantly, we identified that lapatinib can act as a therapeutic option when LUAD presents with low KCNQ1 expression, offering a promising precision treatment strategy. A proposed model is summarized in Figure 11.
Recently, several studies have shown the clinical implication of KCNQ1 in gastrointestinal cancers. Than et al. demonstrated that low expression of KCNQ1 was associated with poor overall survival in patients with colorectal cancer [27]. den Uil et al. reported that low expression of KCNQ1 was associated with poor disease-free survival [28]. Yang et al. demonstrated that the KCNQ1 rs231348 CT variant indicates an increased gastric cancer risk [29]. Similar to the aforementioned observations, our study demonstrated that altered variants and high expression of KCNQ1 indicated a favorable outcome in patients with LUAD and that its low expression represented a diagnostic biomarker of LUAD tumors.
Our study revealed that high KCNQ1 expression intimately correlated with an immune infiltration profile that is associated with longer survival time and with downregulation of immunomodulatory genes, which may concurrently act to shape an immunoactive tumor microenvironment. In this regard, Than et al. demonstrated that KCNQ1 loss-of-function in mice led to increased intestinal tumors and dysregulation of genes involved in immune homeostasis [27], in support of our observation.
In terms of the underlying mechanism of KCNQ1 in tumor biology, Rapetti-Mauss et al. reported that KCNQ1 acted to reduce proliferation and invasion of colorectal cancer cells by inhibiting the Wnt/β-catenin pathway [30]. Huang et al. demonstrated that overexpression of KCNQ1 decreased tumor growth and lung metastasis in a nude mouse model of renal cell carcinoma via a miR-140-5p/KLF9/KCNQ1 pathway [20]. In addition, Chen et al. noted that miR-483-5p acted to target KCNQ1, leading to facilitated cell proliferation and the invasion of esophageal cancer cells [19]. In line with these observations, we identified KCNQ1 as an independent risk factor and a tumor suppressor in LUAD. We explored whether KCNQ1 may exert an inhibitory effect on pathways involved in the cell cycle and DNA replication. Specifically, the inhibition of DBF4, CCNA2, CCNB1, MCM6, CDC45, CHEK1, and CDC6 may be implicated in KCNQ1-mediated tumor suppression. Nevertheless, further investigation is warranted to elucidate the molecular basis.
Given that KCNQ1 plays a tumor suppressive role, its downregulation may promote the proliferation and metastasis of cancer cells. ShRNA-based knockdown of KCNQ1 was shown to promote cytosolic accumulation of β-catenin, which acts to mediate the proliferation of cancer cells [30]. Similar to our study, we noted that KCNQ1 knockdown increased the migration ability of lung cancer cells. It is noteworthy that KCNQ1 can be inhibited by gefitinib, which is the first-generation targeted therapy for NSCLC [31]. This KCNQ1-inhibiting effect of gefitinib is implicated in the induction of heart QT prolongation in a guinea pig model, thereby raising a concern of arrythmia when gefitinib is used for NSCLC treatment. Of note, the present study unveiled that lapatinib may be a potential therapeutic drug for the treatment of lung cancer when KCNQ1 expression levels are low. While more studies are warranted, this finding may support the development of a precision treatment for LUAD based on KCNQ1 expression levels.

4. Materials and Methods

4.1. Multi-Omics Analysis of KCNQ1 in Human Diseases and Cancers

The functional involvement of KCNQ1 in human diseases was examined using the Open Target Platform (https://www.opentargets.org/; accessed on 12 January 2022), which integrates public data relevant to the association between targets and diseases and provides additional data and tools for prioritization. The relationships between KCNQ1 variants and overall survival, disease-specific survival, progression-free survival and the mutational landscape of KCNQ1 were retrieved from the cBioPortal for Cancer Genomics (https://www.cbioportal.org/; accessed on 12 January 2022) [32], which is a web platform of gene-based data exploration.
The Pearson correlation coefficient analysis for KCNQ1 expression and its coexpression genes was analyzed using LinkedOmics [25], which is a multi-omics web portal for the analysis of 32 cancer types (http://www.linkedomics.org/login.php; accessed on 9 January 2022), presenting the results with volcano plots and heatmaps. The functional modules of Linkedomics were based on the Hiseq RNA platform. The gene set enrichment analysis (GSEA) was performed for and used in the analysis of biological process terms of gene ontology (GO) and Kyoto Encyclopedia of Genes and Genomes (KEGG) pathways.
For the protein–protein interaction (PPI) network analysis, we selected KCNQ1 and the GSEA core enrichment genes and inputted them into GeneMANIA, which is an open website for building PPI networks and demonstrating gene function and data regarding physical interaction, co-expression, and co-location, as well as enrichment and predictive analyses [33,34].

4.2. Cell Culture and Transfection

Human lung adenocarcinoma epithelial cell lines A549 purchased from American Type Tissue Collection (ATCC, Manassas, VA, USA) were cultured in DMEM medium supplemented with 10% fetal bovine serum (FBS) (Thermo Fisher Scientific, Waltham, MA, USA) and 1% penicillin/streptomycin (Thermo Fisher Scientific, Waltham, MA, USA). Then, 20 nM of FAM-labeled negative control siRNA and KCNQ1-targeting siRNA (Thermo Fisher Scientific, Waltham, MA, USA) were transfected with LipofectamineTM RNAiMAX Transfection Reagent (Invitrogen, Carlsbad, CA, USA). siRNA transfection efficiency was monitored under a fluorescence microscope.

4.3. Wound Healing Assay

To allow attachment, 70 μL of the detached cells (2 × 10⁵ cells/mL) were seeded (ibidi culture-insert 2 well, ibidi GmbH, Martinsried, Germany) overnight. The culture insert was then removed, resulting in a bar of wound. Phosphate buffer solution was used to gently wash out the floating cells. The culture plate was photographed to document the width of the wound under a light microscope. The area of the wound was quantified using ImageJ Version 1.53i.

4.4. Gene/Protein Differential Expression and Prognostic Significance

The KCNQ1 expression levels in LUAD tumors and adjacent normal tissue were accessed in TNMplot (https://tnmplot.com/analysis/; GEO datasets accessed on 12 January 2022) [35], in UALCAN (http://ualcan.path.uab.edu/; TCGA datasets accessed on 11 January 2022) [36,37], and in the Gene Expression Omnibus (GEO) (https://www.ncbi.nlm.nih.gov/geo/; GSE11502 datasets accessed on 10 January 2022). The immunohistochemical (IHC) staining signal of KCNQ1 protein expression was analyzed using the Human Protein Atlas (http://www.proteinatlas.org; accessed on 15 January 2022) [38,39,40]. The diagnostic efficiency was evaluated by means of the receiver operating characteristics (ROC) curve analysis. The survival analysis of various clinical stages and in the context of different immune cell contents or tumor mutational burdens was conducted using the Kaplan–Meier plotter web server (available online: https://kmplot.com/analysis/; accessed on 25 October 2021). The pan-cancer profile of KCNQ1 expression was analyzed using the TNM plotter (https://tnmplot.com/analysis/; GEO datasets accessed on 12 January 2022).

4.5. Analysis of Immune Infiltration and Immunomodulator Profiling

The matrix content (stromal score), immune cell infiltration levels (immune score), and comprehensive score (ESTIMATE score) of TCGA-LUAD samples were evaluated using ESTIMATE [24]. The subtypes of tumor-infiltrating immune cells were determined using the TIMER online database [41]. The association between immune cell contents (CD8+ T cells, B cells, and M2 macrophages) and overall survival of LUAD patients was examined with Q-omics v.0.95 (accessed on 12 January 2022) [42]. The Spearman correlation test for KCNQ1 expression and analysis of immunomodulator expression and methylation levels was conducted with TISIDB, which is a web portal for the analysis of tumor and immune system interactions [43].

4.6. Exploration of Potent Drugs Based on KCNQ1 Expression

The drug sensitivity profiling based on KCNQ1 expression was analyzed using the CRISPR-screen data repository of the GDSC algorithm in Q-omics v.1.0 (accessed on 12 January 2022) [42]. The data of cellular sensitivity to lapatinib based on KCNQ1 expression was retrieved from the Cancer Cell Line Encyclopedia (CCLE) (https://sites.broadinstitute.org/ccle/tools; accessed on 18 January 2022) [44]. The Pearson correlation coefficient analysis was used to analyze the correlation between KCNQ1 expression levels and lapatinib dose levels.

4.7. Statistical Analysis
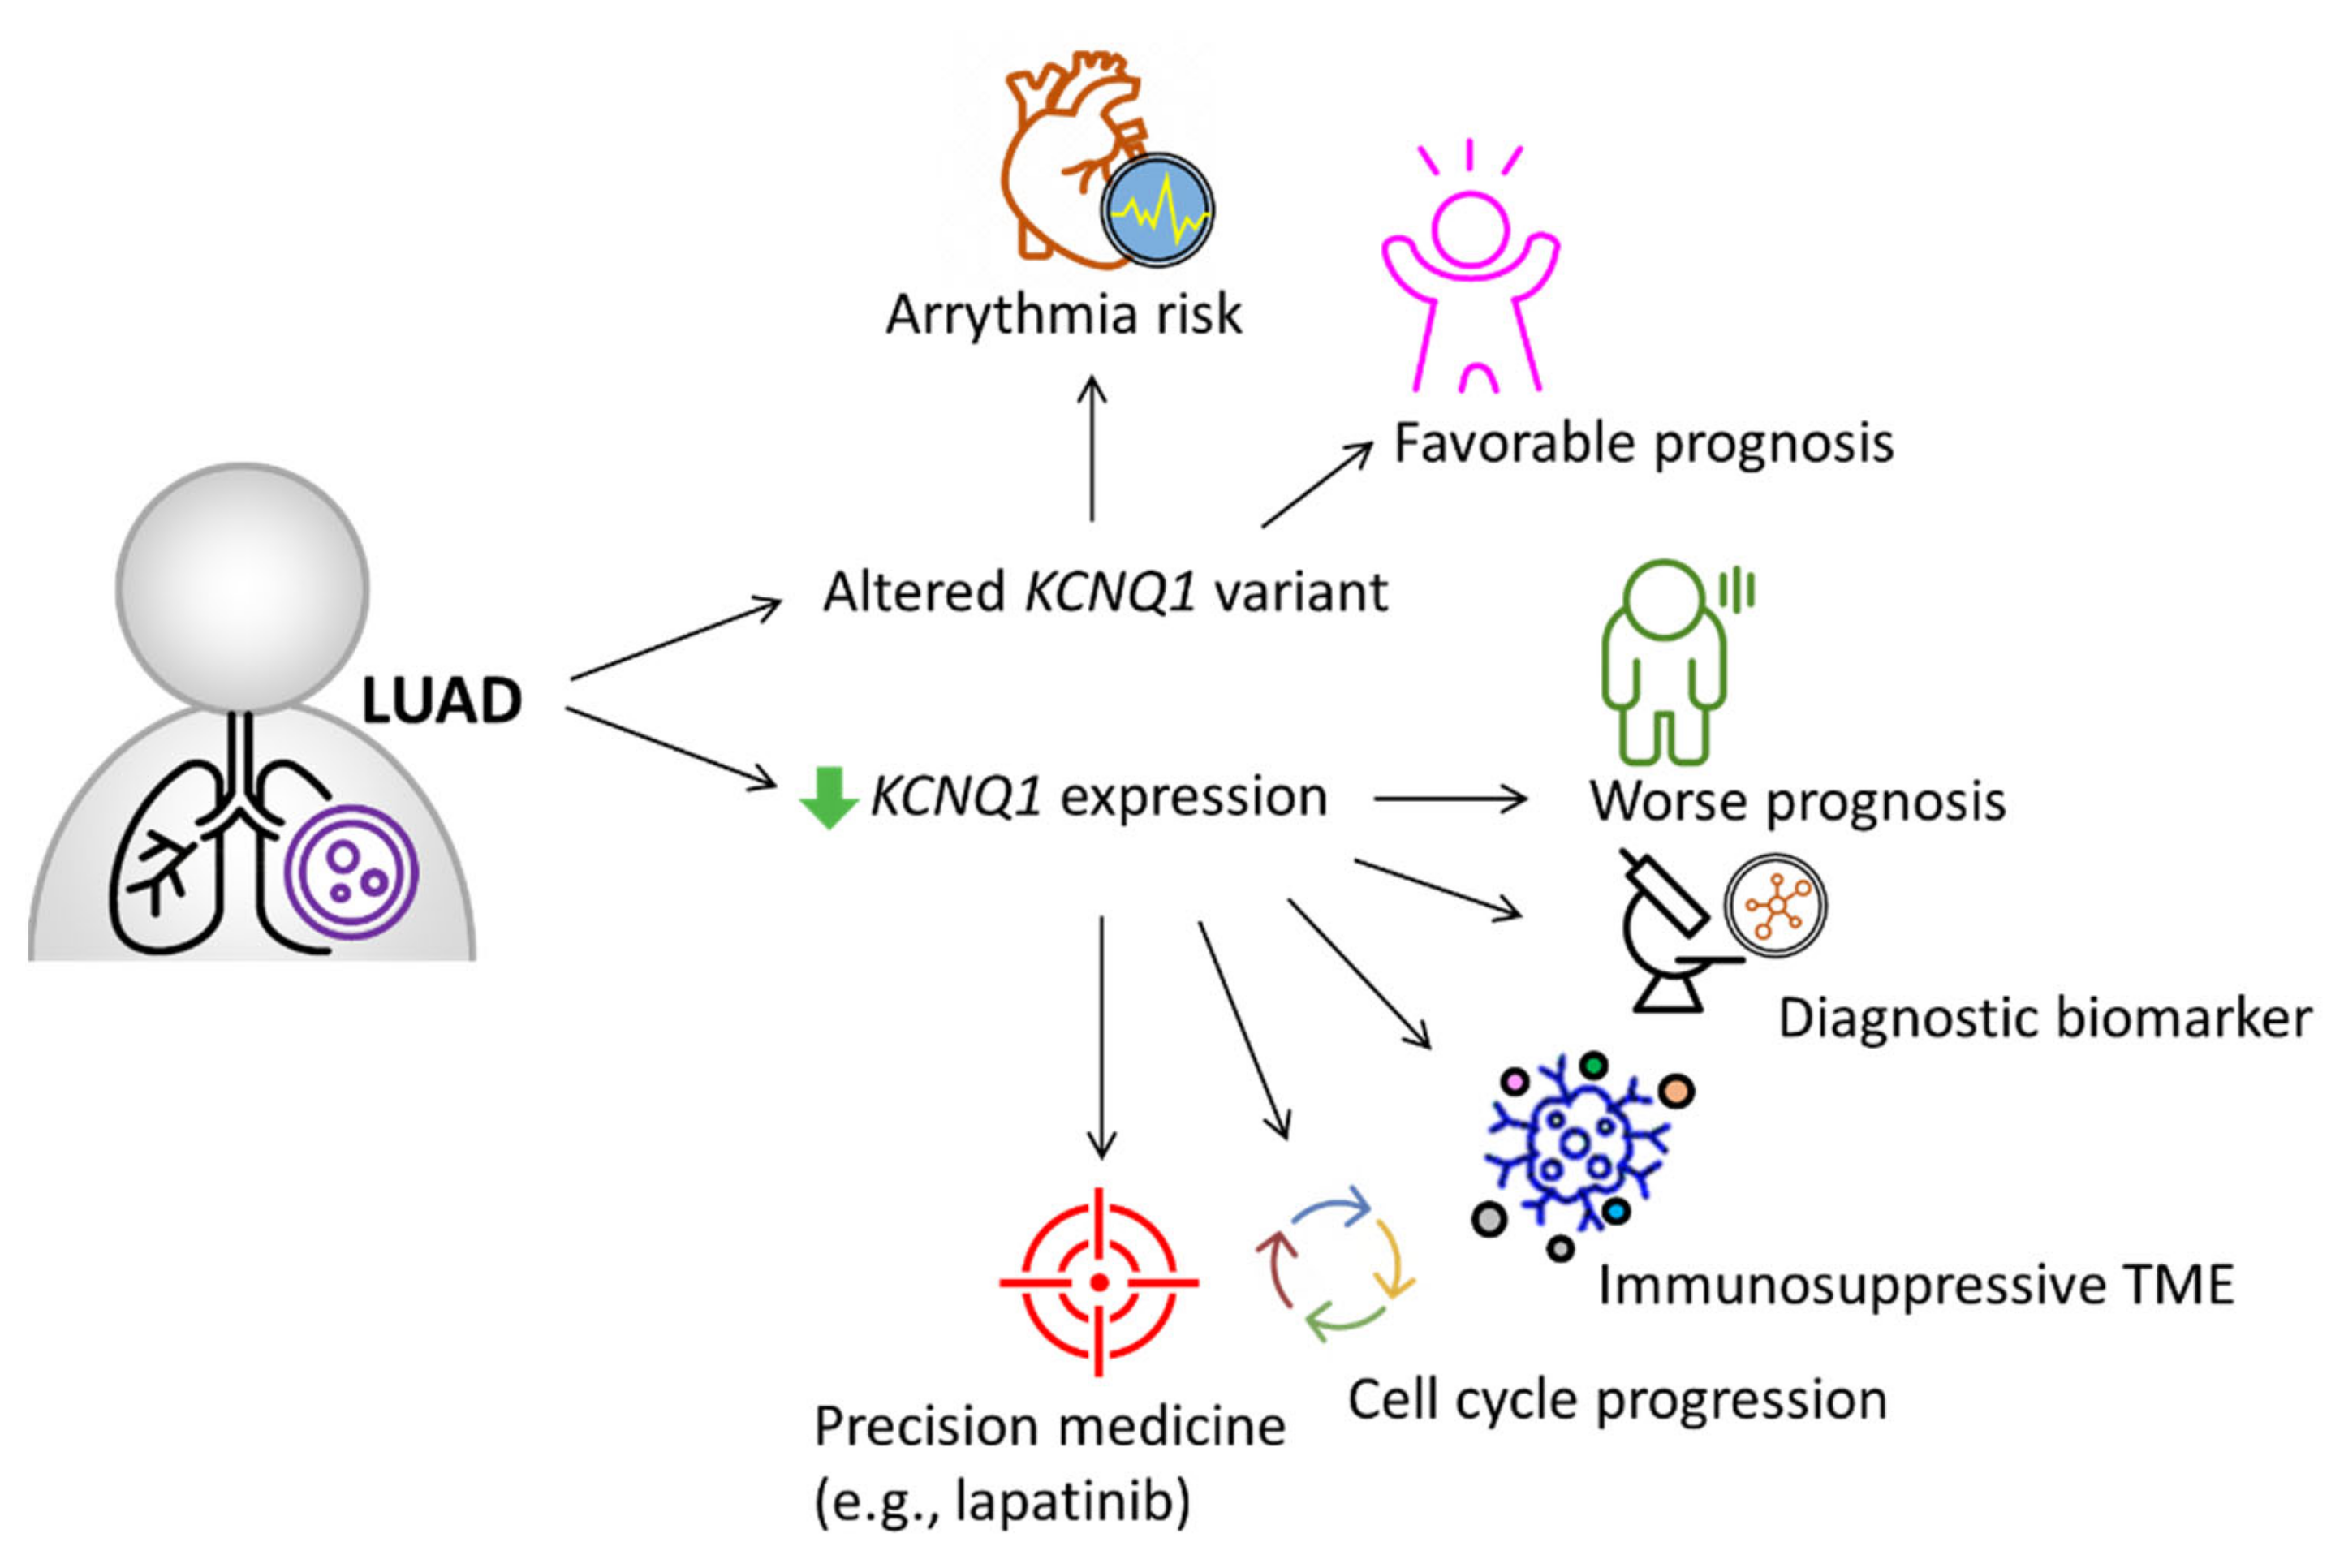
An unpaired t-test was used to compare quantitative data for two groups. The Pearson method was employed to analyze correlations. The log-rank method was used to test the survival difference between the two groups. GraphPad Prism V8.0 (GraphPad Software, San Diego, CA, USA) and SPSS V18.0 (IBM, Armonk, NY, USA) were used for statistical processing. GraphPad Prism V8.0 was utilized for data visualization.

5. Conclusions

This study unveiled the significance of KCNQ1 in diagnosis/prognosis and provided a corresponding precision medicine strategy.

Supplementary Materials

The following supporting information can be downloaded at: www.mdpi.com/article/10.3390/ijms23042279/s1.

Author Contributions

Conceptualization, H.-Y.L.; methodology, H.-J.W.; software, H.-Y.L. and C.-W.L.; validation, K.-T.C.; formal analysis, C.-Y.L.; investigation, H.-J.W.; resources, C.-Y.L.; data curation, K.-T.C.; writing—original draft preparation, K.-T.C.; writing—review and editing, C.-Y.L.; visualization, H.-J.W. and C.-W.L.; supervision, H.-Y.L.; project administration, H.-Y.L.; funding acquisition, K.-T.C. All authors have read and agreed to the published version of the manuscript.

Funding

This research was funded by Show Chwan Memorial Hospital, Changhua, Taiwan (grant number: SRD-11031 and SRD-11032).

Institutional Review Board Statement

Not applicable.

Informed Consent Statement

Not applicable.

Data Availability Statement

Data are contained within the article.

Acknowledgments

The authors would like to thank James Waddell for his assistance with the proof-reading of this article.

Conflicts of Interest

The authors declare no conflict of interest.

References

  1. Sung, H.; Ferlay, J.; Siegel, R.L.; Laversanne, M.; Soerjomataram, I.; Jemal, A.; Bray, F. Global Cancer Statistics 2020: GLOBOCAN Estimates of Incidence and Mortality Worldwide for 36 Cancers in 185 Countries. CA Cancer J. Clin. 2021, 71, 209–249. [Google Scholar] [CrossRef] [PubMed]
  2. Chen, Z.; Fillmore, C.M.; Hammerman, P.S.; Kim, C.F.; Wong, K.K. Non-small-cell lung cancers: A heterogeneous set of diseases. Nat. Rev. Cancer 2014, 14, 535–546. [Google Scholar] [CrossRef]
  3. Duruisseaux, M.; Esteller, M. Lung cancer epigenetics: From knowledge to applications. Semin. Cancer Biol. 2018, 51, 116–128. [Google Scholar] [CrossRef] [PubMed]
  4. Yuan, M.; Huang, L.L.; Chen, J.H.; Wu, J.; Xu, Q. The emerging treatment landscape of targeted therapy in non-small-cell lung cancer. Signal Transduct. Target. Ther. 2019, 4, 61. [Google Scholar] [CrossRef] [PubMed] [Green Version]
  5. Osipov, A.; Murphy, A.; Zheng, L. From immune checkpoints to vaccines: The past, present and future of cancer immunotherapy. Adv. Cancer Res. 2019, 143, 63–144. [Google Scholar] [CrossRef]
  6. Topalian, S.L. Targeting Immune Checkpoints in Cancer Therapy. JAMA 2017, 318, 1647–1648. [Google Scholar] [CrossRef]
  7. Lin, J.J.; Shaw, A.T. Resisting Resistance: Targeted Therapies in Lung Cancer. Trends Cancer 2016, 2, 350–364. [Google Scholar] [CrossRef] [Green Version]
  8. Cowley, E.A.; Linsdell, P. Oxidant stress stimulates anion secretion from the human airway epithelial cell line Calu-3: Implications for cystic fibrosis lung disease. J. Physiol. 2002, 543, 201–209. [Google Scholar] [CrossRef]
  9. Peroz, D.; Rodriguez, N.; Choveau, F.; Baro, I.; Merot, J.; Loussouarn, G. Kv7.1 (KCNQ1) properties and channelopathies. J. Physiol. 2008, 586, 1785–1789. [Google Scholar] [CrossRef]
  10. Cowley, E.A.; Linsdell, P. Characterization of basolateral K+ channels underlying anion secretion in the human airway cell line Calu-3. J. Physiol. 2002, 538, 747–757. [Google Scholar] [CrossRef]
  11. Cuthbert, A.W.; MacVinish, L.J. Mechanisms of anion secretion in Calu-3 human airway epithelial cells by 7,8-benzoquinoline. Br. J. Pharmacol. 2003, 140, 81–90. [Google Scholar] [CrossRef] [PubMed]
  12. Moser, S.L.; Harron, S.A.; Crack, J.; Fawcett, J.P.; Cowley, E.A. Multiple KCNQ potassium channel subtypes mediate basal anion secretion from the human airway epithelial cell line Calu-3. J. Membr. Biol. 2008, 221, 153–163. [Google Scholar] [CrossRef] [PubMed]
  13. Bianchi, L.; Priori, S.G.; Napolitano, C.; Surewicz, K.A.; Dennis, A.T.; Memmi, M.; Schwartz, P.J.; Brown, A.M. Mechanisms of I(Ks) suppression in LQT1 mutants. Am. J. Physiol. Heart Circ. Physiol. 2000, 279, H3003–H3011. [Google Scholar] [CrossRef] [PubMed] [Green Version]
  14. Dotzler, S.M.; Kim, C.S.J.; Gendron, W.A.C.; Zhou, W.; Ye, D.; Bos, J.M.; Tester, D.J.; Barry, M.A.; Ackerman, M.J. Suppression-Replacement KCNQ1 Gene Therapy for Type 1 Long QT Syndrome. Circulation 2021, 143, 1411–1425. [Google Scholar] [CrossRef]
  15. Tester, D.J.; Will, M.L.; Haglund, C.M.; Ackerman, M.J. Compendium of cardiac channel mutations in 541 consecutive unrelated patients referred for long QT syndrome genetic testing. Heart Rhythm 2005, 2, 507–517. [Google Scholar] [CrossRef]
  16. Tosaki, A. ArrhythmoGenoPharmacoTherapy. Front. Pharmacol. 2020, 11, 616. [Google Scholar] [CrossRef]
  17. Wu, X.; Larsson, H.P. Insights into Cardiac IKs (KCNQ1/KCNE1) Channels Regulation. Int. J. Mol. Sci. 2020, 21, 9440. [Google Scholar] [CrossRef]
  18. Anderson, K.J.; Cormier, R.T.; Scott, P.M. Role of ion channels in gastrointestinal cancer. World J. Gastroenterol. 2019, 25, 5732–5772. [Google Scholar] [CrossRef]
  19. Chen, Y.; Wang, H.; Zhu, S.; Lan, X. miR-483-5p promotes esophageal cancer progression by targeting KCNQ1. Biochem. Biophys. Res. Commun. 2020, 531, 615–621. [Google Scholar] [CrossRef]
  20. Huang, C.; Li, J.; Zhang, X.; Xiong, T.; Ye, J.; Yu, J.; Gui, Y. The miR-140-5p/KLF9/KCNQ1 axis promotes the progression of renal cell carcinoma. FASEB J. 2020, 34, 10623–10639. [Google Scholar] [CrossRef]
  21. Khaladkar, M.; Koscielny, G.; Hasan, S.; Agarwal, P.; Dunham, I.; Rajpal, D.; Sanseau, P. Uncovering novel repositioning opportunities using the Open Targets platform. Drug Discov. Today 2017, 22, 1800–1807. [Google Scholar] [CrossRef] [PubMed]
  22. Carvalho-Silva, D.; Pierleoni, A.; Pignatelli, M.; Ong, C.; Fumis, L.; Karamanis, N.; Carmona, M.; Faulconbridge, A.; Hercules, A.; McAuley, E.; et al. Open Targets Platform: New developments and updates two years on. Nucleic Acids Res. 2019, 47, D1056–D1065. [Google Scholar] [CrossRef] [PubMed]
  23. Kuruma, S.; Egawa, N.; Kurata, M.; Honda, G.; Kamisawa, T.; Ueda, J.; Ishii, H.; Ueno, M.; Nakao, H.; Mori, M.; et al. Case-control study of diabetes-related genetic variants and pancreatic cancer risk in Japan. World J. Gastroenterol. 2014, 20, 17456–17462. [Google Scholar] [CrossRef] [PubMed]
  24. Yoshihara, K.; Shahmoradgoli, M.; Martinez, E.; Vegesna, R.; Kim, H.; Torres-Garcia, W.; Trevino, V.; Shen, H.; Laird, P.W.; Levine, D.A.; et al. Inferring tumour purity and stromal and immune cell admixture from expression data. Nat. Commun. 2013, 4, 2612. [Google Scholar] [CrossRef]
  25. Vasaikar, S.V.; Straub, P.; Wang, J.; Zhang, B. LinkedOmics: Analyzing multi-omics data within and across 32 cancer types. Nucleic Acids Res. 2018, 46, D956–D963. [Google Scholar] [CrossRef] [Green Version]
  26. Adler, A.; Novelli, V.; Amin, A.S.; Abiusi, E.; Care, M.; Nannenberg, E.A.; Feilotter, H.; Amenta, S.; Mazza, D.; Bikker, H.; et al. An International, Multicentered, Evidence-Based Reappraisal of Genes Reported to Cause Congenital Long QT Syndrome. Circulation 2020, 141, 418–428. [Google Scholar] [CrossRef]
  27. Than, B.L.; Goos, J.A.; Sarver, A.L.; O’Sullivan, M.G.; Rod, A.; Starr, T.K.; Fijneman, R.J.; Meijer, G.A.; Zhao, L.; Zhang, Y.; et al. The role of KCNQ1 in mouse and human gastrointestinal cancers. Oncogene 2014, 33, 3861–3868. [Google Scholar] [CrossRef] [Green Version]
  28. den Uil, S.H.; Coupe, V.M.; Linnekamp, J.F.; van den Broek, E.; Goos, J.A.; Delis-van Diemen, P.M.; Belt, E.J.; van Grieken, N.C.; Scott, P.M.; Vermeulen, L.; et al. Loss of KCNQ1 expression in stage II and stage III colon cancer is a strong prognostic factor for disease recurrence. Br. J. Cancer 2016, 115, 1565–1574. [Google Scholar] [CrossRef] [Green Version]
  29. Yang, Z.; Yuan, L.; Yang, L.; Peng, S.; Yang, P.; He, X.; Bao, G. Association study between KCNQ1 and KCNQ1OT1 genetic polymorphisms and gastric cancer susceptibility and survival in a Chinese Han population: A case-control study. Ann. Transl. Med. 2021, 9, 156. [Google Scholar] [CrossRef]
  30. Rapetti-Mauss, R.; Bustos, V.; Thomas, W.; McBryan, J.; Harvey, H.; Lajczak, N.; Madden, S.F.; Pellissier, B.; Borgese, F.; Soriani, O.; et al. Bidirectional KCNQ1:beta-catenin interaction drives colorectal cancer cell differentiation. Proc. Natl. Acad. Sci. USA 2017, 114, 4159–4164. [Google Scholar] [CrossRef] [Green Version]
  31. Jie, L.J.; Li, Y.D.; Zhang, H.Q.; Mao, L.; Xie, H.B.; Zhou, F.G.; Zhou, T.L.; Xie, D.; Lin, J.L.; Li, G.Y.; et al. Mechanisms of gefitinib-induced QT prolongation. Eur. J. Pharmacol. 2021, 910, 174441. [Google Scholar] [CrossRef] [PubMed]
  32. Gao, J.; Aksoy, B.A.; Dogrusoz, U.; Dresdner, G.; Gross, B.; Sumer, S.O.; Sun, Y.; Jacobsen, A.; Sinha, R.; Larsson, E.; et al. Integrative analysis of complex cancer genomics and clinical profiles using the cBioPortal. Sci. Signal. 2013, 6, pl1. [Google Scholar] [CrossRef] [PubMed] [Green Version]
  33. Warde-Farley, D.; Donaldson, S.L.; Comes, O.; Zuberi, K.; Badrawi, R.; Chao, P.; Franz, M.; Grouios, C.; Kazi, F.; Lopes, C.T.; et al. The GeneMANIA prediction server: Biological network integration for gene prioritization and predicting gene function. Nucleic Acids Res. 2010, 38, W214–W220. [Google Scholar] [CrossRef] [PubMed]
  34. Zuberi, K.; Franz, M.; Rodriguez, H.; Montojo, J.; Lopes, C.T.; Bader, G.D.; Morris, Q. GeneMANIA prediction server 2013 update. Nucleic Acids Res. 2013, 41, W115–W122. [Google Scholar] [CrossRef]
  35. Bartha, A.; Gyorffy, B. TNMplot.com: A Web Tool for the Comparison of Gene Expression in Normal, Tumor and Metastatic Tissues. Int. J. Mol. Sci. 2021, 22, 2622. [Google Scholar] [CrossRef]
  36. Chandrashekar, D.S.; Bashel, B.; Balasubramanya, S.A.H.; Creighton, C.J.; Ponce-Rodriguez, I.; Chakravarthi, B.; Varambally, S. UALCAN: A Portal for Facilitating Tumor Subgroup Gene Expression and Survival Analyses. Neoplasia 2017, 19, 649–658. [Google Scholar] [CrossRef]
  37. Chandrashekar, D.S.; Karthikeyan, S.K.; Korla, P.K.; Patel, H.; Shovon, A.R.; Athar, M.; Netto, G.J.; Qin, Z.S.; Kumar, S.; Manne, U.; et al. UALCAN: An update to the integrated cancer data analysis platform. Neoplasia 2022, 25, 18–27. [Google Scholar] [CrossRef]
  38. Thul, P.J.; Akesson, L.; Wiking, M.; Mahdessian, D.; Geladaki, A.; Ait Blal, H.; Alm, T.; Asplund, A.; Bjork, L.; Breckels, L.M.; et al. A subcellular map of the human proteome. Science 2017, 356, eaal3321. [Google Scholar] [CrossRef]
  39. Uhlen, M.; Fagerberg, L.; Hallstrom, B.M.; Lindskog, C.; Oksvold, P.; Mardinoglu, A.; Sivertsson, A.; Kampf, C.; Sjostedt, E.; Asplund, A.; et al. Proteomics. Tissue-based map of the human proteome. Science 2015, 347, 1260419. [Google Scholar] [CrossRef]
  40. Uhlen, M.; Zhang, C.; Lee, S.; Sjostedt, E.; Fagerberg, L.; Bidkhori, G.; Benfeitas, R.; Arif, M.; Liu, Z.; Edfors, F.; et al. A pathology atlas of the human cancer transcriptome. Science 2017, 357, eaan2507. [Google Scholar] [CrossRef] [Green Version]
  41. Li, T.; Fan, J.; Wang, B.; Traugh, N.; Chen, Q.; Liu, J.S.; Li, B.; Liu, X.S. TIMER: A Web Server for Comprehensive Analysis of Tumor-Infiltrating Immune Cells. Cancer Res. 2017, 77, e108–e110. [Google Scholar] [CrossRef] [PubMed] [Green Version]
  42. Jeong, E.; Lee, Y.; Kim, Y.; Lee, J.; Yoon, S. Analysis of Cross-Association between mRNA Expression and RNAi Efficacy for Predictive Target Discovery in Colon Cancers. Cancers 2020, 12, 3091. [Google Scholar] [CrossRef] [PubMed]
  43. Ru, B.; Wong, C.N.; Tong, Y.; Zhong, J.Y.; Zhong, S.S.W.; Wu, W.C.; Chu, K.C.; Wong, C.Y.; Lau, C.Y.; Chen, I.; et al. TISIDB: An integrated repository portal for tumor-immune system interactions. Bioinformatics 2019, 35, 4200–4202. [Google Scholar] [CrossRef] [PubMed]
  44. Barretina, J.; Caponigro, G.; Stransky, N.; Venkatesan, K.; Margolin, A.A.; Kim, S.; Wilson, C.J.; Lehar, J.; Kryukov, G.V.; Sonkin, D.; et al. The Cancer Cell Line Encyclopedia enables predictive modelling of anticancer drug sensitivity. Nature 2012, 483, 603–607. [Google Scholar] [CrossRef] [PubMed]
Figure 1. Altered variants and high expression of kcnq1 predict a favorable outcome in LUAD. Associations between KCNQ1 and human diseases (A) and caners (B). The association scores are estimated by calculating a harmonic sum using the weighted vector of data source association scores for all data sources, summarizing all the aggregated evidence for an association. Kaplan–Meier analysis of the overall survival (C), disease-specific survival (D), and progression-free survival (E) in LUAD patients based on altered/unaltered KCNQ1 variant. Kaplan–Meier analysis of the overall survival in LUAD patients based on high/low KCNQ1 expression (F). Pearson correlation coefficient of the expression of KCNQ1 with Ki67 in LUAD tumor tissues (n = 1865) (G). HR, hazard ratio. Representative image of A549 lung cancer cells left untreated or undergoing FAM-labeled siRNAs (si-KCNQ1 and si-control) photographed under a fluorescence microscope 16 h after transfection (H). Representative image at 0 h and 24 h of wound healing assay (I). Quantification histogram (mean ± SD) of three independent experiments representing the area of the scratched ditch determined by the migrated cells (J). *** p < 0.001 between indicated groups.
Ijms 23 02279 g001
Figure 2. Mutation landscapes of KCNQ1. The mutation spectrum, profiled for mutations, mutation counts, tumor mutational burden (TMB), and genetic alterations of KCNQ1 across all cancer patients (n = 10,395) (A). Schematic illustration number and the distribution of the mutations spanning the 549 amino-acid KCNQ1 sequence (B). The alteration frequency of KCNQ1 in various cancer types (C). BRCA, Breast invasive carcinoma; COAD, Colon adenocarcinoma; GBM, Glioblastoma multiforme; HNSC, Head and neck squamous cell carcinoma; KIRC, Kidney renal clear cell carcinoma; LUAD, Lung adenocarcinoma; OV, Ovarian serous cystadenocarcinoma; UCEC, Uterine corpus endometrial carcinoma.
Ijms 23 02279 g002
Figure 3. Differential expression profile and diagnostic efficacy of KCNQ1. The gene expression levels of KCNQ1 in normal tissue and LUAD tumors retrieved from the GEO database (A) and TCGA datasets (B). Immunohistochemistry staining for the detection of KCNQ1 protein expression levels in normal and LUAD tissues (C). Validation test on the KCNQ1 expression in normal tissue and LUAD tumors using GSE11502 datasets (D). Receiver operating characteristic (ROC) curves for normal and LUAD cohorts based on KCNQ1 levels from the GSE11502 dataset (E). *** p < 0.001 between indicated groups.
Ijms 23 02279 g003
Figure 4. Prognostic value of KCNQ1 in LUAD patients. Kaplan–Meier survival analysis representing the probability of overall survival based on low/high expression of KCNQ1 in the scenario of stage 1 (A), stage 2 (B), stage 3 (C), stage 4 (D), AJCC stage T1 (E), AJCC stage T2 (F), AJCC stage N0 (G), and AJCC stage N1 (H). A forest plot summarizing the hazard ratio (HR), the 95% confidence interval (95% CI), and the logrank p-value of LUAD KCNQ1 expression in the context of various immune cell contents (I), of high/low tumor mutation burden (TMB), or of high TMB combined with decreased MSC (J). Kaplan–Meier analysis based on low/high KCNQ1 expression in the presence of high TMB and decreased MSC (K).
Ijms 23 02279 g004
Figure 5. KCNQ1 is closely related to immune infiltration. ESTIMATE analysis of stromal score (A), immune score (B), and ESTIMATE score (C). * p < 0.05, ** p < 0.01 between indicated groups. TIMER analysis of Spearman correlation between the KCNQ1 expression and the infiltration of CD8+ T cells (D), CD4+ T cells (E), B cells (F), cancer associated fibroblasts (CAF) (G), (Mϕ) M1 macrophages (H), (Mϕ) M2 macrophages (I), natural killer (NK) cells (J). Kaplan–Meier analysis based on enriched/decreased content of CD8+ T cells (K), B cells (L), and M2 macrophages (M) in the LUAD cohort.
Ijms 23 02279 g005
Figure 6. KCNQ1 is closely related to the expression levels of immunomodulators. Correlation analysis between the expression of KCNQ1 and 24 immunoinhibitory genes across human cancers (A). Spearman’s correlation test of KCNQ1 with PD-L1/CD274 (B), PD-L2/PDCD1LG2 (C), LAG3 (D), and CTLA4 (E) in LUAD samples (n = 517). Correlation analysis between the expression of KCNQ1 and methylation levels of 24 immunoinhibitory genes across human cancers (F). Spearman’s correlation test of KCNQ1 with methylation levels of PD-L1/CD274 (G), PD-L2/PDCD1LG2 (H), LAG3 (I), and CTLA4 (J) in LUAD samples (n = 456).
Ijms 23 02279 g006
Figure 7. Co-expression genes of KCNQ1 and analysis of functional enrichment. Genes significantly correlated with KCNQ1 identified by Pearson correlation analysis in the LUAD cohort (A). Heatmaps illustrating the top 25 genes positively (B) and negatively correlated with KCNQ1 in LUAD cohort (C). GO process term (D) and KEGG pathways (E) significantly enriched in KCNQ1-coexpressed genes in the LUAD cohort. Enrichment plots of the cell cycle functional gene set. NES, normalized enrichment score; FDR, false discovery rate (F). Heatmap showing the rank metric score of core enrichment genes for the gene class of the cell cycle (G). The genes then underwent Kaplan–Meier analysis to confirm the clinical relevance.
Ijms 23 02279 g007
Figure 8. Validation of the clinical relevance of KCNQ1-coexpressed genes and the PPI. Kaplan–Meier survival analysis representing the probability of overall survival based on low/high expression of DBF4 zinc finger (DBF4) (A), cyclin A2 (CCNA2) (B), cyclin B1 (CCNB1) (C), minichromosome maintenance complex component 6 (MCM6) (D), cell division cycle 45 (CDC45) (E), checkpoint kinase 1 (CHEK1) (F), and cell division cycle 6 (CDC6) (G). PPI of KCNQ1 and the seven coexpression genes demonstrating that enriched functions mainly participate in DNA replication, cell cycle G1/S phase transition, cell cycle G2/M phase transition, and double-strand break repair (H).
Ijms 23 02279 g008
Figure 9. Generalization value of KCNQ1 in pan-cancer diagnosis and prognosis. Expression profiles of KCNQ1 by TNM plotter analysis (A). Kaplan–Meier survival analysis representing the probability of overall survival based on low/high KCNQ1 expression in kidney renal clear cell carcinoma (KIRC) (B), pheochromocytoma and paraganglioma (PCPG) (C), and colorectal adenocarcinoma (COAD) (D). ** p < 0.01, *** p < 0.001 tumor vs. normal.
Ijms 23 02279 g009
Figure 10. Lapatinib as a therapeutic option in the context of low KCNQ1. A Q-omics analysis was used to analyze cross-association scores regarding predictivity and descriptivity for the identification of potent drugs acting on LUAD cells based on the expression of KCNQ1. Predictivity denotes the fold change of single guide KCNQ1 (sgKCNQ1) efficacy (sgRNA efficiency of KCNQ1 knockout) between cells of high and low response to the target drug. Descriptivity denotes the fold change of target drug response between samples of high and low sgKCNQ1 efficiency. Red and blue dots represent hits with a predictivity p-value of < 0.05 and a descriptivity p-value of < 0.05 (A). Boxplots of −log(half maximal inhibitory concentration (IC50)) M of lapatinib (B), erlotinib (C), ABT737 (D), RO-3306 (E), foretinib (F), AMG-319 (G), and pyrimethamine (H). The relationship between KCNQ1 expression levels and lapatinib sensitivity in 100 lung cancer cell lines (I) and 464 pan-cancer cell lines (J). The Pearson’s correlation of KCNQ1 expression levels were expressed as the log2 of transcripts per million (TPM) and lapatinib sensitivity was expressed as the log of fold change (μM) to the base of 2.
Ijms 23 02279 g010
Figure 11. Proposed model illustrating the significance of KCNQ1 in diagnosis, prognosis, immunity of the tumor microenvironment, tumor cell cycle, and precision treatment with gemcitabine in LUAD, aside from its recognized role in arrythmia risk [26].
Ijms 23 02279 g011
Publisher’s Note: MDPI stays neutral with regard to jurisdictional claims in published maps and institutional affiliations.

