Article

Functional Characterization of MdTAC1a Gene Related to Branch Angle in Apple (Malus x domestica Borkh.)

Department of Pomology, College of Horticulture, China Agricultural University, Yuanmingyuan West Road No. 2, Haidian District, Beijing 100193, China
*
Author to whom correspondence should be addressed.
Int. J. Mol. Sci. 2022, 23(3), 1870; https://doi.org/10.3390/ijms23031870
Submission received: 7 January 2022 / Revised: 3 February 2022 / Accepted: 3 February 2022 / Published: 7 February 2022
(This article belongs to the Collection Genetics and Molecular Breeding in Plants)

Abstract

:
The Tiller Angle Control 1 (TAC1) gene belongs to the IGT family, which mainly controls plant branch angle, thereby affecting plant form. Two members of MdTAC1 are identified in apple; the regulation of apple branch angle by MdTAC1 is still unclear. In this study, a subcellular localization analysis detected MdTAC1a in the nucleus and cell membrane, but MdTAC1b was detected in the cell membrane. Transgenic tobacco by overexpression of MdTAC1a or MdTAC1b showed enlarged leaf angles, the upregulation of several genes, such as GA 2-oxidase (GA2ox), and a sensitive response to light and gravity. According to a qRT-PCR analysis, MdTAC1a and MdTAC1b were strongly expressed in shoot tips and vegetative buds of weeping cultivars but were weakly expressed in columnar cultivars. In the MdTAC1a promoter, there were losses of 2 bp in spur cultivars and 6 bp in weeping cultivar compared with standard and columnar cultivars. An InDel marker specific to the MdTAC1a promoter was developed to distinguish apple cultivars and F1 progeny. We identified a protein, MdSRC2, that interacts with MdTAC1a, whose encoding gene which was highly expressed in trees with large branch angles. Our results indicate that differences in the MdTAC1a promoter are major contributors to branch-angle variation in apple, and the MdTAC1a interacts with MdSRC2 to affect this trait.

1. Introduction

Apple (Malus x domestica Borkh.) is widely cultivated and ranks third with respect to global fruit production according to FAO statistics in 2019 (https://www.fao.org (accessed on 5 November 2020)). On the basis of fruiting type and branch architecture, apple trees are classified into four ideotypes—columnar, standard, spur, and weeping, with different branch angles [1]. Fruit tree architecture determines the compactness of the canopy structure, the amount of shadowing between branches, and the extent of ventilation and light transmission to the lower part of the tree. Branching can affect tree shape, in turn influencing fruit yield and quality [2,3,4,5]. In apple production, branch angles are manually widened to promote early flowering and fruiting. Investigation of branch angle-related genes should therefore contribute to apple tree breeding and genetic improvement [1].
Genes determined to shape plant branch angle include Tiller Angle Control 1 (TAC1), LAZY1 (LA1), Loose Plant Architecture 1 (LPA1), and Prostrate Growth 1 (PROG1) [6]. Branch angle is also affected by growth hormones, especially auxins (e.g., indole acetic acid [IAA]) [6,7], cytokinins [8,9], and strigolactones [10]. The polar transport of auxin inhibits the growth of lateral buds but causes apical buds to grow vigorously. Cytokinins are produced in roots, and their upward transportation promotes lateral bud differentiation and growth, which work in synergy with auxins, thereby affecting branch development. Strigolactones are a recently discovered class of hormones commonly found in plants. Strigolactones can interact with auxins and cytokinins to reduce the extent of plant branching and play an important role in branch development [10]. Many environmental signals, including light, gravity, and thigmotropism, can influence plant architecture as well [11,12]. TAC1 is a gene first isolated in rice by map-based cloning and is a positive regulator of the tillering angle in rice [13]. Previous research has revealed that TAC1 originated from LA1, which negatively regulates the tillering angle in plants. TAC1 and LA1 belong to two branches of the IGT gene family, which has been found in all plant genomes and contains a conserved EAR (LxLxL) motif at the C terminus [13].
TAC1 plays an important role in regulating branch angle in many plant species [13,14,15]. For example, OsTAC1 participates in the regulation of rice (Oryza sativa) tiller angle and influences the endogenous auxin content [16]. In maize (Zea mays), the expression level of ZmTAC1 is positively correlated with leaf angle, and this gene plays an important regulatory role in leaf development [15]. At each stage of wheat (Triticum aestivum) tillering, the expression of TaTAC1 is positively correlated with tiller angle, and this gene may positively regulate tiller angle by participating in the regulation of auxin polar transport [17]. PpeTAC1 promotes the horizontal growth of branches in peach (Prunus persica) trees [14,18], and PzTAC contributes to the regulation of branch angle in poplar (Populus × zhaiguanheibaiyang) [19].
In a previous investigation, we separately cloned the TAC1a/b genes of apple (GenBank accession No. MG837476/MG837477). There was no difference in the cDNA sequences, but variation in the promoters of two genes were detected among the analyzed ideotypes [20]. This preliminary work involved few apple cultivars, and a correlation with branch angle could not be determined. In the present study, we performed subcellular localization experiments and used full-length MdTAC1a/b cDNA sequences to construct overexpression vectors of MdTAC1a/b driven by a strong promoter, CaMV35S, in genetically transformed tobacco (Nicotiana benthamiana). This approach allowed us to observe changes in the leaf angle of the transgenic lines and verify the gene functions of MdTAC1a/b. We then developed new molecular marker based on differences in the 2000-bp long MdTAC1a promoters among apple cultivars and a hybrid F1 population. Finally, we used yeast two-hybrid technology to study the MdTAC1a-interacting protein. Our findings, including the function of MdTAC1a/b genes, lay a foundation for analysis of the molecular mechanism of MdTAC1a regulation of branch angle in apple, thereby contributing to apple genetic improvement.

2. Results

2.1. Subcellular Localization Analysis of MdTAC1a and MdTAC1b

To better understand the molecular function of the MdTAC1, we constructed MdTAC1a-GFP and MdTAC1b-GFP fusion gene-expression vectors to examine their subcellular locations. The MdTAC1a-GFP and MdTAC1b-GFP plasmids were transferred into Agrobacterium to infect tobacco leaves. The MdTAC1a was detected in the cell nucleus and cell membrane, whereas the MdTAC1b was localized to the cell membrane (Figure 1).

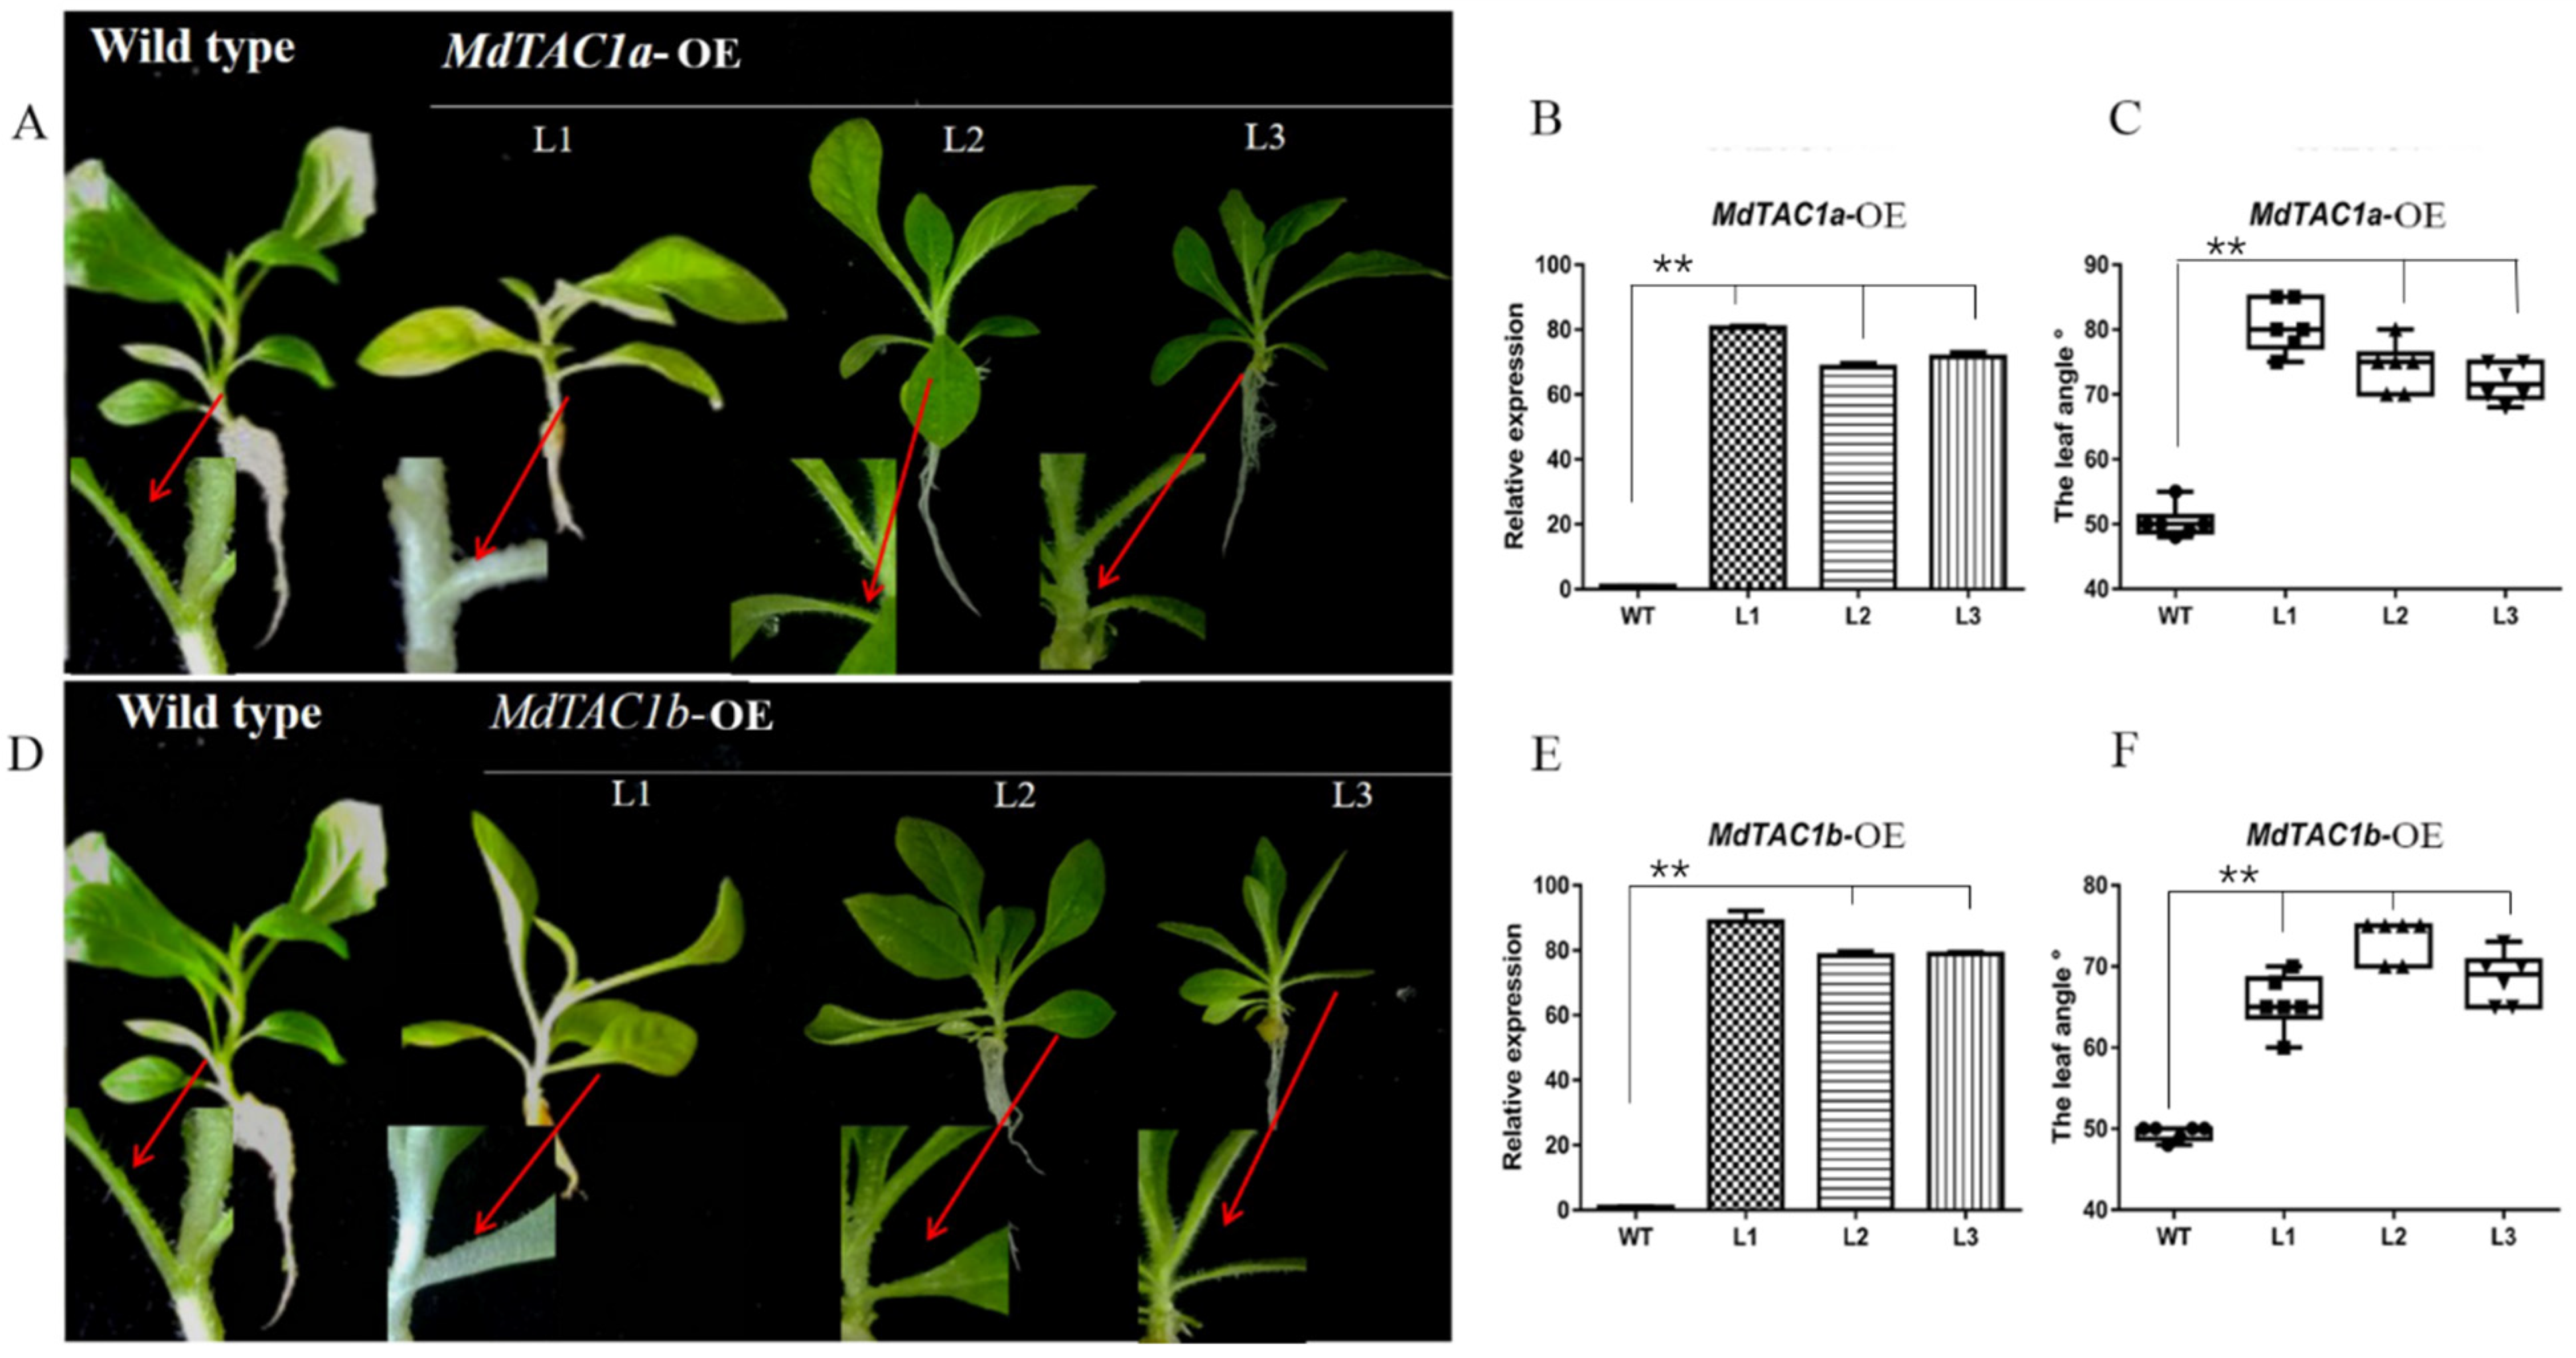
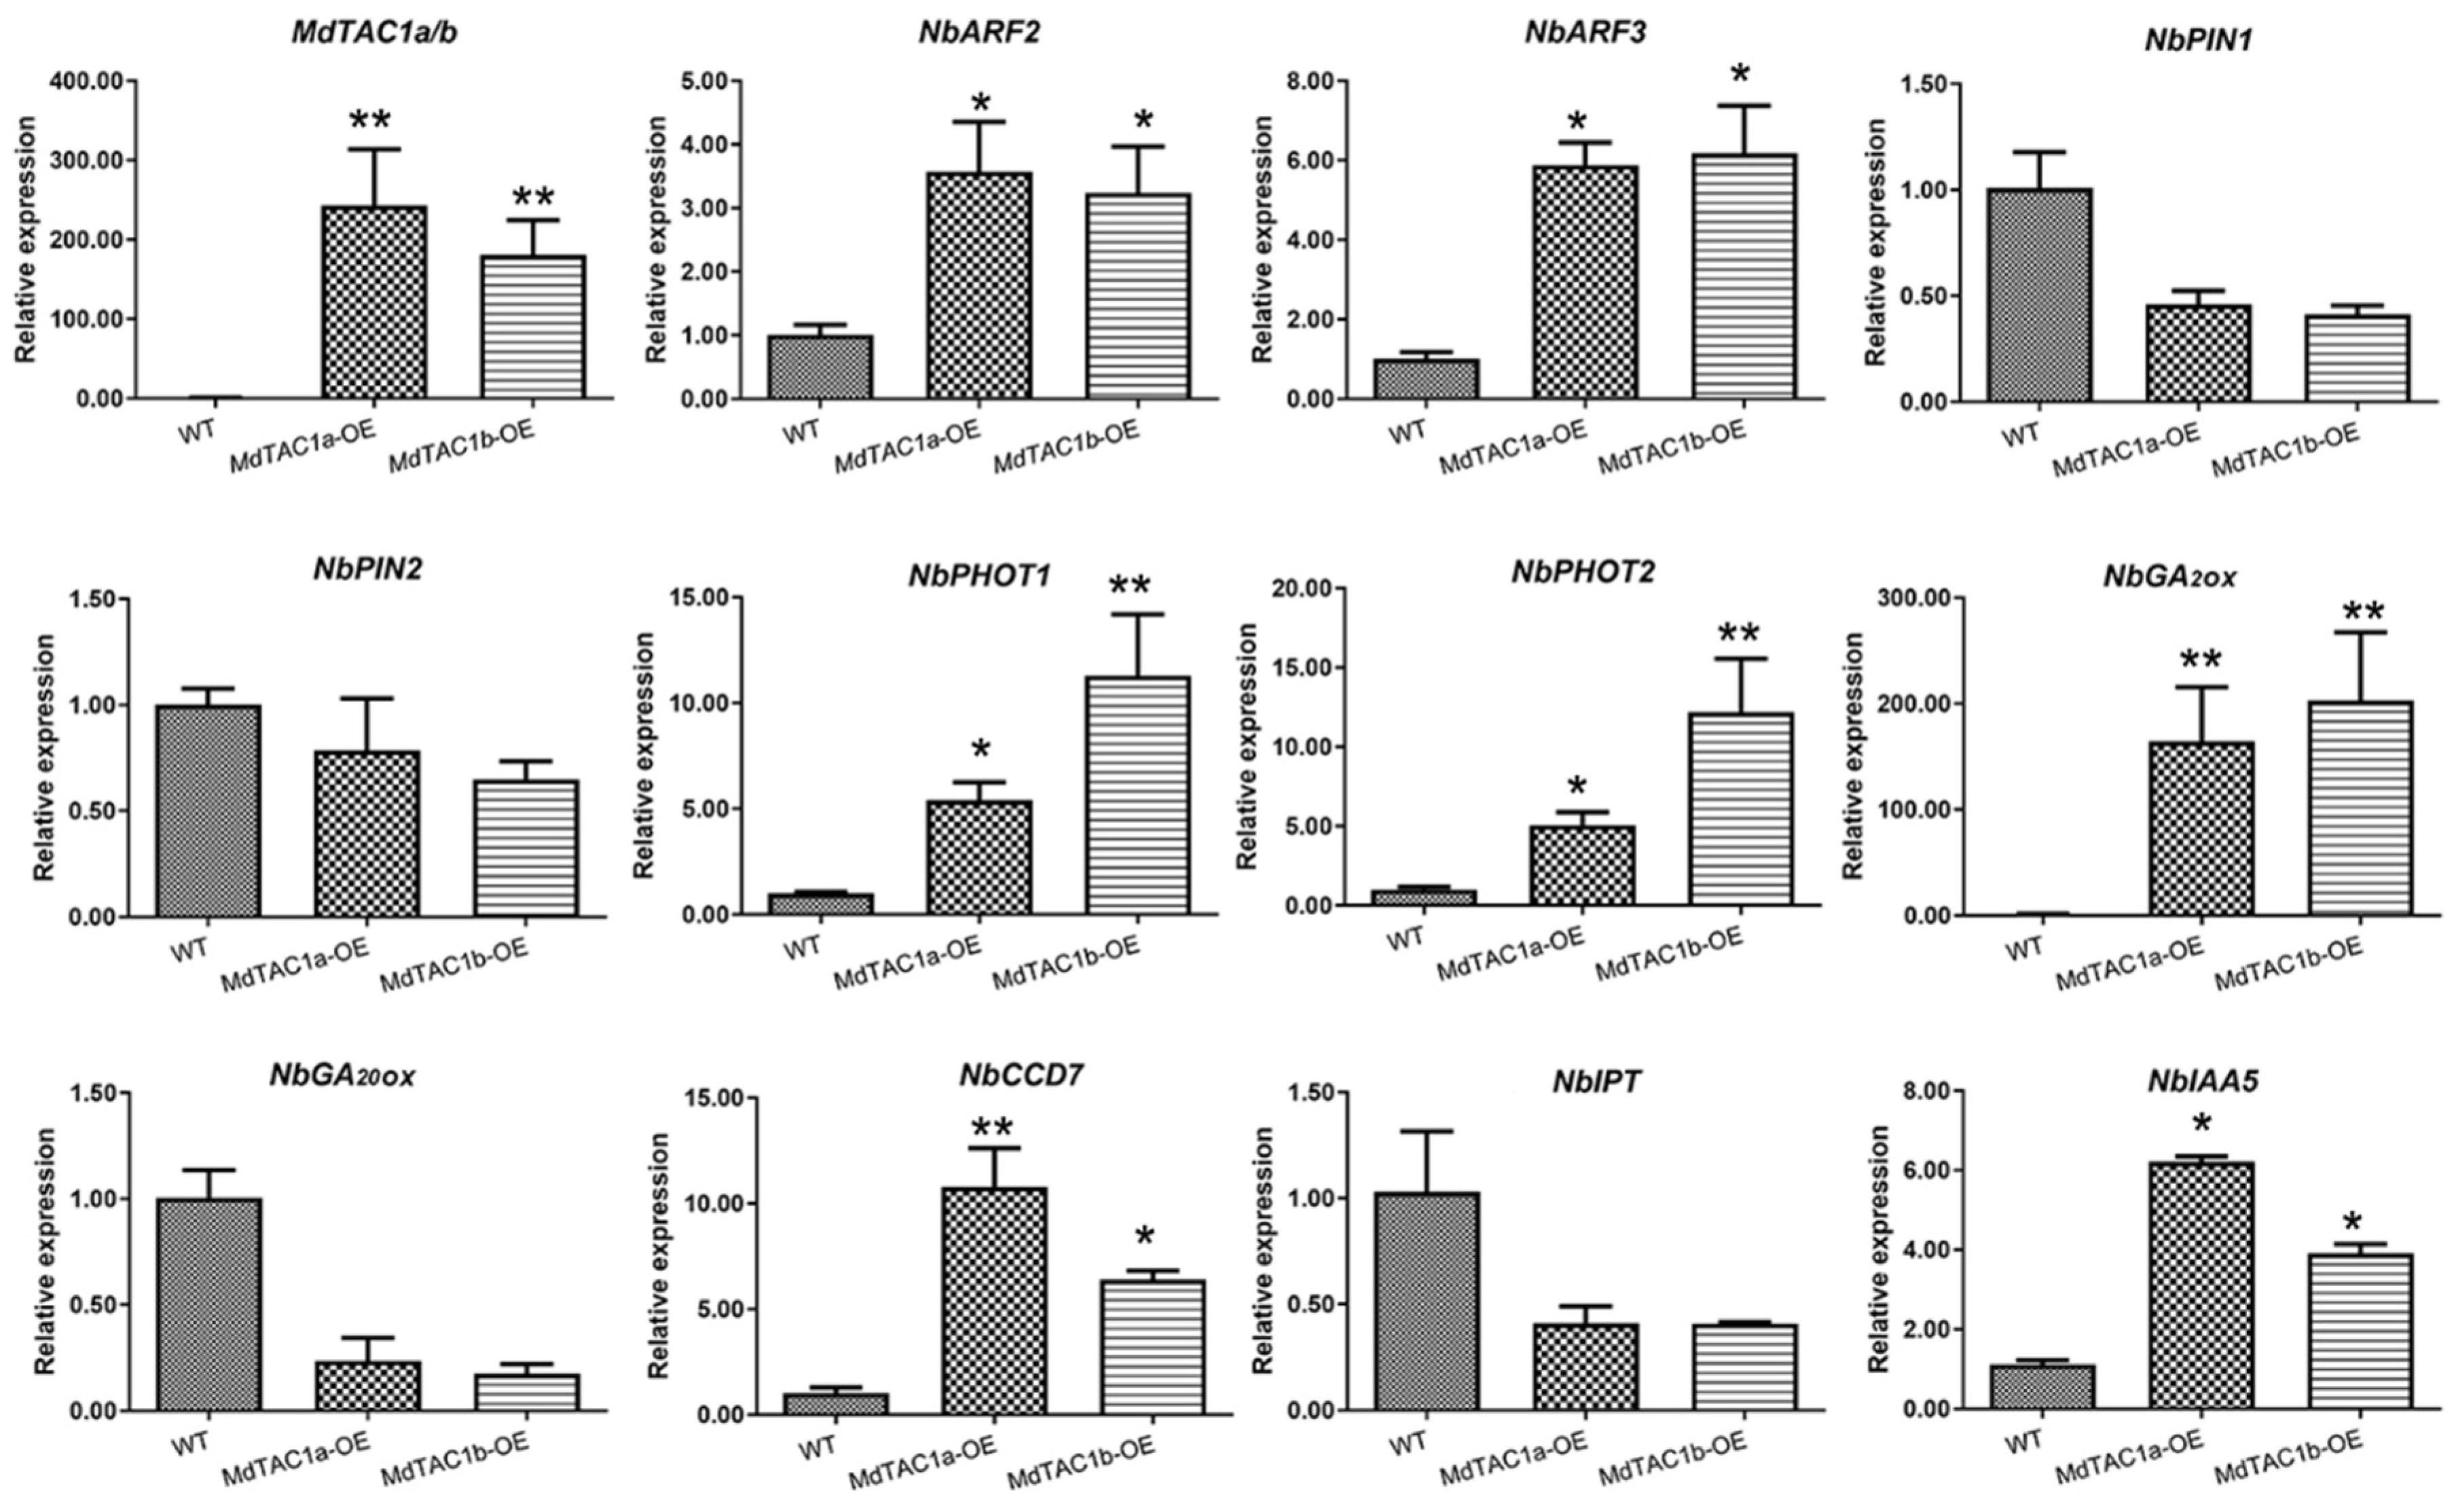
2.2. Phenotypic and Key Gene Analysis of Transgenic MdTAC1a/b in Tobacco

To investigate the physiological function of MdTAC1, we separately transferred MdTAC1a/b into tobacco. In a real-time PCR assay, the expressions of MdTAC1a/b were detected in MdTAC1a/b-overexpressing (OE) plants but not in wild-type (WT) plants (Figure 2). The order of relative expression of three selected MdTAC1a-OE transgenic tobacco plants was L1 > L2 > L3, and the relative expression level of MdTAC1a in L1 was almost 80 times that of the wild type (Figure 2). The relative expression levels of three selected MdTAC1b-OE transgenic tobaccos followed the order L1 > L3 > L2 (Figure 2). In addition, the leaf angle of MdTAC1a/b-OE transgenic tobacco plants was significantly larger than that of the wild type (Figure 2 and Figure S1).
To compare differences in hormone-expression levels between genetically modified and wild-type tobaccos, we used qRT-PCR to analyze ten genes involved in the synthesis and signal transduction of four types of plant hormones and two genes in the light-responsive pathway after flowering. The relative expression levels of ten of these genes were found to be significantly different between wild-type and transgenic tobaccos (Figure 3). In particular, genes encoding auxin response factors 2 and 3 (ARF2 and ARF3), phototropins PHOT1 and PHOT2, GA2 oxidase (GA2ox), carotenoid cleavage dioxygenase 7 (CCD7), and IAA5 were upregulated in genetically modified tobacco compared with the wild type, whereas pin-formed 1 (PIN1), pin-formed 2 (PIN2), GA20 oxidase (GA20ox), and isopentenyl transferase (IPT) genes were upregulated in wild-type plants relative to transgenic tobacco. After wild-type and transgenic tobacco plants began to bend in the horizontal treatment, we selected the bending point and measured the relative expression of IAA5. We found that IAA5 expression was significantly higher in transgenic tobaccos than in the wild type.

2.3. Phototropism and Gravitropism of MdTAC1-OE Plants

To investigate the role of MdTAC1a and MdTAC1b in shoot gravitropism and light response, we subjected WT and transgenic plants to 90° inverted gravity processing under light and dark conditions to observe the degree of stem bending. WT and OE plants under light exposure were arranged horizontally for 0, 1, 5, 12, and 24 h for image collection (Figure 4A), and the angle of the stem was measured from the image. The WT plants began to bend upward after 1 h, with significant upward bending observed from 1 to 3 h. After 1 h of treatment, a significant difference in bending angle was observed between OE and WT plants (Figure 4C). In the OE plants, no bending was observed in the first 6 h. After 6 h, the OE plants began to bend gradually, and the rate of bending of MdTAC1a-OE plants was greater than that of MdTAC1b-OE (Figure 4C).
After 0, 1, 8, 12, 24, and 48 h of horizontal placement in darkness, plants were imaged, and the stem angle was measured. The time required for WT and OE plants to bend upward in the dark was later than that of corresponding plants exposed to light, indicating the transgenic plant response was more sensitive to light and gravity (Figure 4B). During the first 3 h in the dark, no stem bending was observed in WT or OE plants. WT plants began to bend slightly upward after 3 h, whereas MdTAC1a-OE and MdTAC1b-OE plants began bending slightly upward after 8 h (Figure 4B). The bending rate of WT plants was significantly higher than that of the slowest plants, namely, MdTAC1b-OE plants. In addition, the bending rate of MdTAC1a-OE was higher than MdTAC1b-OE plants under light, whereas the bending rate of MdTAC1b-OE plants was significantly higher than that of MdTAC1a-OE in the dark (Figure 4D). In addition, the stems were sampled at 0, 1, 5, 12, and 24 h lightening condition and 0, 1, 8, 12, 24, and 48 h dark condition for expression analysis, and the qRT-PCR results showed that the expression levels of MdTAC1a and MdTAC1b increased significantly under lightening and no significant changes were observed under darkness (Figure 4F). We also measured the expression of IAA5 in the stem bends of WT plants and OE plants at 24 h in the light and 48 h in the dark, and it was clear that the expression of NbIAA5 was higher than that in WT under light or dark treatment (Figure 4E). We hypothesize that light-response and cis-acting modulator-of-photoreactivity elements in MdTAC1a and MdTAC1b play a significant role in stem bending in light and gravity (Figure S2).

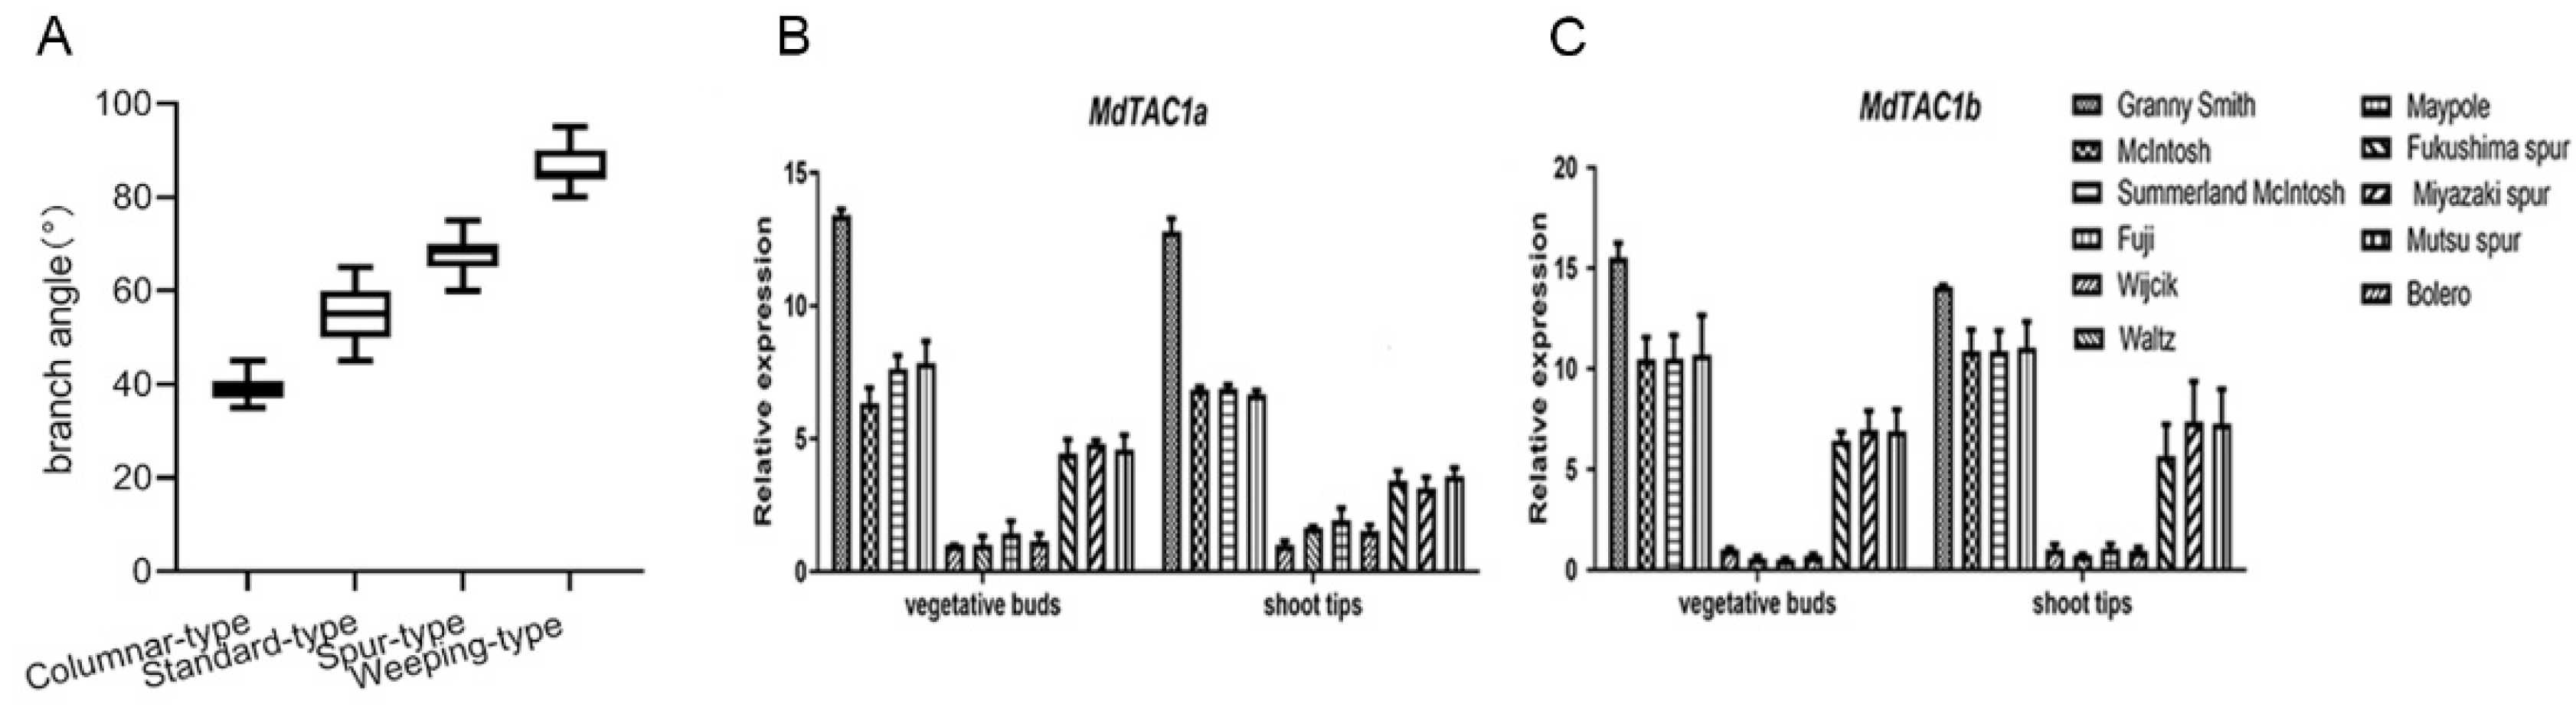
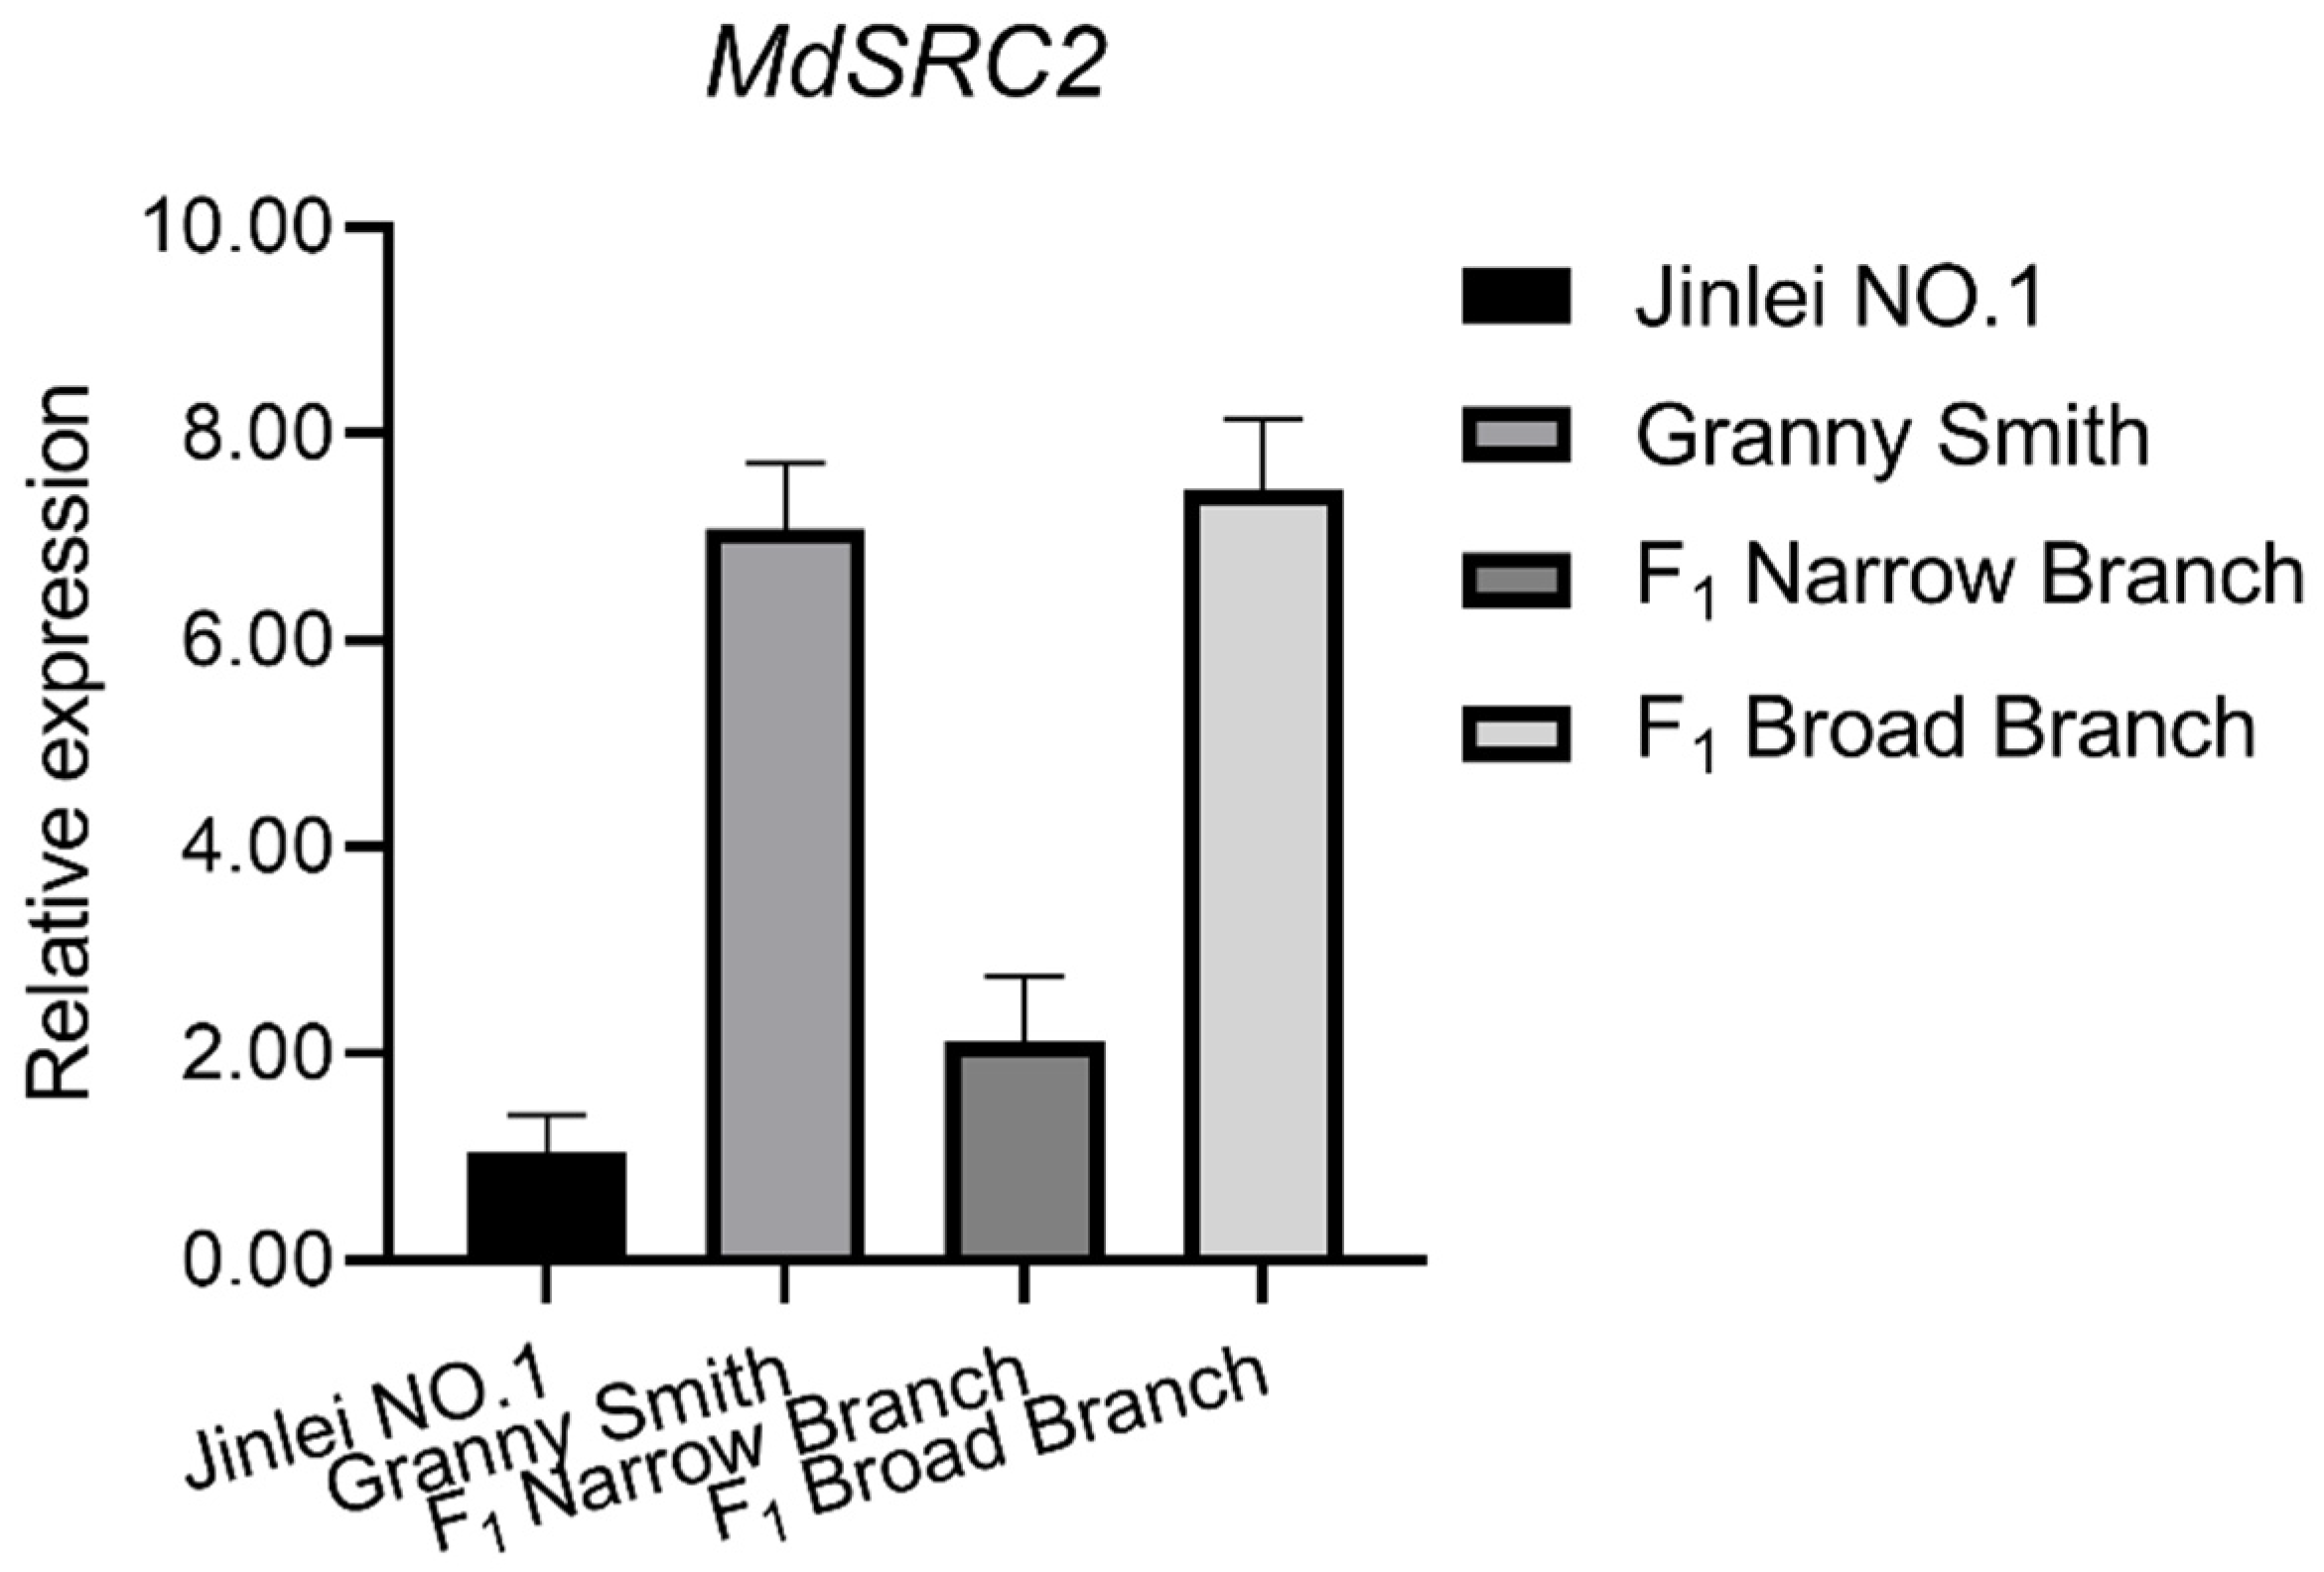
2.4. qRT-PCR Analysis of MdTAC1a/b Expressions in Different Apple Cultivars

Eleven apple cultivars were analyzed for the expressions of MdTAC1a and MdTAC1b. The branch angle size showed an increasing trend in the order of columnar, standard, spur, and weeping apple cultivars (Supplementary Table S1, Figure 5A). The qRT-PCR revealed that the expression levels of MdTAC1a and MdTAC1b were similar in vegetative buds and shoot tips. The highest expression levels were detected in weeping-type cultivars, followed by standard cultivars, whereas the lowest levels were observed in columnar ones. In addition, the relative expression level of MdTAC1b in vegetative buds and shoot tips was higher than that of MdTAC1a in these tissues (Figure 5B,C).

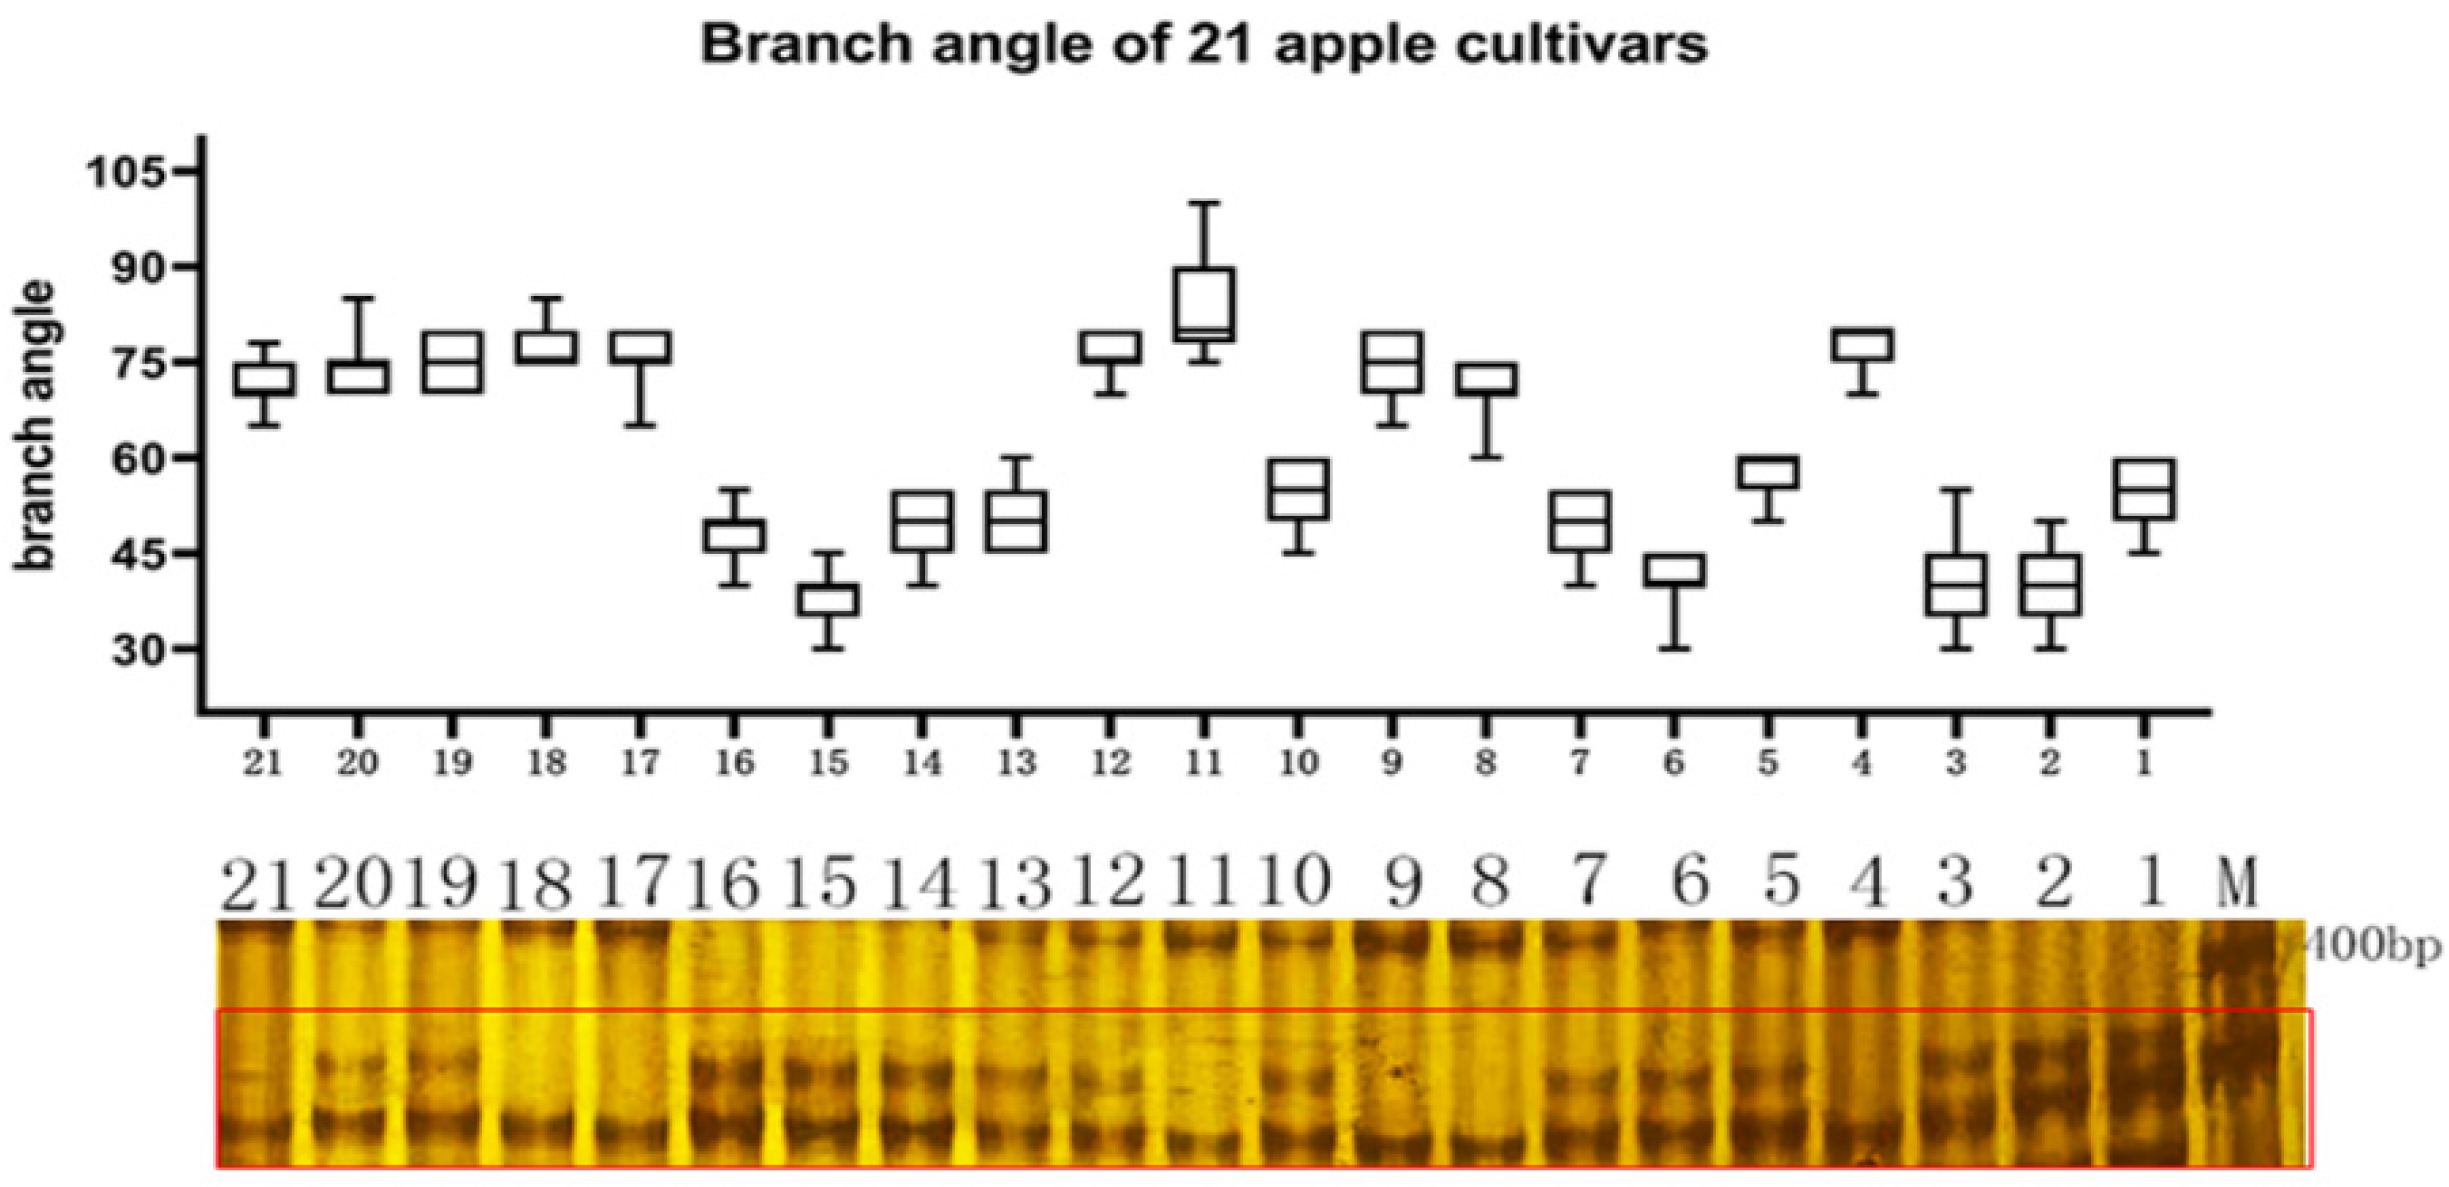
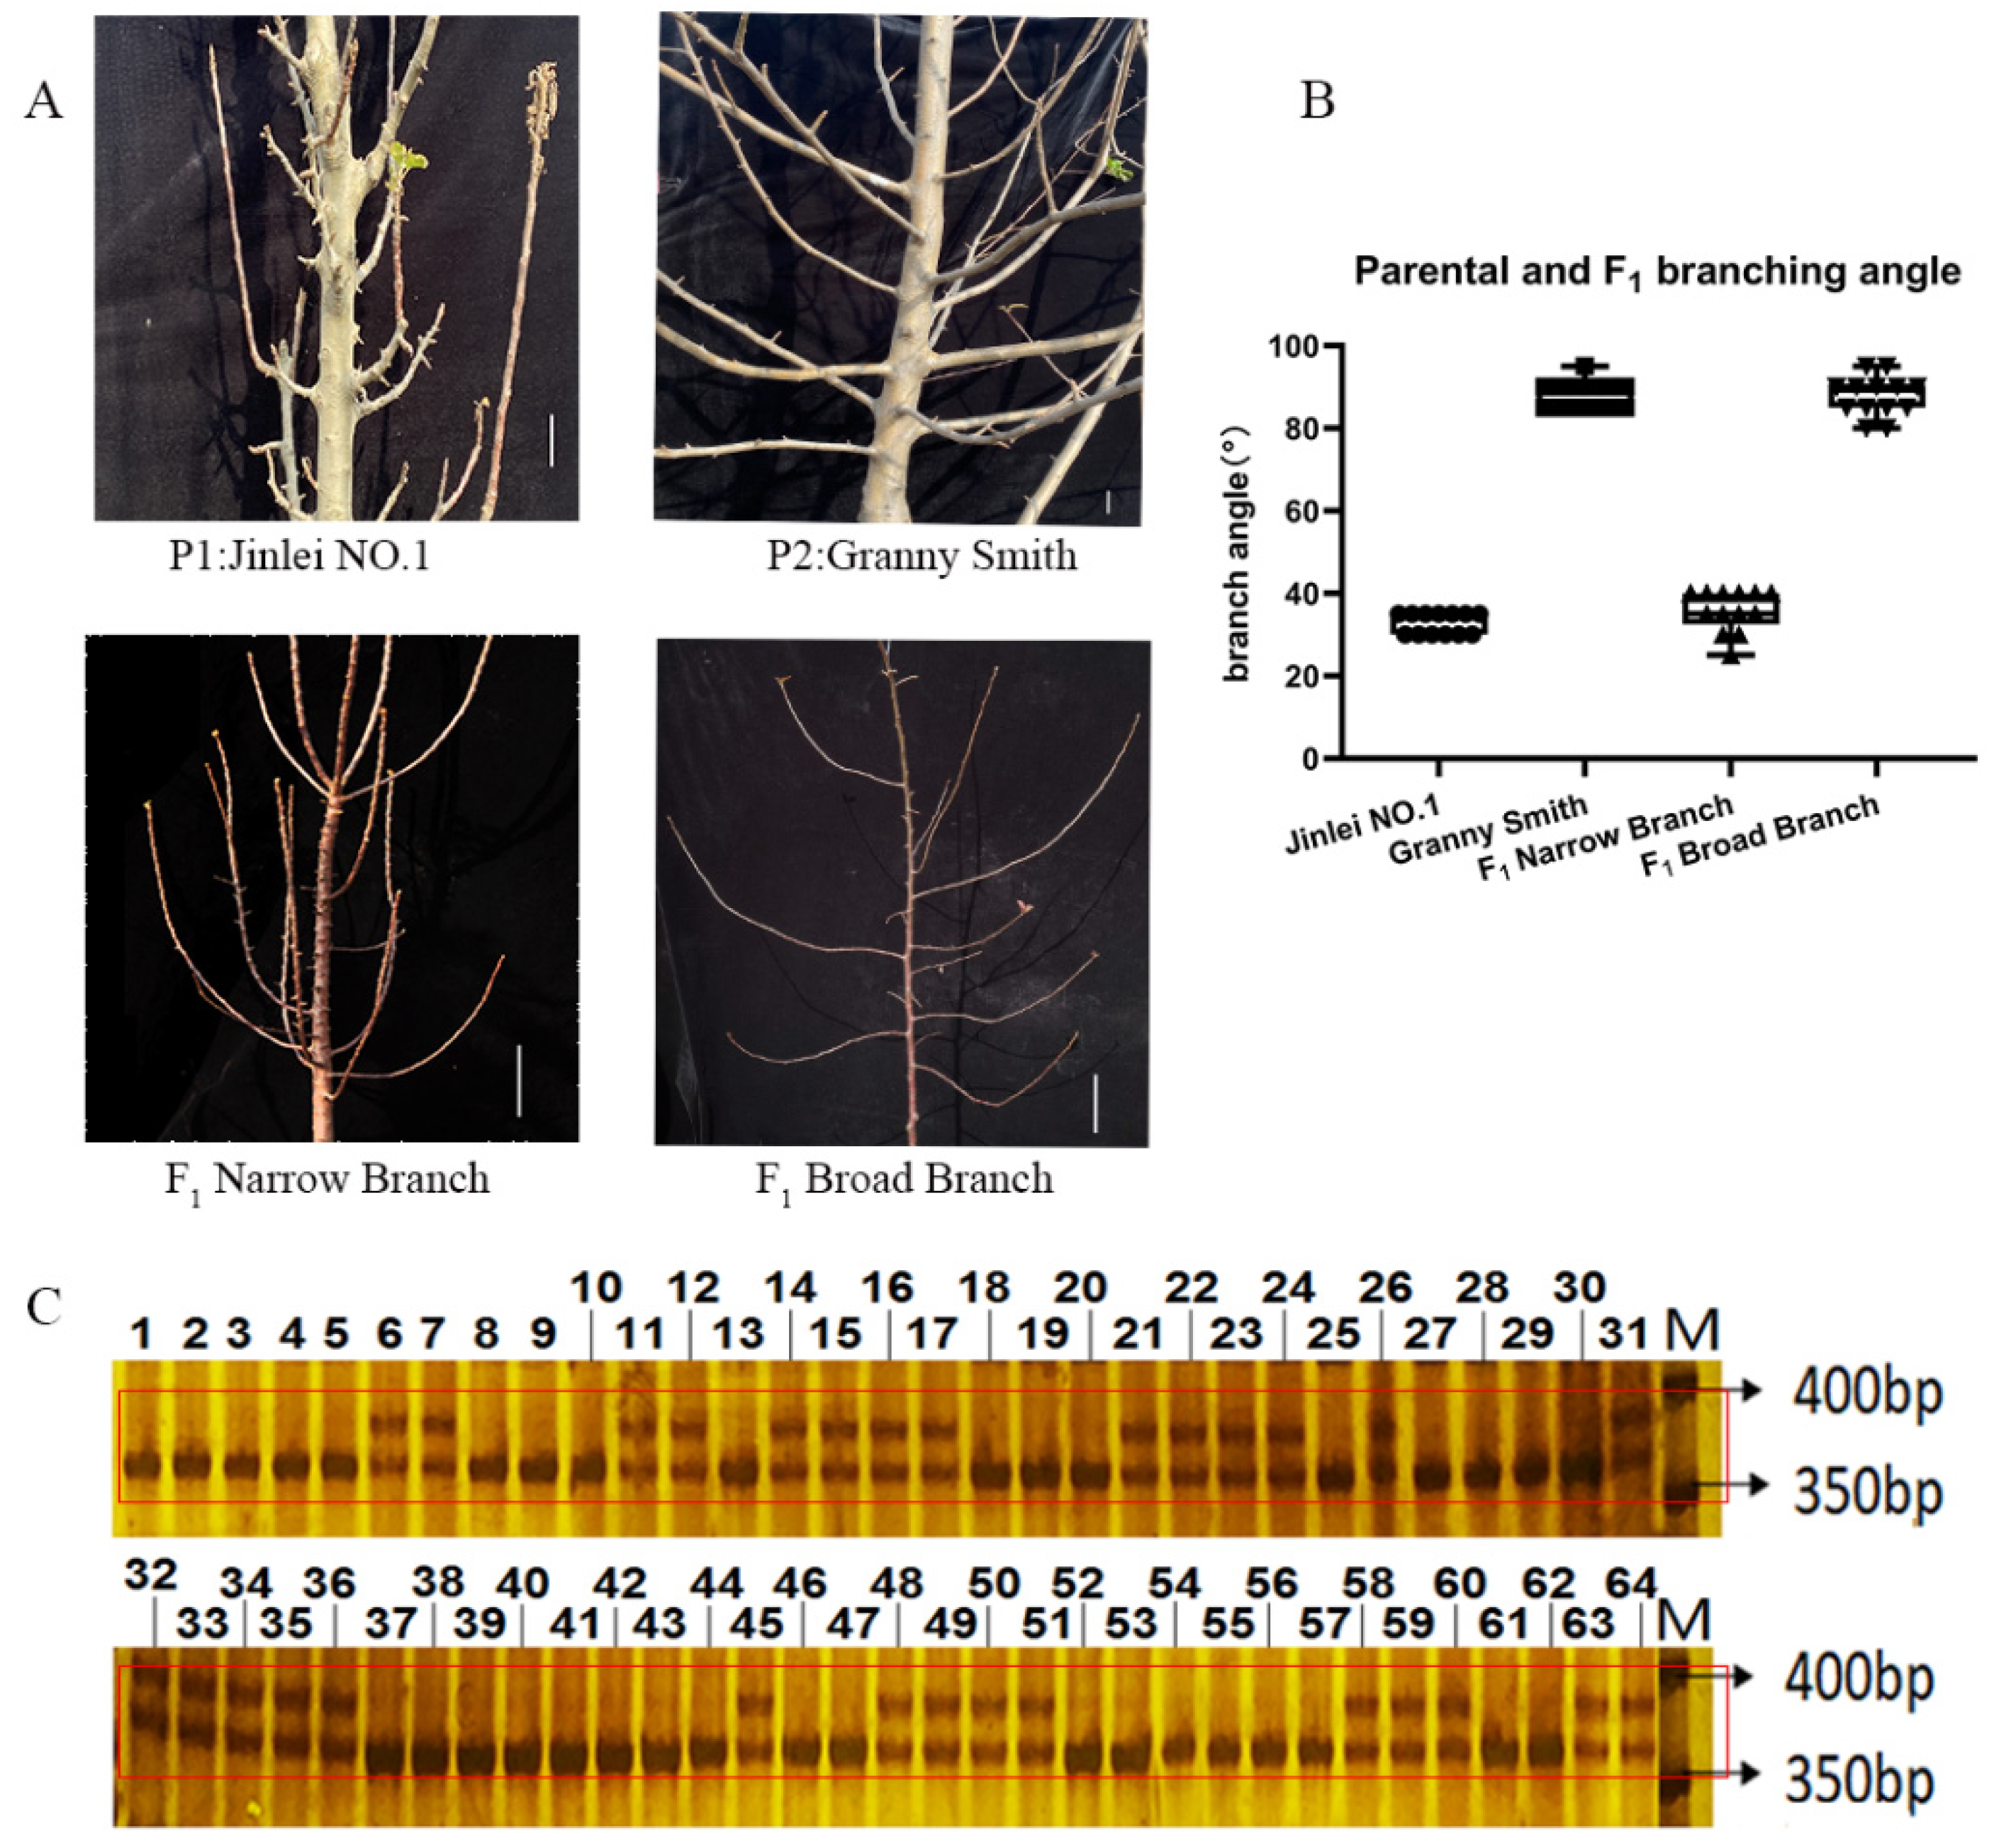
2.5. Development of an InDel Marker and Cosegregation in a Population

To explore the variation in the promoters of MdTAC1a/b genes in the 11 apple tree cultivars, we sequenced the coding region and 2.0-kb region upstream of ATG (position 0) of all 11 cultivars. InDel in the MdTAC1a promoter sequence were detected among the four types of cultivars (Figure 6A). A deletion of six nucleotides, from −270 to −275 (GAGAGA), was detected in ‘Granny Smith’, a weeping-type cultivar, while a two-nucleotide deletion (GA) at positions −271 to −270 was identified in the three spur-type cultivars, which belong to the GAG motif. SNPs were observed in MdTAC1b in the four cultivar types (Figure 6B). For instance, the deletion of a single C at position −158 was observed in columnar-type apple cultivars. As another example, the A nucleotide present at positions −848, −804, and −552 in standard-type cultivars was a G in all other cultivars. The A at position −724 was replaced by a G in columnar-type cultivars, and the G at position −599 was replaced by an A in apple trees with weeping branches. Columnar- and spur-type cultivars possessed a T and a C at positions −566 and −294, respectively, whereas a C and a G were present at these corresponding positions in all other cultivars. The nucleotide present at position −47 was a C in standard-type cultivars and a T in the remaining cultivars.
As demonstrated by these examples, MdTAC1a/b obviously differed among the apple tree ideotypes. We therefore designed a molecular-marker pair to generate a 370-bp long amplification product based on the InDel in the MdTAC1a promoter (Supplementary Table S3). To test the applicability of this molecular marker to other apple trees, we selected 21 cultivars with different branch angles from the resource nursery. The width of the base-branch angle ranged from 50 cm to 120 cm in the cultivated cultivars and F1 generation. Among the 21 cultivars, the branch angle of 4 was ≤45°, that of 7 was 45–65°, and 10 cultivars had a branch angle ≥ 65° (Figure 7). Among the 21 cultivars, PCR amplification yielded the complete 370 bp in 14 cultivars, whereas a 6 bp deletion was found in 7 cultivars (Figure 7). This genotypic ratio was different from the phenotypic statistics, with the phenotype and genotype coinciding in only 85.71% of cultivars.
In addition, 62 F1 hybrid offsprings were selected from a cross between the two cultivars, ‘Jinlei No. 1’ and ‘Granny Smith’ to verify the InDel Maker (Figure 8A). Trait segregation in the F1 population was observed: 30 plants had a branch angle ≤ 45°, whereas the remaining 32 plants had a branch angle > 45° (Figure 8B). As to genotype, 28 and 34 trees had the same genotype as the parents, ‘Jinlei No. 1’ and ‘Granny Smith’, respectively (Figure 8C), which corresponded to segregation rates of 45.16% and 54.84%. In the F1 generation, the phenotype–genotype coincidence rate was 96.77%. The primer pair developed in this study can therefore be applied (Figure 8C).

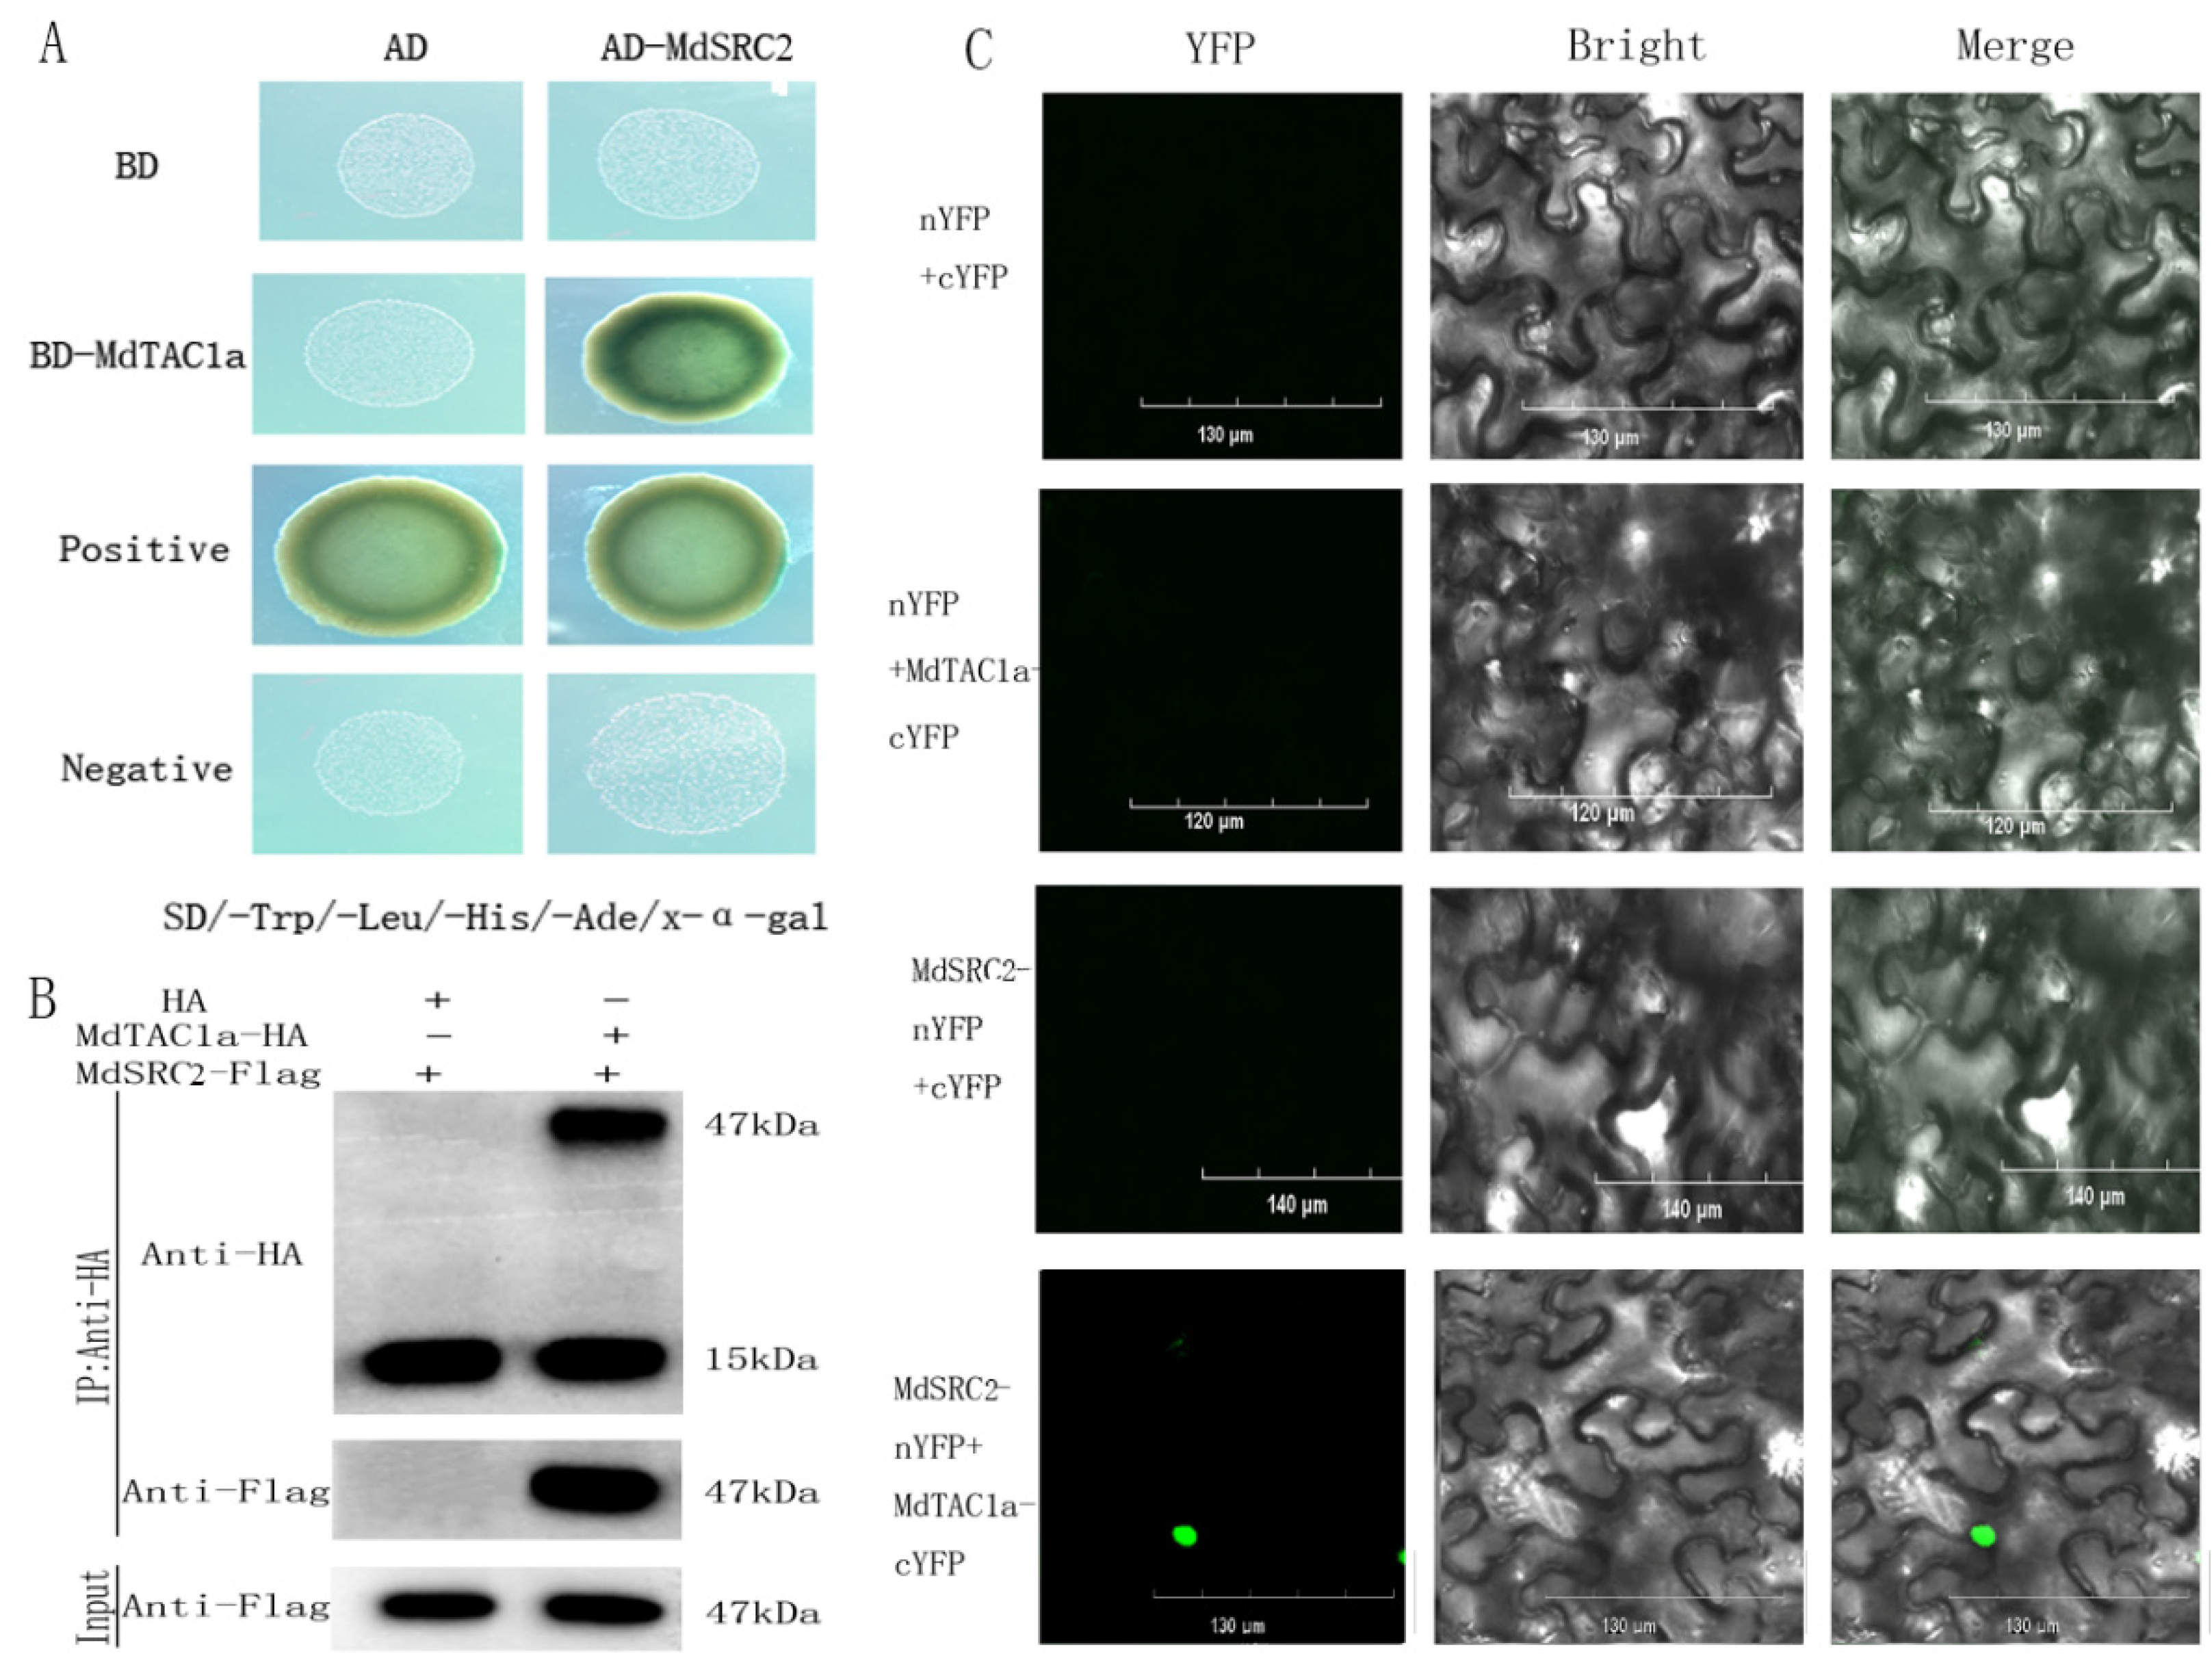
2.6. Interaction of MdTAC1a with MdSRC2

The promoter of MdTAC1a has InDel in different cultivars and MdTAC1a localized in both the cell membrane and the nucleus; MdTAC1a was selected for yeast two-hybrid in this experiment. Using the MdTAC1a as bait, we screened the cDNA interaction library of apple by the yeast two-hybrid method. After identifying the candidate gene, SOYBEAN GENE REGULATED BY COLD 2 (MdSRC2), we analyzed the cis-acting elements and domains in its CDS (Figure S3) [21]. A yeast two-hybrid analysis was used to determine whether MdTAC1a interacts with MdSRC2. The combinations of pGBKT7(BD)-53 + pGADT7(AD)-T and pGBKT7-Lam + pGADT7-T were used as positive and negative controls, respectively. All yeast colonies harboring different combinations of plasmids grew well on synthetic-shedding medium lacking leucine and tryptophan. Yeast colonies transformed with the plasmid combination, pGBKT7-MdTAC1a + pGADT7-MdSRC2, grew well on synthetic-shedding medium (SD-AHLT) in the absence of adenine, histidine, leucine, and tryptophan. The addition of X-α-gal gave results similar to the positive control (Figure 9A). Yeast cells transformed with the plasmid combination, pGBKT7-MdTAC1a-C+pGADT7, were not able to grow on SD-AHLT plates, similar to the negative control, which indicated that the C-terminus of MdTAC1a had no self-activity in yeast cells (Figure 9A). Taken together, these results indicate that the C-terminus of MdTAC1a binds to MdSRC2 in yeast.
Co-immunoprecipitation (Co-IP) experiments were then performed to provide further evidence for the interaction between MdTAC1a and MdSRC2 in vivo (Figure 9B). A bimolecular fluorescence complementation (BiFC) analysis was performed to further confirm the interaction between MdTAC1a and MdSRC2 in plant cells. pSPYNE and pSPYCE vectors, respectively, containing YFPN and YFPC, were used to construct MdTAC1a-cYFP and MdSRC2-nYFP, and vice versa. The fusion protein was transformed into A. tumefaciens and injected into tobacco leaves, and the fluorescence signal was observed under a scanning confocal microscope. When MdTAC1a-cYFP and MdSRC2-nYFP were transiently co-expressed, green fluorescence was observed in the nucleus, revealing the interaction of MdTAC1a and MdSRC2 in plants. No green fluorescence was detected when YFPN and YFPC were co-expressed in tobacco leaves (Figure 9C). Taken together, these results support the existence of an interaction between MdTAC1a and MdSRC2. In addition, the relative expression levels of the gene MdSRC2 were detected in the parental and F1 population, The expression level of gene MdSRC2 was significantly higher in trees with large branching angles(>45°) than in trees with small branching angles (≤45°) (Figure 10).

3. Discussion

3.1. Physiological Functions of MdTAC1 and MdTAC1-OE in Tobacco

In this study, we performed MdTAC1a and MdTAC1b subcellular localization experiments. Despite the 92.82% sequence similarity of nucleotide sequence between MdTAC1a and MdTAC1b, their subcellular localization was different. According to previous studies, TaTAC1 is located in the cell membrane in wheat (Triticum aestivum) [18], but SpsTAC2 is found in the nucleus in Salix [22]. These differences in the subcellular locations indicate that genes in the same family have different functions in different species.
We also used the Agrobacterium-mediated method to transform tobacco. MdTAC1a/b-OE-positive tobacco seedlings had significantly increased leaf angles. Overexpression of TAC1 causing increased leaf angle is seen in herbaceous plants [15]; the OsTAC1-overexpressing transgenic rice line has been reported to exhibit a loose phenotype with a larger tiller angle [13]. Overexpression of AtTAC1 in Arabidopsis can partially restore the phenotype of rice Attac1 mutants [14]. In woody plants, PpeTAC1-overexpression in plum can induce horizontal growth of branches, and while silencing PpeTAC1 in plum, the trees will grow toward the columnar trait as mutants of PpeTAC1 showed in peach [18]. MdTAC1a shares a 84.84% similarity of deduced amino acid sequences with MdTAC1b, 72.61% with PpeTAC1, 12.18% with OsTAC1, 17.35% with ZmTAC1, and 8.12% with AtTAC1. High similarity of sequences of these TAC1 genes in plants displays conserved biological function involving angle formation either in branches [14] and tillers [13] or leaves [15,23]. Unfortunately, no branching was observed in the MdTAC1a/b-OE-positive tobacco. Wild type Tobacco itself did not have branches under the same growth conditions as transgenic tobaccos (Figure S1). A possible reason was that MdTAC1a/b could not induce more branching but changed branch angles if lateral branches existed, like other plant TAC1 genes. It is speculated that decapitation of MdTAC1a/b-OE and non-transformant plants may obtain plants with lateral branching to observe changes in branch angles.

3.2. Relationship of Growth and Tropic Responses in Transgenic Tobacco

Auxins can directly inhibit cytokinin biosynthesis by regulating the auxin resistant 1-dependent auxin-signaling pathway, thereby inhibiting the growth of axillary buds in Arabidopsis and apple [24,25]. In addition to cytokinins, strigolactones are auxin regulated and act as branching inhibitors. Inhibition of strigolactone biosynthesis or signal transduction can increase plant branching [26]. Strigolactone biosynthesis is affected by carotenoid-cleaving dioxygenase (CCD) [24].
By comparing the OE plants with WT tobacco, it was found that the genes on the gibberellin pathway were significantly different. Gibberellin is a diterpenoid phytohormone that plays an important role in plant growth [27]. The activity of gibberellin required the activation of gibberellin 20beta-dioxygenase (GA20ox), and gibberellin 3beta-dioxygenase (GA3ox). In addition, gibberellin 2beta-dioxygenase (GA2ox) was used to degrade the activity of gibberellins [28,29]. Gibberellin has been shown to promote negative gravitational growth of a weeping Japanese cherry (Prunus spachiana), i.e., inhibit angular enlargement [30,31].
Under either light or dark conditions, moreover, the upward-bending stem response of horizontally arranged OE plants was significantly different from that of the wild type (Figure 5). According to a previous report, AtTAC1 responds to photosynthetic signals under dark or far-red light conditions by narrowing the branch angle [32]. Overexpression of MdTAC1a/b displayed a more sensitive-to-light response by bending the stem with a larger curve in transformants compared to the dark condition. In addition, IAA5 has been previously shown to be a good indicator of the gravity-induced auxin gradient in stems [33]. We speculate that MdTAC1a and MdTAC1b influence branch angle by acting on the transport of plant hormones.

3.3. Variation in the MdTAC1a Promoter among Cultivars and F1 Generation Plants

A promoter is the component of a gene that controls its expression, that is, the start time and degree of expression of transcription. A promoter does not control gene activity by itself, but instead functions in combination with transcription factors [34]. Prediction of specific sizes of different gene promoters is a difficult challenge. There are few reports on the relationship between promoter fragment size and function, but no reports on the relationship between promoters and branching angles. Multiple repeats of a promoter segment of MYB 10 causes transcription factor autoregulation in red apples [34]. In the present work, we found that an InDel marker developed by specific primers based on promoter sequences of TAC1a co-segregated with large branch angles (>65°), either in analyzed apple cultivars, or in a F1 population. Promoters contain many cis-acting elements that may be useful for predicting the involvement of genes in processes, such as transcription control, light response, and plant hormone synthesis [20]. There were many differences in the MdTAC1a and MdTAC1b promoters of different apple cultivars. Compared to MdTAC1a, variation in MdTAC1b promoters was complicated in four-type apple cultivars (Figure 6). As for MdTAC1a promoters in various apple cultivars, several base deletions were identified in spur- and weeping-type cultivars; among them, the GAG motif was missing from a cis-acting, light-responsive element. The differential distribution of auxin after light exposure is the cause of phototropic movement in plants [35]. In above-ground stems, a high concentration of auxin promotes somatic cell growth, whereas a lower concentration inhibits it. In plants exposed to light, the lower part of the hypocotyl is shaded and accumulates a larger amount of auxin, which causes cells on the shaded side to elongate faster than those on the irradiated side, resulting in the phenomenon of stem bending [36,37]. In summary, the absence of a GAG motif in spur- and weeping-type cultivars probably influence these cultivars responding to light.

3.4. The Effect of MdSRC2–MdTAC1a Interaction on Plant Branch Angle

The interaction between MdTAC1a and MdSRC2 has been verified by in vivo and in vitro experiments. SRC2 is a C2-domain protein in which C2 binds its own EF-hand motif as an intramolecular interaction [21]. The C2 domain independently forms a folded domain of 80–160 residues with characteristic binding Ca2+ and phospholipids [38]. In Arabidopsis, the cold-inducible protein AtSRC2 is a novel activator of the Ca2 +-dependent activation of AtRbohF(Respiratory burst oxidase homolog protein F) that enhances deliberate ROS(reactive oxygen species) production, which can increase the resistance of plants [39]. Ca2+ acts as a second messenger that converts the physical signal into physiological and biochemical signals and participates in gravity-signal transduction [40]. Such as Ca2+ concentration in chrysanthemum stems [41] and calreticulin and calmodulin mRNAs asymmetrically distributed in maize leaf [42]. In addition, the external application of calcium ion analogs or inhibitors can enhance or inhibit the gravitational response of plant hypocotyls [41,43,44,45]. In this experiment, both MdTAC1a and MdSRC2 were highly expressed in apple trees with large branch angle (Figure 11), showing the interaction of MdTAC1a and MdSRC2 involved in development of branch angle. Overexpression of MdTAC1 could also increase plant gravitation, however, it remains to be confirmed whether the MdSRC2 regulates the Ca2+ concentration and distribution to response gravity in apples.

4. Materials and Methods

4.1. Plant Materials

According to our observations and published apple (Malus x domestica Borkh.) tree statistics, we selected standard-type cultivars, ‘McIntosh’, ‘Summerland McIntosh’, and ‘Fuji’; columnar-type cultivars, ‘Wijcik’, ‘Waltz’, ‘Maypole’, and ‘Bolero’; weeping-type cultivar, ‘Granny Smith’; and spur-type cultivars, ‘Fukushima Spur’, ‘Miyazaki Spur’, and ‘Mutsu Spur’. We also included the following cultivars: ‘Zhongqiuwang’, ‘Red Star’, ‘Envy’, ‘Brilliant’, ‘Red Jade’, ‘Huashuo’, ‘Venus Golden’, ‘Huangyuxiang’, ‘Qincui’, ‘Tuoji’, ‘Dew’, ‘Max’, ‘Xiwang’, ‘Jinzhouhong’, ‘Daphne Red’, ‘Jinxianghong’, ‘Huajia’, ‘Huirui’, ‘Yanfu No. 10’, ‘Yanfu No. 6’, and ‘Yanfu No. 8’. Furthermore, we developed an F1 segregation population from four-year-old seedlings of a cross between ‘Jin Lei No. 1’ (female parent, narrow-tree architecture) and ‘Granny Smith’ (male parent, broad-tree architecture). The branching angle sizes of F1 progeny were measured and grouped in two subgroups: narrow branch angle (≤65°) and broad branch angle (>65°).
All cultivars and F1 progeny were grown at the experimental station of China Agricultural University, Beijing, China (latitude 40.138044° N; longitude 116.185320° E). In May 2019, leaves were harvested from one-year-old woody shoots, immediately frozen in liquid nitrogen, and stored at −80 °C. All branch-angle statistics are on one-year-old branches, and the height is 50–120 cm. In vitro cultured wild-type tobacco (N. benthamiana) plants were used for genetic transformation and subcellular localization experiments. Tobacco was grown at 22 °C with 16 h of light and 8 h of darkness. The leaves were used to detect changes in hormone expression levels of transgenic tobacco for 10 weeks after transgenesis.

4.2. DNA and RNA Extraction

Genomic DNA (gDNA) of apple was extracted by the cetyltrimethylammonium bromide (CTAB) method as described by Doyle [46], and total RNA was extracted using a modification of this method [47]. RNA degradation and contamination was monitored on 1% agarose gels. RNA purity and concentration were checked using a NanoPhotometer spectrophotometer (Implen, Westlake Village, CA, USA).

4.3. Real-Time Quantitative PCR (qRT-PCR) Analysis

cDNA of apple and tobacco were transcribed from 2 µg of total RNA in 20 µL reaction mixtures using a TransScript Uni All-in-One First-Strand cDNA Synthesis SuperMix for qPCR (One-Step gDNA Removal) (TransGen, Beijing, China). qRT-PCR analyses were carried out using a PerfectStart Uni RT&qPCR kit (Perfect Real Time, TransGen) with the qRT-PCR primers shown in Supplementary Table S2 on an Applied Biosystems One-Step Plus instrument (Applied Biosystems, Foster City, CA, USA). The cycling conditions were as follows: 94 °C for 30 s, followed by 40 cycles of 95 °C for 5 s, 60 °C for 15 s, and 72 °C for 10 s. Gene transcript levels were normalized to that of MdActin. Each analysis was repeated three times. The 2−ΔΔCt method was used to calculate relative transcript levels of each gene [48]. Three replicates of samples from different plants under the same conditions were collected for qRT-PCR analyses.

4.4. Generation of MdTAC1a/b–GFP Fusion Constructs, Transformation of Tobacco, and Subcellular Localization of MdTAC1a/b Protein

Comparisons of the coding sequences (CDSs) of MdTAC1a/b from the different plant materials revealed numerous SNPs. The full-length CDSs of MdTAC1a/b were amplified from these materials using specific primers (Supplementary Table S3). The CDSs of MdTAC1a/b were then inserted between BamHI and SalI restriction sites upstream of the GFP gene in the binary vector pCambia1300. Each resulting construct was introduced into Agrobacterium tumefaciens strain EHA105 using the freeze–thaw method [49,50]. The leaf disc method was used to transform wild-type tobacco, and the regenerated plants were screened according to their kanamycin resistance. Part of the fusion vector was also transformed into Agrobacterium GV3101 competent cells, and the suspension containing the fusion vector was instantaneously injected into the leaves of tobacco. After the transformation, the tobacco leaves were kept at 25 °C in the dark for 48 h. Following exposure to light for 24 h, the tobacco leaves were inspected under an FV1000 confocal microscope (Olympus, Tokyo, Japan).

4.5. InDel Marker Development and Genetic Correlation Analysis

The 2000-bp region upstream sequences of the start codon ATG of MdTAC1a/b located on chromosomes 7 and 1, respectively, of the apple genome [20] were downloaded from GenBank (https://www.ncbi.nlm.nih.gov/genome/?term=apple (accessed on 5 September 2019)) and used to design amplification primers (Supplementary Table S4). The MdTAC1a and MdTAC1b promoter sequences of the 11 apple cultivars were amplified using these primers and high-fidelity enzymes, and the amplified products were purified and ligated to a cloning vector for sequencing. The generated promoter sequences were compared among cultivars, and SSR primers were subsequently designed to amplify the 400 bp near the promoter deletion region. SDS-PAGE was used in conjunction with these primers to distinguish between tree types with different branch angles and the F1 generation. The relationship between tree phenotype and genotype was then used to calculate the probability of genetic linkage.

4.6. Yeast Two-Hybrid Assay (Y2H), Bimolecular Fluorescence Complementation (BiFC) Analysis, and Co-Immunoprecipitation (Co-IP)

For yeast two-hybrid screening, BD-MdTAC1a was amplified by PCR using four primers (Supplementary Table S5). After purification, the amplified PCR product was ligated with the empty pGBKT7 plasmid, which had been double digested with EcoRI and BamHI restriction enzymes. The correctly sequenced pGBKT7-MdTAC1a plasmid was used as a bait to screen the interaction library of apple in the pGADT7 vector. Transformation of the Y2H strain was performed with a matchmaker gold yeast two-hybrid kit (Takara, Tokyo, Japan), and putative positive clones were obtained and sequenced. Homologous genes in the generated sequences were identified by BLAST searching.
PCR products generated using primers BiFC-MdTAC1a-C-F/BiFC-MdTAC1a-C-R and BiFC-MdSRC2-N-F/BiFC-MdSRC2-N-R (Supplementary Table S5) were connected to pSPYNE and pSPYCE vectors digested with XbaI and XhoI to generate MdTAC1a-pSPYCE and MdSRC2-pSPYNE, respectively. For transient transformation, the ligated vectors were injected into five-week-old tobacco leaves via A. tumefaciens strain GV3101/p19. After the transformation, the tobacco leaves were kept at 25 °C in the dark for 48 h. Following exposure to light for 24 h, the tobacco leaves were inspected under an FV1000 confocal microscope (Olympus).
For the Co-IP assay, the CDSs of MdTAC1a and MdSRC2 were amplified and individually inserted into the vector pCAMBIA1300-221 with HA and FLAG tags using the primer pairs listed in Supplementary Table S5. These plasmids were transformed into A. tumefaciens GV3101/p19 and co-infiltrated into tobacco as described above. After 72 h, total protein was extracted using a plant total protein extraction kit (Hua Xing Bo Chuang Bio, Beijing, China) and incubated with Anti-BIFC immunomagnetic beads (Bimake Bio, Beijing, China) at 4 °C overnight. The beads were washed three times with PBST, and the precipitated proteins were further analyzed by western blotting using anti-HA monoclonal antibody.

4.7. Statistical Analysis

All samples were analyzed in triplicate, with data expressed as means ± standard errors unless otherwise noted. Statistical significance was assessed by analysis of variance using SPSS 17 (SPSS, Chicago, IL, USA). Differences were considered significant at p < 0.05 and extremely significant at p < 0.01.

5. Conclusions

In this study, we analyzed the biological functions of the genes MdTAC1a/b, including their subcellular locations and heterologous overexpression. The results revealed changes in phenotype of transgenic plants, key genes related GA and photosynthesis signal, and a differential response to gravity under light and dark conditions in transgenic and WT plants. We also identified MdTAC1a/b genes in apple cultivars, examined their tissue-specific expression patterns, and verified variations in their promoter sequences among apple cultivars and F1 hybrid. Finally, we revealed the interaction between MdSRC2 and MdTAC1a proteins through a yeast two-hybrid assay and verified this interaction in BIFC and Co-IP analyses. According to these results, MdTAC1a/b genes may play an important role in branch-angle development in apple. The molecular marker developed in this study should be useful for early selection of apple-branch angles in offsprings and thus, contributes to manipulate tree architecture of apples.

Supplementary Materials

The following supporting information can be downloaded at: https://www.mdpi.com/article/10.3390/ijms23031870/s1.

Author Contributions

Y.L. and Y.Z. (Yuandi Zhu) designed the experimental plan and wrote the manuscript; Y.L., X.T. and J.G. carried out experiments and analyzed the data; E.H. and Q.P. were responsible for tissue culture; Y.Z. (Yuan Zhao) and Y.C. assisted in experimental operations. All authors have read and agreed to the published version of the manuscript.

Funding

The financial support of this work was from the National Natural Science Foundation of China (Project No. 31672109).

Institutional Review Board Statement

Not applicable.

Informed Consent Statement

Not applicable.

Data Availability Statement

Primers and accession numbers of genes analyzed in this study are listed in Supplementary Tables S1−S4. Seeds used in transgenic lines and all other data used in this study are available from the corresponding authors upon request.

Conflicts of Interest

The authors declare that they have no conflict of interest.

References

  1. Lespinass, Y. Breeding apple tree: Aims and methods. In Proceedings of the Joint Conference of the EAPR Breeding & Varietal Assessment Section and the EUCARPIA Potato Section, Landerneau, France, 12–17 January 1992; Rousselle-bourgeois, F., Rousselle, P., Eds.; Acdemic Press: Landerneau, France, 1992; pp. 103–110. [Google Scholar]
  2. Reinhardt, D.; Kuhlemeier, C. Plant architecture. EMBO Rep. 2002, 3, 846–851. [Google Scholar] [CrossRef] [PubMed]
  3. Costes, E.; Lauri, P.E.; Regnard, J.L. Analyzing fruit tree architecture: Implications for tree management and fruit production. Hortic. Rev. 2010, 32, 1–61. [Google Scholar]
  4. Bai, F.; Reinheimer, R.; Durantini, D.; Kellogg, E.A.; Schmidt, R.J. TCP transcription factor, BRANCH ANGLE DEFECTIVE 1 (BAD1), is required for normal tassel branch angle formation in maize. Proc. Natl. Acad. Sci. USA 2012, 109, 12225–12230. [Google Scholar] [CrossRef] [PubMed] [Green Version]
  5. Hollender, C.A.; Dardick, C. Molecular basis of angiosperm tree architecture. New Phytol. 2015, 206, 541–556. [Google Scholar] [CrossRef] [PubMed] [Green Version]
  6. Dong, Z.B.; Jiang, C.; Chen, X.Y.; Zhang, T.; Ding, L.; Song, W.B.; Luo, H.B.; Lai, J.S.; Chen, H.B.; Liu, R.Y.; et al. Maize LAZY1 mediates shoot gravitropism and inflorescence development through regulating auxin transport, auxin signaling, and light response. Plant Physiol. 2013, 163, 1306–1322. [Google Scholar] [CrossRef] [PubMed]
  7. Yoshihara, T.; Iino, M. Identification of the gravitropism-related rice gene LAZY1 and elucidation of LAZY1-dependent and -independent gravity signaling pathways. Plant Cell Physiol. 2007, 48, 678–688. [Google Scholar] [CrossRef] [Green Version]
  8. Li, X.Y.; Qian, Q.; Fu, Z.M. Control of tillering in rice. Nature 2003, 422, 618–621. [Google Scholar] [CrossRef]
  9. Ongaro, V.; Leyser, O. Shoot branching in arabidopsis. Comp. Biochem. Physiol. Part A Mol. Integr. Physiol. 2007, 146, S237–S238. [Google Scholar] [CrossRef]
  10. Sang, D.; Chen, D.; Liu, G.; Liang, Y.; Huang, L.Z.; Meng, X.B.; Chu, J.F.; Sun, X.H.; Dong, G.J.; Yuan, Y.D.; et al. Strigolactones regulate rice tiller angle by attenuating shoot gravitropism through inhibiting auxin biosynthesis. Proc. Natl. Acad. Sci. USA 2014, 111, 11199–11204. [Google Scholar] [CrossRef] [Green Version]
  11. Li, Y.; Li, J.; Chen, Z.; Wei, Y.; Qi, Y.H.; Wu, C.Y. Osmir167a-targeted auxin response factors modulate tiller angle via fine-tuning auxin distribution in rice. Plant Biotechnol. J. 2020, 18, 2015–2026. [Google Scholar] [CrossRef] [Green Version]
  12. Busov, V.B.; Strauss, B.S.H. Genes for control of plant stature and form. New Phytol. 2010, 177, 589–607. [Google Scholar] [CrossRef] [PubMed]
  13. Yu, B.S.; Lin, Z.W.; Li, H.X.; Li, X.J.; Li, J.Y.; Wang, Y.H.; Zhang, X.; Zhu, Z.F.; Zhai, W.X.; Wang, X.K.; et al. TAC1, a major quantitative trait locus controlling tiller angle in rice. Plant J. 2007, 52, 891–898. [Google Scholar] [CrossRef] [PubMed]
  14. Dardick, C.; Callahan, A.; Horn, R.; Ruiz, K.B.; Zhebentyayeva, T.; Hollender, C.; Whitaker, M.; Abbott, A.; Scorza, R. PpeTAC1 promotes the horizontal growth of branches in peach trees and is a member of a functionally conserved gene family found in diverse plants species. Plant J. 2013, 75, 618–630. [Google Scholar] [CrossRef]
  15. Ku, L.X.; Wei, X.M.; Zhang, S.F. Cloning and Characterization of a Putative TAC1 Ortholog Associated with Leaf Angle in Maize (Zea mays L.). PLoS ONE 2011, 6, e20621. [Google Scholar] [CrossRef] [PubMed]
  16. Jiang, J.H.; Tan, L.B.; Zhu, Z.F.; Fu, Y.C.; Liu, F.X.; Cai, H.W.; Sun, C.Q. Molecular evolution of the TAC1 gene from rice (Oryza sativa L.). J. Genet. Genom. 2012, 39, 551–560. [Google Scholar] [CrossRef]
  17. Cao, X.; Deng, M.; Zhang, Z.L.; Liu, Y.J.; Yang, X.L.; Zhou, H.; Liu, Y.X. Molecular Characterization and Expression Analysis of TaTAC1 gene in Triticum aestivum L. J. Plant Genet. Resour. 2017, 18, 125–132. [Google Scholar]
  18. Hollender, C.A.; Waite, J.M.; Tabb, A.; Raines, D.; Chinnithambi, S.; Dardick, C. Alteration of TAC1 expression in Prunus species leads to pleiotropic shoot phenotypes. Hortic. Res. 2018, 5, 26. [Google Scholar] [CrossRef] [Green Version]
  19. Xu, D.; Qi, X.; Li, J.H.; Han, X.J.; Wang, J.N.; Jiang, Y.Z.; Tian, Y.T.; Wang, Y.W. PzTAC and PzLAZY from a narrow-crown poplar contribute to regulation of branch angles. Plant Physiol. Biochem. 2017, 118, 571–578. [Google Scholar] [CrossRef]
  20. Wang, L.M.; Cai, W.; Du, C.H.; Fu, Y.; Xie, X.; Zhu, Y.D. The isolation of the IGT family genes in Malus × domestica and their expressions in four idiotype apple cultivars. Tree Genet. Genomes 2018, 14, 46. [Google Scholar] [CrossRef]
  21. Takahashi, R.; Shimosaka, E. cDNA sequence analysis and expression of two cold-regulated genes in soybean. Plant Sci. 1997, 123, 93–104. [Google Scholar] [CrossRef]
  22. Yuan, M.R.; Yang, Y.; Zhang, L.; He, Y.J.; Jin, N.; Yang, H.F. Cloning, Bioinformatics and Tissue-specific Expression Analysis of Sps-TAC2 Gene in Salix psammophila. Mol. Plant Breed. 2019, 17, 2133–2151. [Google Scholar]
  23. Matthias, F. Targeted CRISPR/Cas9-Based Knock-Out of the Rice Orthologs TILLER ANGLE CONTROL 1 (TAC1) in Poplar Induces Erect Leaf Habit and Shoot Growth. Forests 2021, 12, 1615. [Google Scholar]
  24. Petersen, R.; Krost, C. Tracing a key player in the regulation of plant architecture: The columnar growth habit of apple trees (Malus × domestica). Planta 2013, 238, 1–22. [Google Scholar] [CrossRef] [PubMed] [Green Version]
  25. Tan, M.; Li, G.; Qi, S.; Liu, X.J.; Chen, X.L.; Ma, J.J.; Zhang, D.; Han, M.Y. Identification and expression analysis of the IPT and CKX gene families during axillary bud outgrowth in apple (Malus domestica Borkh.). Gene 2018, 651, 106–117. [Google Scholar] [CrossRef]
  26. Cheng, X.; Ruyterspira, C.; Bouwmeester, H. The interaction between strigolactones and other plant hormones in the regulation of plant development. Front. Plant Sci. 2013, 4, 199. [Google Scholar] [CrossRef] [Green Version]
  27. Dayan, J.; Voronin, N.; Gong, F.; Sun, T.; Hedden, P.; Fromm, H.; Aloni, R. Leaf-induced gibberellin signaling is essential for internode elongation, cambial activity, and fiber differentiation in tobacco stems. Plant Cell 2012, 24, 66–79. [Google Scholar] [CrossRef] [Green Version]
  28. Hedden, P.; Phillips, A.L. Gibberellin metabolism: New insights revealed by the genes. Trends Plant Sci. 2000, 5, 523–530. [Google Scholar] [CrossRef]
  29. Yamaguchi, S. Gibberellin Metabolism and its Regulation. Annu. Rev. Plant Biol. 2008, 59, 225–251. [Google Scholar] [CrossRef]
  30. Nakamura, T.; Saotome, M.; Ishiguro, Y.; Itoh, R.; Higurashi, S.; Hosono, M.; Ishii, Y. The effects of GA3 on weeping of growing shoots of the Japanese cherry, Prunus spachiana. Plant Cell Physiol. 1994, 35, 523–527. [Google Scholar]
  31. Yoshida, M.; Yamamoto, H.; Okuyama, T.; Nakamura, T. Negative gravitropism and growth stress in GA3-treated branches of Prunus spachiana Kitamura f. spachiana cv. Plenarosea. J. Wood Sci. 1999, 45, 368–372. [Google Scholar] [CrossRef]
  32. Jessica, M.W.; Chris, D. TILLER ANGLE CONTROL 1 modulates plant architecture in response to photosynthetic signals. J. Exp. Bot. 2018, 69, 4935–4944. [Google Scholar]
  33. Taniguchi, M.; Nakamura, M.; Tasaka, M.; Morita, M.T. Identification of gravitropic response indicator genes in Arabidopsis inflorescence stems. Plant Signal. Behav. 2014, 9, e29570. [Google Scholar] [CrossRef] [PubMed] [Green Version]
  34. Espley, R.V.; Brendolise, C.; Chagneé, D.; Kutty-Amma, S.; Green, S.; Volz, R.; Putterill, J.; Schouten, H.J.; Gardiner, S.E.; Hellens, R.P.; et al. Multiple repeats of a promoter segment causes transcription factor autoregulation in red apples. Plant Cell 2009, 21, 168–183. [Google Scholar] [CrossRef] [PubMed] [Green Version]
  35. Liscum, E.; Askinosie, S.K.; Leuchtman, D.L.; Morrow, J.; Willenburg, K.T.; Coats, D.R. Phototropism: Growing Towards an Understanding of Plant Movement. Plant Cell 2014, 26, 38–55. [Google Scholar] [CrossRef] [Green Version]
  36. Palme, K.; Dovzhenko, A.; Ditengou, F.A. Auxin transport and gravitational research: Perspectives. Protoplasma 2006, 229, 175. [Google Scholar] [CrossRef]
  37. Bainbridge, K.; Guyomarc’h, S.; Bayer, E.; Swarup, R.; Bennett, M.; Mandel, T.; Kuhlemeier, C. Auxin Influx Carriers Stabilize Phyllotactic Patterning. Genes Dev. 2008, 22, 810–823. [Google Scholar] [CrossRef] [Green Version]
  38. Rizo, J.; Südhof, T.C. C2-domains, structure and function of a universal Ca2+-binding domain. J. Biol. Chem. 1998, 273, 15879–15882. [Google Scholar] [CrossRef] [Green Version]
  39. Tomoko, K.; Sachie, K.; Ayako, I.; Shigeru, H.; Hitomi, N.; Masataka, M.; Aya, I.; Mitsutomo, A.; Hidetaka, K.; Kazuyuki, K. A low temperature-inducible protein AtSRC2 enhances the ROS-producing activity of NADPH oxidase AtRbohF. Biochim. Biophys. Acta 2013, 1833, 2775–2780. [Google Scholar]
  40. Dauwalder, M.; Roux, S.J. Distribution of calmodulin in corn seedlings: Immunocytochemical localization in coleoptiles and root apices. Adv. Space Res. 1986, 6, 67–70. [Google Scholar] [CrossRef]
  41. Zhang, S.; Chen, S.; Chen, F.; Jiang, B. The Role of Ionic Calcium in the Gravitropic Response of a Creeping Chrysanthemum Cultivar. Russ. J. Plant Physiol. 2011, 58, 696–702. [Google Scholar] [CrossRef]
  42. Heilmann, I.; Shin, J.; Huang, J.; Perera, I.Y.; Davies, E. Transient dissociation of polyribosomes and concurrent recruitment of calreticulin and calmodulin transcripts in gravistimulated maize pulvini. Plant Physiol. 2001, 127, 1193–1203. [Google Scholar] [PubMed]
  43. Bushart, T.J.; Cannon, A.; Clark, G.; Roux, S.J. Structure and function of CrACA1, the major PM-type Ca2+-ATPase, expressed at the peak of the gravity-directed trans-cell calcium current in spores of the fern Ceratopteris richardii. Plant Biol. 2014, 16, 151–157. [Google Scholar] [CrossRef] [PubMed]
  44. Salmi, M.L.; Haque, A.U.; Bushart, T.J.; Stout, S.C.; Roux, S.J.; Porterfield, D.M. Changes in gravity rapidly alter the magnitude and direction of a cellular calcium current. Planta 2011, 233, 911–920. [Google Scholar] [CrossRef] [PubMed]
  45. Urbina, D.C.; Silva, H.; Meisel, L.A. The Ca2+ pump inhibitor, thapsigargin, inhibits root gravitropism in Arabidopsis thaliana. Biol. Res. 2006, 39, 289–296. [Google Scholar] [CrossRef] [PubMed] [Green Version]
  46. Doyle, J. A rapid DNA isolation procedure for small quantities of fresh leaf tissue. Phytochem. Bull. 1986, 19, 11–15. [Google Scholar]
  47. Asif, M.; Trivedi, P.; Solomos, T.; Tucker, M. Isolation of high-quality RNA from apple (Malus domestica) fruit. J. Agric. Food Chem. 2006, 54, 5227–5229. [Google Scholar] [CrossRef]
  48. Livak, K.J.; Schmittgen, T.D. Analysis of relative gene expression data using real-time quantitative PCR and the 2−ΔΔCT method. Methods 2001, 25, 402–408. [Google Scholar] [CrossRef]
  49. Hofgen, R.; Willmitzer, L. Storage of competent cells for Agrobacterium transformation. Nucleic Acids Res. 1988, 16, 9877. [Google Scholar] [CrossRef] [Green Version]
  50. Sambrook, J.; Russell, D.W. Molecular Cloning: A Laboratory manual, 3rd ed.; Cold Spring Harbour Laboratory Press: New York, NY, USA, 2001. [Google Scholar]
Figure 1. Subcellular localization of MdTAC1a and MdTAC1b in tobacco leaves. 35S::GFP represented the pCambia1300 with GFP vector and the pCambia1300 empty vector was detected in the nucleus and membrane. MdTAC1a was detected on the nucleus and membrane, and MdTAC1b was detected on the membrane.
Ijms 23 01870 g001
Figure 2. Phenotypes, leaf angles, and relative expression levels of MdTAC1a and MdTAC1b in transgenic tobacco plants. (A,D) Phenotypes of MdTAC1a-OE and MdTAC1b-OE transgenic plants. (B,E) The relative expression levels of MdTAC1a in MdTAC1a-OE and MdTAC1b in MdTAC1b-OE transgenic plants. (C,F) Leaf angles of MdTAC1a-OE and MdTAC1b-OE transgenic plants. WT: the wild type; L1–L3: the transgenic lines. The significance of difference was analyzed with two-tailed t-test (** p < 0.01).
Ijms 23 01870 g002
Figure 3. Expression profiles of 12 key genes involved in synthesis and signaling pathways in the WT and transgenic plants eight weeks after transgenic. Error bars represented the standard error of the mean for three biological replicates. The results showed the gene relative expressions in the MdTAC1a and MdTAC1b transgenic lines were significantly more than that of the wild type in tobacco. The significance of difference was analyzed with two-tailed t-test (* 0.01 < p < 0.05, ** p < 0.01). Data were represented as average values with SD.
Ijms 23 01870 g003
Figure 4. Gravitropic and light responses in wild-type (WT), MdTAC1a-OE, and MdTAC1b-OE tobaccos. (A,B) Tobacco responded to gravity for 24 h under light and 48 h for darkness. (C,D) The angle in the stem was bent at the position of the red arrow in (A,B). Bars indicated the means ± SDs (n = 3). (C) The statistics of the degree of bending of plant stems placed horizontally under light at 0, 1, 5, 12, and 24 h. (D) The statistics of the degree of bending of plant stems placed horizontally at 0, 1, 8, 12, 24, and 48 h in the dark. The rate of stem bending was faster in WT than in MdTAC1a-OE and MdTAC1b-OE plants, regardless of light or dark treatments. (E) The relative expression level of IAA5 in the stem at the position of the red arrow in (A,B). (F) Dynamic changes in relative expression levels of MdTAC1a and MdTAC1b in OE plants during stem-bending period under light and dark condition. The results showed the gene relative expression in the MdTAC1a and MdTAC1b transgenic lines was significantly more than that of the wild type in tobacco. The significance of difference was analyzed with two-tailed t-test (* 0.01 < p < 0.05, ** p < 0.01). Data were represented as average values with SD.
Ijms 23 01870 g004
Figure 5. Statistics of branching angles of four tree typesand the expression of MdTAC1a and MdTAC1b in four apple cultivars. (A) Statistics of branching angles of four tree types (B,C) The relative expression patterns of MdTAC1a/b in vegetative organs of apple cultivars.
Ijms 23 01870 g005
Figure 6. The Differences of MdTAC1a and MdTAC1b promoters among four apple cultivars. (A) The sequence of InDel in promoter regions of MdTAC1a in four-type cultivars. The initiation codon (ATG) A was defined as 0. The red box was a representation of the InDel area (B). The sequence SNPs in promoter regions of MdTAC1b in four-type cultivars.
Ijms 23 01870 g006
Figure 7. Genotyping of TAC1a in apple cultivars by an InDel markerThe upper imageshowedthe branch angle size of 21 apple cultivars, and the lower electrophoresis pattern showed the separation of TAC1a marker in the 21 cultivars, 1-21 represented sequentially ‘Zhongqiuwang’, ‘Red star’, ‘Envy’, ‘Brilliant’, ‘Red jade’, ‘Huashuo’, ‘Venus golden’, ‘Huangyuxiang’, ‘Qincui’, ‘Tuoji’, ‘Dew’, ‘Xiwang’, ‘Jinzhouhong’, ‘Daphne red’, ‘Jinxianghong’, ‘Huirui’, ‘Max’, ‘Huajia’, ‘Yanfu NO.6’, ‘Yanfu NO.10’, ‘Yanfu NO.8’.
Ijms 23 01870 g007
Figure 8. Genotyping of TAC1a in apple parental and F1 individuals by an InDel marker. (A) Apple parental and F1 individuals. (B) was the branch angle statistics of the parents and F1. (C) was the separation of TAC1a marker in the parental and F1 progeny. M represented DNA ladder marker; Line 1 to 29 and line 32 to 64 represented F1 generation; 30 represented parental Granny Smith; 31 represented parental Jinlei No. 1 The parent and F1 were separated at 400 bp of the red box in Figure (C).
Ijms 23 01870 g008
Figure 9. MdTAC1a interacted with MdSRC2. (A) Yeast two-hybrid analysis showing the interaction between MdTAC1a and MdSRC2. pGBKT7-Lam + pGADT7-T were used as negative controls. pGBKT7-53 + pGADT7-T were used as positive controls. (B) Co-IP analysis in tobacco showed the interaction between MdTAC1a and MdSRC2. Empty vectors were used as negative controls. (C) BiFC analysis in tobacco epidermal cells showed the interaction between MdTAC1a and MdSRC2. Empty vectors were used as negative controls.
Ijms 23 01870 g009
Figure 10. Expression of MdSRC2 in parental cultivars and F1 progeny.
Ijms 23 01870 g010
Figure 11. The model of MdTAC1a in regulating the branching angle of apple trees. In apple MdTAC1a interacts with MdSRC2 to affect intracellular Ca2+ concentration remains to be proven.
Ijms 23 01870 g011
Publisher’s Note: MDPI stays neutral with regard to jurisdictional claims in published maps and institutional affiliations.

