
Time-Dependent Effect of Sciatic Nerve Injury on Rat Plasma Lipidome

 , , , , ,
  ,
,
Abstract
1. Introduction
2. Results
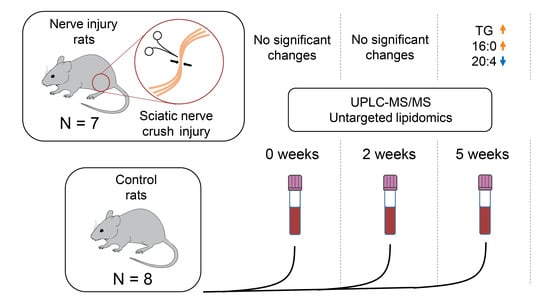
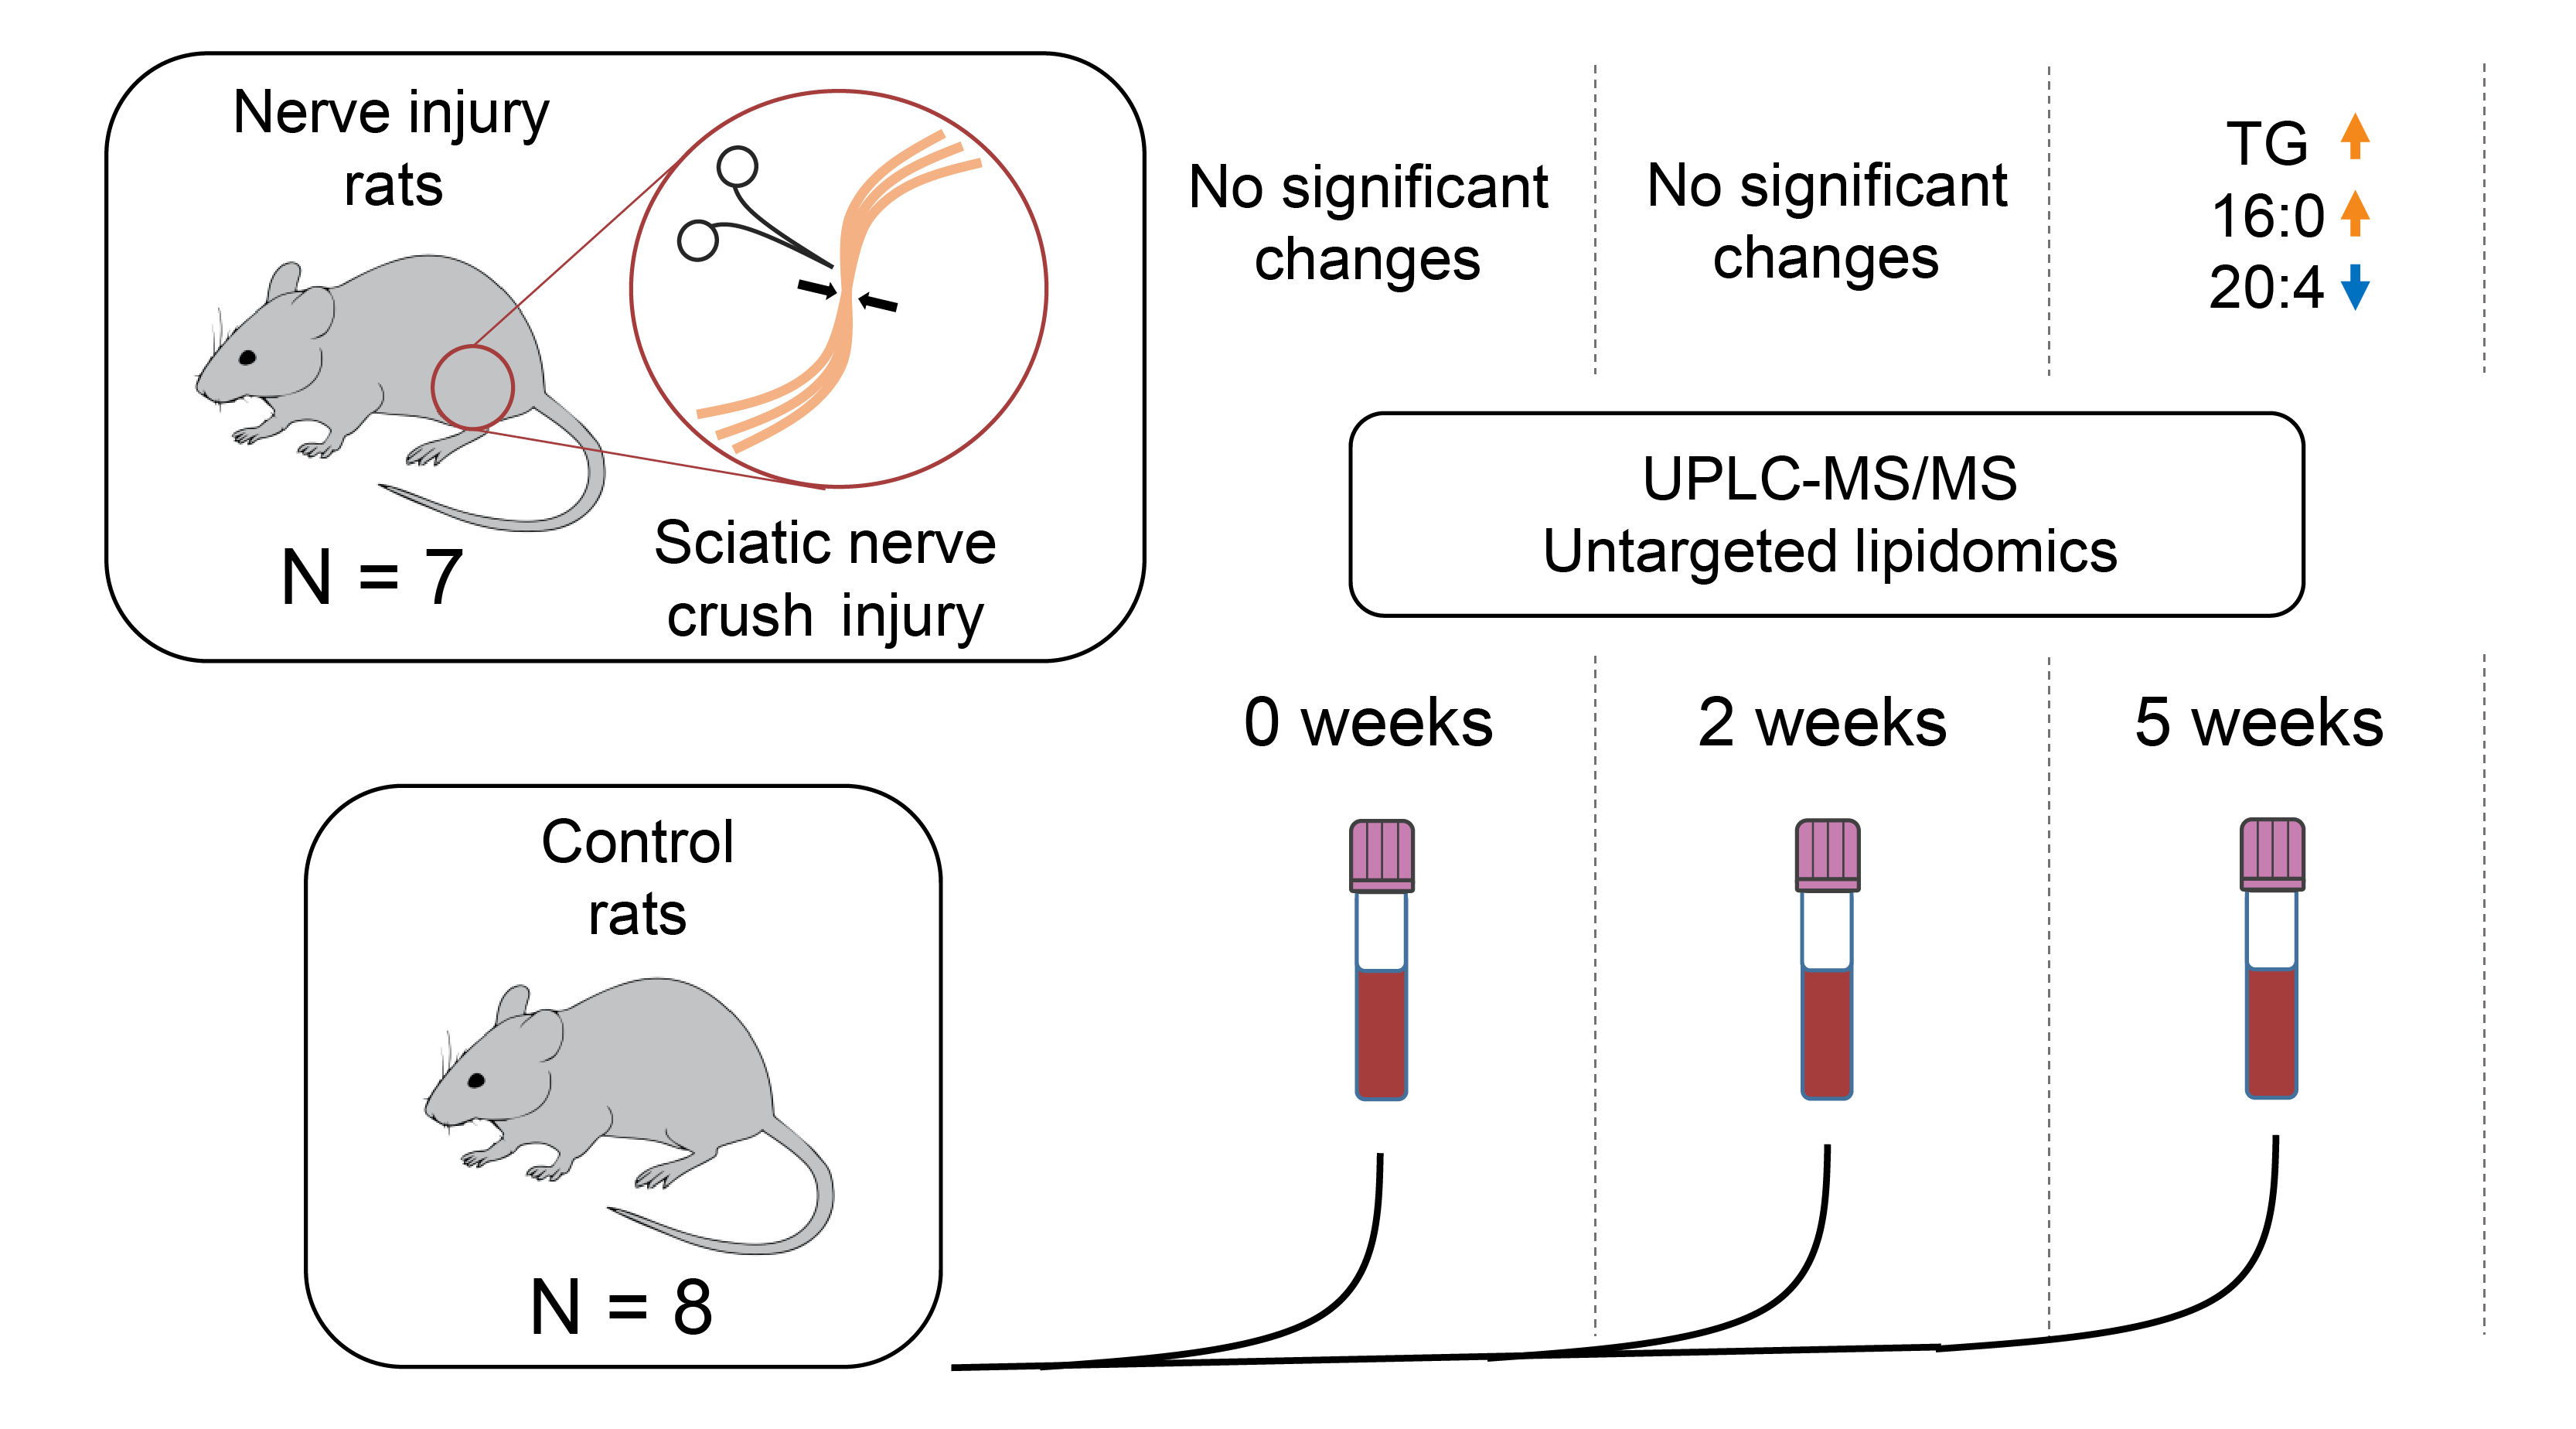
2.1. Study Setup
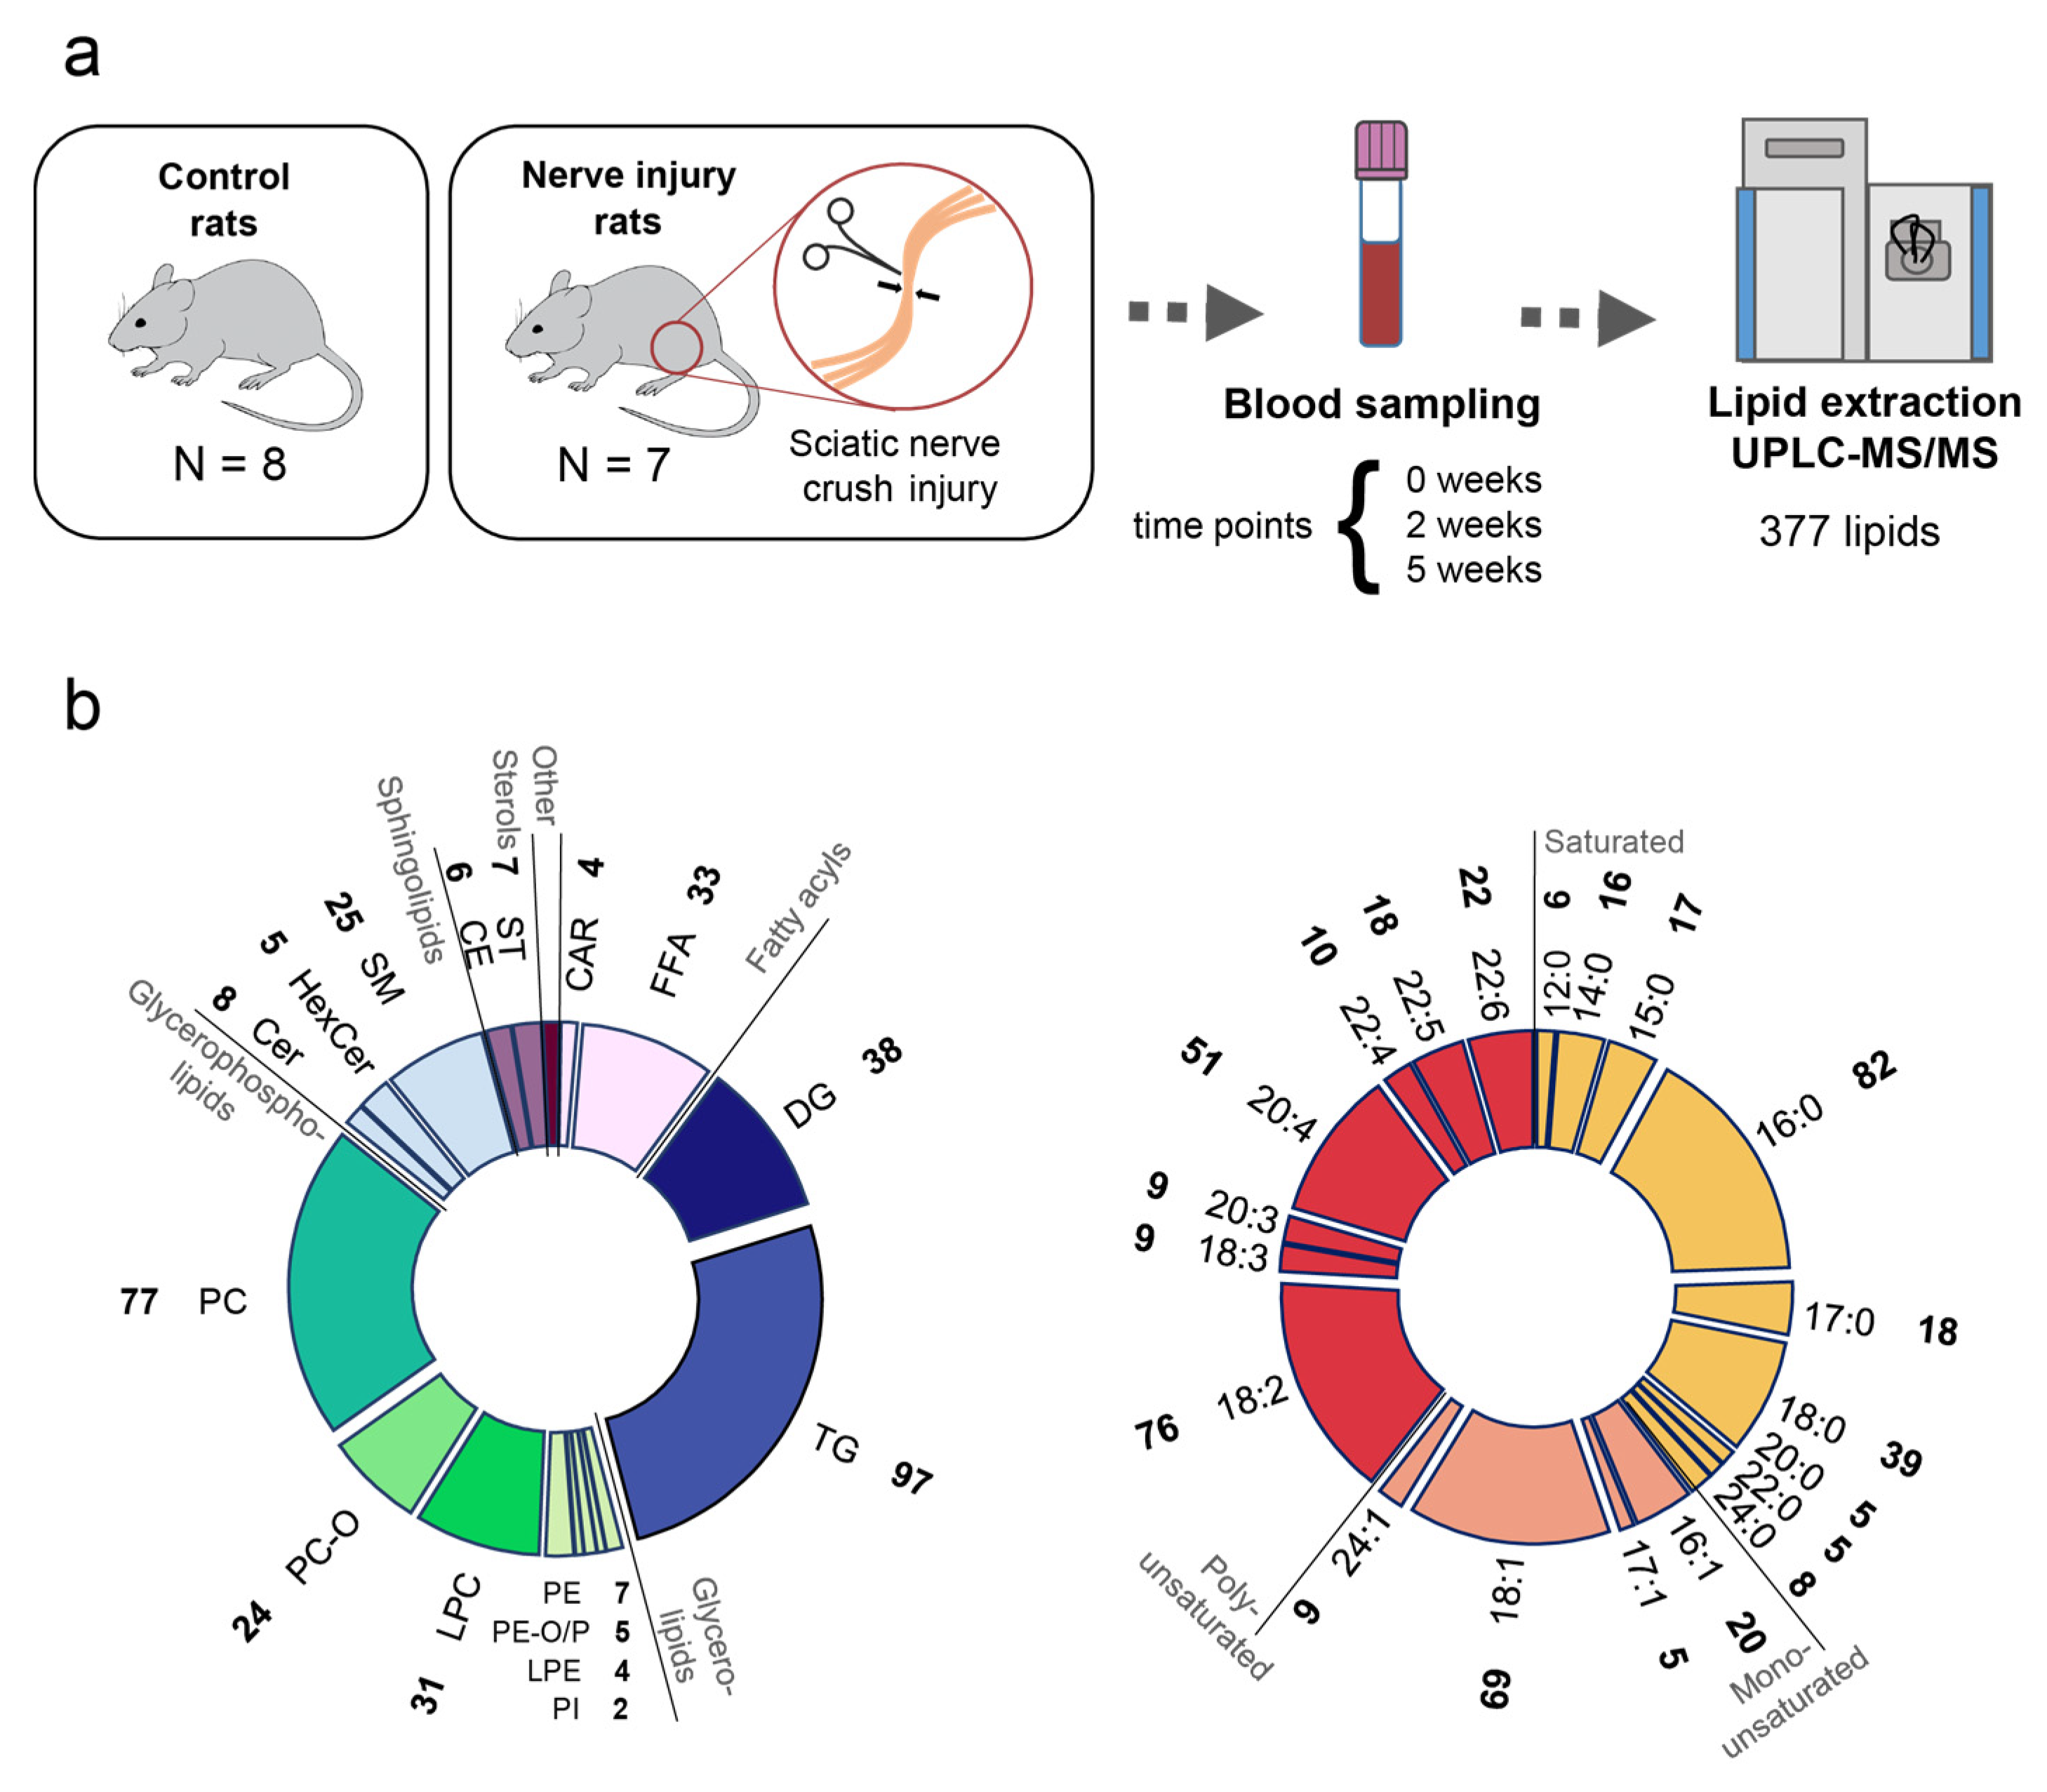
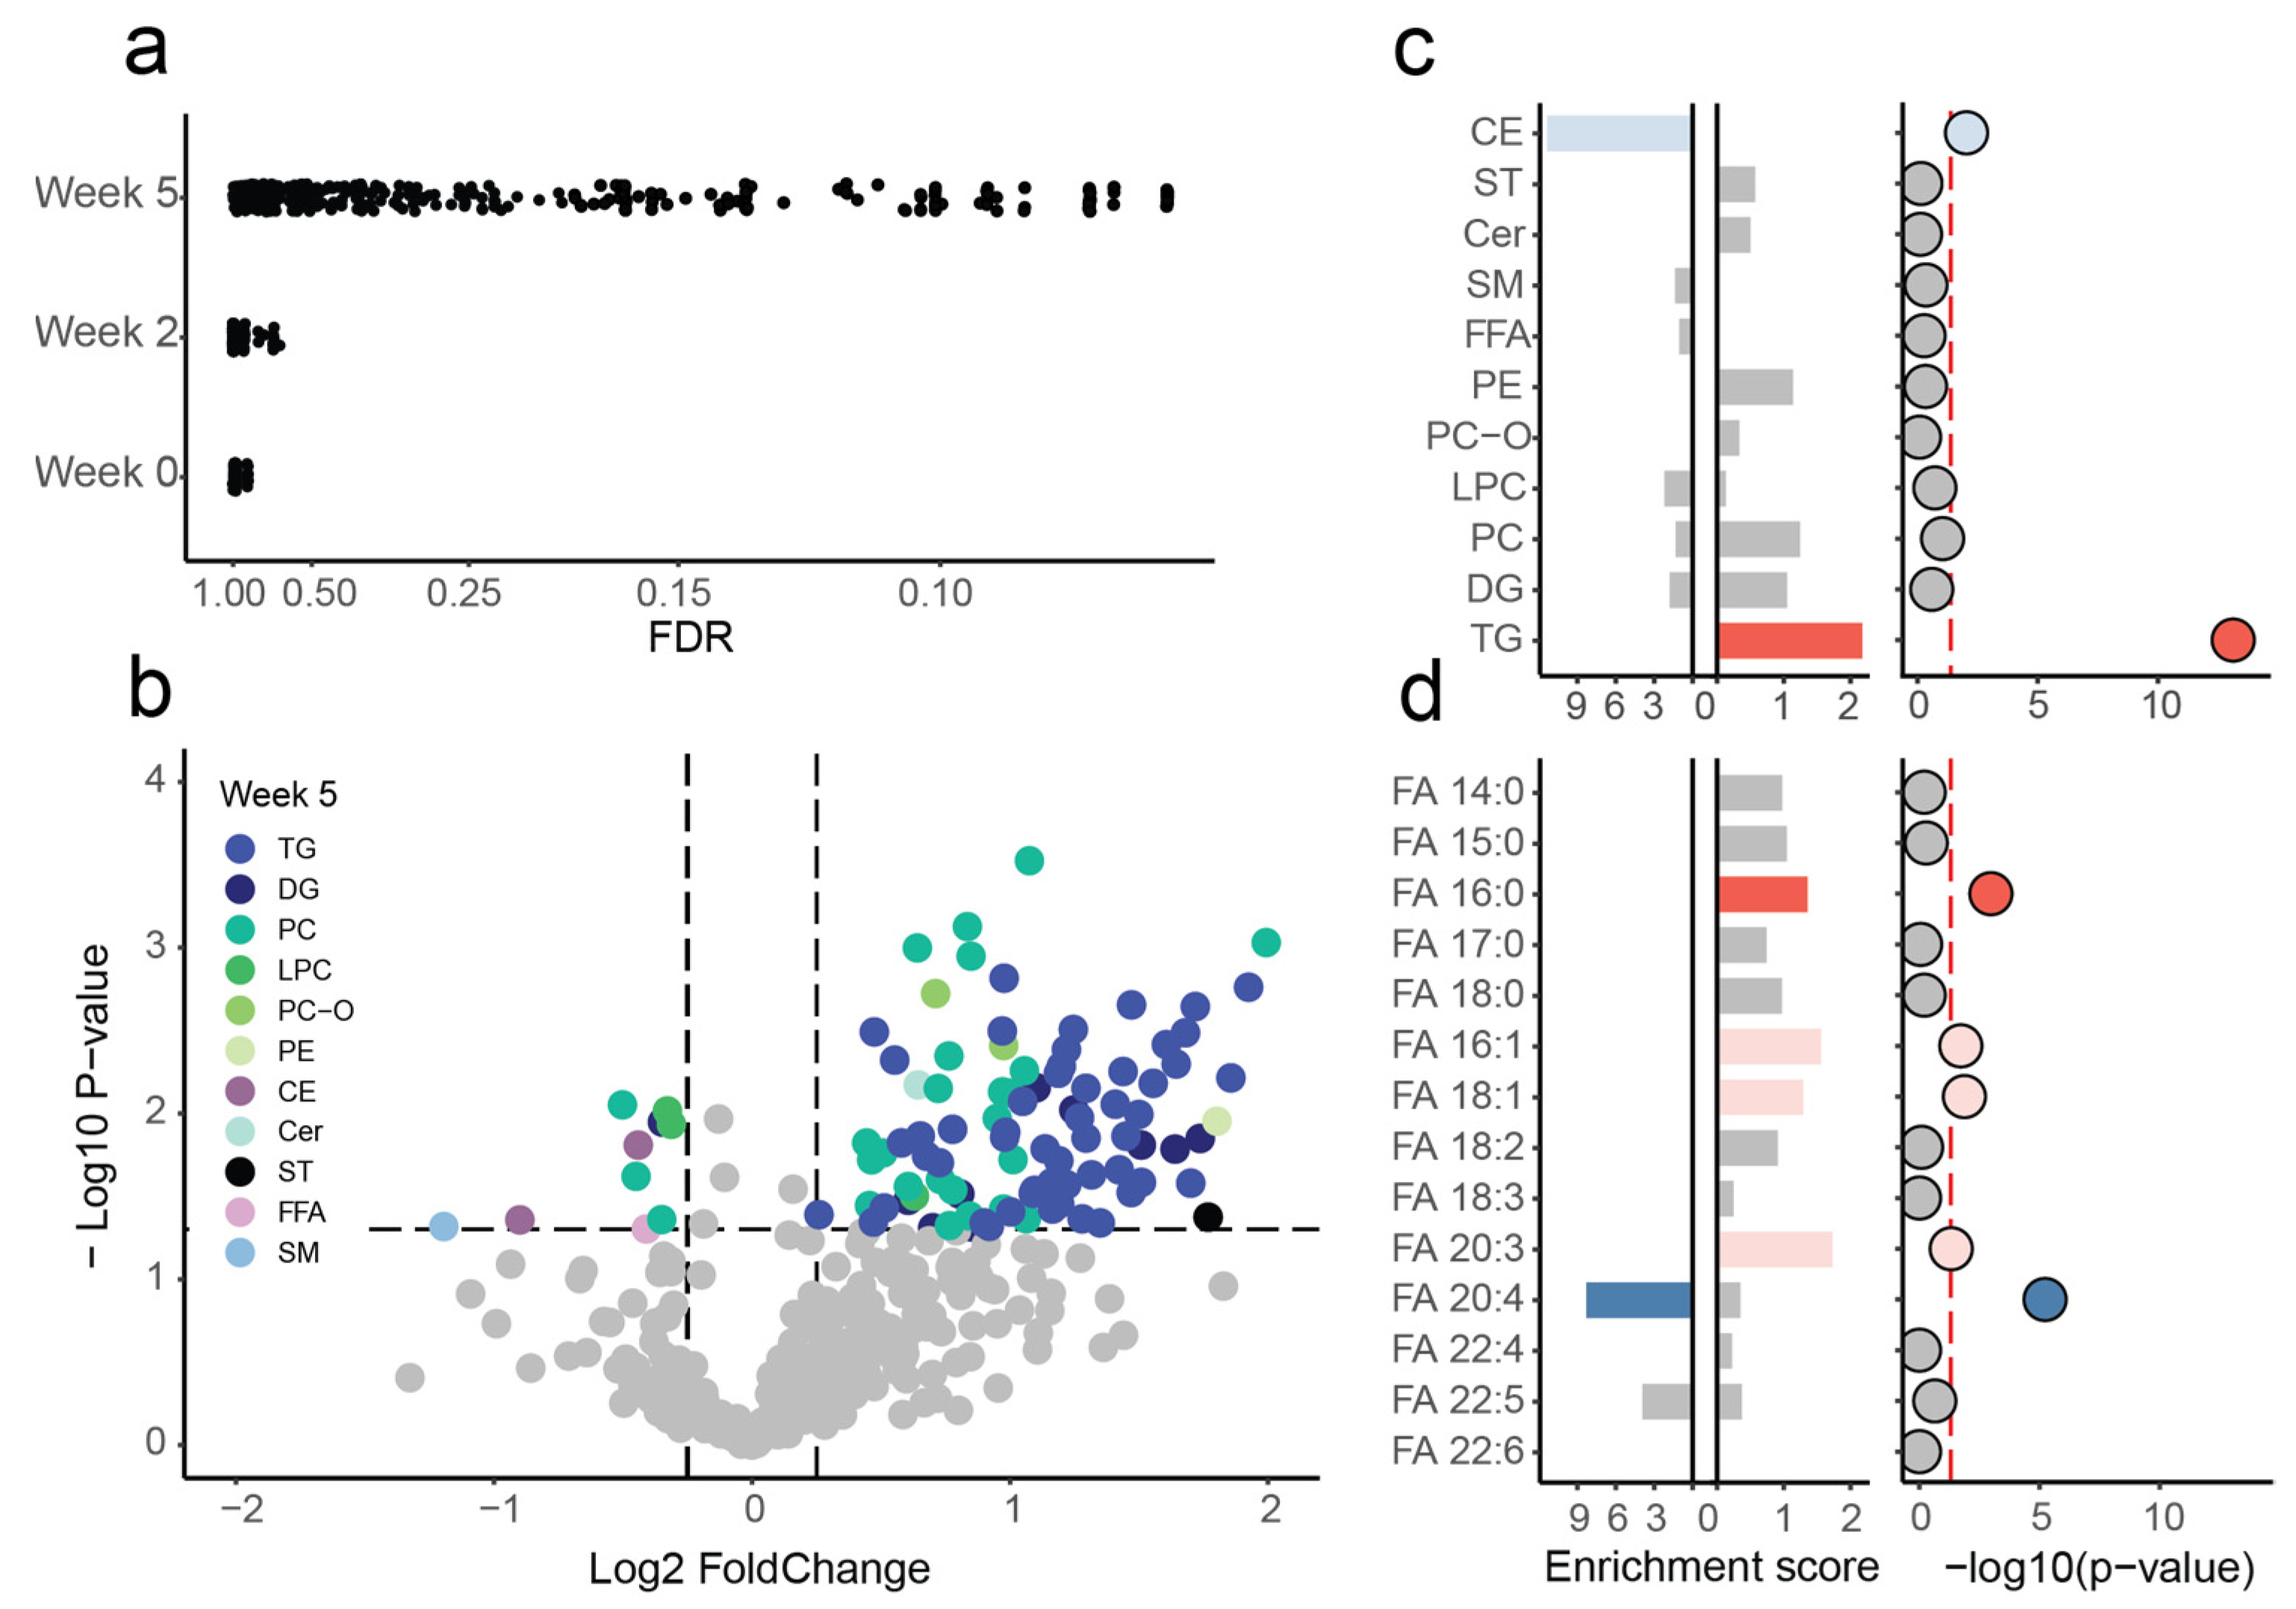
2.2. Alterations at Five Weeks Post-Injury
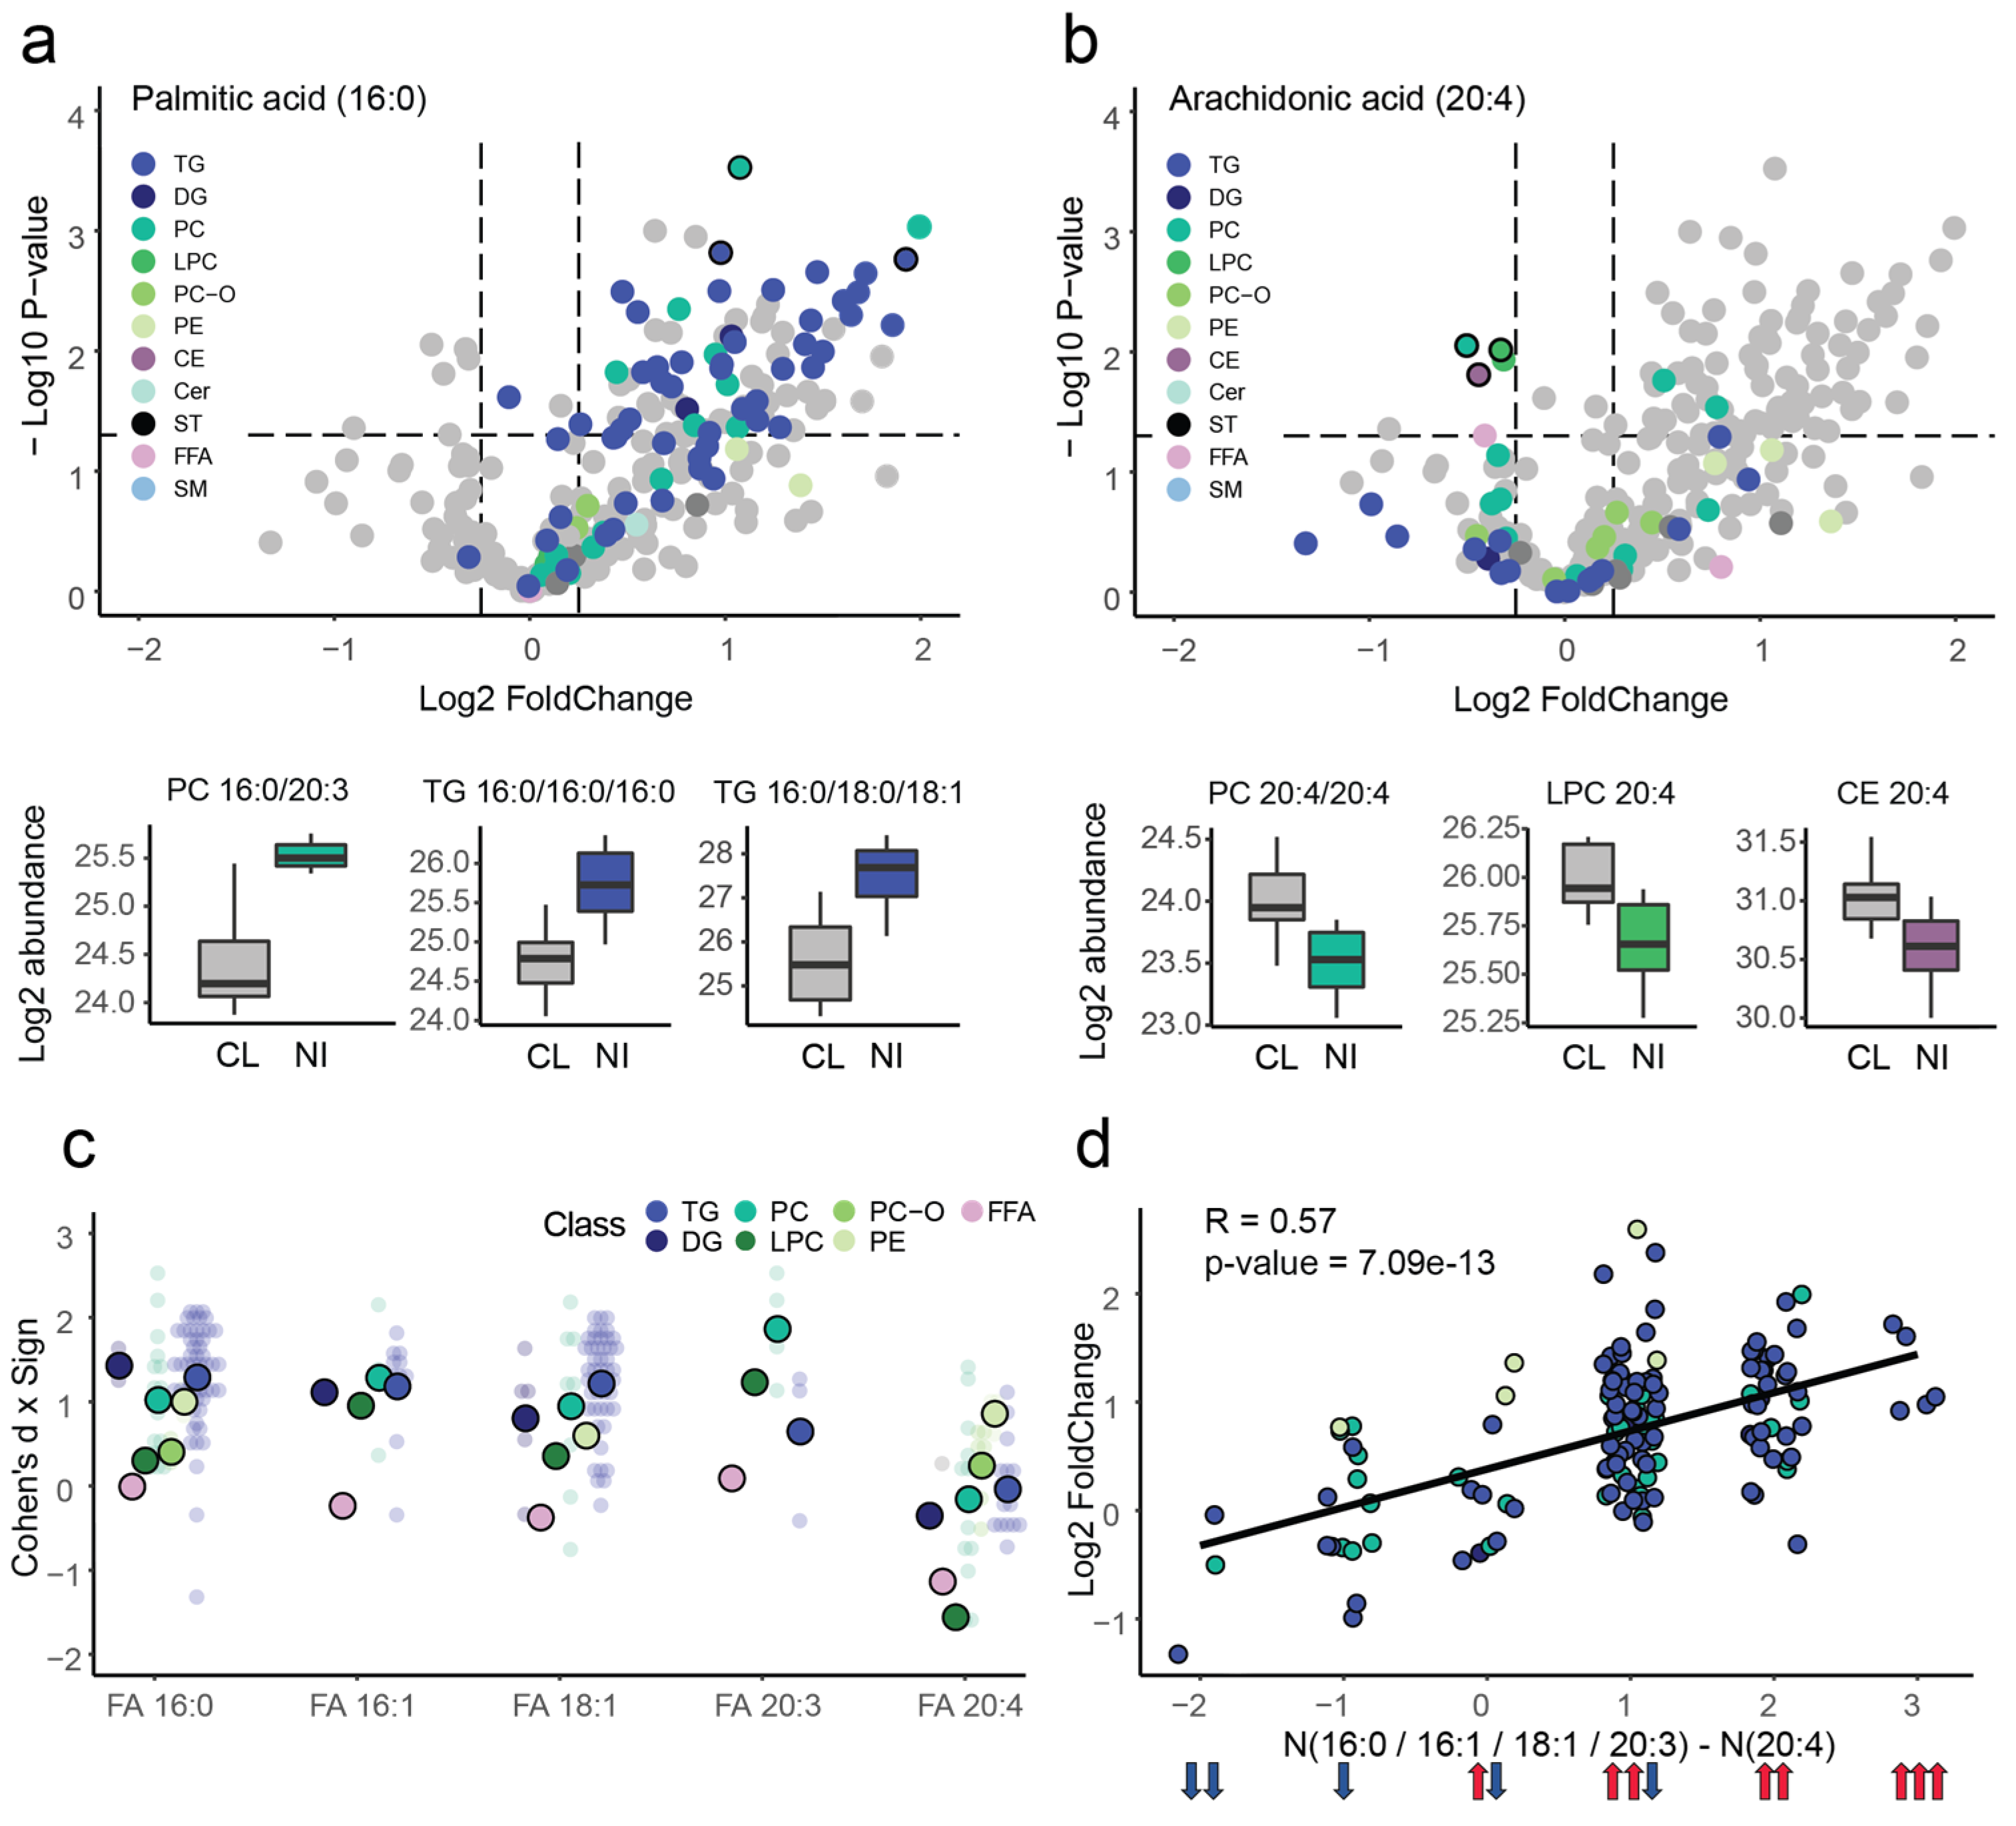
2.3. Interactions between Significant Lipid Classes and Fatty Acids
3. Discussion
4. Materials and Methods
4.1. Animals
4.2. Sciatic Nerve Constriction Surgery and Plasma Collection
4.3. Sample Preparation and Lipid Extraction
4.4. UPLC-MS Analysis
4.5. Data Processing and Analysis
5. Conclusions
Supplementary Materials
Author Contributions
Funding
Institutional Review Board Statement
Informed Consent Statement
Data Availability Statement
Conflicts of Interest
Abbreviations
| ACN | acetonitrile |
| CAR | acylcarnitine |
| Cer | ceramide |
| CE | cholesterol ester |
| DG | diacylglycerol |
| FFA | free fatty acid |
| HexCer | hexosylceramide |
| IPA | isopropyl alcohol |
| LPC | lysophosphatidylcholine |
| LPE | lysophosphatidylethanolamine |
| PC | phosphatidylcholine |
| PC-O | plasmanylphosphatidylcholine |
| PE | phosphatidylethanolamine |
| PE-O | plasmanylphosphatidylethanolamine |
| PE-P | plasmenylphosphatidylethanolamine |
| PI | phosphatidylinositol |
| SM | sphingomyelin |
| ST | sterol lipid |
| TG | triacylglycerol |
References
- Cohen, S.P.; Vase, L.; Hooten, W.M. Chronic pain: An update on burden, best practices, and new advances. Lancet 2021, 397, 2082–2097. [Google Scholar] [CrossRef] [PubMed]
- van Hecke, O.; Austin, S.K.; Khan, R.A.; Smith, B.H.; Torrance, N. Neuropathic pain in the general population: A systematic review of epidemiological studies. Pain 2014, 155, 654–662. [Google Scholar] [CrossRef] [PubMed]
- Burma, N.E.; Leduc-Pessah, H.; Fan, C.Y.; Trang, T. Animal models of chronic pain: Advances and challenges for clinical translation. J. Neurosci. Res. 2017, 95, 1242–1256. [Google Scholar] [CrossRef] [PubMed]
- Poitelon, Y.; Kopec, A.M.; Belin, S. Myelin Fat Facts: An Overview of Lipids and Fatty Acid Metabolism. Cells 2020, 9, 812. [Google Scholar] [CrossRef] [PubMed]
- Baron, R.; Binder, A.; Wasner, G. Neuropathic pain: Diagnosis, pathophysiological mechanisms, and treatment. Lancet Neurol. 2010, 9, 807–819. [Google Scholar] [CrossRef]
- Yao, J.K. Increased polyunsaturated fatty acids in developing and regenerating peripheral nerve. Biochim. Biophys. Acta (BBA)/Lipids Lipid Metab. 1982, 712, 542–546. [Google Scholar] [CrossRef]
- Mihara, Y.; Horikawa, M.; Sato, S.; Eto, F.; Hanada, M.; Banno, T.; Arima, H.; Ushirozako, H.; Yamada, T.; Xu, D.; et al. Lysophosphatidic acid precursor levels decrease and an arachidonic acid-containing phosphatidylcholine level increases in the dorsal root ganglion of mice after peripheral nerve injury. Neurosci. Lett. 2019, 698, 69–75. [Google Scholar] [CrossRef]
- Xu, D.; Omura, T.; Masaki, N.; Arima, H.; Banno, T.; Okamoto, A.; Hanada, M.; Takei, S.; Matsushita, S.; Sugiyama, E.; et al. Increased arachidonic acid-containing phosphatidylcholine is associated with reactive microglia and astrocytes in the spinal cord after peripheral nerve injury. Sci. Rep. 2016, 6, 26427. [Google Scholar] [CrossRef]
- Meyer zu Reckendorf, S.; Brand, C.; Pedro, M.T.; Hegler, J.; Schilling, C.S.; Lerner, R.; Bindila, L.; Antoniadis, G.; Knöll, B. Lipid metabolism adaptations are reduced in human compared to murine Schwann cells following injury. Nat. Commun. 2020, 11, 2123. [Google Scholar] [CrossRef]
- Ramli, D.; Aziz, I.; Mohamad, M.; Abdulahi, D.; Sanusi, J. The Changes in Rats with Sciatic Nerve Crush Injury Supplemented with Evening Primrose Oil: Behavioural, Morphologic, and Morphometric Analysis. Evid.-Based Complement. Altern. Med. 2017, 2017, 3476407. [Google Scholar] [CrossRef]
- El Soury, M.; Fornasari, B.; Carta, G.; Zen, F.; Haastert-Talini, K.; Ronchi, G. The role of dietary nutrients in peripheral nerve regeneration. Int. J. Mol. Sci. 2021, 22, 7417. [Google Scholar] [CrossRef] [PubMed]
- Chen, Y.-Y.; Feng, L.-M.; Xu, D.-Q.; Yue, S.-J.; Fu, R.-J.; Zhang, M.-M.; Tang, Y.-P. Combination of paeoniflorin and liquiritin alleviates neuropathic pain by lipid metabolism and calcium signaling coordination. Front. Pharmacol. 2022, 13, 944386. [Google Scholar] [CrossRef] [PubMed]
- Zhao, Y.-Y.; Cheng, X.-L.; Lin, R.-C. Lipidomics Applications for Discovering Biomarkers of Diseases in Clinical Chemistry. Int. Rev. Cell Mol. Biol. 2014, 313, 1–26. [Google Scholar] [CrossRef]
- Gowda, S.G.B.; Gao, Z.-J.; Chen, Z.; Abe, T.; Hori, S.; Fukiya, S.; Ishizuka, S.; Yokota, A.; Chiba, H.; Hui, S.-P. Untargeted lipidomic analysis of plasma from high-fat diet-induced obese rats using UHPLC–linear trap Quadrupole–Orbitrap MS. Anal. Sci. 2020, 36, 821–828. [Google Scholar] [CrossRef]
- Gowda, S.B.; Tsukui, T.; Fuda, H.; Minami, Y.; Gowda, D.; Chiba, H.; Hui, S.-P. docosahexaenoic acid esters of hydroxy fatty acid is a novel activator of NRF2. Int. J. Mol. Sci. 2021, 22, 7598. [Google Scholar] [CrossRef] [PubMed]
- Mantovani, A.; Dugo, C. Ceramides and risk of major adverse cardiovascular events: A meta-analysis of longitudinal studies. J. Clin. Lipidol. 2020, 14, 176–185. [Google Scholar] [CrossRef] [PubMed]
- Hilvo, M.; Vasile, V.C.; Donato, L.J.; Hurme, R.; Laaksonen, R. Ceramides and Ceramide Scores: Clinical Applications for Cardiometabolic Risk Stratification. Front. Endocrinol. 2020, 11, 570628. [Google Scholar] [CrossRef]
- Züllig, T.; Köfeler, H.C. High resolution mass spectrometry in lipidomics. Mass Spectrom. Rev. 2021, 40, 162–176. [Google Scholar] [CrossRef]
- Weng, J.; Li, D.D.; Jiang, B.G.; Yin, X.F. Temporal changes in the spinal cord transcriptome after peripheral nerve injury. Neural Regen. Res. 2020, 15, 1360–1367. [Google Scholar] [CrossRef]
- Li, S.; Xue, C.; Yuan, Y.; Zhang, R.; Wang, Y.; Wang, Y.; Yu, B.; Liu, J.; Ding, F.; Yang, Y.; et al. The transcriptional landscape of dorsal root ganglia after sciatic nerve transection. Sci. Rep. 2015, 5, 16888. [Google Scholar] [CrossRef]
- Alberghina, M.; Viola, M.; Moschella, F.; Giuffrida, A.M. Myelination of regenerating sciatic nerve of the rat: Lipid components and synthesis of myelin lipids. Neurochem. Res. 1983, 8, 133–150. [Google Scholar] [CrossRef] [PubMed]
- Rǎducan, A.; Miricǎ, S.; Duicu, O.; Rǎducan, S.; Muntean, D.; Fira-Mlǎdinescu, O.; Lighezan, R. Morphological and functional aspects of sciatic nerve regeneration after crush injury. Rom. J. Morphol. Embryol. 2013, 54, 735–739. [Google Scholar] [PubMed]
- Domenichiello, A.F.; Kitson, A.P.; Bazinet, R.P. Is docosahexaenoic acid synthesis from α-linolenic acid sufficient to supply the adult brain? Prog. Lipid Res. 2015, 59, 54–66. [Google Scholar] [CrossRef] [PubMed]
- Bazinet, R.P.; Layé, S. Polyunsaturated fatty acids and their metabolites in brain function and disease. Nat. Rev. Neurosci. 2014, 15, 771–785. [Google Scholar] [CrossRef]
- Naoe, S.; Tsugawa, H.; Takahashi, M.; Ikeda, K.; Arita, M. Characterization of lipid profiles after dietary intake of polyunsaturated fatty acids using integrated untargeted and targeted lipidomics. Metabolites 2019, 9, 241. [Google Scholar] [CrossRef]
- Bessesen, D.H.; Vensor, S.H.; Jackman, M.R. Trafficking of dietary oleic, linolenic, and stearic acids in fasted or fed lean rats. Am. J. Physiol.-Endocrinol. Metab. 2000, 278, E1124–E1132. [Google Scholar] [CrossRef]
- Yao, J.K.; Holman, R.T.; Lubozynski, M.F.; Dyck, P.J. Changes in fatty acid composition of peripheral nerve myelin in essential fatty acid deficiency. Arch. Biochem. Biophys. 1980, 204, 175–180. [Google Scholar] [CrossRef]
- Ichi, I.; Kono, N.; Arita, Y.; Haga, S.; Arisawa, K.; Yamano, M.; Nagase, M.; Fujiwara, Y.; Arai, H. Identification of genes and pathways involved in the synthesis of Mead acid (20:3n − 9), an indicator of essential fatty acid deficiency. Biochim. Biophys. Biochim. Biophys. Acta-Mol. Cell Biol. Lipids 2014, 1841, 204–213. [Google Scholar] [CrossRef]
- Spector, A.A. Plasma lipid transport. Clin. Physiol. Biochem. 1984, 2, 123–134. [Google Scholar]
- Lauretani, F.; Bandinelli, S.; Benedetta, B.; Cherubini, A.; Iorio, A.D.; Blè, A.; Giacomini, V.; Corsi, A.M.; Guralnik, J.M.; Ferrucci, L. Omega-6 and omega-3 fatty acids predict accelerated decline of peripheral nerve function in older persons. Eur. J. Neurol. 2007, 14, 801–808. [Google Scholar] [CrossRef]
- De Angelis, C.; Scarfò, C.; Falcinelli, M.; Reda, E.; Ramacci, M.T.; Angelucci, L. Levocarnitine acetyl stimulates peripheral nerve regeneration and neuromuscular junction remodelling following sciatic nerve injury. Int. J. Clin. Pharmacol. Res. 1992, 12, 269–279. [Google Scholar] [PubMed]
- Matyash, V.; Liebisch, G.; Kurzchalia, T.V.; Shevchenko, A.; Schwudke, D. Lipid extraction by methyl-terf-butyl ether for high-throughput lipidomics. J. Lipid Res. 2008, 49, 1137–1146. [Google Scholar] [CrossRef]
- Tsugawa, H.; Cajka, T.; Kind, T.; Ma, Y.; Higgins, B.; Ikeda, K.; Kanazawa, M.; VanderGheynst, J.; Fiehn, O.; Arita, M. MS-DIAL: Data-independent MS/MS deconvolution for comprehensive metabolome analysis. Nat. Methods 2015, 12, 523–526. [Google Scholar] [CrossRef] [PubMed]
- Liebisch, G.; Vizcaíno, J.A.; Köfeler, H.; Trötzmüller, M.; Griffiths, W.J.; Schmitz, G.; Spener, F.; Wakelam, M.J.O. Shorthand notation for lipid structures derived from mass spectrometry. J. Lipid Res. 2013, 54, 1523–1530. [Google Scholar] [CrossRef] [PubMed]
- R Core Team. R: A Language and Environment for Statistical Computing; R Foundation for Statistical Computing: Vienna, Austria, 2021. [Google Scholar]
- Wilkinson, L. ggplot2: Elegant Graphics for Data Analysis by WICKHAM, H. Biometrics 2011, 67, 678–679. [Google Scholar] [CrossRef]


Publisher’s Note: MDPI stays neutral with regard to jurisdictional claims in published maps and institutional affiliations. |
© 2022 by the authors. Licensee MDPI, Basel, Switzerland. This article is an open access article distributed under the terms and conditions of the Creative Commons Attribution (CC BY) license (https://creativecommons.org/licenses/by/4.0/).
Share and Cite
Senko, D.; Gorovaya, A.; Stekolshchikova, E.; Anikanov, N.; Fedianin, A.; Baltin, M.; Efimova, O.; Petrova, D.; Baltina, T.; Lebedev, M.A.; et al. Time-Dependent Effect of Sciatic Nerve Injury on Rat Plasma Lipidome. Int. J. Mol. Sci. 2022, 23, 15544. https://doi.org/10.3390/ijms232415544
Senko D, Gorovaya A, Stekolshchikova E, Anikanov N, Fedianin A, Baltin M, Efimova O, Petrova D, Baltina T, Lebedev MA, et al. Time-Dependent Effect of Sciatic Nerve Injury on Rat Plasma Lipidome. International Journal of Molecular Sciences. 2022; 23(24):15544. https://doi.org/10.3390/ijms232415544
Chicago/Turabian StyleSenko, Dmitry, Anna Gorovaya, Elena Stekolshchikova, Nickolay Anikanov, Artur Fedianin, Maxim Baltin, Olga Efimova, Daria Petrova, Tatyana Baltina, Mikhail A. Lebedev, and et al. 2022. "Time-Dependent Effect of Sciatic Nerve Injury on Rat Plasma Lipidome" International Journal of Molecular Sciences 23, no. 24: 15544. https://doi.org/10.3390/ijms232415544
APA StyleSenko, D., Gorovaya, A., Stekolshchikova, E., Anikanov, N., Fedianin, A., Baltin, M., Efimova, O., Petrova, D., Baltina, T., Lebedev, M. A., Khaitovich, P., & Tkachev, A. (2022). Time-Dependent Effect of Sciatic Nerve Injury on Rat Plasma Lipidome. International Journal of Molecular Sciences, 23(24), 15544. https://doi.org/10.3390/ijms232415544