Article

miR−122−5p Regulates Renal Fibrosis In Vivo

1
Division of Nephrology, First Department of Integrated Medicine, Saitama Medical Center, Jichi Medical University, Saitama 330-8503, Japan
2
Division of Intensive Care Unit, First Department of Integrated Medicine, Saitama Medical Center, Jichi Medical University, Saitama 330-8503, Japan
3
Department of Medical Physiology, Meiji Pharmaceutical University, Tokyo 204-8588, Japan
*
Author to whom correspondence should be addressed.
Int. J. Mol. Sci. 2022, 23(23), 15423; https://doi.org/10.3390/ijms232315423
Submission received: 19 November 2022 / Revised: 1 December 2022 / Accepted: 3 December 2022 / Published: 6 December 2022
(This article belongs to the Special Issue Cellular and Molecular Research of Kidney Diseases)

Abstract

:
The role of exogenous microRNAs (miRNAs) in renal fibrosis is poorly understood. Here, the effect of exogenous miRNAs on renal fibrosis was investigated using a renal fibrosis mouse model generated by unilateral ureteral obstruction (UUO). miRNA microarray analysis and quantitative reverse-transcription polymerase chain reaction showed that miR−122−5p was the most downregulated (0.28-fold) miRNA in the kidneys of UUO mice. The injection of an miR−122−5p mimic promoted renal fibrosis and upregulated COL1A2 and FN1, whereas an miR−122−5p inhibitor suppressed renal fibrosis and downregulated COL1A2 and FN1. The expression levels of fibrosis-related mRNAs, which were predicted targets of miR−122−5p, were evaluated. The expression level of TGFBR2, a pro-fibrotic mRNA, was upregulated by the miR−122−5p mimic, and the expression level of FOXO3, an anti−fibrotic mRNA, was upregulated by the miR−122−5p inhibitor. The protein expressions of TGFBR2 and FOXO3 were confirmed by immunohistochemistry. Additionally, the expression levels of LC3, downstream anti-fibrotic mRNAs of FOXO3, were upregulated by the miR−122−5p inhibitor. These results suggest that miR−122−5p has critical roles in renal fibrosis.

1. Introduction

Chronic kidney disease (CKD) is currently a major public health problem associated with patient mortality [1,2]. The prevalence of CKD worldwide is increasing rapidly [1,2,3]. CKD develops and progresses with hypertension, diabetes, and dyslipidemia [3]. In addition, CKD is associated with an increased risk of cardiovascular disease [4]. Various therapeutic agents have been proposed for the management of patients with CKD, including the management of hypertension, diabetes, and dyslipidemia [3]. However, these therapeutic agents are not specific for the treatment of CKD [3]. Therefore, establishing effective and specific therapeutic agents for CKD is required.
One of the most important pathological features of CKD is renal fibrosis [5,6,7,8,9], which is associated with complex pathological mechanisms including inflammation and apoptosis and is characterized by the accumulation of extracellular matrix in the renal interstitial area [5,6,7,8,9,10]. Renal fibrosis is considered the final and common pathway for the progression of end-stage CKD [5,6,7,8,9,10]. Therefore, establishing a therapeutic strategy for renal fibrosis is considered critical for preventing CKD [5,6,7,8,9]. However, renal fibrosis involves complex processes including many types of cells, such as renal tubular cells, vascular endothelial cells, and bone marrow derived cells. Currently, no effective treatments for renal fibrosis have been established [1,9].
Many recent reports have demonstrated the importance of microRNAs (miRNAs), a functional nucleic acid, in disease [11,12]. miRNAs are non-coding small RNAs with a length of 21–25 bases that regulate various pathological conditions and diseases by repressing the 3′ untranslated region of target messenger RNAs (mRNAs) [11,12]. Several studies showed that miRNAs have an important role in tissue fibrosis in various organs [13,14]. In the kidney, several miRNAs have been associated with renal fibrosis, and both anti-fibrotic and pro-fibrotic miRNAs have been identified [3,13,14,15,16,17,18,19,20]. These reports suggest the possibility of exogenic miRNAs as novel therapeutic targets for renal fibrosis. However, few studies have investigated the effects of exogenous miRNAs on renal fibrosis in vivo [9,21,22,23]. Therefore, the investigation of miRNAs that may regulate renal fibrosis is critical for identifying potential therapeutic agents for renal fibrosis.
In this study, we screened miRNAs in a renal fibrotic mouse model to identify those associated with renal fibrosis in vivo. We also investigated the effects and mechanisms of the candidate miRNAs in the renal fibrotic mouse model.

2. Results

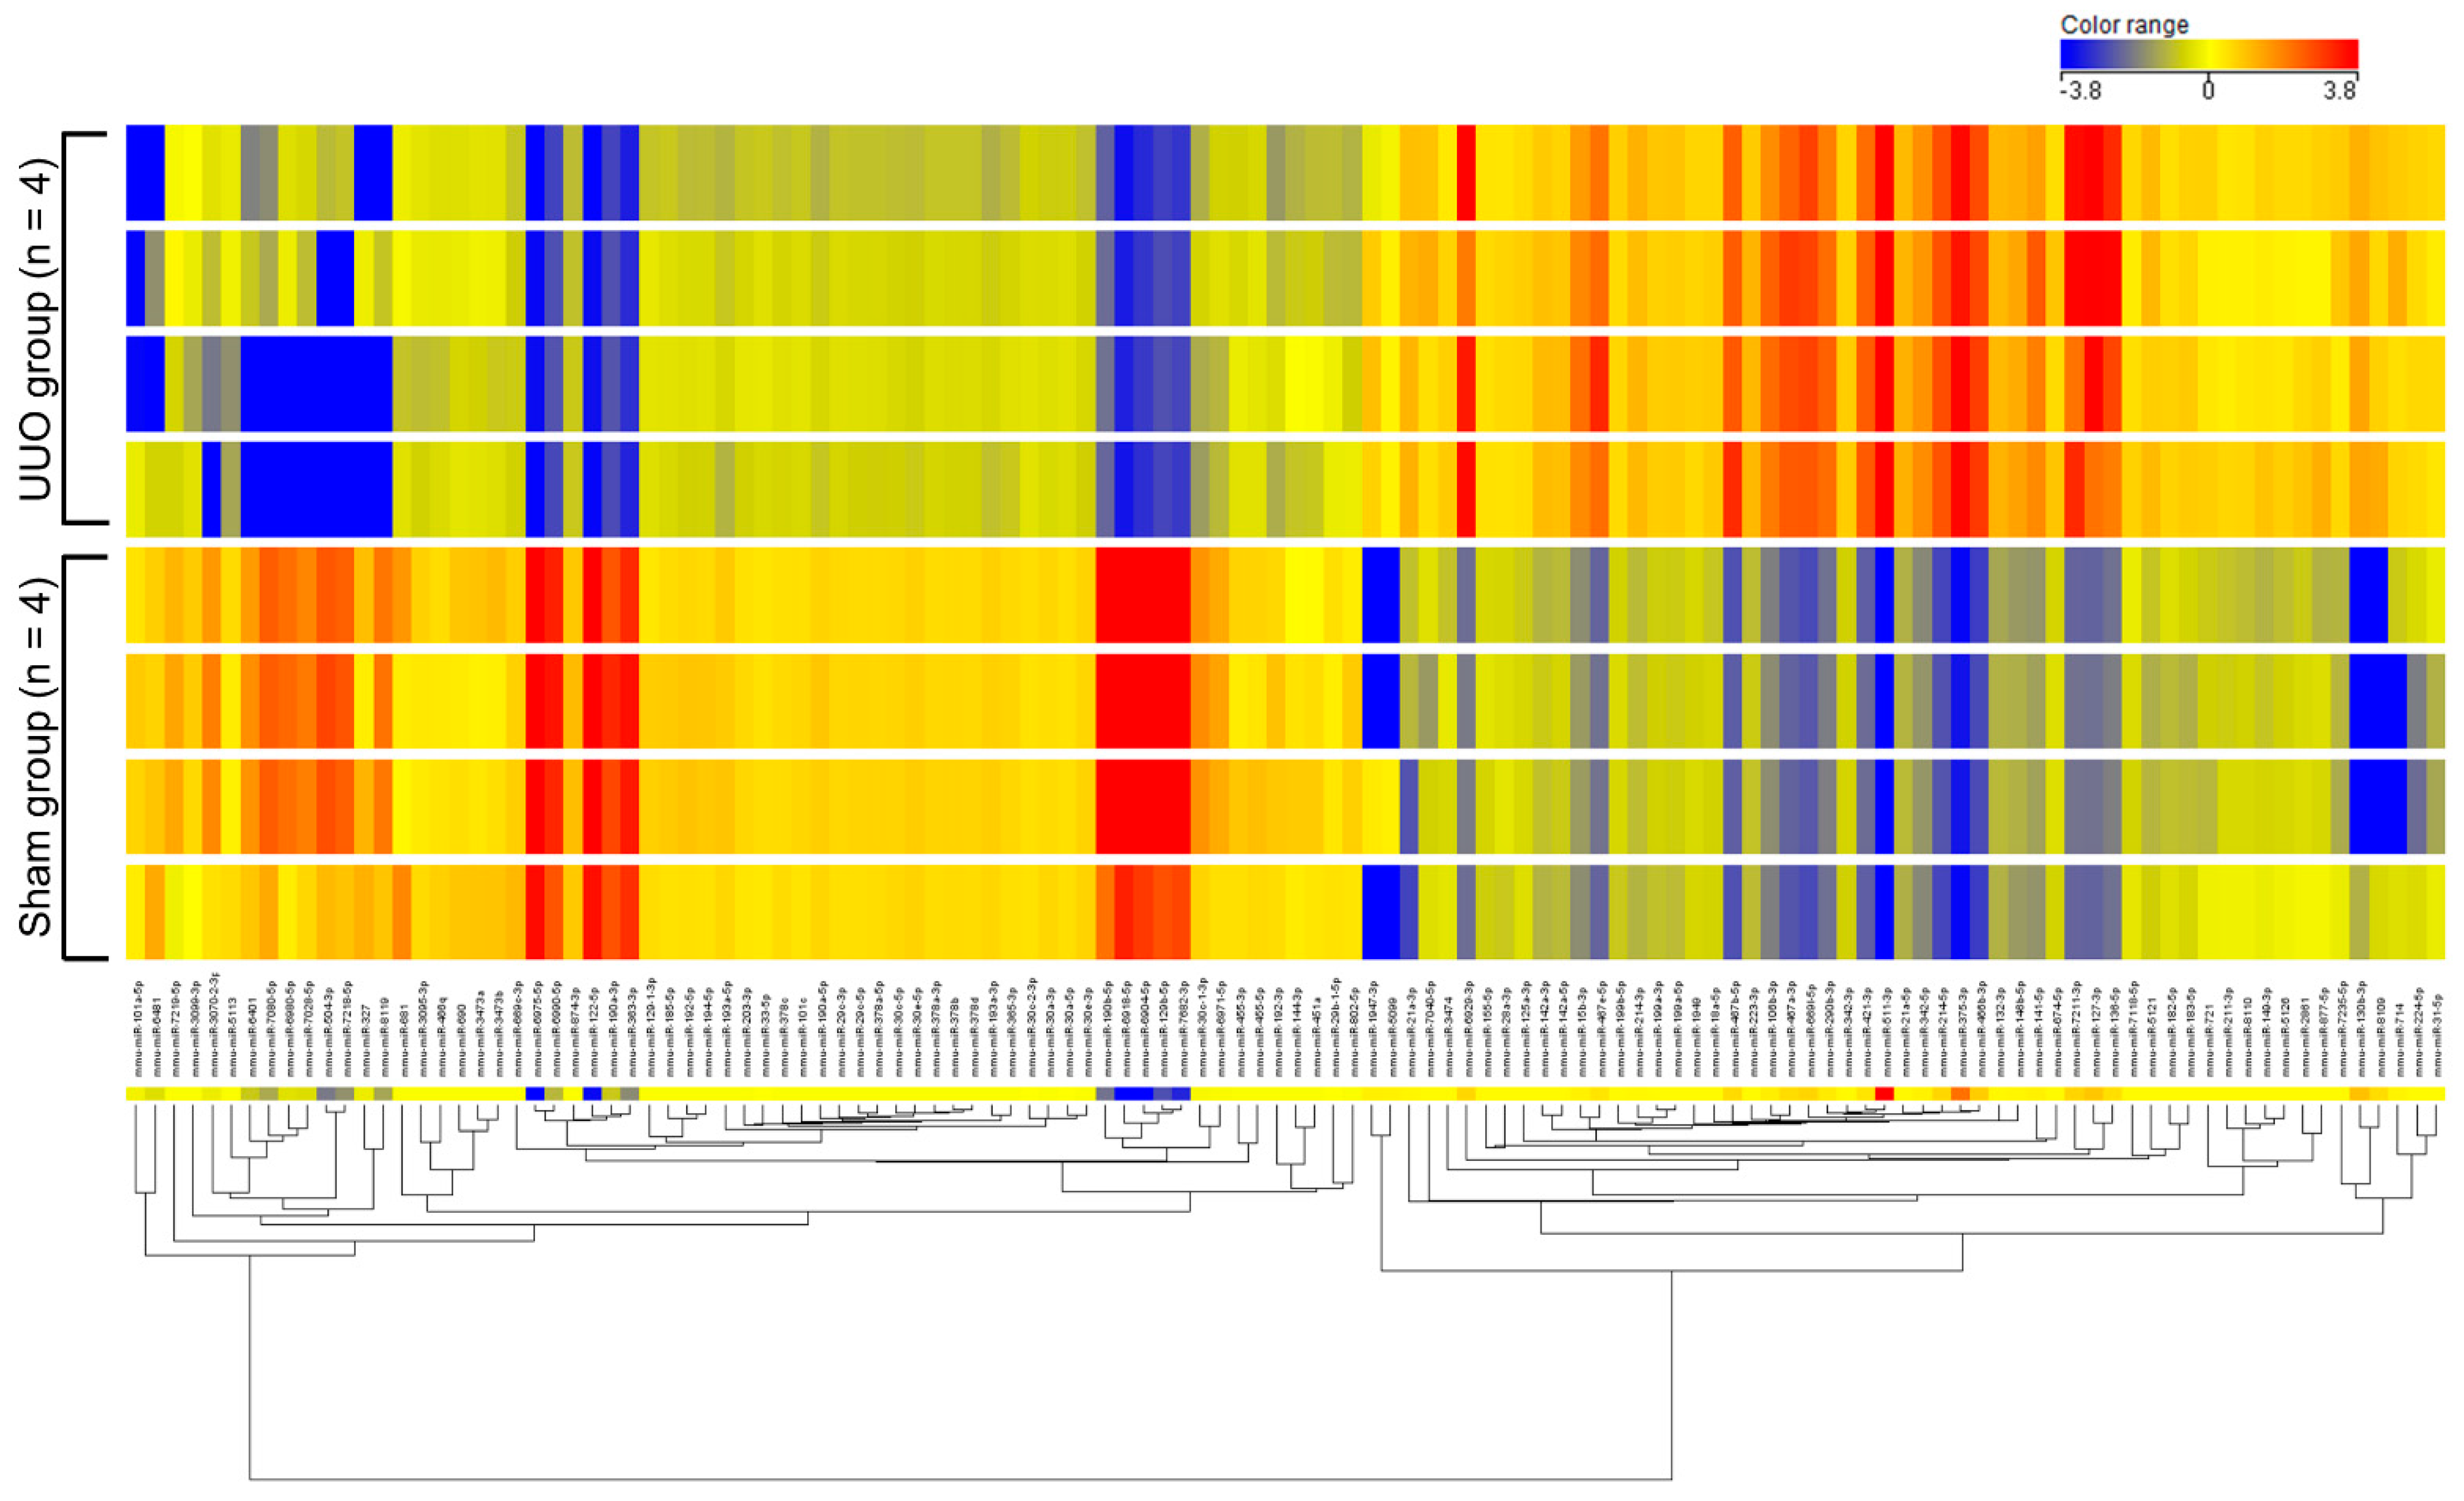
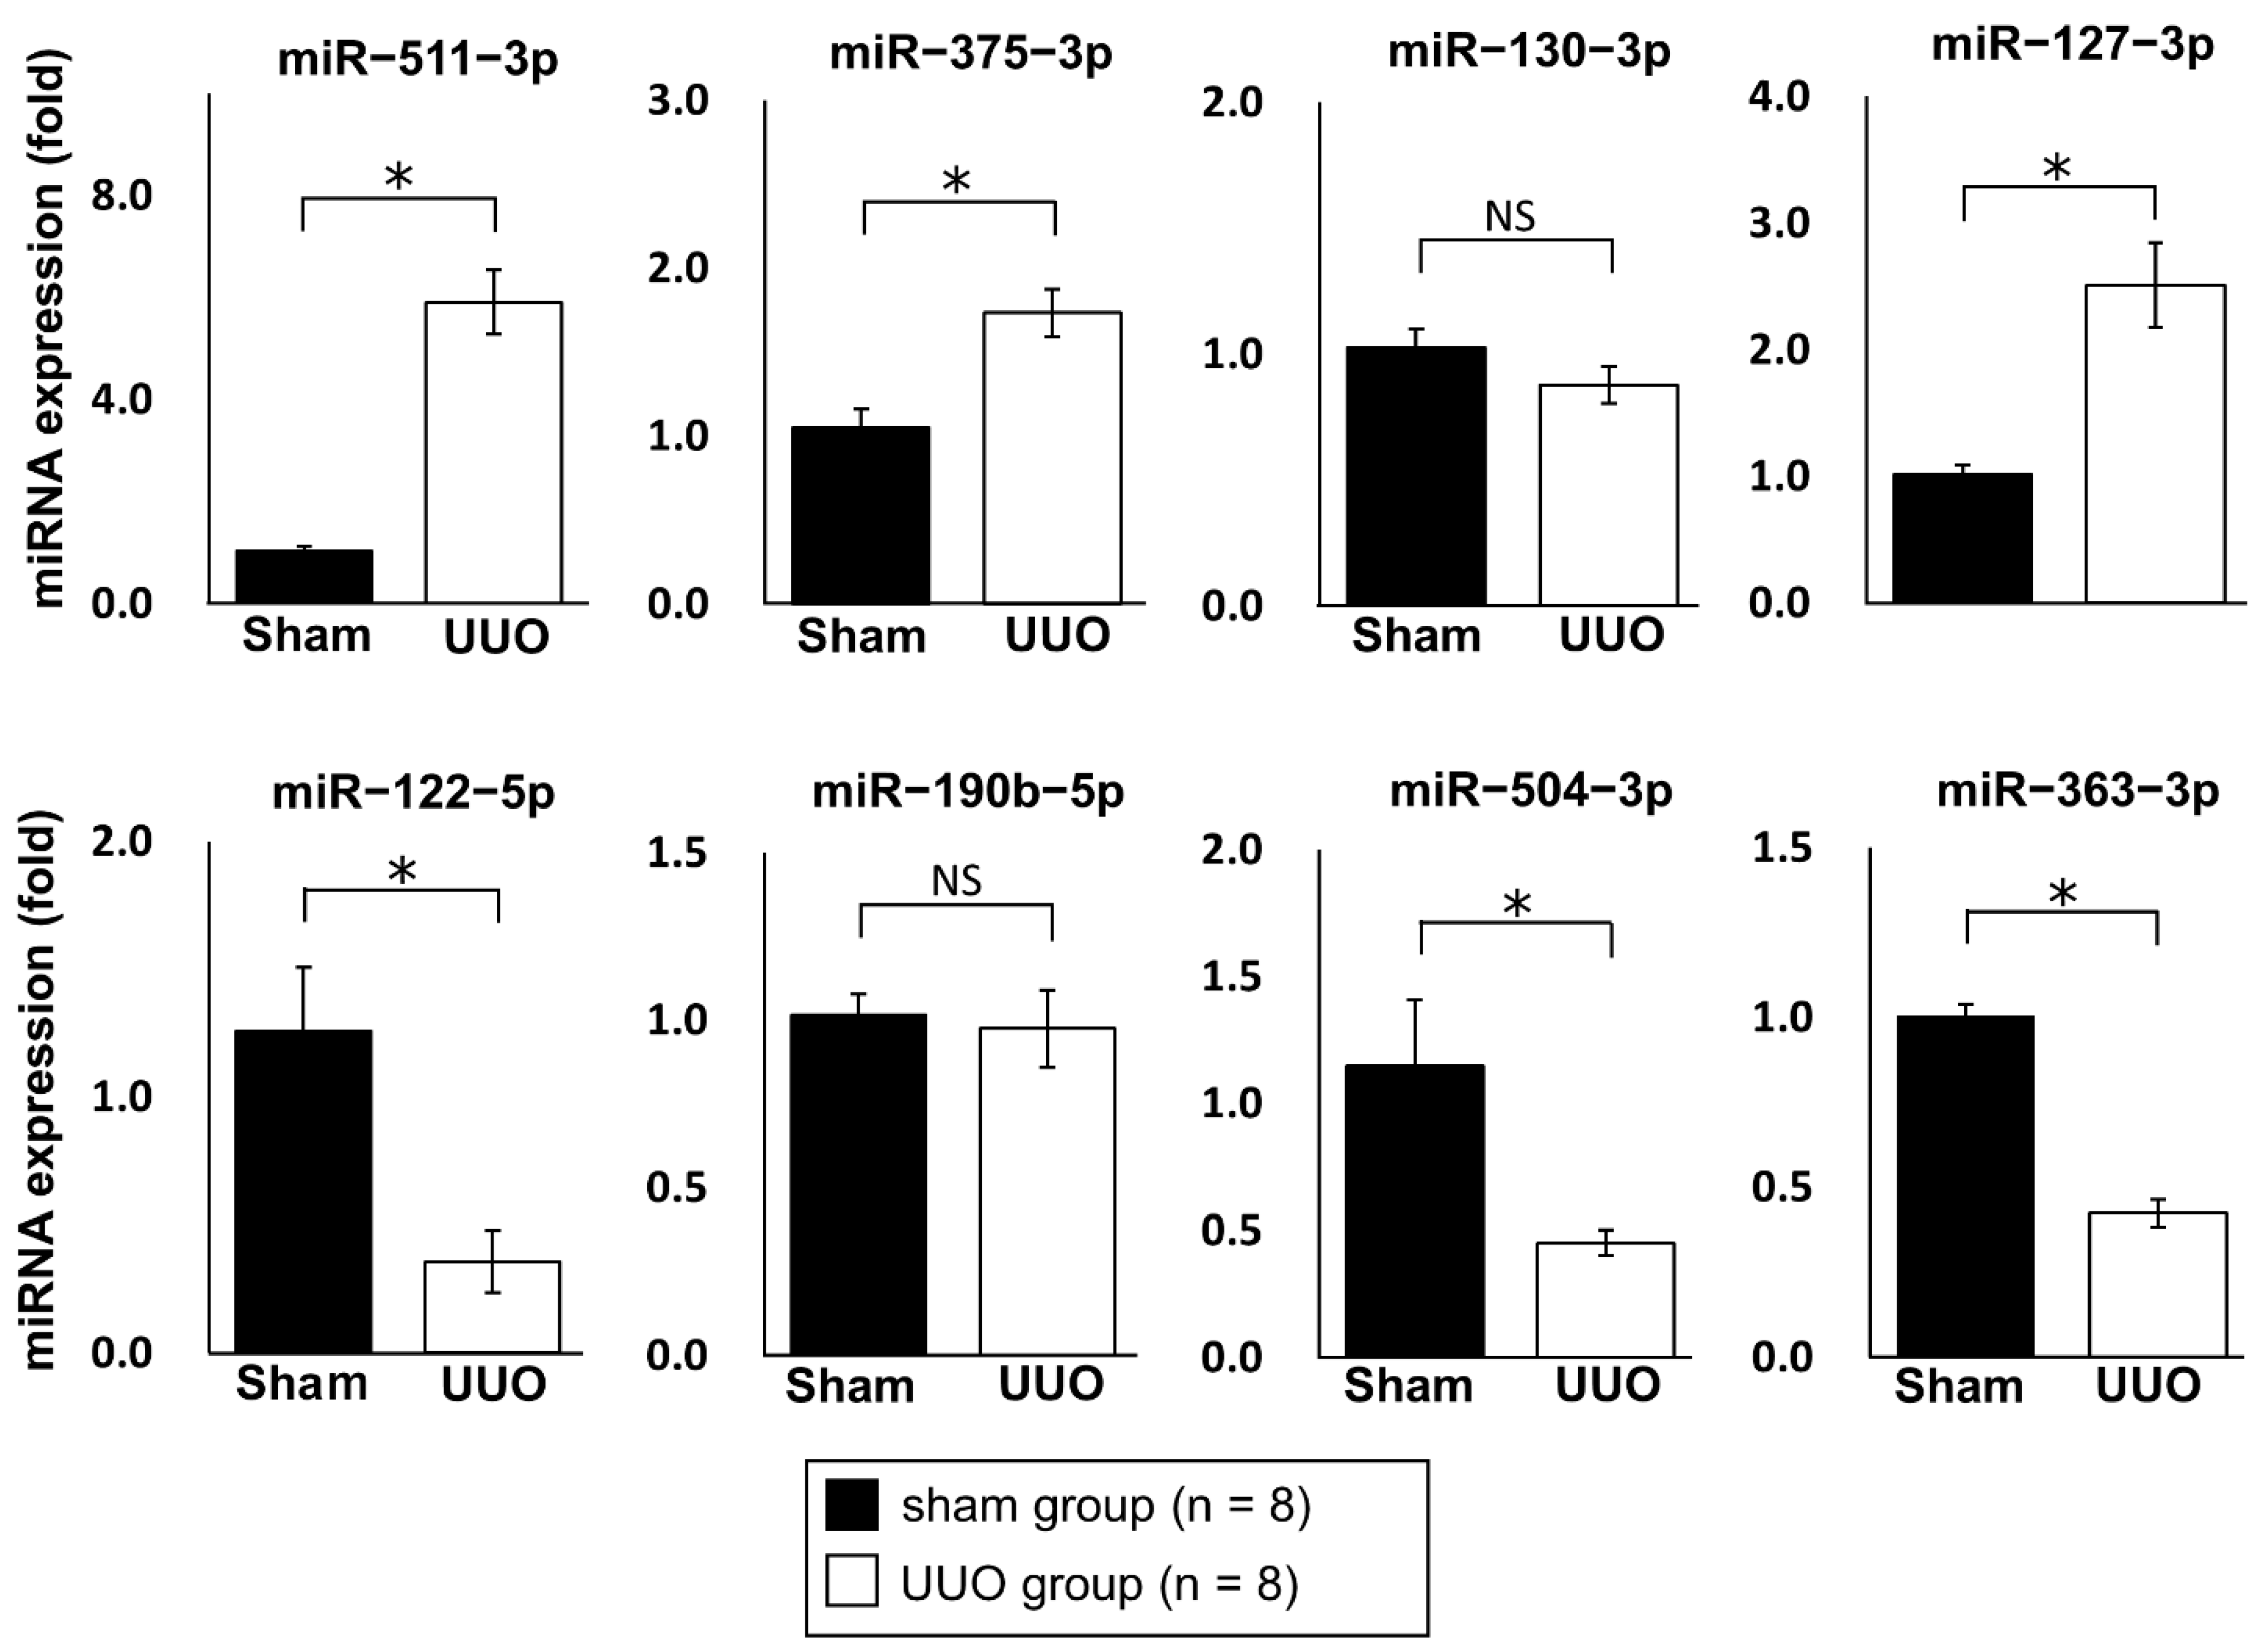
2.1. Profiling of miRNAs in Renal Fibrosis

We examined differentially expressed miRNAs in renal fibrosis by analyzing the expression of 1915 miRNAs [miRBase database release 21.0; www.mirbase.org (accessed on 03 February 2016)] in a renal fibrotic mouse model established by unilateral ureteral obstruction (UUO) using miRNA microarray analysis. Sixteen mice were randomly divided into two groups: UUO group (n = 8) and sham group (n = 8). After surgery, kidneys were collected, miRNAs were extracted, and eight samples [UUO group (n = 4) and sham group (n = 4)] with especially high quality were selected (details are given in the Materials and Methods). The expression levels of miRNAs were compared between the two groups. The results showed that 109 miRNAs were upregulated more than 2-fold in the kidneys of UUO mice compared with sham surgery mice, and 113 miRNAs were downregulated less than 0.5-fold in the kidneys of UUO mice compared with sham surgery mice (Table 1, Figure 1). The top 10 upregulated miRNAs and bottom 10 downregulated miRNAs were selected as candidates for further analysis. Of these 20 miRNAs, those previously reported to be associated with renal fibrosis were excluded. The remaining eight miRNAs (miR−511−3p, −375−3p, −130−3p, −127−3p, −122−5p, −190b−5p, −504−3p, and −363−3p) were quantitatively evaluated by quantitative real-time reverse−transcription polymerase chain reaction (qRT-PCR) (Figure 2). In this process, sixteen mice [UUO group (n = 8) or sham group (n = 8)] described above were used as samples. qRT-PCR analysis showed that three miRNAs (miR−511−3p, −375−3p, and −127−3p) were significantly upregulated and three miRNAs (miR−122−5p, −504−3p, and −363−3p) were significantly downregulated in the kidneys of UUO mice compared with control mice. The expression level of miR−122−5p was the most highly downregulated miRNA (0.28-fold downregulated in UUO mice compared with control mice). Therefore, we focused on miR−122−5p in subsequent experiments.

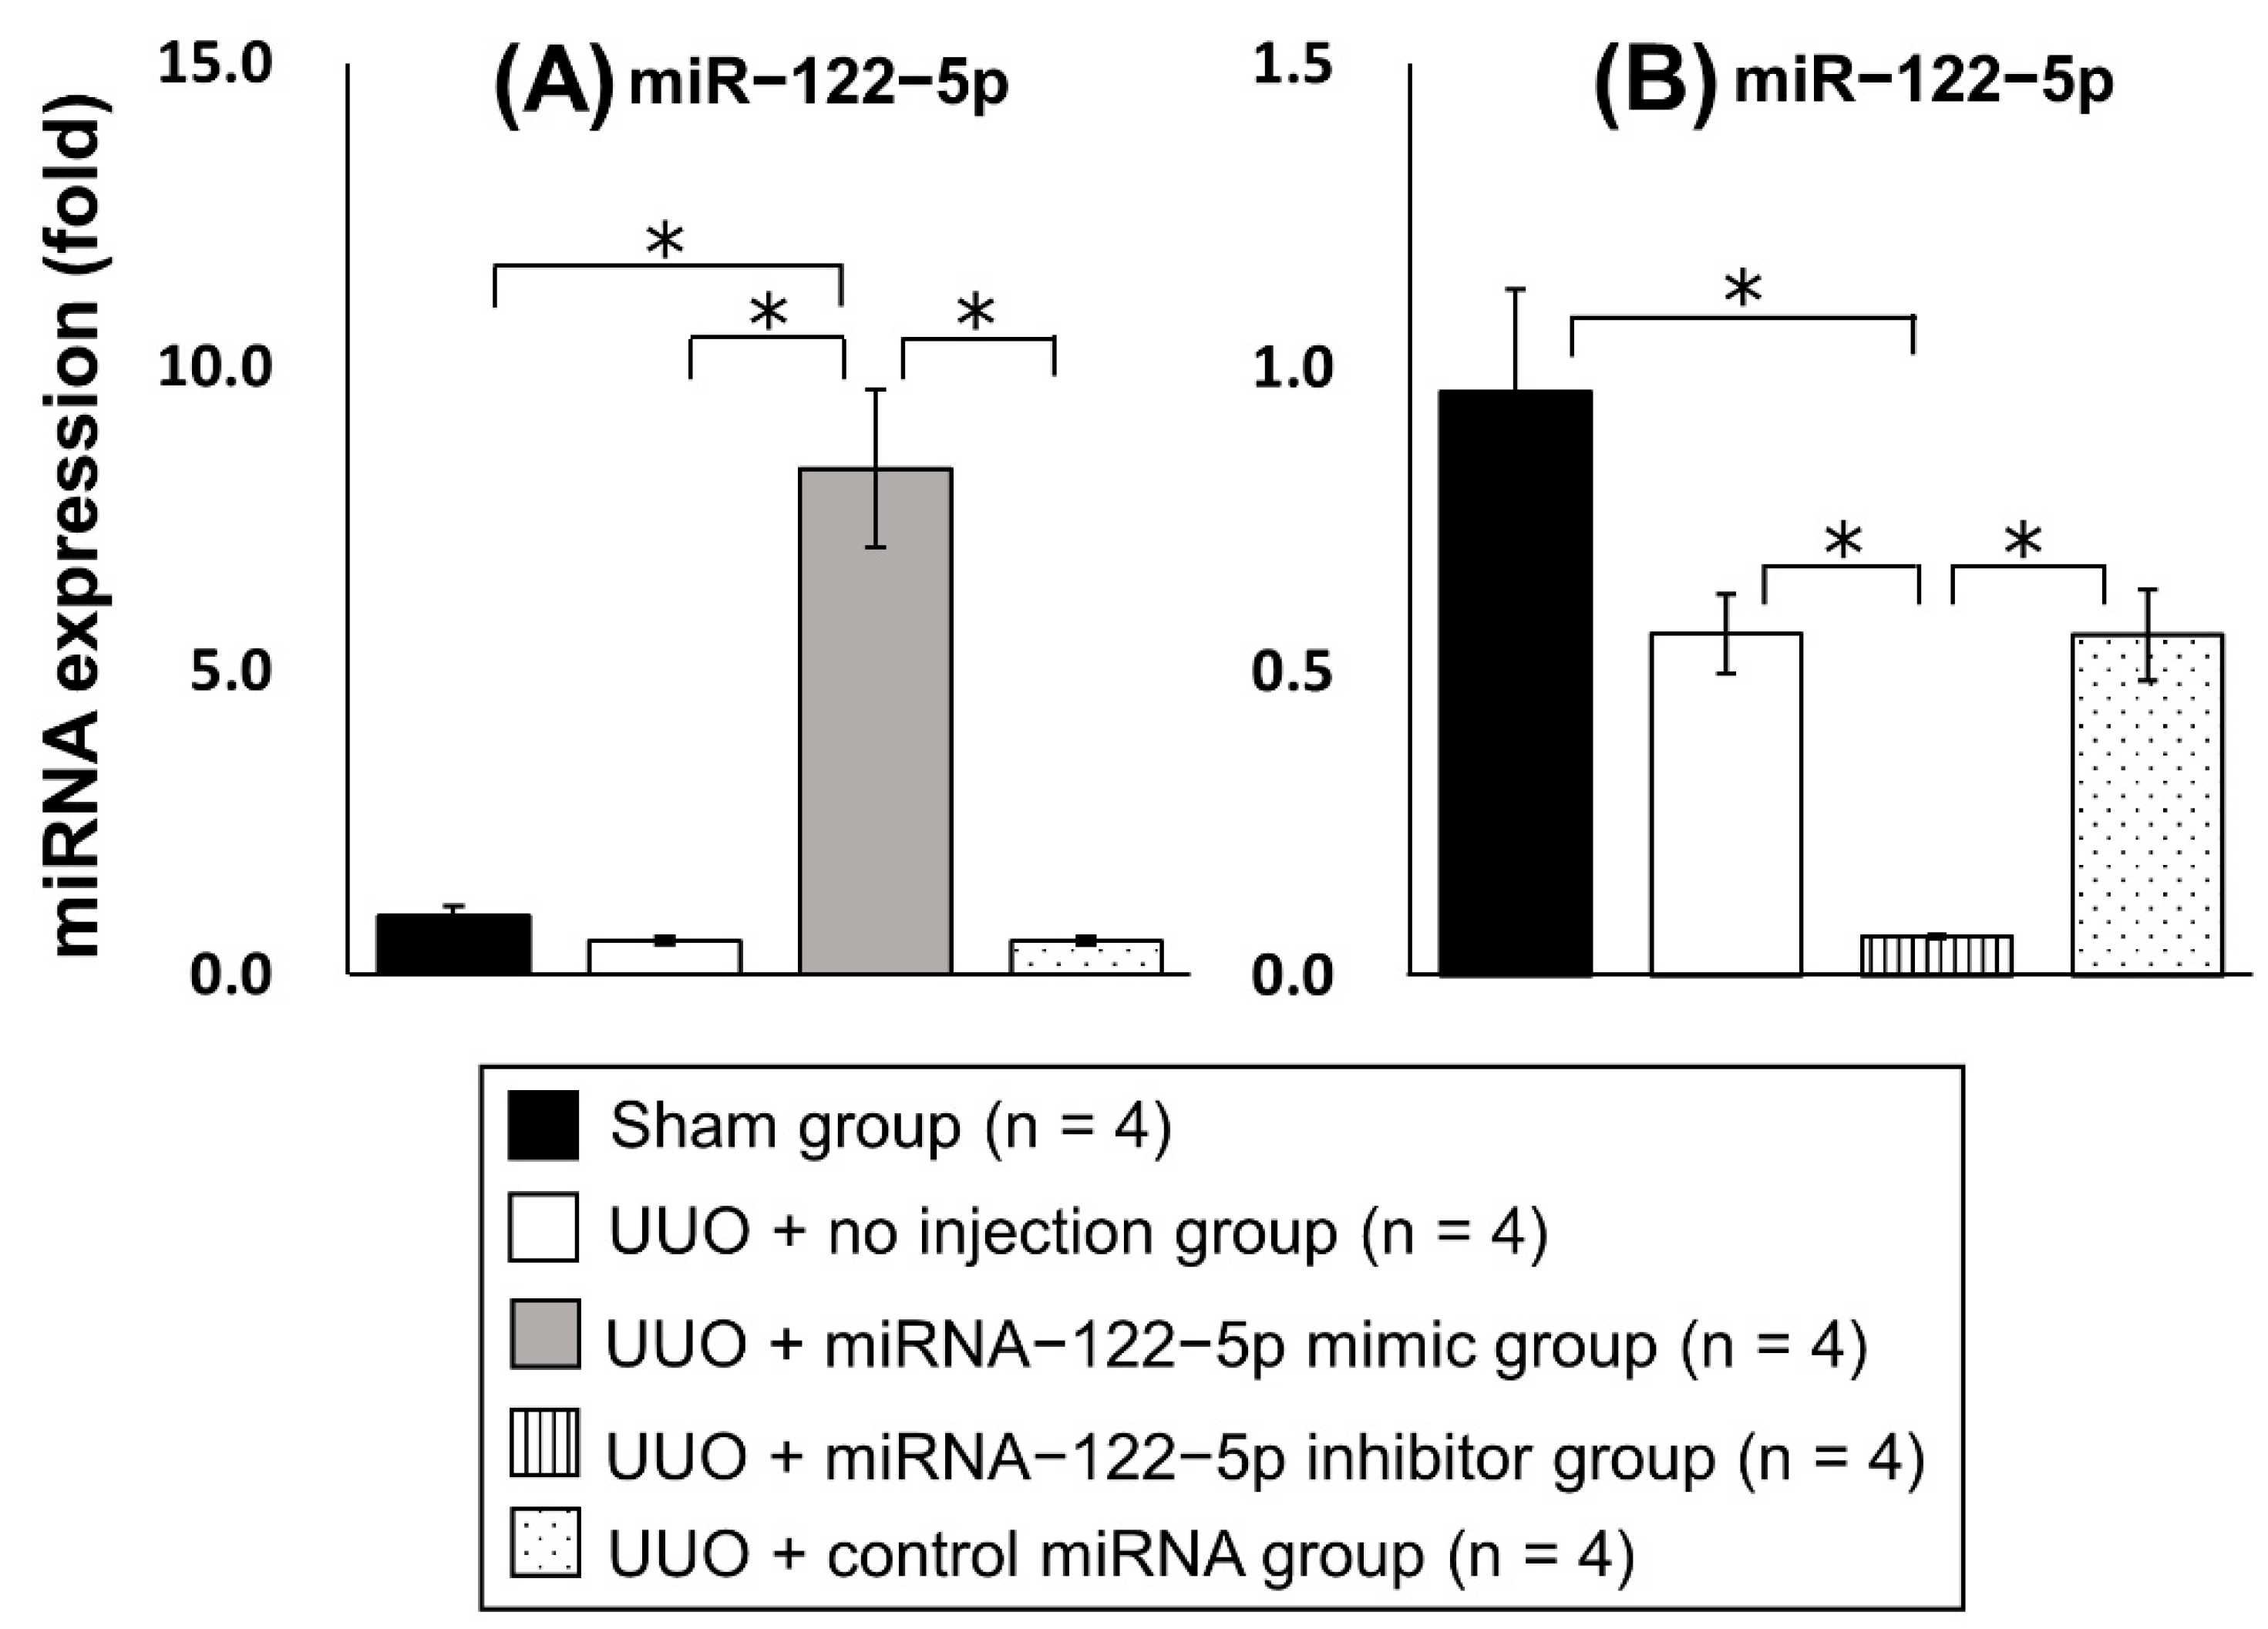
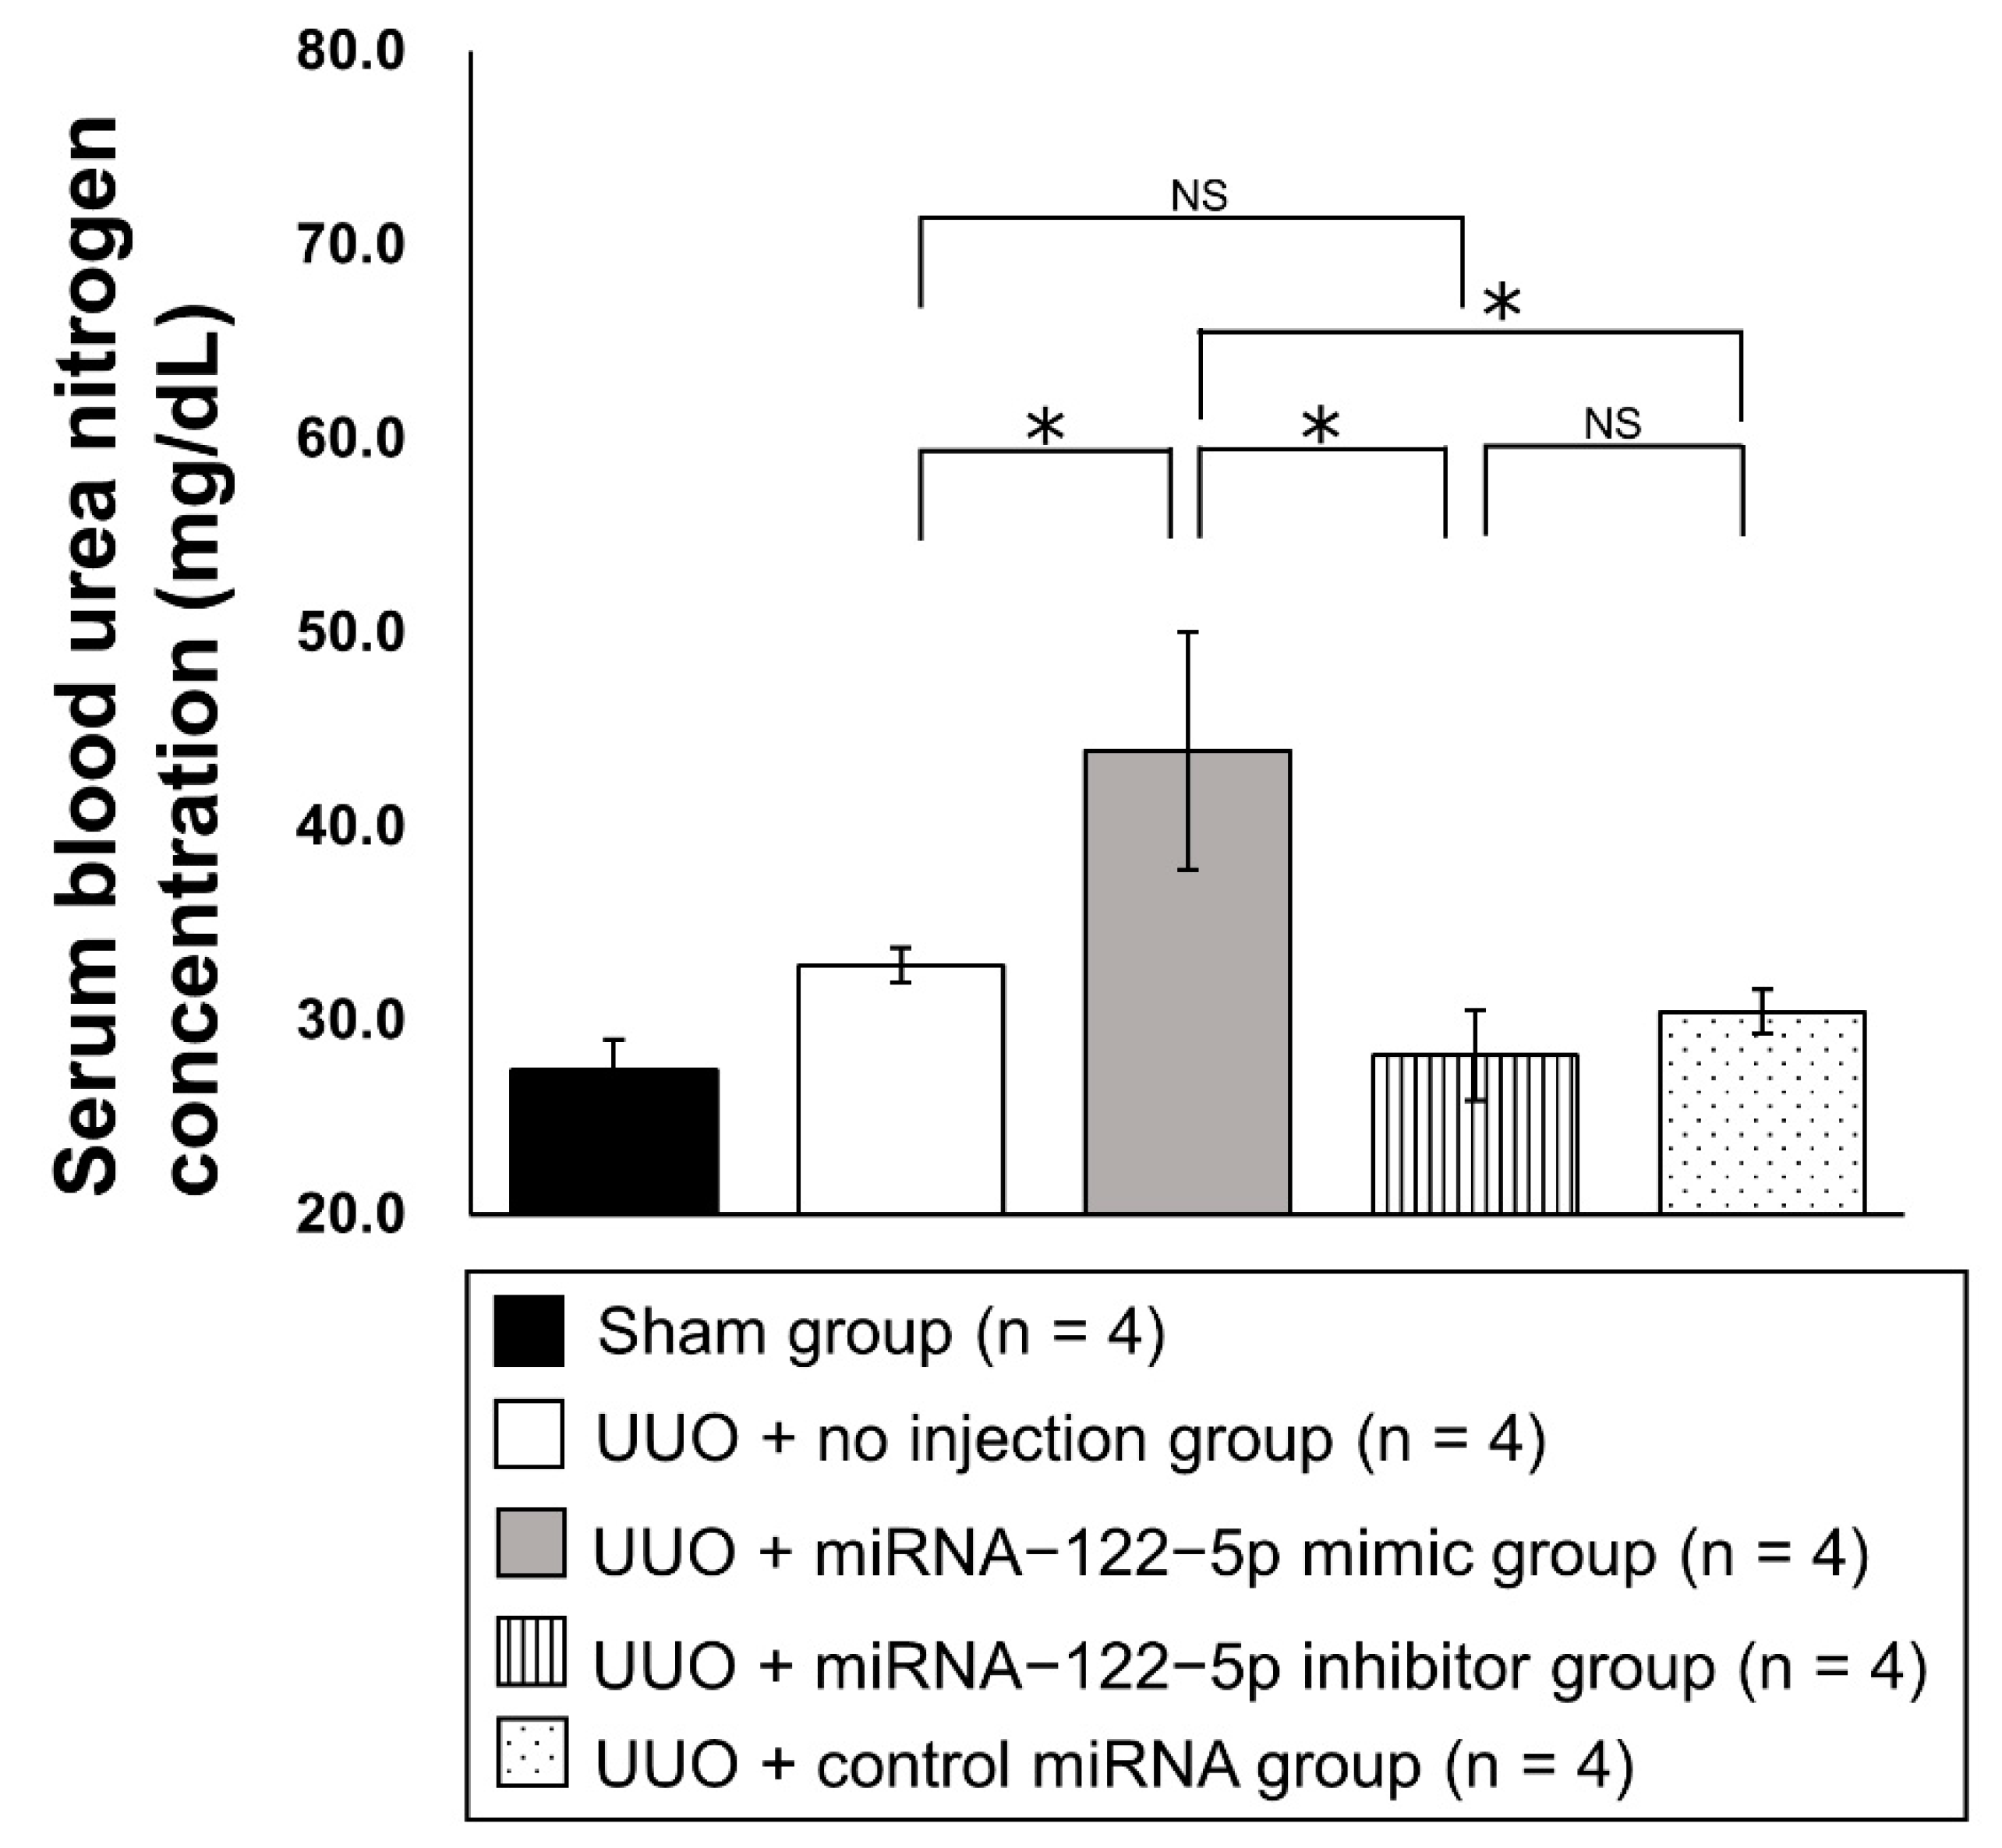
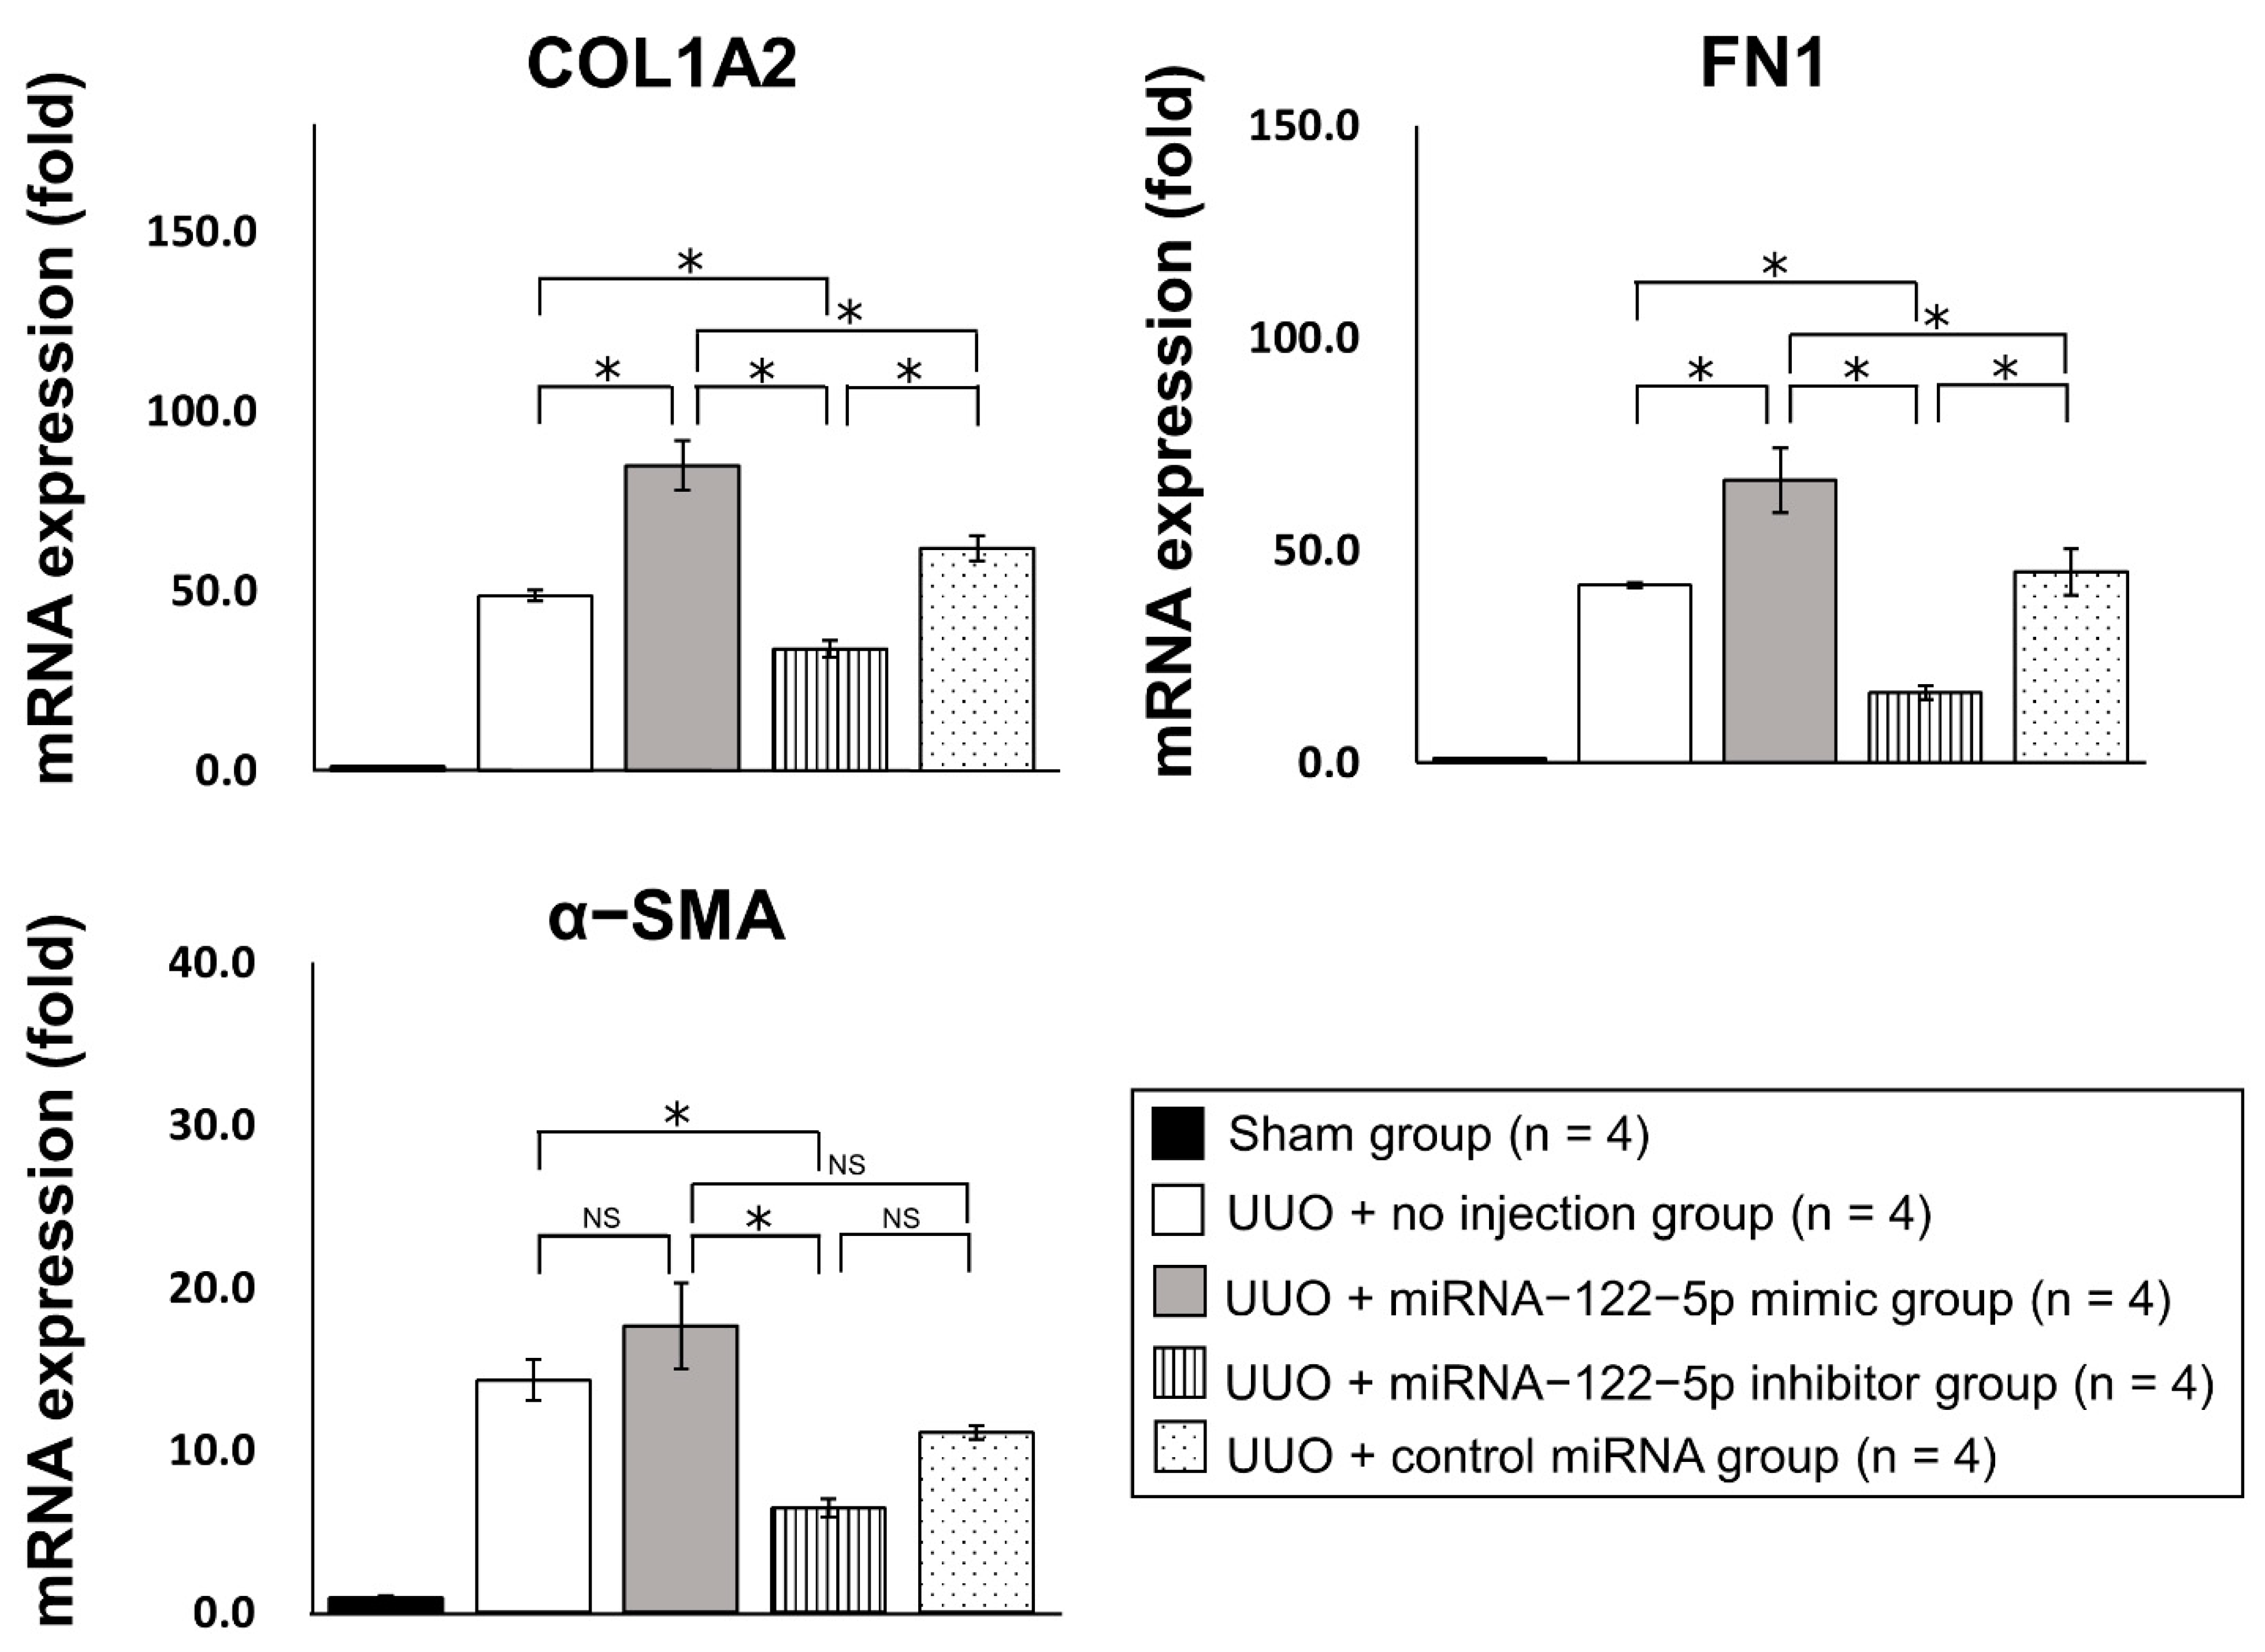
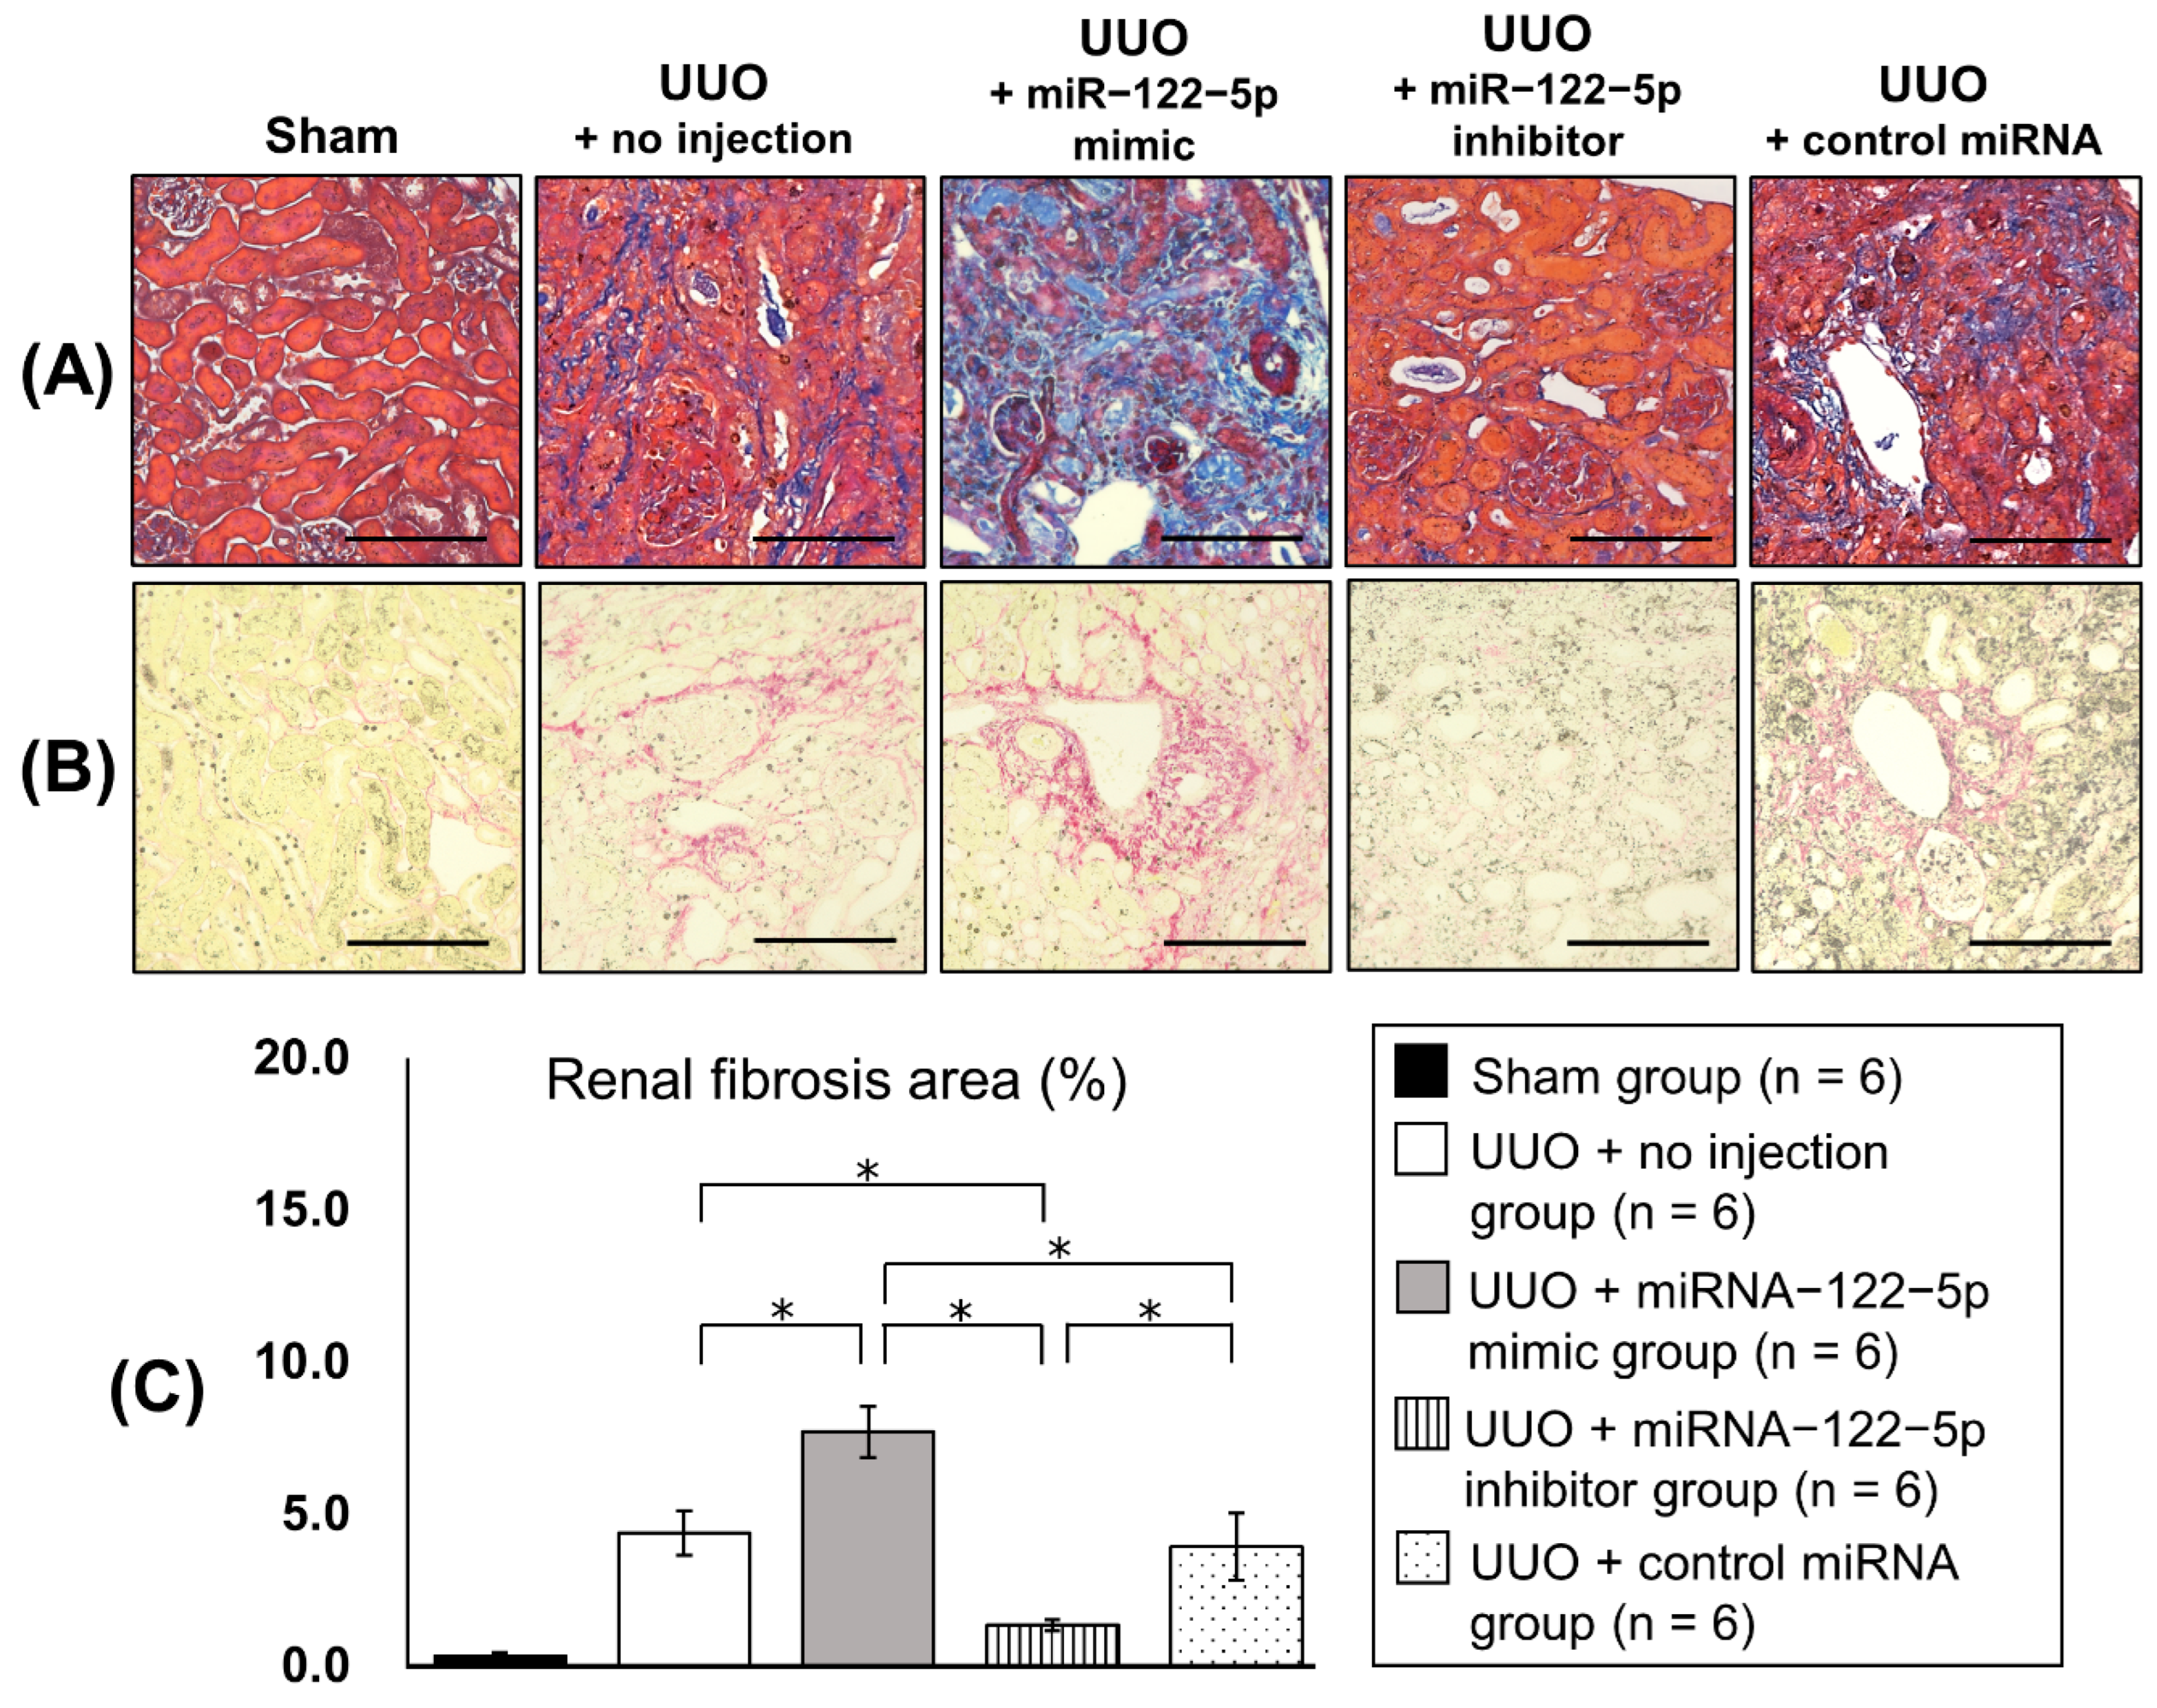
2.2. Regulation of Renal Fibrosis by a Mimic and Inhibitor of miR−122−5p

Twenty new mice were randomly divided into five groups: sham group (n = 4), UUO + no injection group (n = 4), UUO + miR−122−5p mimic group (n = 4), UUO + miR−122−5p inhibitor group (n = 4), and UUO + control miRNA group (n = 4) (details are given in the Materials and Methods). After each treatment and surgery, kidneys and serum were collected. The modulation of miR−122−5p expression levels by an miR−122−5 mimic and miR−122−5 inhibitor was confirmed by qRT−PCR; the miR−122−5p mimic significantly enhanced the expression of miR−122−5p, and the miR−122−5p inhibitor significantly suppressed the expression of miR−122−5p (Figure 3). Although the expression of miR−122−5p in the UUO + no injection group showed a decreasing trend compared with the sham group, this did not reach statistical significance (Supplementary Figure S1). We also confirmed that contralateral kidneys showed no change in response to the overexpression or inhibition of miR−122−5p. Next, we evaluated the expression of three genes that are increased in renal fibrosis [collagen 1A2 (COL1A2), fibronectin 1 (FN1), and α-smooth muscle actin (α-SMA)]. The expressions of COL1A2, FN1, and α-SMA were significantly enhanced in the UUO + no injection group compared with the sham group (Supplementary Figure S2). COL1A2 and FN1 were upregulated in the UUO + miR−122−5p mimic group compared with the UUO + control miRNA group and UUO + no injection group. In contrast, COL1A2 and FN1 mRNAs were downregulated in the UUO + miR−122−5p inhibitor group compared with the UUO + control miRNA group and UUO + no injection group (Figure 4). Although a similar tendency was observed with the expression of α-SMA, there was no statistical significance. Renal fibrosis was enhanced in the UUO + miR−122−5p mimic group, as shown by AZAN staining and Sirius red staining, whereas renal fibrosis was suppressed in the UUO + miR−122−5p inhibitor group (Figure 5). The renal fibrosis area in the UUO + no injection group was significantly larger than that in the sham group (Supplementary Figure S3). The renal fibrosis area in the UUO + miR−122−5p mimic group was larger than that in the UUO + control miRNA group and UUO + no injection group, whereas the area was reduced in the UUO + miR−122−5p inhibitor group compared with the UUO + control miRNA group and UUO + no injection group (Figure 5). Serum blood urea nitrogen (BUN) concentrations were significantly increased in the UUO + no injection group compared with the sham group (Supplementary Figure S4). Serum BUN concentrations were significantly increased in the UUO + miR−122−5p mimic group compared with the UUO + control miRNA group and UUO + no injection group. Although a lower trend of serum BUN concentration in the UUO + miR−122−5p inhibitor group was observed, the difference was not significant compared with the UUO + control miRNA group and UUO + no injection group (Figure 6).

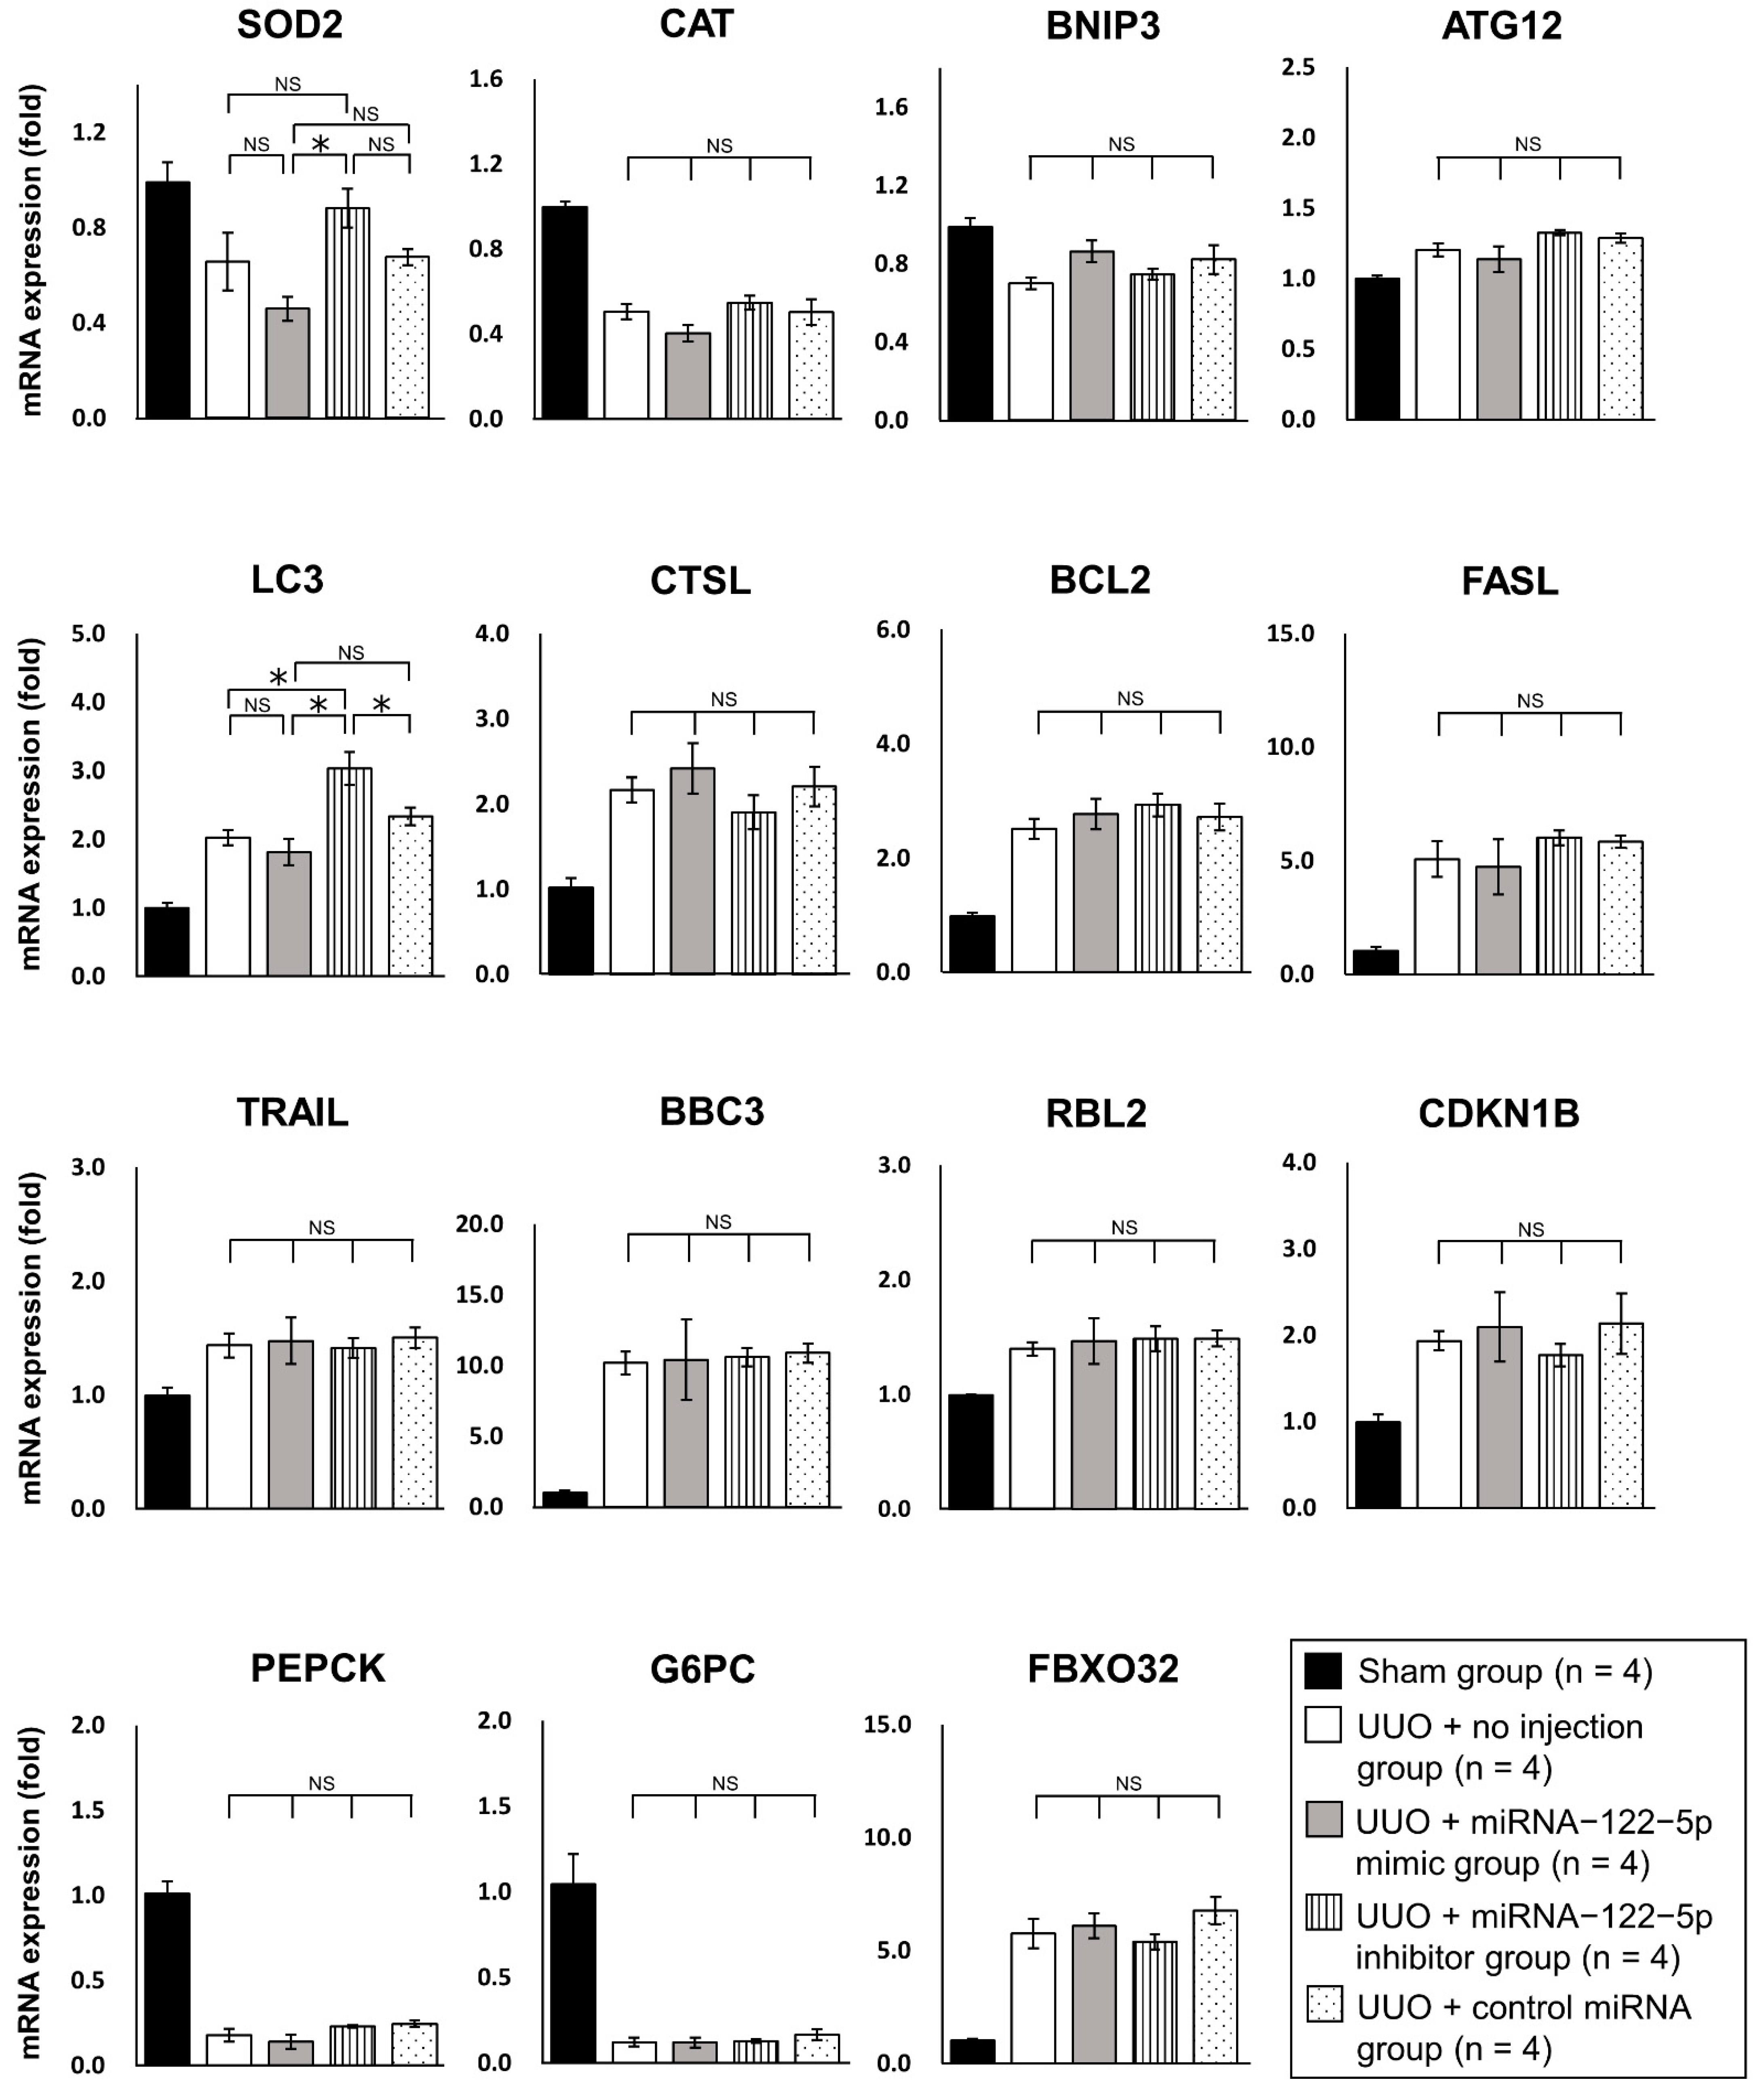
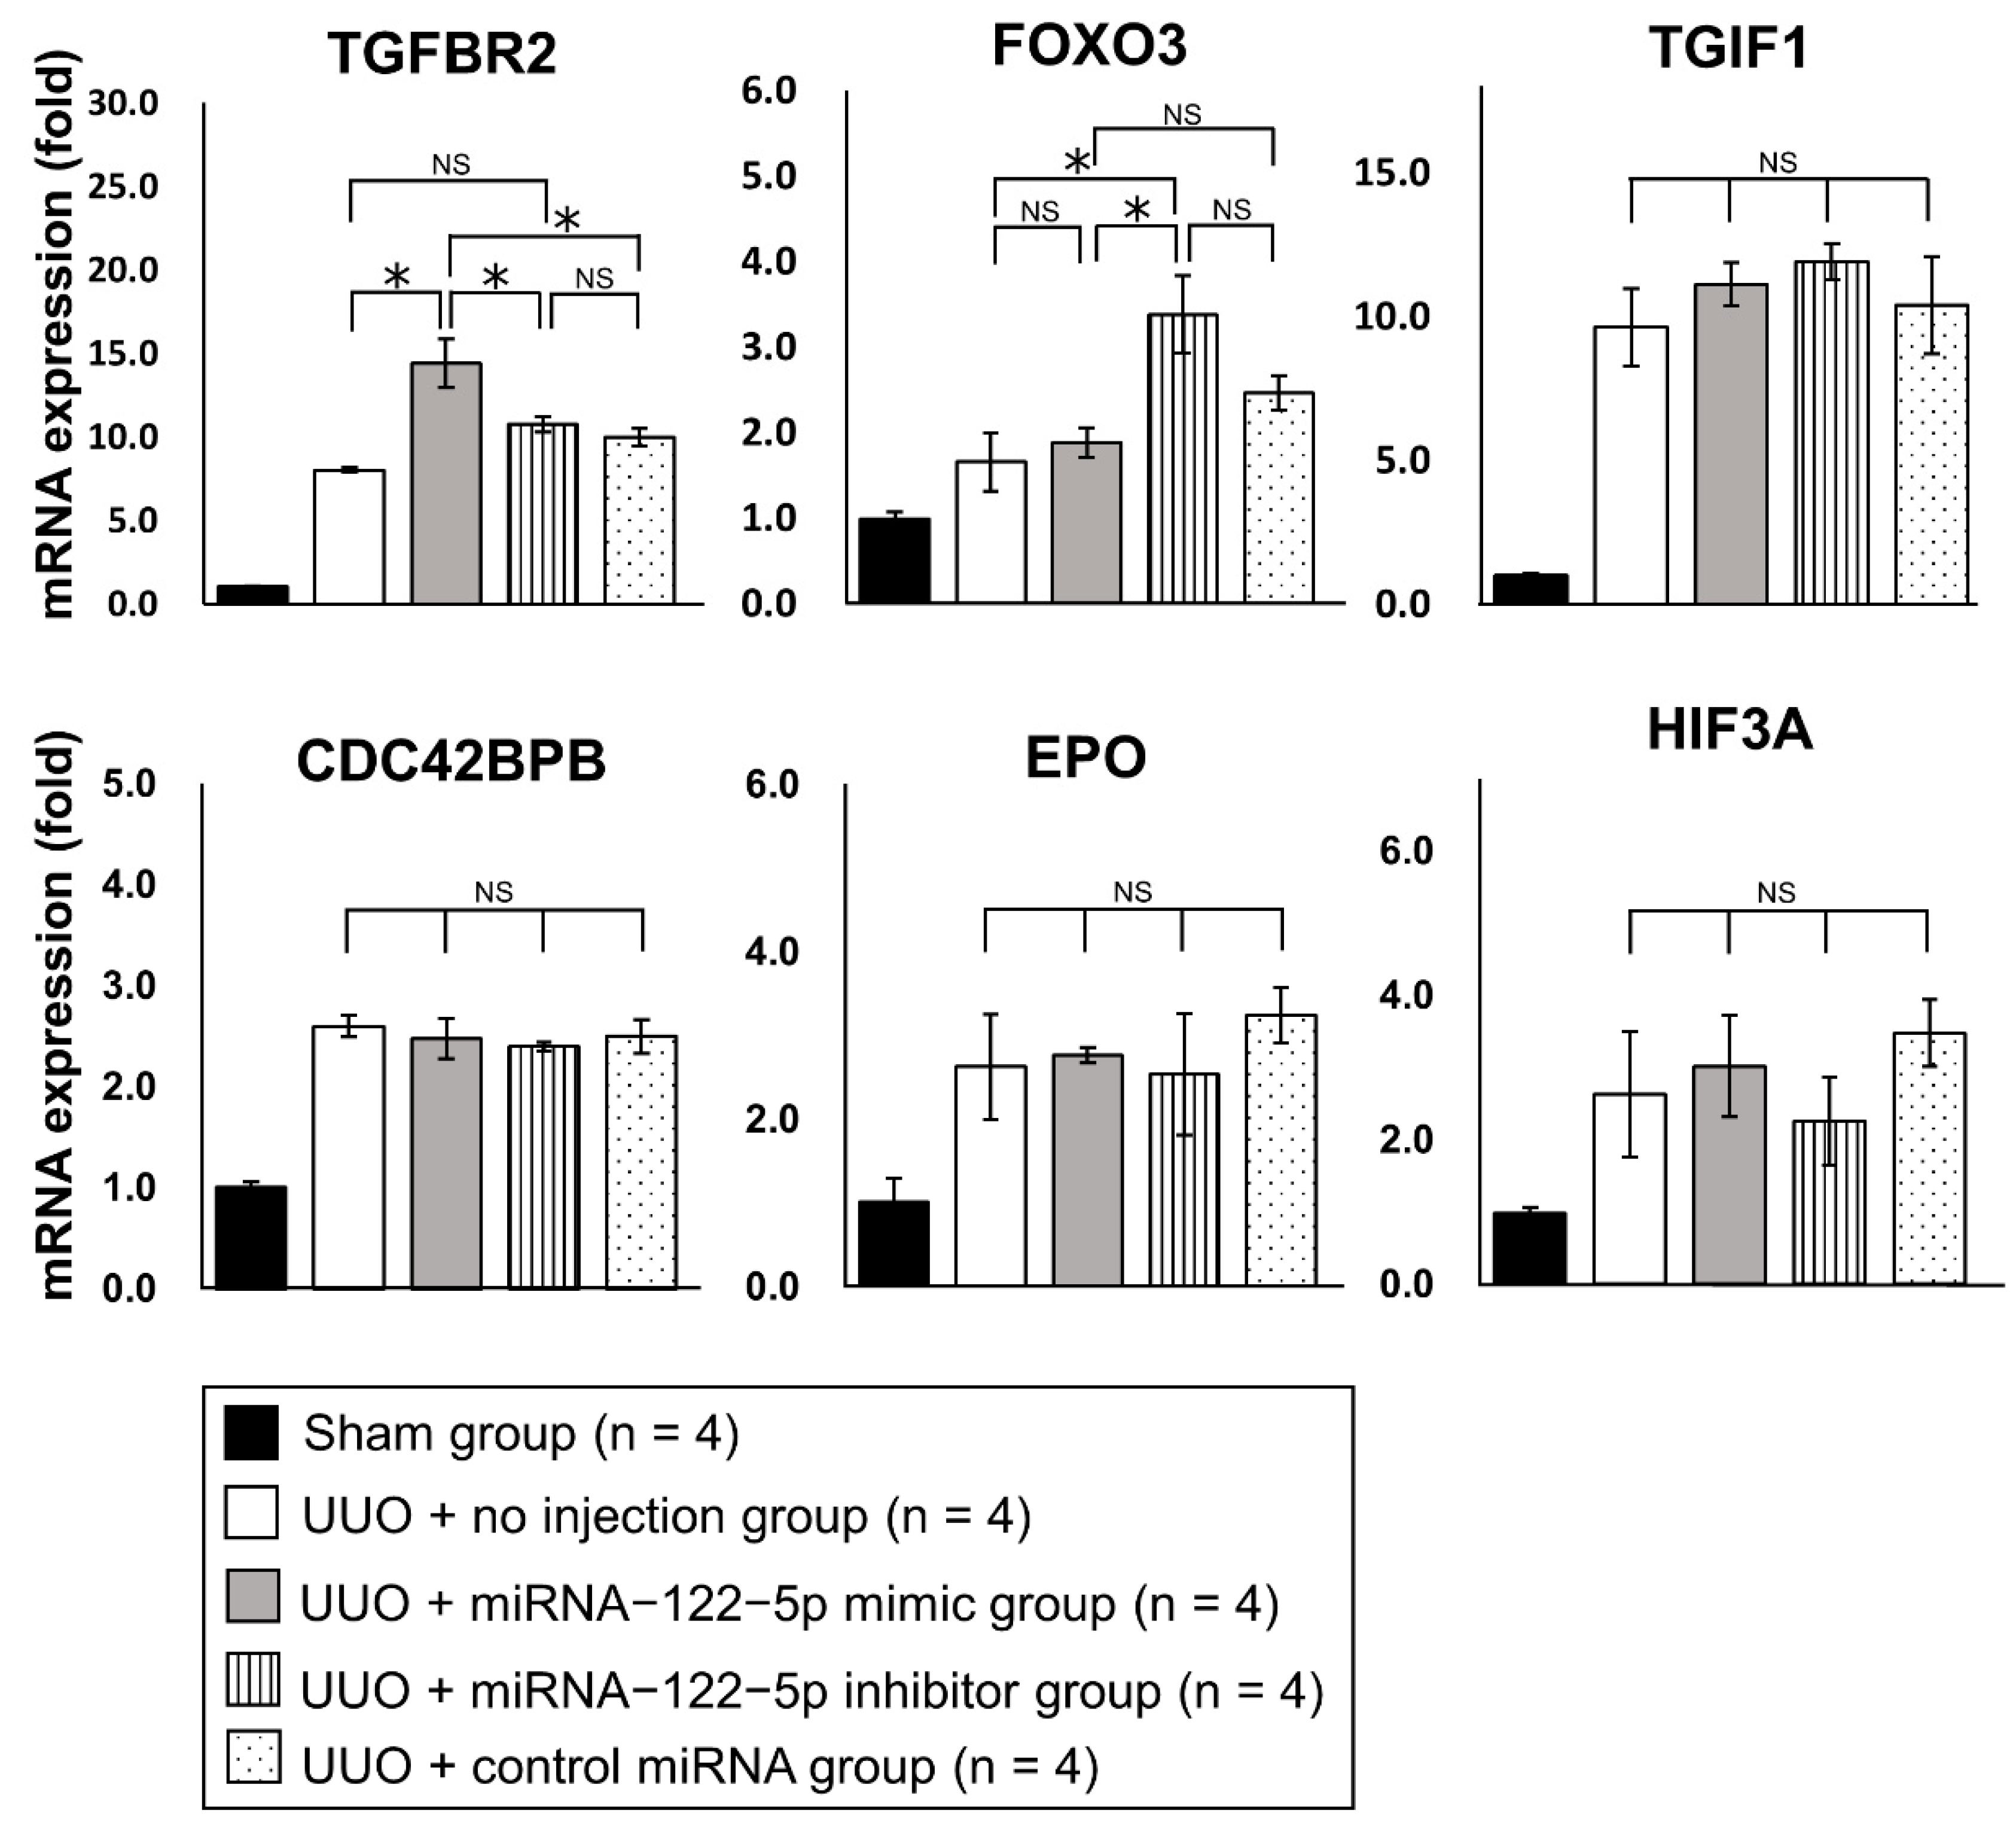
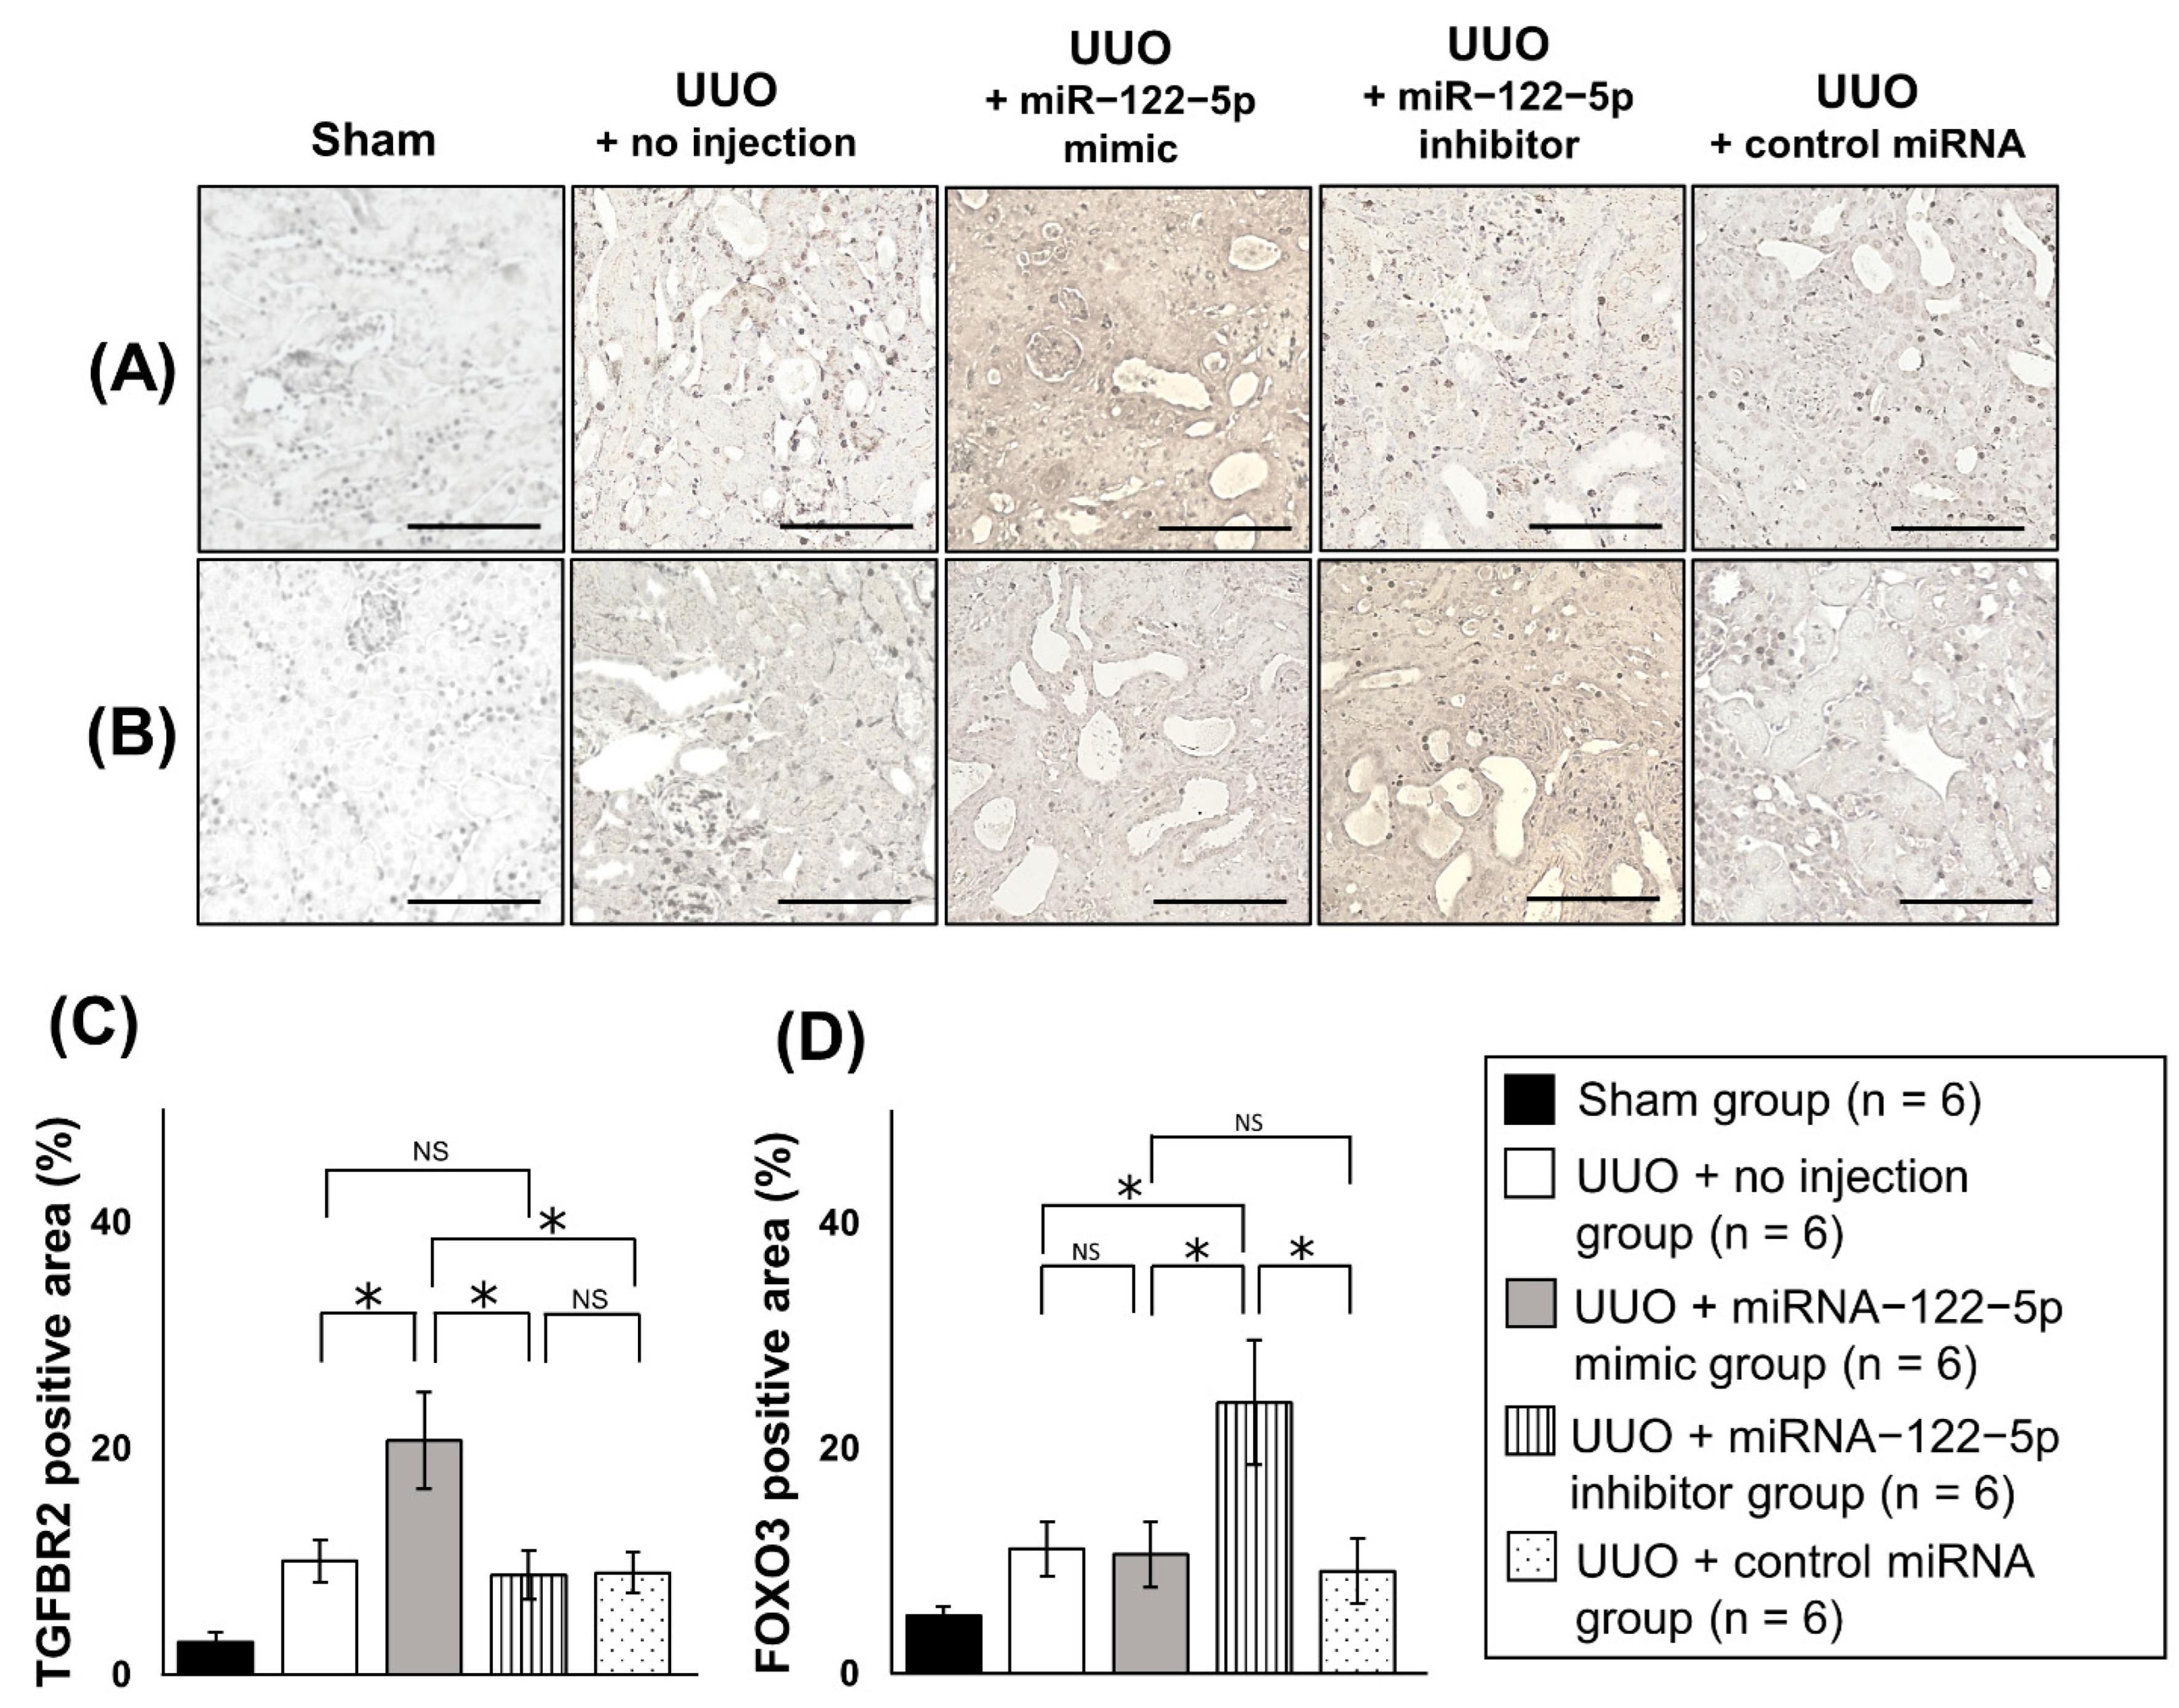
2.3. Mechanism of the Modulation of Renal Fibrosis by miR−122−5p

To analyze the mechanism by which miR−122−5p modulated renal fibrosis, we investigated potential target mRNAs for miR−122−5p. Five mRNAs including forkhead box O3 (FOXO3), homeobox protein TGIF1 (TGIF1), CDC42 binding protein kinase beta (CDC42BPB), erythropoietin (EPO), and hypoxia−inducible factor 3 alpha (HIF3A) mRNAs were predicted to be target mRNAs of miR−122−5p by computer analysis using TargetScan [http://www.targetscan.org/vert_72/ (accessed on 21 May 2020)]. Transforming growth factor beta receptor II (TGFBR2) was added as another candidate because TGFBR2 was previously reported to be modulated by miR−122−5p and was associated with skeletal muscle fibrosis [24]. We examined the expression levels of these six genes in kidney samples from each of the five treatment groups (Figure 7). The expression levels of TGFBR2, TGIF1, and CDC42BPB were significantly upregulated in the UUO + no injection group compared with the sham group. Although the expression levels of FOXO3, EPO, and HIF3A showed an increasing trend in the UUO + no injection group, there was no significant difference compared with the sham group (Supplementary Figure S5). The expression level of TGFBR2 (pro-fibrotic mRNA) was significantly upregulated in the UUO + miR−122−5p mimic group compared with the UUO + control miRNA group and UUO + no injection group. The expression level of FOXO3 (anti-fibrotic mRNA) was significantly elevated in the UUO + miR−122−5p inhibitor group compared with the UUO + no injection group. In comparison with the UUO + control miRNA group, no significant difference was observed although there was an increasing trend of FOXO3 levels in the UUO + miR−122−5p inhibitor group (Figure 7). Because it was difficult to reach conclusions from the mRNA (TGFBR2 and FOXO3) analysis alone, the protein expressions of TGFBR2 and FOXO3 were evaluated by immunohistochemistry (IHC). We found that FOXO3 and TGFBR2 were ubiquitously expressed in the kidney when assessed by IHC (Figure 8). The TGFBR2 positive and FOXO3 positive areas in the UUO + no injection group were significantly larger than that in the sham group (Supplementary Figure S6). The TGFBR2 positive area in the UUO + miR−122−5p mimic group was larger than that in the UUO + control miRNA group and UUO + no injection group. Additionally, the FOXO3 positive area in the UUO + miR−122−5p inhibitor group was larger than that in the UUO + control miRNA group and UUO + no injection group (Figure 8). In previous studies, FOXO3 was reported to have a protective role against renal fibrosis and CKD [25,26,27,28]. Although the mechanism involved is not entirely clear, it has been suggested that FOXO3 alleviates cellular damage in the tubules through antioxidant activity and autophagy activation [25,26,27,28]. For this reason, we focused on FOXO3 in this study. The KEGG PATHWAY Database [https://www.genome.jp/kegg/pathway.html (accessed on 3 August 2021)] was used to predict downstream antifibrotic mRNA of FOXO3 to investigate the mechanism involved in its anti-fibrotic effects. Expression levels of 15 predicted mRNAs [superoxide dismutase 2, mitochondrial (SOD2), catalase (CAT), BCL2/adenovirus E1B 19 kDa protein-interacting protein 3 (BNIP3), autophagy related 12 (ATG12), microtubule-associated proteins 1A/1B light chain 3B (LC3), cathepsin L1 (CTSL), B-cell lymphoma 2 (BCL2), Fas ligand (FASL), TNF-related apoptosis-inducing ligand (TRAIL), Bcl-2-binding component 3 (BBC3), retinoblastoma-like protein 2 (RBL2), cyclin-dependent kinase inhibitor 1B (CDKN1B), phosphoenolpyruvate carboxykinase (PEPCK), glucose-6-phosphatase, catalytic subunit (G6PC), and F-box only protein 32 (FBXO32)] were evaluated using qRT-PCR. In the UUO + no injection group, the expression levels of ATG12, LC3, CTSL, BCL2, FASL, TRAIL, BBC3, RBL2, CDKN1B, and FBXO32 were significantly upregulated compared with the sham group. In contrast, the expression levels of CAT, BNIP3, PEPCK, and G6PC were significantly downregulated in the UUO + no injection group compared with the sham group (Supplementary Figure S7). The expression level of LC3 (autophagy related mRNA) was significantly upregulated in the miR−122−5p + inhibitor group compared with the UUO + control miRNA group and UUO + no injection group. Although the expression level of SOD2 (antioxidant related mRNA) in the UUO + miR−122−5p inhibitor group was not significantly upregulated compared with the UUO + control miRNA group and UUO + no injection group, there was a significant difference in levels between the UUO + miR−122−5p inhibitor group and UUO + miR−122−5p mimic group (Figure 9).

3. Discussion

Our study showed that miR−122−5p modulates renal fibrosis. The main study findings were: (i) the expression of miR−122−5p was most downregulated in fibrotic kidneys compared with control kidneys as assessed by microarray analysis; (ii) the injection of miR−122−5p promoted renal fibrosis and upregulated TGFBR2 (pro-fibrotic factor); and (iii) miR−122−5p suppressed renal fibrosis and upregulated FOXO3 and LC3 (anti-fibrotic factors). To the best of our knowledge, this is the first report to show that miR−122−5p modulates renal fibrosis in vivo. Although certain miRNAs were reported to be associated with renal fibrosis [3,13,14,15,16,17,18,19,20], there have been few reports on the effects of exogenous miRNA modulation on renal fibrosis. Therefore, our findings regarding the exogenous modulation of miR−122−5p expression and its effect on renal fibrosis are considered significant.
Previously, several miRNAs were reported to be associated with renal fibrosis [3,13,14,15,16,17,18]—the expression levels of miR−21, −22, −135a, −150, −155, −184, −214, −215, −216a, −324, −433, and −1207 were upregulated in fibrotic kidneys [18,29,30,31,32]. In contrast, the expression levels of let-7, miR−29, −30, −34, −152, −181, −194, −200, and −455 were downregulated in fibrotic kidneys [18,21,33,34,35]. In this study, we confirmed that the expression levels of three miRNAs (miR−511−3p, −375−3p, and −127−3p) were significantly upregulated, and the expression levels of three miRNAs (miR−122−5p, −504−3p, and −363−3p) were significantly downregulated, in fibrotic kidneys by qRT−PCR. None of these six miRNAs had been reported to be associated with renal fibrosis at the time we conducted this study. The reasons for our discovery of these novel miRNAs associated with renal fibrosis might include differences in experimental design (in vivo or in vitro experiments), the termination period of UUO mice, and the datasets used for microarray analyses. We selected miR−122−5p for in-depth analyses because it was the most downregulated miRNA in fibrotic kidneys. Several previous studies of miR−122−5p reported its involvement in tissue fibrosis, but not in the kidney. Sun et al. reported the downregulation of miR−122−5p in fibrotic skeletal muscle tissue and showed that the overexpression of miR−122−5p suppressed skeletal muscle fibrosis [24]. Similarly, Halász et al. reported a negative correlation between miR−122−5p expression levels and the severity of liver fibrosis [36]. The other five miRNAs (miR−511−3p, −375−3p, −127−3p, 504−3p, and −363−3p) we identified might also be interesting targets for future research. In particular, miR−375−3p was reported to be associated with liver fibrosis and cardiac fibrosis [37,38]. In addition, miR−127−3p might be involved in tissue repair in ischemic kidney models [39].
In this study, a mimic or inhibitor of miR−122−5p was combined with polyethyleneimine nanoparticles (PEI-NPs) to enable the reagent to traffic to the kidneys (details are presented in Section 4.6.). The efficacy and safety of PEI−NPs were previously described [9]. Our histological and quantitative analysis confirmed that the miR−122−5p mimic or inhibitor with PEI-NPs modulated renal fibrosis. The serum BUN concentration was significantly increased by miR−122−5p mimic injection compared with the other groups. In contrast, a lower trend of serum BUN concentration in the UUO + miR−122−5p inhibitor group was observed; however, the difference was not significant when compared with the UUO + control miRNA group and UUO + no injection group. These results may be explained by the decreasing range of BUN induced by the miR−122−5p inhibitor was smaller than the increasing range of BUN induced by the miR−122−5p mimic. Increasing the sample size might help reach statistically significant differences, and further investigations will be interesting.
The study findings suggested that TGFBR2 (a pro-fibrotic factor) might be involved in the mechanism by which the miR−122−5p mimic promotes renal fibrosis and FOXO3 (an anti-fibrotic factor) might be involved in the mechanism by which the miR−122−5p inhibitor suppresses renal fibrosis. The TGF-β/Smad signaling pathway, of which TGFBR2 is an important constituent, has a central role in tissue fibrosis [40]. TGFBR2 was reported to be downregulated by the overexpression of miR−122−5p in fibrotic skeletal muscle tissue, leading to the suppression of fibrotic changes [24]. In contrast with our expectations, we found that the miR−122−5p mimic enhanced renal fibrosis with the upregulation of TGFBR2. These results suggest that miR−122−5p might have different roles in different organs. Although miRNAs generally function to silence gene expression [11,12], our results show that the miRNA−122−5p mimic upregulated TGFBR2 expression. This suggests there is an as yet unidentified and intervening pathway between miR−122−5p and TGFBR2. FOXO3 was reported to have anti−fibrotic functions in various organs including the kidney (described later) [27,41]. We found that the upregulation of FOXO3 by the miRNA−122−5p inhibitor had therapeutic potential for renal fibrosis. Despite FOXO3 being identified as a potential target of miR−122−5p by computer analysis (TargetScan), FOXO3 was not decreased in the UUO + miR−122−5p mimic group compared with the UUO + control miRNA group and UUO + no injection group. This suggests there may be an unknown pathway between miR−122−5p and FOXO3. IHC showed that FOXO3 was ubiquitously expressed in the kidneys, which is consistent with previous studies reporting FOXO3 is expressed ubiquitously (nuclear and cytoplasmic regions) [25]. In this study, IHC also showed that TGFBR2 was ubiquitously expressed in the kidneys. However, the localization of TGFBR2 could not be determined. TGFBR are thought to be present on the cell membrane; however, it was previously reported to be transported intracellularly [42]. Therefore, further studies regarding the localization of TGFBR2 in kidneys are needed.
As mentioned in the Results section, the beneficial effects of FOXO3 on renal fibrosis and CKD were recently reported [25,26,27,28]. FOXO3 appears to be protective against renal fibrosis and CKD [25,26,27,28]. However, the details remain unclear. For this reason, we focused on FOXO3 for further exploration in this study. Cell stress, insulin signals, growth factors, and hypoxia are upstream physiological signals that regulate the expression level of FOXO3 [27,43,44]. As mentioned earlier, FOXO3 has anti-fibrotic effects in various organs [27,41], which might be mediated by antioxidant responses, autophagy, and the inhibition of myofibroblast proliferation [26,27,28]. However, there have been few reports describing the antifibrotic mechanisms of FOXO3 in the kidney compared with the liver and lung [41]. Therefore, a deeper understanding and confirmation of how FOXO3 ameliorates renal fibrosis are needed. In our study, KEGG PATHWAY Database analysis showed that several genes (SOD2, CAT, BNIP3, ATG12, LC3, CTSL, BCL2, FASL, TRAIL, BBC3, RBL2, CDKN1B, PEPCK, G6PC, and FBXO32) were downstream of FOXO3. The expression of LC3 was significantly upregulated in the UUO + miR−122−5p inhibitor group compared with the UUO + control miRNA group and UUO + no injection group. Because LC3 is involved in autophagy responses, our results are consistent with previous reports explaining the mechanisms whereby FOXO3 ameliorated renal fibrosis and CKD [25,26,27,28]. LC3 is a key regulator of autophagy [45]. Previously, autophagy was reported to be induced in fibrotic kidneys and to have a protective effect against renal fibrosis [46,47]. Moreover, autophagy-deficiency (LC3-deficiency) promoted renal fibrosis [45]. Although its involvement in podocyte self-repair has been suggested as a mechanism by which autophagy ameliorates renal fibrosis [45,48], the details remain unclear. Enhanced autophagy against renal fibrosis is a potential future therapeutic target and an interesting area for future research [49]. In this study, the expression level of SOD2 in the UUO + miR−122−5p inhibitor group was not significantly altered compared with the UUO + control miRNA group and UUO + no injection group. However, there was a significant difference in SOD2 expression between the UUO + miR−122−5p inhibitor group and UUO + miR−122−5p mimic group (Figure 9). Although we could not reach conclusions from these results, they suggest that miR−122−5p mimic and inhibitor may involve the expression levels of SOD2. SOD2 is a widely known antioxidant gene that reduces oxidative stress and has protective functions against renal fibrosis [41]. Previously, Yoon et al. reported that tempol (a chemically synthesized antioxidant) increased SOD2 and ameliorated renal fibrosis in UUO mice via the modulation of FOXO3 signaling [26]. Additionally, Yang et al. reported that fucoxanthin (a marine carotenoid) enhanced FOXO3 expression and increased SOD2 in cultured mesangial cells [50]. These findings are consistent with our results. The relationship between FOXO3 and SOD2 was not proven in this study. Further study is needed to clarify the relationship between FOXO3 and SOD2 in the future. There have been several reports on the effects of LC3 and SOD2 on CKD and its causative diseases, including human studies (Table 2). Based on the results of our study alone, it is difficult to conclude that FOXO3 has a beneficial effect on renal fibrosis and CKD. However, our results are consistent with previous reports and support the reported positive effect of FOXO3 on renal fibrosis and CKD [25].
There were several limitations in this study. First, this study used a small sample size. Second, we did not clarify the detailed mechanism regarding the upregulation of TGFBR2 by the miR−122−5p mimic. Third, we did not investigate its effects on organs other than the kidney. Fourth, this was an animal study and thus the effects of the miR−122−5p mimic on humans are unknown. The therapeutic effect of miR−122−5p on renal fibrosis should be explored in future large-scale studies.
In conclusion, this study showed that miR−122−5p was downregulated in the fibrotic kidneys of a mouse renal fibrosis model. An miR−122−5p mimic enhanced renal fibrosis with the increased expression of TGFR2, whereas an miR−122−5p inhibitor suppressed renal fibrosis with the increased expression of FOXO3 (with the upregulation of the downstream genes, LC3). These results indicate that miR−122−5p may have a critical role in renal fibrosis.

4. Materials and Methods

4.1. Ethical Approval

All protocols for animal experiments were approved by the Animal Ethics Committee of Jichi Medical University (17012-03) and complied with the guidelines of Use and Care of Experimental Animals of Jichi Medical University.

4.2. Renal Fibrotic Mouse Model

Male C57BL/6 mice (aged 8 weeks and weighing 20–25 g) were purchased from Tokyo Laboratory Animals Science Co. (Tokyo, Japan). Mice were maintained under antiviral and antibody-free micro-isolator conditions at 19–21 °C, with 12-h light-dark cycles. UUO surgery was performed to establish the mouse renal fibrotic model as previously described [64,65,66]. In brief, the left ureter was surgically double ligated with 4-0 silk at the lower pole level of the kidney under inhalation anesthesia with isoflurane. The mice were euthanized 7 or 10 days after UUO surgery, depending on the experiment. The left kidney that developed hydronephrosis was collected for pathological and molecular analyses. Blood samples were drawn from the inferior vena cava. In the control group, mice were treated with sham surgery. Sham surgery was the same procedure as UUO except for the ureter ligation.

4.3. miRNA Microarray Analysis, Data Processing, and Statistical Analysis

Sixteen C57BL/6 mice were purchased for miRNA microarray analysis and randomly divided into two groups: UUO group (n = 8) or sham group (n = 8). Seven days after UUO surgery or sham surgery, kidney tissue was obtained. Total RNA was extracted using the miRNeasy Mini Kit (Qiagen, Venlo, The Netherlands). Microarray analysis was conducted by Hokkaido System Science (Hokkaido, Japan). A quality check of the RNA was performed using an Agilent 2100 BioAnalyzer series II (Agilent Technologies, Santa Clara, CA, USA) and eight samples of particularly high quality were selected [UUO group (n = 4) and sham group (n = 4)]. The detailed procedure of miRNA microarray analysis was previously described [67]. In brief, the dephosphorylation and hybridization of total RNA were performed using the miRNA Complete Labeling Reagent and Hyb kit (Agilent Technologies) according to the manufacturer’s instructions. Glass slides were washed with Gene Expression Wash Buffer (Agilent Technologies). Data scanning was performed using an Agilent Technologies Microarray Scanner (Agilent Technologies). Obtained data were quantified with Agilent Feature Extraction software 10.7.3.1 (Agilent Technologies) and standardized with GeneSpring 12.1 (Agilent Technologies). For statistical analysis, the Student’s t test was used to compare the two groups (UUO group and sham group). p < 0.05 was considered to represent statistical significance.

4.4. qRT-PCR

qRT-PCR was conducted for the quantitative evaluation of the expression of miRNA and mRNA as previously described [64]. In brief, for the analysis of miRNAs, total RNA was extracted from homogenized kidney samples using the miRNeasy Mini Kit (Qiagen), and 1 µg of total RNA was reverse transcribed to complementary DNA (cDNA) using the miScript II RT Kit (Qiagen). qRT-PCR was performed using a miScript SYBR Green PCR Kit (Qiagen) with miRNA-specific primers (Qiagen) for miR−511−3p, −375−3p, −130−3p, −127−3p, −122−5p, −190b−5p, −504−3p, and −363−3p (Qiagen). For the analyses of mRNA, mRNA was extracted from homogenized kidney samples using the RNeasy Mini Kit (Qiagen) and 1 µg of total RNA was reverse transcribed to cDNA using the SuperScript III First-Strand Synthesis SuperMix (Thermo Fisher Scientific, Waltham, MA, USA). qRT-PCR was performed using the PowerUP SYBR Green Master Mix (Thermo Fisher Scientific) with mRNA-specific primers (Takara Bio, Shiga, Japan) for α-SMA, COL1A2, FN1, TGFBR2, FOXO3, TGIF1, CDC42BPB, EPO, HIF3A, SOD2, CAT, BNIP3, ATG12, LC3, CTSL, BCL2, FASL, TRAIL, BBC3, RBL2, CDKN1B, PEPCK, G6PC, and FBXO32. The QuantStudio 12K Flex Real-Time PCR system (Thermo Fisher Scientific) was used as the gene amplification device. U6 small nuclear 2 (RNU6-2) was used as an endogenous control for miRNA and glyceraldehyde-3-phosphate dehydrogenase (GAPDH) was used as an endogenous control for mRNA. Expression levels were calculated by 2−ΔΔCT and compared between the groups.

4.5. miR−122−5p Mimic and miR−122−5p Inhibitor

The miR−122−5p mimic was purchased from Sigma−-Aldrich (St Louis, MO, USA). The miR−122−5p inhibitor and control miRNA were purchased from GeneDesign Inc. (Osaka, Japan). The sequences of the miR−122−5p mimic are 5′-[AmC6] CAAACACCAUUGUCACACUUCCATT-3′ (sense) and 5′-UGGAGUGUGACAAUGGUGUUUGTT-3′ (antisense). The sequences of the miR−122−5p inhibitor are 5′-GACGGCGCUAGGAUCAUCAACCAAACACCAUUGUCACACUCCACAAGUAUUCUGGU-3′ (sense) and 5′-ACCAGAAUACAACCAAACACCAUUGUCACACUCCACAAGAUGAUCCUAGCGCCGUC-3′ (antisense).
The sequences of the control miRNA are 5′-[AmC6] UGAACAGUGUACGUACGAUACC[dT][dT]-3′ (sense) and 5′-GGUUCGUACGUACACUGUUCA[dT][dT]-3′ (antisense).

4.6. Delivery of the miRNA Mimic and miRNA Inhibitor to Kidneys

PEI-NPs were purchased from Polyplus-transfection SA (Illkirch-Graffenstaden, France). PEI-NPs can be used as a non-viral vector for the delivery of miRNA mimic and miRNA inhibitors to kidney tissues in vivo [9]. PEI-NPs were administered at 150 mmol/L (expressed as the concentration of nitrogen residues) in sterile water provided by the manufacturer. The volume of PEI-NPs was prepared according to the amount of nucleic acid to be delivered to the kidney (N/P ratio, described later) according to the manufacturer’s instructions. The mechanism by which PEI-NP acts as a vector is as follows: (i) PEI-NP forms a cationic complex with oligonucleic acid; (ii) the cationic complex adheres to the cell surface and undergoes endocytosis; and (iii) the oligonucleic acids are translocated into the nucleus by the pH buffering effect in endosomes [68,69,70]. We previously confirmed that PEI-NPs delivered nucleic acids to kidney tissues by assays using Cy3-labeled miRNA in vivo [9]. The N/P ratio reflects the number of PEI-NP nitrogen residues per nucleic acid phosphate and was reported to be associated with the stability and cytotoxicity of the nucleic acid-PEI-NP complex [71,72,73]. In this study, the reagents were mixed at N/P = 6 according to the manufacturer’s instructions. C57BL/6 mice were randomly divided into five treatment groups: Sham group (n = 4), UUO + no injection group (n = 4), UUO + miR−122−5p mimic group (n = 4), UUO + miR−122−5p inhibitor group (n = 4), or UUO + control miRNA group (n = 4). miR−122−5p mimic-PEI-NPs (5 nmol miRNA mimic, N/P ratio 6), miR−122−5p inhibitor–PEI−NPs (5 nmol miRNA inhibitor, N/P ratio 6), and control miRNA–PEI−NPs (5 nmol control miRNA, N/P ratio 6) were dissolved in 200 µL of 5% glucose solution and injected via the tail vein. Injections were performed on the day before surgery (day −1) and days 1, 3, and 6 after UUO surgery or sham surgery. The mice were euthanized on day 10 after surgery. The kidneys were surgically collected and washed with phosphate-buffered saline.

4.7. Kidney Histology (AZAN Staining and Sirius Red Staining)

AZAN staining and Sirius red staining were conducted to evaluate the severity of renal fibrosis. Surgically collected pieces of kidney tissue were fixed in 4% paraformaldehyde and then embedded in paraffin. The tissues were sectioned at 4 µm thick, deparaffinized, and rehydrated. For AZAN staining, kidney sections were exposed to the AZAN staining-specific mordant (Muto Pure Chemicals, Tokyo, Japan) for 10 min and then stained with Mallory’s azocarmin G stain solution (Muto Pure Chemicals) for 90 min. The sections were incubated with 5% phosphotungstic acid solution (Muto Pure Chemicals) for 60 min and stained with Mallory’s aniline blue orange G stain solution (Muto Pure Chemicals) for 60 min. For Sirius red staining, kidney sections were stained with Sirius red mixture [(ratio of 100 mL of Van Gieson’s stain solution A (Muto Pure Chemicals) and 4 mL of 1% Sirius red solution (Muto Pure Chemicals)] for 60 min. The stained kidney sections were washed with distilled water, dehydrated, and mounted for microscopy using BZ-X710 (Keyence, Osaka, Japan). For the quantitative evaluation of renal fibrosis, the area stained red with Sirius red staining was measured. Six images were obtained at 200× magnification in random fields. The red area was measured using Keyence Hybrid Cell Count on a BZ-X Analyzer (version 1.4.0, Keyence). For randomization, digital images of kidney sections were segmented, numbered in sequence, and selected using a random number generator [https://www.random.org/ (accessed on 12 June 2020)].

4.8. IHC

IHC was conducted to evaluate the protein levels of TGFBR2 and FOXO3. Surgically collected pieces of kidney tissue were fixed in 4% paraformaldehyde and then embedded in paraffin. The tissues were sectioned at 4 µm thick, deparaffinized, and rehydrated. After antigen activation and blocking, kidney sections were incubated overnight at 4 °C with a TGFBR2-specific primary antibody (Fitzgerald Industries International, Acton, MA, USA) and FOXO3-specific primary antibody (Bethyl, Waltham, MA, USA). After washing, they were incubated with peroxidase-conjugated secondary antibodies for 1 h at room temperature (NICHIREI, Tokyo, Japan). Then, kidney sections were incubated with ImmPACT DAB Substrate Kit (Vector, Newark, CA, USA) for 10 min at room temperature, incubated in Meyer hematoxylin solution (Muto Pure Chemicals) for 10 s, washed, and dehydrated. Kidney sections were observed using a BZ-X710 (Keyence). The IHC positive area (brown stain) was quantified. Six images from random fields were obtained at 200× magnification. The brown stained area was measured using Keyence Hybrid Cell Count on a BZ-X Analyzer (version 1.4.1.1, Keyence). For randomization, digital images of kidney sections were segmented, numbered in sequence, and selected using a random number generator [https://www.random.org/ (accessed on 15 October 2022)].

4.9. Measurement of Serum BUN

The measurement of serum BUN was conducted by SRL (Tokyo, Japan).

4.10. Nomenclature System for miRNAs

The notation of miRNAs follows the guidelines for the nomenclature system for miRNAs [74].

4.11. Statistical Analysis

All values are expressed as the means ± standard error obtained from two independent experiments. Statistical comparisons between two groups were made using the Student’s t test. Comparisons between groups of three or more were made by one-way analysis of variance (ANOVA) and Newman–Keuls method. The analyses shown in Figure 4, Figure 5, Figure 6, Figure 7, Figure 8 and Figure 9 compared the four treatment groups (excluding sham group). This statistical method was used because the large difference in the results between the sham group and other groups might affect the analysis of the effects of miR−122−5p on renal fibrosis. p < 0.05 was considered statistically significant. The analysis of the comparison between the sham group and UUO + injection group is shown in Supplementary Figures S1–S7.

Supplementary Materials

The following supporting information can be downloaded at: https://www.mdpi.com/article/10.3390/ijms232315423/s1. Figure S1. Modulation of miR−122−5p expression after UUO surgery (10 days after surgery). The expression levels of miR−122−5p were determined by qRT-PCR. Relative expression levels are shown as mean values and standard errors. Relative expression levels were compared between the sham group (n = 4) and UUO + no injection group (n = 4). Abbreviations: miR, microRNA; UUO, unilateral ureteral obstruction; qRT-PCR, quantitative real-time reverse-transcription polymerase chain reaction; NS, not significant. Figure S2. The effects of UUO surgery on mRNAs (COL1A2, FN1, and α-SMA). The expression levels of COL1A2, FN1, and α-SMA were determined by qRT-PCR. Relative expression levels are shown as mean values and standard errors. Relative expression levels of mRNAs were compared between the sham group (n = 4) and UUO + no injection group (n = 4). Abbreviations: miR, microRNA; UUO, unilateral ureteral obstruction; mRNA, messenger RNA; COL1A2, collagen 1A2; FN1, fibronectin 1; α-SMA, α-smooth muscle actin; qRT-PCR, quantitative real-time reverse-transcription polymerase chain reaction. * p < 0.05. Figure S3. Kidney histology. Renal fibrosis areas were evaluated by Sirius red staining. Fibrotic areas were compared between the sham group (n = 6) and UUO + no injection group (n = 6). Abbreviations: miR, microRNA; UUO, unilateral ureteral obstruction. * p < 0.05. Figure S4. Serum blood urea nitrogen concentrations. Serum blood urea nitrogen concentrations (mg/dL) were compared between the sham group (n = 4) and UUO + no injection group (n = 4). Abbreviations: miR, microRNA; UUO, unilateral ureteral obstruction. * p < 0.05. Figure S5. The effects of UUO surgery on fibrosis-related mRNAs. The expression levels of six mRNAs (TGFBR2, FOXO3, TGIF1, CDC42BPB, EPO, and HIF3A) were determined by qRT-PCR. Relative expression levels are shown as mean values and standard errors. Relative expression levels of mRNAs were compared between the sham group (n = 4) and UUO + no injection group (n = 4). Abbreviations: miR, microRNA; mRNA, messenger RNA; UUO, unilateral ureteral obstruction; qRT-PCR, quantitative real-time reverse-transcription polymerase chain reaction; TGFBR2, transforming growth factor, beta receptor II; FOXO3, forkhead box O3; TGIF1, Homeobox protein TGIF1; CDC42BPB, CDC42 binding protein kinase beta; EPO, erythropoietin; HIF3A, hypoxia-inducible factor 3 alpha; NS, not significant. * p < 0.05. Figure S6. IHC analysis. The protein levels of TGFBR2 and FOXO3 were evaluated by IHC. Comparisons of TGFBR2 and FOXO3 positive areas (brown stain) between the sham group (n = 6) and UUO + no injection group (n = 6) are shown. Abbreviations: IHC, immunohistochemistry; miR, microRNA; UUO, unilateral ureteral obstruction; TGFBR2, trans-forming growth factor, beta receptor II; FOXO3, forkhead box O3. * p < 0.05. Figure S7. The effects of UUO surgery on the expression levels of 15 genes downstream of FOXO3 (SOD2, CAT, BNIP3, ATG12, LC3, CTSL, BCL2, FASL, TRAIL, BBC3, RBL2, CDKN1B, PEPCK, G6PC, and FBXO32). Relative expression levels of genes were compared between the sham group (n = 4) and UUO + no injection group (n = 4). Relative expression levels are shown as mean values and standard errors. * p < 0.05.

Author Contributions

Data curation, S.K., K.Y., H.I., A.A., K.H., S.O., K.I. and Y.M.; Formal analysis, S.K.; Investigation, S.K.; Methodology, S.K.; Software, S.K.; Supervision, Y.M.; Visualization, S.K.; Writing—original draft, S.K.; Writing—review & editing, Y.M. All authors have read and agreed to the published version of the manuscript.

Funding

This work was partially supported by JSPS KAKENHI Grant Number 21K08233.

Institutional Review Board Statement

All protocols of animal experiments were approved by the Animal Ethics Committee of Jichi Medical University (17012-03) and complied with the guidelines of Use and Care of Experimental Animals of Jichi Medical University.

Informed Consent Statement

Not applicable.

Data Availability Statement

Data are available on request.

Acknowledgments

We thank Gabrielle White Wolf, and J. Ludovic Croxford, from Edanz (https://jp.edanz.com/ac) (accessed on 20 October 2020) for editing a draft of this manuscript.

Conflicts of Interest

The authors declare no conflict of interest.

Abbreviations

miR, microRNA; UUO, unilateral ureteral obstruction; qRT-PCR, quantitative real-time reverse-transcription polymerase chain reaction; SOD2, superoxide dismutase 2, mitochondrial; CAT, catalase; BNIP, BCL2/adenovirus E1B 19 kDa protein-interacting protein 3; ATG12, autophagy related 12; LC3, microtubule-associated proteins 1A/1B light chain 3B; CTSL, cathepsin L1; BCL2, B-cell lymphoma 2; FASL, fas ligand; TRAIL, TNF-related apoptosis-inducing ligand; BBC3, Bcl-2-binding component 3; RBL2, retinoblastoma-like protein 2; CDKN1B, cyclin-dependent kinase inhibitor 1B; PEPCK, phosphoenolpyruvate carboxykinase; G6PC, glucose-6-phosphatase, catalytic subunit; FBXO32, F-box only protein 32; NS, not significant.

References

  1. Nogueira, A.; Pires, M.J.; Oliveira, P.A. Pathophysiological Mechanisms of Renal Fibrosis: A Review of Animal Models and Therapeutic Strategies. In Vivo 2017, 31, 1–22. [Google Scholar] [CrossRef] [Green Version]
  2. Bülow, R.D.; Boor, P. Extracellular Matrix in Kidney Fibrosis: More Than Just a Scaffold. J. Histochem. Cytochem. Off. J. Histochem. Soc. 2019, 67, 643–661. [Google Scholar] [CrossRef] [Green Version]
  3. Lv, W.; Fan, F.; Wang, Y.; Gonzalez-Fernandez, E.; Wang, C.; Yang, L.; Booz, G.W.; Roman, R.J. Therapeutic potential of microRNAs for the treatment of renal fibrosis and CKD. Physiol. Genom. 2018, 50, 20–34. [Google Scholar] [CrossRef]
  4. Schefold, J.C.; Filippatos, G.; Hasenfuss, G.; Anker, S.D.; von Haehling, S. Heart failure and kidney dysfunction: Epidemiology, mechanisms and management. Nat. Rev. Nephrol. 2016, 12, 610–623. [Google Scholar] [CrossRef]
  5. Wang, H.; Wang, B.; Zhang, A.; Hassounah, F.; Seow, Y.; Wood, M.; Ma, F.; Klein, J.D.; Price, S.R.; Wang, X.H. Exosome-Mediated miR-29 Transfer Reduces Muscle Atrophy and Kidney Fibrosis in Mice. Mol. Ther. 2019, 27, 571–583. [Google Scholar] [CrossRef] [Green Version]
  6. Campanholle, G.; Ligresti, G.; Gharib, S.A.; Duffield, J.S. Cellular mechanisms of tissue fibrosis. 3. Novel mechanisms of kidney fibrosis. Am. J. Physiol. Cell Physiol. 2013, 304, C591–C603. [Google Scholar] [CrossRef] [Green Version]
  7. Cho, M.H. Renal fibrosis. Korean J. Pediatr. 2010, 53, 735–740. [Google Scholar] [CrossRef] [Green Version]
  8. Humphreys, B.D. Mechanisms of Renal Fibrosis. Annu. Rev. Physiol. 2018, 80, 309–326. [Google Scholar] [CrossRef]
  9. Morishita, Y.; Imai, T.; Yoshizawa, H.; Watanabe, M.; Ishibashi, K.; Muto, S.; Nagata, D. Delivery of microRNA-146a with polyethylenimine nanoparticles inhibits renal fibrosis in vivo. Int. J. Nanomed. 2015, 10, 3475–3488. [Google Scholar] [CrossRef] [Green Version]
  10. Fu, Y.; Tang, C.; Cai, J.; Chen, G.; Zhang, D.; Dong, Z. Rodent models of AKI-CKD transition. Am. J. Physiol. Ren. Physiol. 2018, 315, F1098–F1106. [Google Scholar] [CrossRef]
  11. Vishnoi, A.; Rani, S. MiRNA Biogenesis and Regulation of Diseases: An Overview. Methods Mol. Biol. 2017, 1509, 1–10. [Google Scholar] [CrossRef] [PubMed]
  12. Rupaimoole, R.; Slack, F.J. MicroRNA therapeutics: Towards a new era for the management of cancer and other diseases. Nat. Rev. Drug Discov. 2017, 16, 203–222. [Google Scholar] [CrossRef] [PubMed]
  13. Meng, X.M.; Tang, P.M.; Li, J.; Lan, H.Y. TGF-β/Smad signaling in renal fibrosis. Front. Physiol. 2015, 6, 82. [Google Scholar] [CrossRef] [Green Version]
  14. Gomez, I.G.; Nakagawa, N.; Duffield, J.S. MicroRNAs as novel therapeutic targets to treat kidney injury and fibrosis. Am. J. Physiol. Ren. Physiol. 2016, 310, F931–F944. [Google Scholar] [CrossRef] [Green Version]
  15. Patel, V.; Noureddine, L. MicroRNAs and fibrosis. Curr. Opin. Nephrol. Hypertens. 2012, 21, 410–416. [Google Scholar] [CrossRef]
  16. Wang, B.; Ricardo, S. Role of microRNA machinery in kidney fibrosis. Clin. Exp. Pharmacol. Physiol. 2014, 41, 543–550. [Google Scholar] [CrossRef] [Green Version]
  17. Meng, X.M.; Nikolic-Paterson, D.J.; Lan, H.Y. TGF-β: The master regulator of fibrosis. Nat. Rev. Nephrol. 2016, 12, 325–338. [Google Scholar] [CrossRef]
  18. Van der Hauwaert, C.; Glowacki, F.; Pottier, N.; Cauffiez, C. Non-Coding RNAs as New Therapeutic Targets in the Context of Renal Fibrosis. Int. J. Mol. Sci. 2019, 20, 1977. [Google Scholar] [CrossRef] [Green Version]
  19. Fierro-Fernández, M.; Miguel, V.; Márquez-Expósito, L.; Nuevo-Tapioles, C.; Herrero, J.I.; Blanco-Ruiz, E.; Tituaña, J.; Castillo, C.; Cannata, P.; Monsalve, M.; et al. MiR-9-5p protects from kidney fibrosis by metabolic reprogramming. FASEB J. 2020, 34, 410–431. [Google Scholar] [CrossRef] [Green Version]
  20. Glowacki, F.; Savary, G.; Gnemmi, V.; Buob, D.; Van der Hauwaert, C.; Lo-Guidice, J.M.; Bouyé, S.; Hazzan, M.; Pottier, N.; Perrais, M.; et al. Increased circulating miR-21 levels are associated with kidney fibrosis. PLoS ONE 2013, 8, e58014. [Google Scholar] [CrossRef]
  21. Morizane, R.; Fujii, S.; Monkawa, T.; Hiratsuka, K.; Yamaguchi, S.; Homma, K.; Itoh, H. miR-34c attenuates epithelial-mesenchymal transition and kidney fibrosis with ureteral obstruction. Sci. Rep. 2014, 4, 4578. [Google Scholar] [CrossRef] [Green Version]
  22. Zeisberg, M.; Kalluri, R. The role of epithelial-to-mesenchymal transition in renal fibrosis. J. Mol. Med. 2004, 82, 175–181. [Google Scholar] [CrossRef]
  23. Zhong, X.; Chung, A.C.; Chen, H.Y.; Meng, X.M.; Lan, H.Y. Smad3-mediated upregulation of miR-21 promotes renal fibrosis. J. Am. Soc. Nephrol. JASN 2011, 22, 1668–1681. [Google Scholar] [CrossRef] [PubMed] [Green Version]
  24. Sun, Y.; Wang, H.; Li, Y.; Liu, S.; Chen, J.; Ying, H. miR-24 and miR-122 Negatively Regulate the Transforming Growth Factor-β/Smad Signaling Pathway in Skeletal Muscle Fibrosis. Mol. Ther. Nucleic Acids 2018, 11, 528–537. [Google Scholar] [CrossRef] [Green Version]
  25. Lin, F. Molecular regulation and function of FoxO3 in chronic kidney disease. Curr. Opin. Nephrol. Hypertens. 2020, 29, 439–445. [Google Scholar] [CrossRef]
  26. Yoon, H.E.; Kim, S.J.; Kim, S.J.; Chung, S.; Shin, S.J. Tempol attenuates renal fibrosis in mice with unilateral ureteral obstruction: The role of PI3K-Akt-FoxO3a signaling. J. Korean Med. Sci. 2014, 29, 230–237. [Google Scholar] [CrossRef] [Green Version]
  27. Li, L.; Kang, H.; Zhang, Q.; D’Agati, V.D.; Al-Awqati, Q.; Lin, F. FoxO3 activation in hypoxic tubules prevents chronic kidney disease. J. Clin. Investig. 2019, 129, 2374–2389. [Google Scholar] [CrossRef] [Green Version]
  28. Bijkerk, R.; de Bruin, R.G.; van Solingen, C.; van Gils, J.M.; Duijs, J.M.; van der Veer, E.P.; Rabelink, T.J.; Humphreys, B.D.; van Zonneveld, A.J. Silencing of microRNA-132 reduces renal fibrosis by selectively inhibiting myofibroblast proliferation. Kidney Int. 2016, 89, 1268–1280. [Google Scholar] [CrossRef]
  29. Zhou, H.; Hasni, S.A.; Perez, P.; Tandon, M.; Jang, S.I.; Zheng, C.; Kopp, J.B.; Austin, H., 3rd; Balow, J.E.; Alevizos, I.; et al. miR-150 promotes renal fibrosis in lupus nephritis by downregulating SOCS1. J. Am. Soc. Nephrol. JASN 2013, 24, 1073–1087. [Google Scholar] [CrossRef] [Green Version]
  30. He, F.; Peng, F.; Xia, X.; Zhao, C.; Luo, Q.; Guan, W.; Li, Z.; Yu, X.; Huang, F. MiR-135a promotes renal fibrosis in diabetic nephropathy by regulating TRPC1. Diabetologia 2014, 57, 1726–1736. [Google Scholar] [CrossRef]
  31. Zhang, Y.; Zhao, S.; Wu, D.; Liu, X.; Shi, M.; Wang, Y.; Zhang, F.; Ding, J.; Xiao, Y.; Guo, B. MicroRNA-22 Promotes Renal Tubulointerstitial Fibrosis by Targeting PTEN and Suppressing Autophagy in Diabetic Nephropathy. J. Diabetes Res. 2018, 2018, 4728645. [Google Scholar] [CrossRef] [PubMed]
  32. Alvarez, M.L.; Khosroheidari, M.; Eddy, E.; Kiefer, J. Role of microRNA 1207-5P and its host gene, the long non-coding RNA Pvt1, as mediators of extracellular matrix accumulation in the kidney: Implications for diabetic nephropathy. PLoS ONE 2013, 8, e77468. [Google Scholar] [CrossRef] [PubMed] [Green Version]
  33. Shen, Y.; Zhao, Y.; Wang, L.; Zhang, W.; Liu, C.; Yin, A. MicroRNA-194 overexpression protects against hypoxia/reperfusion-induced HK-2 cell injury through direct targeting Rheb. J. Cell Biochem. 2018. Online ahead of print. [Google Scholar] [CrossRef] [PubMed]
  34. Zhang, X.; Yang, Z.; Heng, Y.; Miao, C. MicroRNA-181 exerts an inhibitory role during renal fibrosis by targeting early growth response factor-1 and attenuating the expression of profibrotic markers. Mol. Med. Rep. 2019, 19, 3305–3313. [Google Scholar] [CrossRef] [Green Version]
  35. Ning, Y.X.; Wang, X.Y.; Wang, J.Q.; Zeng, R.; Wang, G.Q. miR-152 regulates TGF-β1-induced epithelial-mesenchymal transition by targeting HPIP in tubular epithelial cells. Mol. Med. Rep. 2018, 17, 7973–7979. [Google Scholar] [CrossRef] [PubMed]
  36. Halász, T.; Horváth, G.; Pár, G.; Werling, K.; Kiss, A.; Schaff, Z.; Lendvai, G. miR-122 negatively correlates with liver fibrosis as detected by histology and FibroScan. World J. Gastroenterol. 2015, 21, 7814–7823. [Google Scholar] [CrossRef] [Green Version]
  37. Zhuang, Y.; Yang, D.; Shi, S.; Wang, L.; Yu, M.; Meng, X.; Fan, Y.; Zhou, R.; Wang, F. MiR-375-3p Promotes Cardiac Fibrosis by Regulating the Ferroptosis Mediated by GPX4. Comput. Intell. Neurosci. 2022, 2022, 9629158. [Google Scholar] [CrossRef]
  38. Yang, Y.Z.; Zhao, X.J.; Xu, H.J.; Wang, S.C.; Pan, Y.; Wang, S.J.; Xu, Q.; Jiao, R.Q.; Gu, H.M.; Kong, L.D. Author Correction: Magnesium isoglycyrrhizinate ameliorates high fructose-induced liver fibrosis in rat by increasing miR-375-3p to suppress JAK2/STAT3 pathway and TGF-β1/Smad signaling. Acta Pharmacol. Sin. 2022, 43, 1616. [Google Scholar] [CrossRef]
  39. Conde, E.; Giménez-Moyano, S.; Martín-Gómez, L.; Rodríguez, M.; Ramos, M.E.; Aguado-Fraile, E.; Blanco-Sanchez, I.; Saiz, A.; García-Bermejo, M.L. HIF-1α induction during reperfusion avoids maladaptive repair after renal ischemia/reperfusion involving miR127-3p. Sci. Rep. 2017, 7, 41099. [Google Scholar] [CrossRef] [Green Version]
  40. Biernacka, A.; Dobaczewski, M.; Frangogiannis, N.G. TGF-β signaling in fibrosis. Growth Factors 2011, 29, 196–202. [Google Scholar] [CrossRef]
  41. Xin, Z.; Ma, Z.; Hu, W.; Jiang, S.; Yang, Z.; Li, T.; Chen, F.; Jia, G.; Yang, Y. FOXO1/3: Potential suppressors of fibrosis. Ageing Res. Rev. 2018, 41, 42–52. [Google Scholar] [CrossRef] [PubMed]
  42. Yakymovych, I.; Yakymovych, M.; Heldin, C.H. Intracellular trafficking of transforming growth factor β receptors. Acta Biochim. Et Biophys. Sin. 2018, 50, 3–11. [Google Scholar] [CrossRef] [PubMed] [Green Version]
  43. Sanese, P.; Forte, G.; Disciglio, V.; Grossi, V.; Simone, C. FOXO3 on the Road to Longevity: Lessons From SNPs and Chromatin Hubs. Comput. Struct. Biotechnol. J. 2019, 17, 737–745. [Google Scholar] [CrossRef] [PubMed]
  44. Morris, B.J.; Willcox, D.C.; Donlon, T.A.; Willcox, B.J. FOXO3: A Major Gene for Human Longevity—A Mini-Review. Gerontology 2015, 61, 515–525. [Google Scholar] [CrossRef] [Green Version]
  45. Ding, Y.; Kim, S.; Lee, S.Y.; Koo, J.K.; Wang, Z.; Choi, M.E. Autophagy regulates TGF-β expression and suppresses kidney fibrosis induced by unilateral ureteral obstruction. J. Am. Soc. Nephrol. JASN 2014, 25, 2835–2846. [Google Scholar] [CrossRef] [PubMed] [Green Version]
  46. Kim, Y.A.; Kim, H.J.; Gwon, M.G.; Gu, H.; An, H.J.; Bae, S.; Leem, J.; Jung, H.J.; Park, K.K. Inhibitory Effects of STAT3 Transcription Factor by Synthetic Decoy ODNs on Autophagy in Renal Fibrosis. Biomedicines 2021, 9, 331. [Google Scholar] [CrossRef]
  47. Chung, S.; Son, M.; Chae, Y.; Oh, S.; Koh, E.S.; Kim, Y.K.; Shin, S.J.; Park, C.W.; Jung, S.C.; Kim, H.S. Fabry disease exacerbates renal interstitial fibrosis after unilateral ureteral obstruction via impaired autophagy and enhanced apoptosis. Kidney Res. Clin. Pract. 2021, 40, 208–219. [Google Scholar] [CrossRef]
  48. Hartleben, B.; Gödel, M.; Meyer-Schwesinger, C.; Liu, S.; Ulrich, T.; Köbler, S.; Wiech, T.; Grahammer, F.; Arnold, S.J.; Lindenmeyer, M.T.; et al. Autophagy influences glomerular disease susceptibility and maintains podocyte homeostasis in aging mice. J. Clin. Investig. 2010, 120, 1084–1096. [Google Scholar] [CrossRef] [Green Version]
  49. Yu, H.X.; Lin, W.; Yang, K.; Wei, L.J.; Chen, J.L.; Liu, X.Y.; Zhong, K.; Chen, X.; Pei, M.; Yang, H.T. Transcriptome-Based Network Analysis Reveals Hirudin Potentiates Anti-Renal Fibrosis Efficacy in UUO Rats. Front. Pharmacol. 2021, 12, 741801. [Google Scholar] [CrossRef] [PubMed]
  50. Yang, G.; Jin, L.; Zheng, D.; Tang, X.; Yang, J.; Fan, L.; Xie, X. Fucoxanthin Alleviates Oxidative Stress through Akt/Sirt1/FoxO3α Signaling to Inhibit HG-Induced Renal Fibrosis in GMCs. Mar. Drugs 2019, 17, 702. [Google Scholar] [CrossRef] [PubMed]
  51. Möllsten, A.; Jorsal, A.; Lajer, M.; Vionnet, N.; Tarnow, L. The V16A polymorphism in SOD2 is associated with increased risk of diabetic nephropathy and cardiovascular disease in type 1 diabetes. Diabetologia 2009, 52, 2590–2593. [Google Scholar] [CrossRef] [PubMed] [Green Version]
  52. Prunotto, M.; Carnevali, M.L.; Candiano, G.; Murtas, C.; Bruschi, M.; Corradini, E.; Trivelli, A.; Magnasco, A.; Petretto, A.; Santucci, L.; et al. Autoimmunity in membranous nephropathy targets aldose reductase and SOD2. J. Am. Soc. Nephrol. JASN 2010, 21, 507–519. [Google Scholar] [CrossRef] [PubMed] [Green Version]
  53. Olsson, J.; Jacobson, T.A.; Paulsson, J.M.; Dadfar, E.; Moshfegh, A.; Jacobson, S.H.; Lundahl, J. Expression of neutrophil SOD2 is reduced after lipopolysaccharide stimulation: A potential cause of neutrophil dysfunction in chronic kidney disease. Nephrol. Dial. Transplant. Off. Publ. Eur. Dial. Transpl. Assoc.—Eur. Ren. Assoc. 2011, 26, 2195–2201. [Google Scholar] [CrossRef] [PubMed] [Green Version]
  54. Zaza, G.; Granata, S.; Masola, V.; Rugiu, C.; Fantin, F.; Gesualdo, L.; Schena, F.P.; Lupo, A. Downregulation of nuclear-encoded genes of oxidative metabolism in dialyzed chronic kidney disease patients. PLoS ONE 2013, 8, e77847. [Google Scholar] [CrossRef] [Green Version]
  55. Mohammedi, K.; Bellili-Muñoz, N.; Driss, F.; Roussel, R.; Seta, N.; Fumeron, F.; Hadjadj, S.; Marre, M.; Velho, G. Manganese superoxide dismutase (SOD2) polymorphisms, plasma advanced oxidation protein products (AOPP) concentration and risk of kidney complications in subjects with type 1 diabetes. PLoS ONE 2014, 9, e96916. [Google Scholar] [CrossRef] [Green Version]
  56. Krueger, K.; Shen, J.; Maier, A.; Tepel, M.; Scholze, A. Lower Superoxide Dismutase 2 (SOD2) Protein Content in Mononuclear Cells Is Associated with Better Survival in Patients with Hemodialysis Therapy. Oxidative Med. Cell. Longev. 2016, 2016, 7423249. [Google Scholar] [CrossRef] [Green Version]
  57. Jerotic, D.; Matic, M.; Suvakov, S.; Vucicevic, K.; Damjanovic, T.; Savic-Radojevic, A.; Pljesa-Ercegovac, M.; Coric, V.; Stefa novic, A.; Ivanisevic, J.; et al. Association of Nrf2, SOD2 and GPX1 Polymorphisms with Biomarkers of Oxidative Distress and Survival in End-Stage Renal Disease Patients. Toxins 2019, 11, 431. [Google Scholar] [CrossRef] [PubMed] [Green Version]
  58. Corredor, Z.; Filho, M.; Rodríguez-Ribera, L.; Velázquez, A.; Hernández, A.; Catalano, C.; Hemminki, K.; Coll, E.; Silva, I.; Diaz, J.M.; et al. Genetic Variants Associated with Chronic Kidney Disease in a Spanish Population. Sci. Rep. 2020, 10, 144. [Google Scholar] [CrossRef] [Green Version]
  59. Miyazaki, N.; Murata, I.; Takemura, G.; Okada, H.; Kanamori, H.; Matsumoto-Miyazaki, J.; Yoshida, G.; Izumi, K.; Kashi, H.; Niimi, K.; et al. Expression of prorenin receptor in renal biopsies from patients with IgA nephropathy. Int. J. Clin. Exp. Pathol. 2014, 7, 7485–7496. [Google Scholar]
  60. Xiong, G.; Tang, W.; Zhang, D.; He, D.; Wei, G.; Atala, A.; Liang, X.J.; Bleyer, A.J.; Bleyer, M.E.; Yu, J.; et al. Impaired Regen eration Potential in Urinary Stem Cells Diagnosed from the Patients with Diabetic Nephropathy. Theranostics 2019, 9, 4221–4232. [Google Scholar] [CrossRef]
  61. Liu, W.J.; Gan, Y.; Huang, W.F.; Wu, H.L.; Zhang, X.Q.; Zheng, H.J.; Liu, H.F. Lysosome restoration to activate podocyte autophagy: A new therapeutic strategy for diabetic kidney disease. Cell Death Dis. 2019, 10, 806. [Google Scholar] [CrossRef] [PubMed]
  62. Ogawa-Akiyama, A.; Sugiyama, H.; Kitagawa, M.; Tanaka, K.; Kano, Y.; Mise, K.; Otaka, N.; Tanabe, K.; Morinaga, H.; Ki nomura, M.; et al. Podocyte autophagy is associated with foot process effacement and proteinuria in patients with minimal change nephrotic syndrome. PLoS ONE 2020, 15, e0228337. [Google Scholar] [CrossRef] [PubMed] [Green Version]
  63. da Silva, C.A.; Monteiro, M.; Araújo, L.S.; Urzedo, M.G.; Rocha, L.B.; Dos Reis, M.A.; Machado, J.R. In situ evaluation of podocytes in patients with focal segmental glomerulosclerosis and minimal change disease. PLoS ONE 2020, 15, e0241745. [Google Scholar] [CrossRef]
  64. Yanai, K.; Kaneko, S.; Ishii, H.; Aomatsu, A.; Ito, K.; Hirai, K.; Ookawara, S.; Ishibashi, K.; Morishita, Y. Quantitative Real-Time PCR Evaluation of microRNA Expressions in Mouse Kidney with Unilateral Ureteral Obstruction. J. Vis. Exp. 2020, 27. [Google Scholar] [CrossRef] [PubMed]
  65. Chevalier, R.L.; Forbes, M.S.; Thornhill, B.A. Ureteral obstruction as a model of renal interstitial fibrosis and obstructive nephropathy. Kidney Int. 2009, 75, 1145–1152. [Google Scholar] [CrossRef] [PubMed] [Green Version]
  66. Martínez-Klimova, E.; Aparicio-Trejo, O.E.; Tapia, E.; Pedraza-Chaverri, J. Unilateral Ureteral Obstruction as a Model to Investigate Fibrosis-Attenuating Treatments. Biomolecules 2019, 9, 141. [Google Scholar] [CrossRef] [PubMed] [Green Version]
  67. Morishita, Y.; Yoshizawa, H.; Watanabe, M.; Imai, R.; Imai, T.; Hirahara, I.; Akimoto, T.; Ookawara, S.; Muto, S.; Nagata, D. MicroRNA expression profiling in peritoneal fibrosis. Transl. Res. J. Lab. Clin. Med. 2016, 169, 47–66. [Google Scholar] [CrossRef]
  68. Godbey, W.T.; Wu, K.K.; Mikos, A.G. Tracking the intracellular path of poly(ethylenimine)/DNA complexes for gene delivery. Proc. Natl. Acad. Sci. USA 1999, 96, 5177–5181. [Google Scholar] [CrossRef] [Green Version]
  69. Boussif, O.; Lezoualc’h, F.; Zanta, M.A.; Mergny, M.D.; Scherman, D.; Demeneix, B.; Behr, J.P. A versatile vector for gene and oligonucleotide transfer into cells in culture and in vivo: Polyethylenimine. Proc. Natl. Acad. Sci. USA 1995, 92, 7297–7301. [Google Scholar] [CrossRef] [Green Version]
  70. Akinc, A.; Thomas, M.; Klibanov, A.M.; Langer, R. Exploring polyethylenimine-mediated DNA transfection and the proton sponge hypothesis. J. Gene Med. 2005, 7, 657–663. [Google Scholar] [CrossRef]
  71. Zhao, Q.Q.; Chen, J.L.; Lv, T.F.; He, C.X.; Tang, G.P.; Liang, W.Q.; Tabata, Y.; Gao, J.Q. N/P ratio significantly influences the transfection efficiency and cytotoxicity of a polyethylenimine/chitosan/DNA complex. Biol. Pharm. Bull. 2009, 32, 706–710. [Google Scholar] [CrossRef] [PubMed]
  72. Hao, F.; Li, Y.; Zhu, J.; Sun, J.; Marshall, B.; Lee, R.J.; Teng, L.; Yang, Z.; Xie, J. Polyethylenimine-based Formulations for Delivery of Oligonucleotides. Curr. Med. Chem. 2019, 26, 2264–2284. [Google Scholar] [CrossRef] [PubMed]
  73. Huang, X.; Hartley, A.V.; Yin, Y.; Herskowitz, J.H.; Lah, J.J.; Ressler, K.J. AAV2 production with optimized N/P ratio and PEI-mediated transfection results in low toxicity and high titer for in vitro and in vivo applications. J. Virol. Methods 2013, 193, 270–277. [Google Scholar] [CrossRef] [Green Version]
  74. Griffiths-Jones, S.; Saini, H.K.; van Dongen, S.; Enright, A.J. miRBase: Tools for microRNA genomics. Nucleic Acids Res. 2008, 36, D154–D158. [Google Scholar] [CrossRef] [PubMed]
Figure 1. Heat map of differentially expressed miRNAs in fibrotic kidneys. Heat map shows hierarchical clustering and systemic variations in the expression levels of miRNAs in the UUO group (n = 4) and sham group (n = 4). Red, increased expression; blue, decreased expression. Abbreviations: UUO, unilateral ureteral obstruction; miR, microRNA.
Ijms 23 15423 g001
Figure 2. Regulated miRNAs in fibrotic kidneys. The expression levels of eight miRNAs (miR−511−3p, −375−3p, −130−3p, −127−3p, −122−5p, −190b−5p, −504−3p, and −363−3p) in the UUO group (n = 8) and sham group (n = 8) were determined by qRT-PCR. Relative expression levels are shown as mean values and standard errors. Abbreviations: miR, microRNA; UUO, unilateral ureteral obstruction; qRT-PCR, quantitative real-time reverse-transcription polymerase chain reaction; NS, not significant. * p < 0.05.
Ijms 23 15423 g002
Figure 3. Modulation of miR−122−5p expression by miR−122−5p-mimic and -inhibitor. The expression levels of miR−122−5p were determined by qRT−PCR. Relative expression levels are shown as mean values and standard errors. (A) Relative expression levels were compared between the four groups: sham group (n = 4), UUO + no injection group (n = 4), UUO + miR−122−5p mimic group (n = 4), and UUO + control miRNA group (n = 4). (B) Relative expression levels were compared between the four groups: sham group (n = 4), UUO + no injection group (n = 4), UUO + miR−122−5p inhibitor group (n = 4), and UUO + control miRNA group (n = 4). Abbreviations: miR, microRNA; UUO, unilateral ureteral obstruction; qRT-PCR, quantitative real-time reverse-transcription polymerase chain reaction. * p < 0.05.
Ijms 23 15423 g003
Figure 4. The effects of an miR−122−5p mimic and inhibitor on the severity of renal fibrosis. The expression levels of three mRNAs (COL1A2, FN1, and α-SMA) were determined by qRT-PCR. Relative expression levels are shown as mean values and standard errors. Relative expression levels of mRNAs were compared between the four groups: UUO + no injection group (n = 4), UUO + miR−122−5p mimic group (n = 4), UUO + miR−122−5p inhibitor group (n = 4), and UUO + control miRNA group (n = 4). Abbreviations: miR, microRNA; UUO, unilateral ureteral obstruction; mRNA, messenger RNA; COL1A2, collagen 1A2; FN1, fibronectin 1; α-SMA, α-smooth muscle actin; qRT-PCR, quantitative real-time reverse-transcription polymerase chain reaction. NS, not significant. * p < 0.05.
Ijms 23 15423 g004
Figure 5. Kidney histology. Severity of renal fibrosis was evaluated by AZAN staining and Sirius red staining. (A) Representative images of AZAN staining of kidney sections. (B) Representative images of Sirius red staining of kidney sections. (C) Renal fibrosis area was evaluated by Sirius red staining. Fibrotic areas were compared between the four groups: UUO + no injection group (n = 6), UUO + miR−122−5p mimic group (n = 6), UUO + miR−122−5p inhibitor group (n = 6), and UUO + control miRNA group (n = 6). Scale bar = 100 µm. * p < 0.05. Abbreviations: miR, microRNA; UUO, unilateral ureteral obstruction.
Ijms 23 15423 g005
Figure 6. Serum blood urea nitrogen concentrations. Serum blood urea nitrogen concentrations (mg/dL) were compared between the four groups: UUO + no injection group (n = 4), UUO + miR−122−5p mimic group (n = 4), UUO + miR−122−5p inhibitor group (n = 4), and UUO + control miRNA group (n = 4). Abbreviations: miR, microRNA; UUO, unilateral ureteral obstruction; NS, not significant. * p < 0.05.
Ijms 23 15423 g006
Figure 7. The effects of miR−122−5p on fibrosis-related mRNAs. The expression levels of six mRNAs (TGFBR2, FOXO3, TGIF1, CDC42BPB, EPO, and HIF3A) were determined by qRT-PCR. Relative expression levels are shown as mean values and standard errors. Relative expression levels of mRNAs were compared between the four groups: UUO + no injection group (n = 4), UUO + miR−122−5p mimic group (n = 4), UUO + miR−122−5p inhibitor group (n = 4), and UUO + control miRNA group (n = 4). Abbreviations: miR, microRNA; mRNA, messenger RNA; UUO, unilateral ureteral obstruction; qRT-PCR, quantitative real-time reverse-transcription polymerase chain reaction; TGFBR2, transforming growth factor, beta receptor II; FOXO3, forkhead box O3; TGIF1, Homeobox protein TGIF1; CDC42BPB, CDC42 binding protein kinase beta; EPO, erythropoietin; HIF3A, hypoxia-inducible factor 3 alpha; NS, not significant. * p < 0.05.
Ijms 23 15423 g007
Figure 8. IHC analysis. The protein levels of TGFBR2 and FOXO3 were evaluated. Representative images of IHC to detect (A) TGFBR2 and (B) FOXO3 in kidney sections. Comparison of (C) TGFBR2 and (D) FOXO3 positive areas (brown stain). IHC positive areas were quantitatively evaluated and compared between the four groups: UUO + no injection group (n = 6), UUO + miR−122−5p mimic group (n = 6), UUO + miR−122−5p inhibitor group (n = 6), and UUO + control miRNA group (n = 6). Abbreviations: IHC, immunohistochemistry; miR, microRNA; UUO, unilateral ureteral obstruction; TGFBR2, transforming growth factor, beta receptor II; FOXO3, forkhead box O3; NS, not significant. Scale bar = 100 µm. * p < 0.05.
Ijms 23 15423 g008
Figure 9. Analysis of downstream factors of FOXO3. The expression levels of 15 genes downstream of FOXO3 (SOD2, CAT, BNIP3, ATG12, LC3, CTSL, BCL2, FASL, TRAIL, BBC3, RBL2, CDKN1B, PEPCK, G6PC, and FBXO32) were evaluated by qRT-PCR. Relative expression levels of genes were compared between the four groups: UUO + no injection group (n = 4), UUO + miR−122−5p mimic group (n = 4), UUO + miR−122−5p inhibitor group (n = 4), and UUO + control miRNA group (n = 4). Relative expression levels are shown as mean values and standard errors. Abbreviations: miR, microRNA; UUO, unilateral ureteral obstruction; qRT-PCR, quantitative real-time reverse-transcription polymerase chain reaction; SOD2, superoxide dismutase 2, mitochondrial; CAT, catalase; BNIP, BCL2/adenovirus E1B 19 kDa protein-interacting protein 3; ATG12, autophagy related 12; LC3, microtubule-associated proteins 1A/1B light chain 3B; CTSL, cathepsin L1; BCL2, B-cell lymphoma 2; FASL, fas ligand; TRAIL, TNF-related apoptosis-inducing ligand; BBC3, Bcl-2-binding component 3; RBL2, retinoblastoma-like protein 2; CDKN1B, cyclin-dependent kinase inhibitor 1B; PEPCK, phosphoenolpyruvate carboxykinase; G6PC, glucose-6-phosphatase, catalytic subunit; FBXO32, F-box only protein 32; NS, not significant. * p < 0.05.
Ijms 23 15423 g009
Table 1. miRNAs involved renal fibrosis.
microRNASequencesFold Changep
(UUO Mice/Control Mice)
miR−511−3pAAUGUGUAGCAAAAGACAGGAU312.3 <0.01
miR−375−3pUUUGUUCGUUCGGCUCGCGUGA143.0 <0.01
miR−130b−3pCAGUGCAAUGAUGAAAGGGCAU61.8 <0.01
miR−127−3pUCGGAUCCGUCUGAGCUUGGCU55.7 <0.01
miR−466b−3pAUACAUACACGCACACAUAAGA48.8 <0.01
miR−7211−3pUGGAGUGACUGUAGGGAGGAUGC41.7 <0.01
miR−669l−5pAGUUGUGUGUGCAUGUAUAUGU40.6 <0.01
miR−214−5pUGCCUGUCUACACUUGCUGUGC39.1 <0.01
miR−6929−3pAGGGAGGAGCAGCAUCUGUGA38.9 <0.01
miR−467b−5pGUAAGUGCCUGCAUGUAUAUG35.5 <0.01
miR−8109CCCGCGGCCG33.4 <0.01
miR−467a−3pTGTAGGTGTGTGTATGTATA33.3 <0.01
miR−136−5pCCATCATCAAAACAAATGGAGT30.9 <0.01
miR−421−3pGCGCCCAATTAATGTCTG26.0 <0.01
miR−467e−5pACATATACATGCTCACACT25.6 <0.01
miR−290b−3pTACTCAAACTATGGGGGC19.0 <0.01
miR−1907ACCTCCAGATCCTCTG17.7 <0.01
miR−1967GCATCTTCTCCCCAG17.7 <0.01
miR−7687−5pAGCCTGCGCCTCA17.4 <0.01
miR−106b−3pGCAGCAAGTACCCAC15.1 <0.01
miR−379−5pCCTACGTTCCATAGTC14.5 <0.01
miR−3547−5pTCCCGGGCCCC14.1 <0.01
miR−1947−3pGGAGGGAGAGCTAGC13.6 <0.01
miR−3091−5pGCGGGCCCAACC13.5 <0.01
miR−134−5pCCCCTCTGGTCAA13.2 <0.01
miR−31−3pGATGGCAATATGTTGGCAT13.2 <0.01
miR−5099GGAGCACCACATCG11.4 <0.01
miR−141−5pTCCAACACTGCACTGGA10.9 <0.01
miR−15b−3pTAGAGCAGCAAATAATGATTCG10.9 <0.01
miR−300−3pGAAGAGAGCTTGCCCTTG10.8 <0.01
miR−342−5pCTCAATCACAGATAGCACC10.4 <0.01
miR−8095GGGACAGACAGCAGA10.2 <0.01
miR−6984−3pAGAAAGACAGGAAAGAAAG10.0 <0.01
miR−714GCGACCGACCGGCC9.6 <0.01
miR−3472GGTTCCTTCCAGCTT9.5 <0.01
miR−1957aGTCATATGCTCTACCACT9.4 <0.01
miR−5131GCTCGGGGCTCC8.8 <0.01
miR−7047−3pGGAAGGAGGAAGGGT8.6 <0.01
miR−3473cCTTATTATGGGGGCTGG8.1 <0.01
miR−21a−3pGACAGCCCATCGACT7.8 <0.01
miR−6392−3pAGAGGACCCGGCA7.2 <0.01
miR−710CTCAACTCTCCCCA7.0 <0.01
miR−7046−5pCCTGGCTCCCAGC6.9 <0.01
miR−146b−5pAGCCTATGGAATTCAGTTC6.4 <0.01
miR−770−3pCCAGCTCCACGTC6.0 <0.01
miR−6961−5pGGCCATTTCCTTCCC5.6 <0.01
miR−376a−3pACGTGGATTTTCCTCTA5.5 <0.01
miR−6354AGAGACCTGATCCCCA5.3 <0.01
miR−1931GCCATCGCACCAGC5.2 <0.01
miR−501−3pCAAATCCTTGCCCGG4.9 <0.01
miR−21a−5pTCAACATCAGTCTGATAAGC4.9 <0.01
miR−132−3pCGACCATGGCTGTAGA4.9 <0.01
miR−468−3pCAGACACACGCACATCA4.7 <0.01
miR−214−3pACTGCCTGTCTGT4.4 <0.01
miR−7672−5pTCGCCCGCTGTCA4.4 <0.01
miR−292b−3pATACTCAAACTGGGGGC4.0 <0.01
miR−7063−5pTGTGCTCAGCCTGC4.0 <0.01
miR−5132−5pCCTGAGTCCACCACC4.0 <0.01
miR−3093−3pCCAACCTCCCACGG4.0 <0.01
miR−142a−3pTCCATAAAGTAGGAAACACTACA4.0 <0.01
miR−5121GGAGATGTCTCATCACA4.0 <0.01
miR−223−3pTGGGGTATTTGACAAACTGAC3.9 <0.01
miR−224−5pAACGGAACCACTAGTGACTTA3.9 <0.01
miR−3572−5pGTCCACCTTGCCCT3.8 <0.01
miR−6963−5pCCAGGTTCTGCCATC3.8 <0.01
miR−6921−5pGCTTCCTACCTCATGC3.7 <0.01
miR−467a−5pCGCATATACATGCAGGCA3.5 <0.01
miR−6349CGCATGCCCCTCC3.5 <0.01
miR−669b−5pACATGCACATGCACACA3.5 <0.01
miR−299b−5pATGTATGTGGGACGGTAAAC3.5 <0.01
miR−7080−3pAGGGAACGGAGGGG3.5 <0.01
miR−142a−5pAGTAGTGCTTTCTACTTTA3.4 <0.01
miR−199a−5pGAACAGGTAGTCTGAACAC3.2 <0.01
miR−8093CACTCATGCTCTGCTC3.1 <0.01
miR−183−5pAGTGAATTCTACCAGTGCC3.1 <0.01
miR−7040−5pCGCCTCCATCTCCC3.0 <0.01
miR−718CGACACCCGGCCG3.0 <0.01
miR−7235−5pGCCCAGACCCCTC3.0 <0.01
miR−762GCTCTGTCCCGGC3.0 <0.01
miR−199a−3pTAACCAATGTGCAGACTACT3.0 <0.01
miR−672−5pTCACACACAGTACACCA2.9 <0.01
miR−18a−5pCTATCTGCACTAGATGCAC2.8 <0.01
miR−3067−3pCCTCTCCCAGGGC2.8 <0.01
miR−292a−5pCAAAAGAGCCCCCAG2.7 <0.01
miR−342−3pACGGGTGCGATTTCTGT2.7 <0.01
miR−20a−3pCTTTAAGTGCTCGTAATGCA2.7 <0.01
miR−let−7i−3pAGCAAGGCAGTAGCTT2.6 <0.01
miR−290a−3pGGGCTTAAAACTAGGCGGC2.6 <0.01
miR−182−5pCGGTGTGAGTTCTACC2.5 <0.01
miR−149−3pGCACCGCCCCC2.5 <0.01
miR−877−5pCCCTGCGCCATCT2.5 <0.01
miR−1949AACTATGCTGACATCCTG2.5 <0.01
miR−674−5pTACACCACTCCCAT2.5 <0.01
miR−199b−5pGAACAGGTAGTCTAAACACTGG2.5 <0.01
miR−31−5pCAGCTATGCCAGCATCT2.4 <0.01
miR−125a−3pGGCTCCCAAGAACCTC2.4 <0.01
miR−721TTCCCCCTTTTAATT2.4 <0.01
miR−7115−3pCTGTGGGGGCAGG2.3 <0.01
miR−3474GAATCCACGTCTCCTC2.3 <0.01
miR−28a−3pTCCAGCAGCTCACA2.2 <0.01
miR−3075−5pGTCCTTGGCTGCTC2.2 <0.01
miR−5126CCCCGCCCCCG2.2 <0.01
miR−155−5pACCCCTATCACAATTAGC2.1 <0.01
miR−2861CCGCCCGCCG2.1 <0.01
miR−5128AGCCATCTCGCCAGC2.1 <0.01
miR−135a−1−3pCGCCACGGCTCCA2.1 <0.01
miR−8110CCCCCCCCCCA2.1 <0.01
miR−211−3pGCCCCCCTTTGCT2.0 <0.01
miR−7118−5pGTTCCCTCTCCCGC2.0 <0.01
miR−6975−5pGCUGGGGAGAAAGGGGUUUGGCA−253.2 <0.01
miR−6918−5pUGCUGAGGACGGGAUUAGGUUCU−252.2 <0.01
miR−6904−5pUCCUGGGGUUAGAGUUGAGUGG−194.5 <0.01
miR−122−5pUGGAGUGUGACAAUGGUGUUUG−183.2 <0.01
miR−7682−3pCCUGUGGGUUGGGUUGGCUUU−164.8 <0.01
miR−129b−5pGCUUUUUGGGGUAAGGGCUUCC−134.9 <0.01
miR−190b−5pUGAUAUGUUUGAUAUUGGGUUG−107.9 <0.01
miR−504−3p AGGGAGAGCAGGGCAGGGUUUC−104.0 <0.01
miR−363−3pAAUUGCACGGUAUCCAUCUGUA−89.6 <0.01
miR−7218−5pUGCAGGGUUUAGUGUAGAGGG−85.3 <0.01
miR−8119GACCCTAGCTCCCTC−70.6 <0.01
miR−7080−5pCCAAACCCACCTCC−67.1 <0.01
miR−1927TCAGTCCCTAACATCCA−57.8 <0.01
miR−6990−5pAGAGCCCTGACTCACC−56.3 <0.01
miR−7234−3pCCTTCTACCCTAGAAAGA−51.7 <0.01
miR−6905−5pTCATTCAACCCAACCTG−49.6 <0.01
miR−7055−5pCCAACTCAGATAACCCA−46.6 <0.01
miR−190a−3pAGGAATATGCTTGATATATAGT−42.8 <0.01
miR−6401ACCCGACACCACTG−42.2 <0.01
miR−7233−5pCATCTATCTGTCCCTAACT−41.4 <0.01
miR−7657−5pTTACCTAACTATCCAACTATT−36.4 <0.01
miR−3078−3pCCTAAAGACTACCCCAG−35.4 <0.01
miR−7664−3pATTAGTTAACCCAGCCTAA−33.4 <0.01
miR−7086−5pTGCCCAAACCTTTCTC−33.1 <0.01
miR−6902−3pCTGAACCCACACATCA−32.7 <0.01
miR−188−3pTGCAAACCCTGCATGTG−31.2 <0.01
miR−7028−5pCTCCTGACCCAAGC−27.7 <0.01
miR−6481CATCTAAGCATTTTCAGTG−25.8 <0.01
miR−302c−5pGCAGGTAACCCCAT−24.6 <0.01
miR−6980−5pCTAACCTAGCCTCCCC−24.2 <0.01
miR−467b−3pGTGTTGGTGTGTGTAT−23.8 <0.01
miR−7219−3pAGTGTGTTAGAAACCCG−21.1 <0.01
miR−194−2−3pCAGATAACAGCAGCCC−19.6 <0.01
miR−7074−5pACTGGAGCCCTAGCC−19.0 <0.01
miR−6998−5pAGTCACTTTGCCCTCT−18.2 <0.01
miR−874−5pCTTACCCTGGTGCG−17.4 <0.01
miR−6923−5pACACCCCAATCCTCC−16.4 <0.01
miR−327ATCCTCATGCCCCT−15.7 <0.01
miR−1188−3pGCAGGGTGTGGTGG−15.7 <0.01
miR−3070−2−3pTCTACCCCTGACCATAG−14.9 <0.01
miR−101a−5pGCATCAGCACTGTGAT−10.9 <0.01
miR−3070−3pTCTACCCCTGACGGT−10.5 <0.01
miR−6926−5pTCACCATCCCTCACC−8.8 <0.01
miR−6981−5pGCCTTCAGCCTCTTC−8.6 <0.01
miR−3063−3pGGCGAGAGATCAGGA−8.6 <0.01
miR−6236CCTGACTGCCGGC−7.2 <0.01
miR−30c−1−3pGGAGTAAACAACCCTCTCC−6.0 <0.01
miR−883b−5pTGACTGCTACCCATT−5.6 <0.01
miR−26b−3pGAGCCAAGTAATGGAGAACA−5.3 <0.01
miR−744−3pAGGTTGAGGTTAGTGGCA−5.1 <0.01
miR−6988−5pTGGGCCTCAGCTCT−4.9 <0.01
miR−376b−3pAAGTGGATGTTCCTCTAT−4.3 <0.01
miR−6393ACTCAGTGTGCTTCGT−4.1 <0.01
miR−7094b−2−5pTCAGACCCTGTATCCTC−3.9 <0.01
miR−7056−5pAACCTCTCTGTCCTCC−3.9 <0.01
miR−6971−5pAGCCTCTACACCCTCC−3.9 <0.01
miR−497bCCACGTCCAAACCA−3.9 <0.01
miR−874−3pTCGGTCCCTCGGG−3.6 <0.01
miR−192−3pCTGTGACCTATGGAATTG−3.5 <0.01
miR−873bGTGTGCATTTGCAGGA−3.5 <0.01
miR−7075−5pAAAACCATGTCCTCCTC−3.4 <0.01
miR−703TTCTTTCCTTCTGAAGGTT−3.3 <0.01
miR−193a−5pTCATCTTGCCCGCA−3.3 <0.01
miR−7670−5pTTCCCAATCTGCCCA−3.2 <0.01
miR−8094TCTTCTCGTTGTCCTTC−3.2 <0.01
miR−144−5pACTTACAGTATATGATGATATCC−3.2 <0.01
miR−669c−3pTTTACTTGTGTGTGTGTG−3.0 <0.01
miR−193a−3pACTGGGACTTTGTAGGC−3.0 <0.01
miR−190a−5pACCTAATATATCAAACATATCA−3.0 <0.01
miR−30e−5pCTTCCAGTCAAGGATGT−2.9 <0.01
miR−302c−3pCCACTGAAACATGGAAGCAC−2.8 <0.01
miR−192−5pGGCTGTCAATTCATAGGTC−2.7 <0.01
miR−30e−3pGCTGTAAACATCCGACTG−2.7 <0.01
miR−681AGCTGCCTGCCAG−2.6 <0.01
miR−376c−3pACGTGAAATTTCCTCTATGTT−2.6 <0.01
miR−466gTGTGTGTGCATGTGTC−2.6 <0.01
miR−30c−5pGCTGAGAGTGTAGGATGT−2.6 <0.01
miR−194−5pTCCACATGGAGTTGCT−2.6 <0.01
miR−802−5pAAGGATGAATCTTTGTTACTGA−2.6 <0.01
miR−365−3pATAAGGATTTTTAGGGGCATTA−2.5 <0.01
miR−378a−5pACACAGGACCTGGAGTCA−2.5 <0.01
miR−7211−5pGGTGGAGTGGCAGA−2.5 <0.01
miR−5113ACAGGATCTCTCTCCTC−2.5 <0.01
miR−378bTCTTCTGACTCCAAGTC−2.5 <0.01
miR−29c−5pGAACACCAGGAGAAATCGGTC−2.4 <0.01
miR−378dACCTTCTGACTCCAAGG−2.4 <0.01
miR−185−5pTCAGGAACTGCCTTTCT−2.4 <0.01
miR−378a−3pCCTTCTGACTCCAA−2.4 <0.01
miR−7219−5pTCTCAACCCTGAGCTC−2.3 <0.01
miR−29c−3pTAACCGATTTCAAATGGTGCTA−2.3 <0.01
miR−378cGCTTCTGACTCCAAGT−2.3 <0.01
miR−3473bCTGAGCCATCTCTCCA−2.3 <0.01
miR−30a−3pGCTGCAAACATCCGACT−2.3 <0.01
miR−let−7f−1−3pGGGAAGGCAATAGATTGTAT−2.3 <0.01
miR−203−3pCTAGTGGTCCTAAACATT−2.3 <0.01
miR−101cTCAGTTATCACAGTACTGT−2.2 <0.01
miR−129−1−3pATACTTTTTGGGGTAAGGG−2.2 <0.01
miR−144−3pAGTACATCATCTATACTGTA−2.2 <0.01
miR−455−5pCGATGTAGTCCAAAGGCA−2.2 <0.01
miR−451aAACTCAGTAATGGTAACGGTTT−2.2 <0.01
miR−3095−3pAAAAGCTCTCTCTCCAGT−2.2 <0.01
miR−690TTTGGTTGTGAGCCTA−2.2 <0.01
miR−455−3pGTGTATATGCCCGTGG−2.1 <0.01
miR−466qACGTATGTGTGTGTGTG−2.1 <0.01
miR−3099−3pTCCCCAACCTCTCTC−2.1 <0.01
miR−760−3pTCCCCACAGACCCA−2.1 <0.01
miR−3473aTGCTGAGCCATCTCTC−2.1 <0.01
miR−30a−5pCTTCCAGTCGAGGATGT−2.1 <0.01
miR−29b−1−5pTAAACCACCATATGAAACCAGC−2.1 <0.01
miR−664−5pCCAGTCATTTTCCCCA−2.0 <0.01
miR−30c−2−3pAGAGTAAACAGCCTTCTCC−2.0 <0.01
miR−33−5pTGCAATGCAACTACAATGCAC−2.0 <0.01
miR−295−5pGAAGTGTGCCCCAC−2.0 <0.01
Abbreviations: miRNA, microRNA; UUO, unilateral ureteral obstruction.
Table 2. SOD2 and LC3 in human CKD and its causative diseases.
TargetAuthorsCountryYearPatients and NumberResults and FindingsReferences
SOD2Möllsten et al.Sweden2009Type I DM patients
(n = 411)
Genetic SOD2 polymorphisms were associated with the development of DM nephropathy caused by type Ⅰ DM.[51]
SOD2Prunotto et al.Italy2010MN patient
(n = 24)
Anti-SOD2 antibodies were specifically detected in the serum of primary MN patients. Anti-SOD2 antibodies were deposited in the glomerular podocytes of MN patients.[52]
SOD2Olsson et al.Sweden2011CKD patients (n = 30)Neutrophils from CKD patients were stimulated with lipopolysaccharide. SOD2 gene expression was decreased in the neutrophils of CKD patients but not controls.[53]
SOD2Zaza et al.Italy2013PD patients (n = 15)Plasma malondialdehyde (an oxidative marker) levels were higher in PD patients compared with controls, leading to increased SOD2 gene expression.[54]
SOD2Mohammedi et alFrance2014Type Ⅰ DM patients (n = 1285)SOD2 gene mutations were associated with the onset and progression of DM nephropathy, plasma advanced oxidation protein product (an oxidative marker) concentrations, and antioxidant activity in type Ⅰ DM patients. [55]
SOD2Krueger et al.Denmark
Germany
2016CKD patients (n = 120)
HD patients (n = 81)
SOD2 protein levels in monocytes decreased as the CKD stage progressed. After HD induction, SOD2 protein levels began to increase.[56]
SOD2Jerotic et al.Serbia.2019HD patients (n = 256)Genetic SOD2 polymorphisms were associated with risk of end-stage renal disease.[57]
SOD2Corredor et al.Spain2020CKD patients (n = 548)Genetic SOD2 polymorphisms were associated with the erythropoietin resistance of renal anemia.[58]
LC3Miyazaki et al.Japan2014IgAN patients (n = 48)In IgAN patients, prorenin receptor expression was an autophagy (LC3)-mediated compensatory response to IgAN progression.[59]
LC3Xiong et al.USA2019DM nephropathy patients
(n = 12)
LC3 protein obtained from urinary stem cells in DM nephropathy patients was decreased compared with the control group.[60]
LC3Liu et al.China2019DM nephropathy patients
(n = 11)
Podocytes of DM nephropathy patients had more LC3 positive puncta compared with the control group.[61]
LC3Ogawa-Akiyama et al.Japan2020MCNS patients (n = 41)
MN patients (n = 37)
LC3 was localized to glomerular podocytes, suggesting autophagy mainly occurred in the glomerular podocytes of MCNS patients.[62]
LC3da Silva et al.Brazil2020FSGS patients (n = 22)
MCNS patients (n = 27)
LC3-positive glomerular podocytes were denser in MCNS patients than in FSGS patients.[63]
Abbreviations: SOD2, superoxide dismutase 2, mitochondrial; LC3, microtubule-associated proteins 1A/1B light chain 3B, DM, diabetes mellitus; MN, membranous nephropathy; CKD, chronic kidney disease; PD, peritoneal dialysis; HD, hemodialysis; IgAN, immunoglobulin a nephropathy; MCNS, minimal change nephrotic syndrome; FSGS, focal segmental glomerulosclerosis.
Publisher’s Note: MDPI stays neutral with regard to jurisdictional claims in published maps and institutional affiliations.

