
Tolerogenic Dendritic Cells Induce Apoptosis-Independent T Cell Hyporesponsiveness of SARS-CoV-2-Specific T Cells in an Antigen-Specific Manner
 , , and
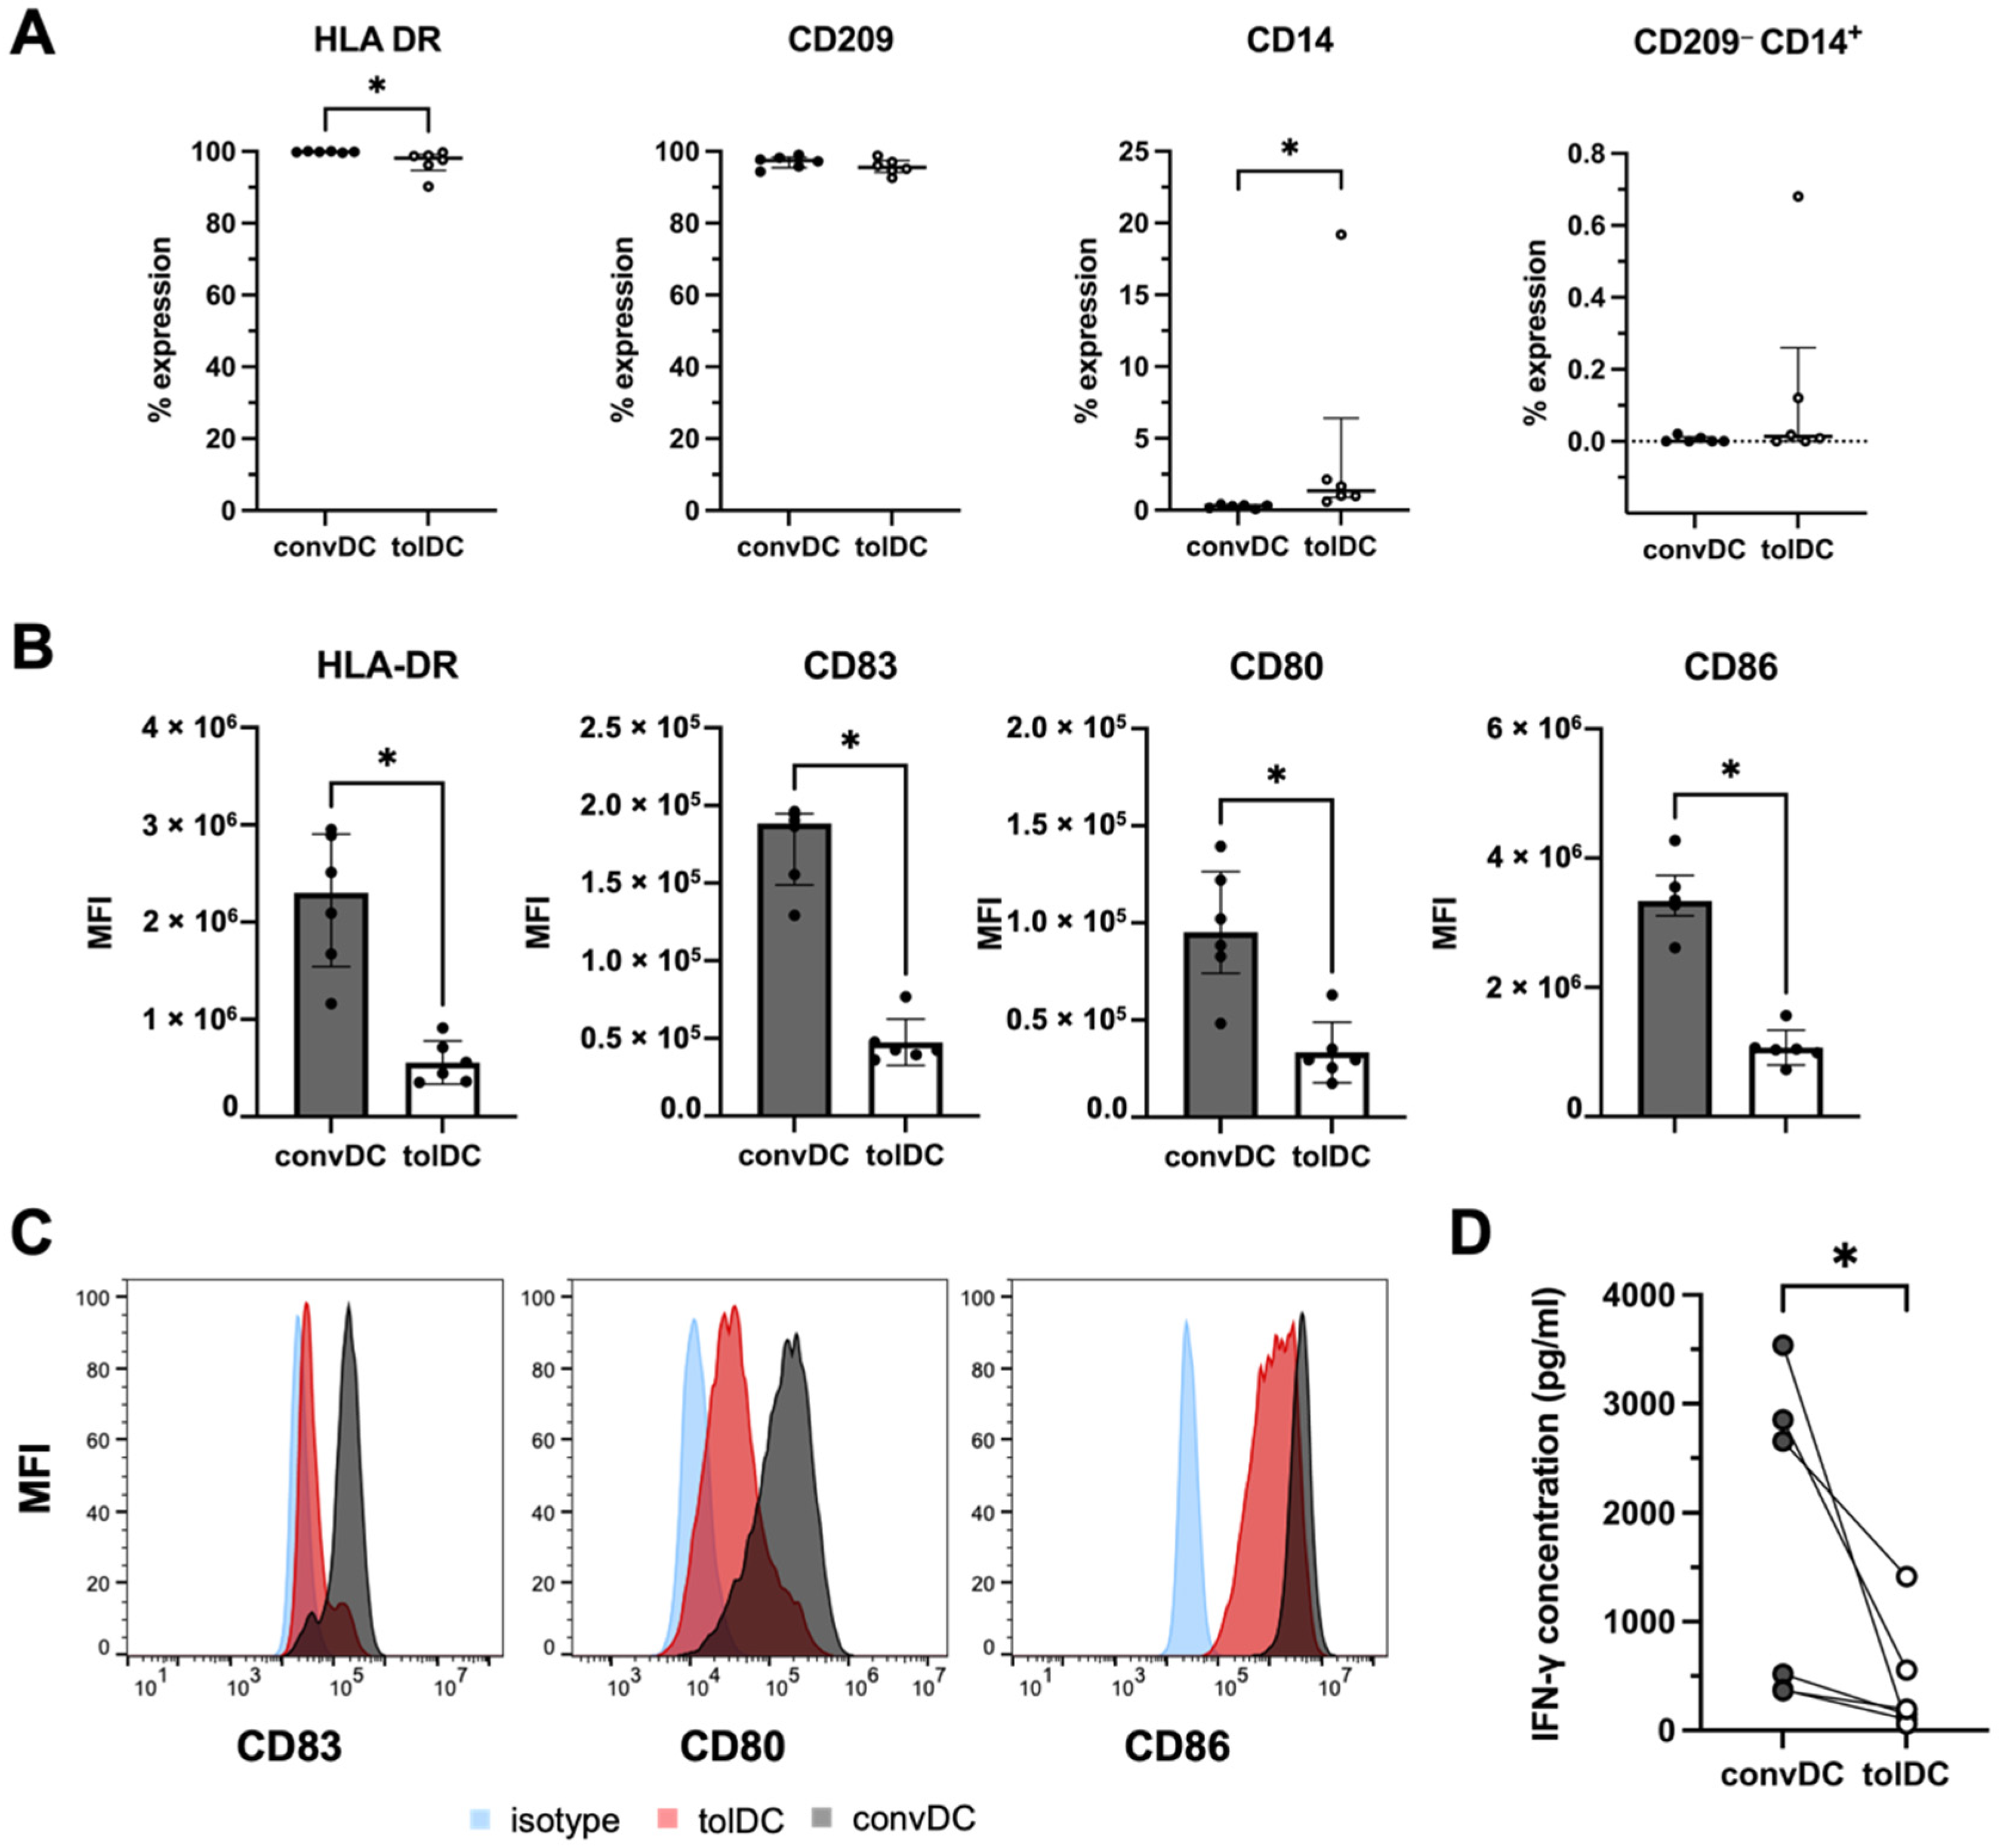
Abstract
:1. Introduction
2. Results
2.1. VitD3-Treated tolDC Display a Semimature Phenotype and Induce T-Cell Hyporesponsiveness in an Allo-MLR
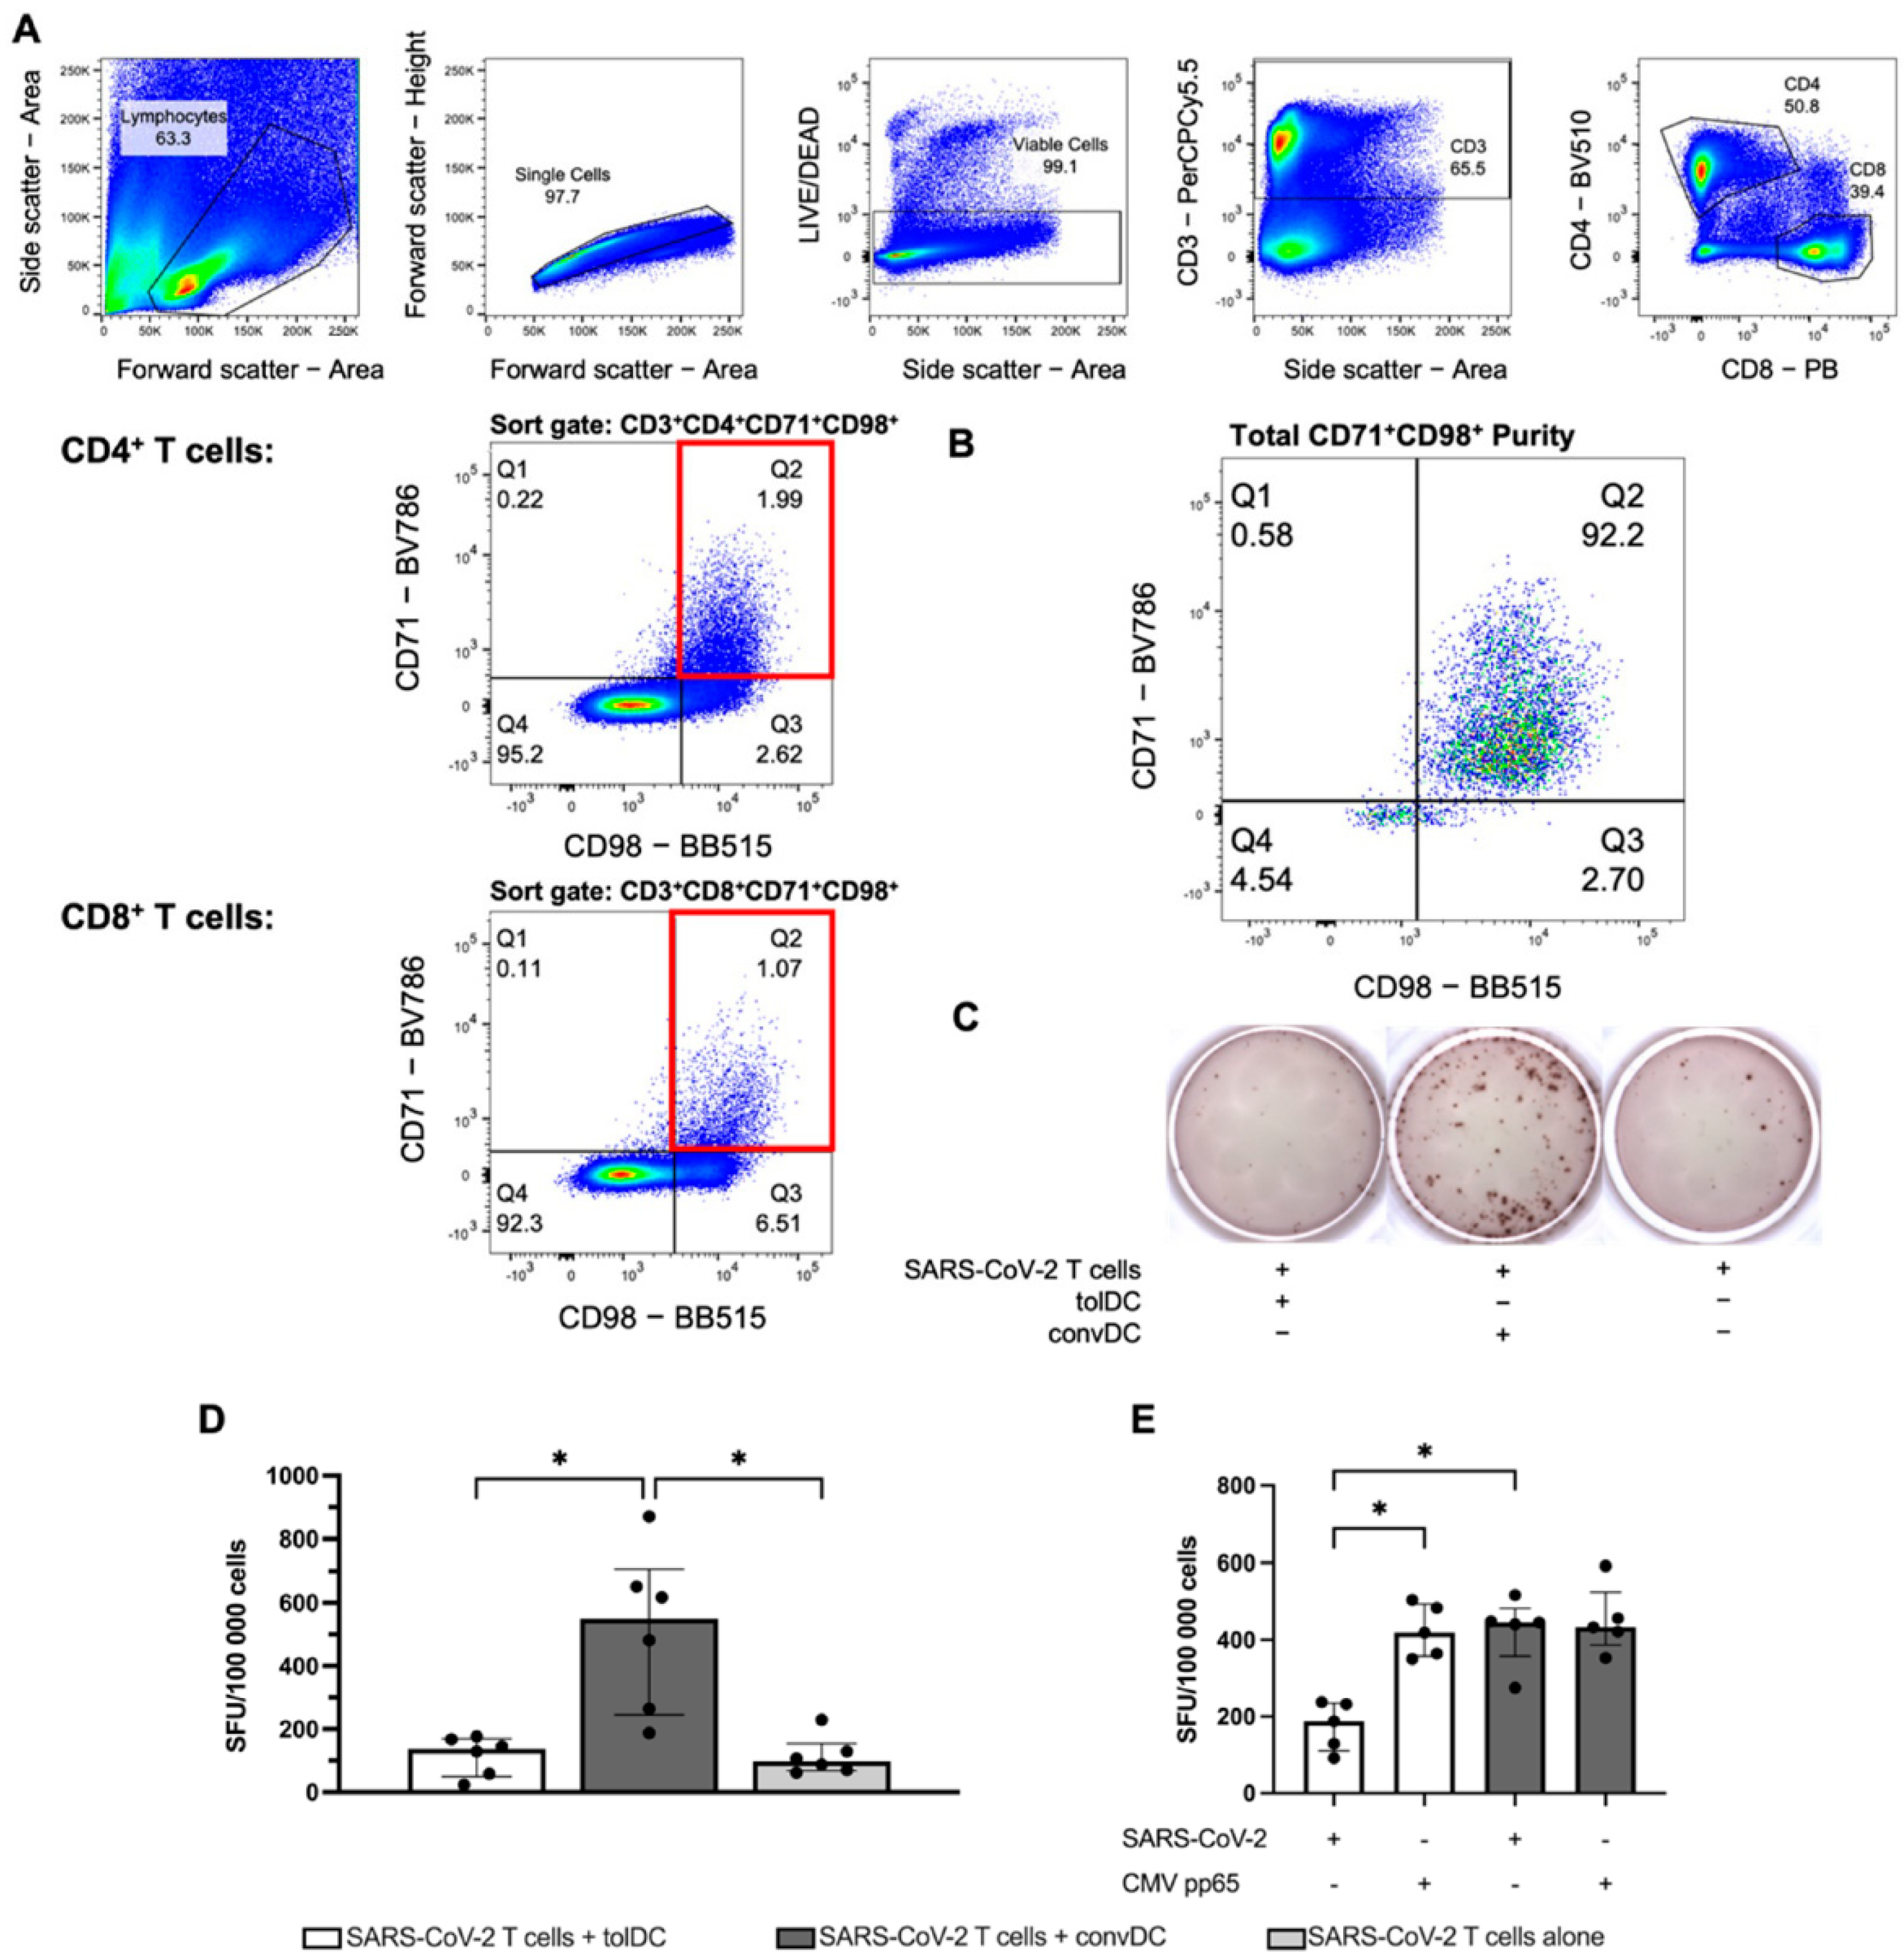
2.2. TolDC Induce Antigen-Specific T Cell Hyporesponsiveness in SARS-CoV-2-Specific T Cells
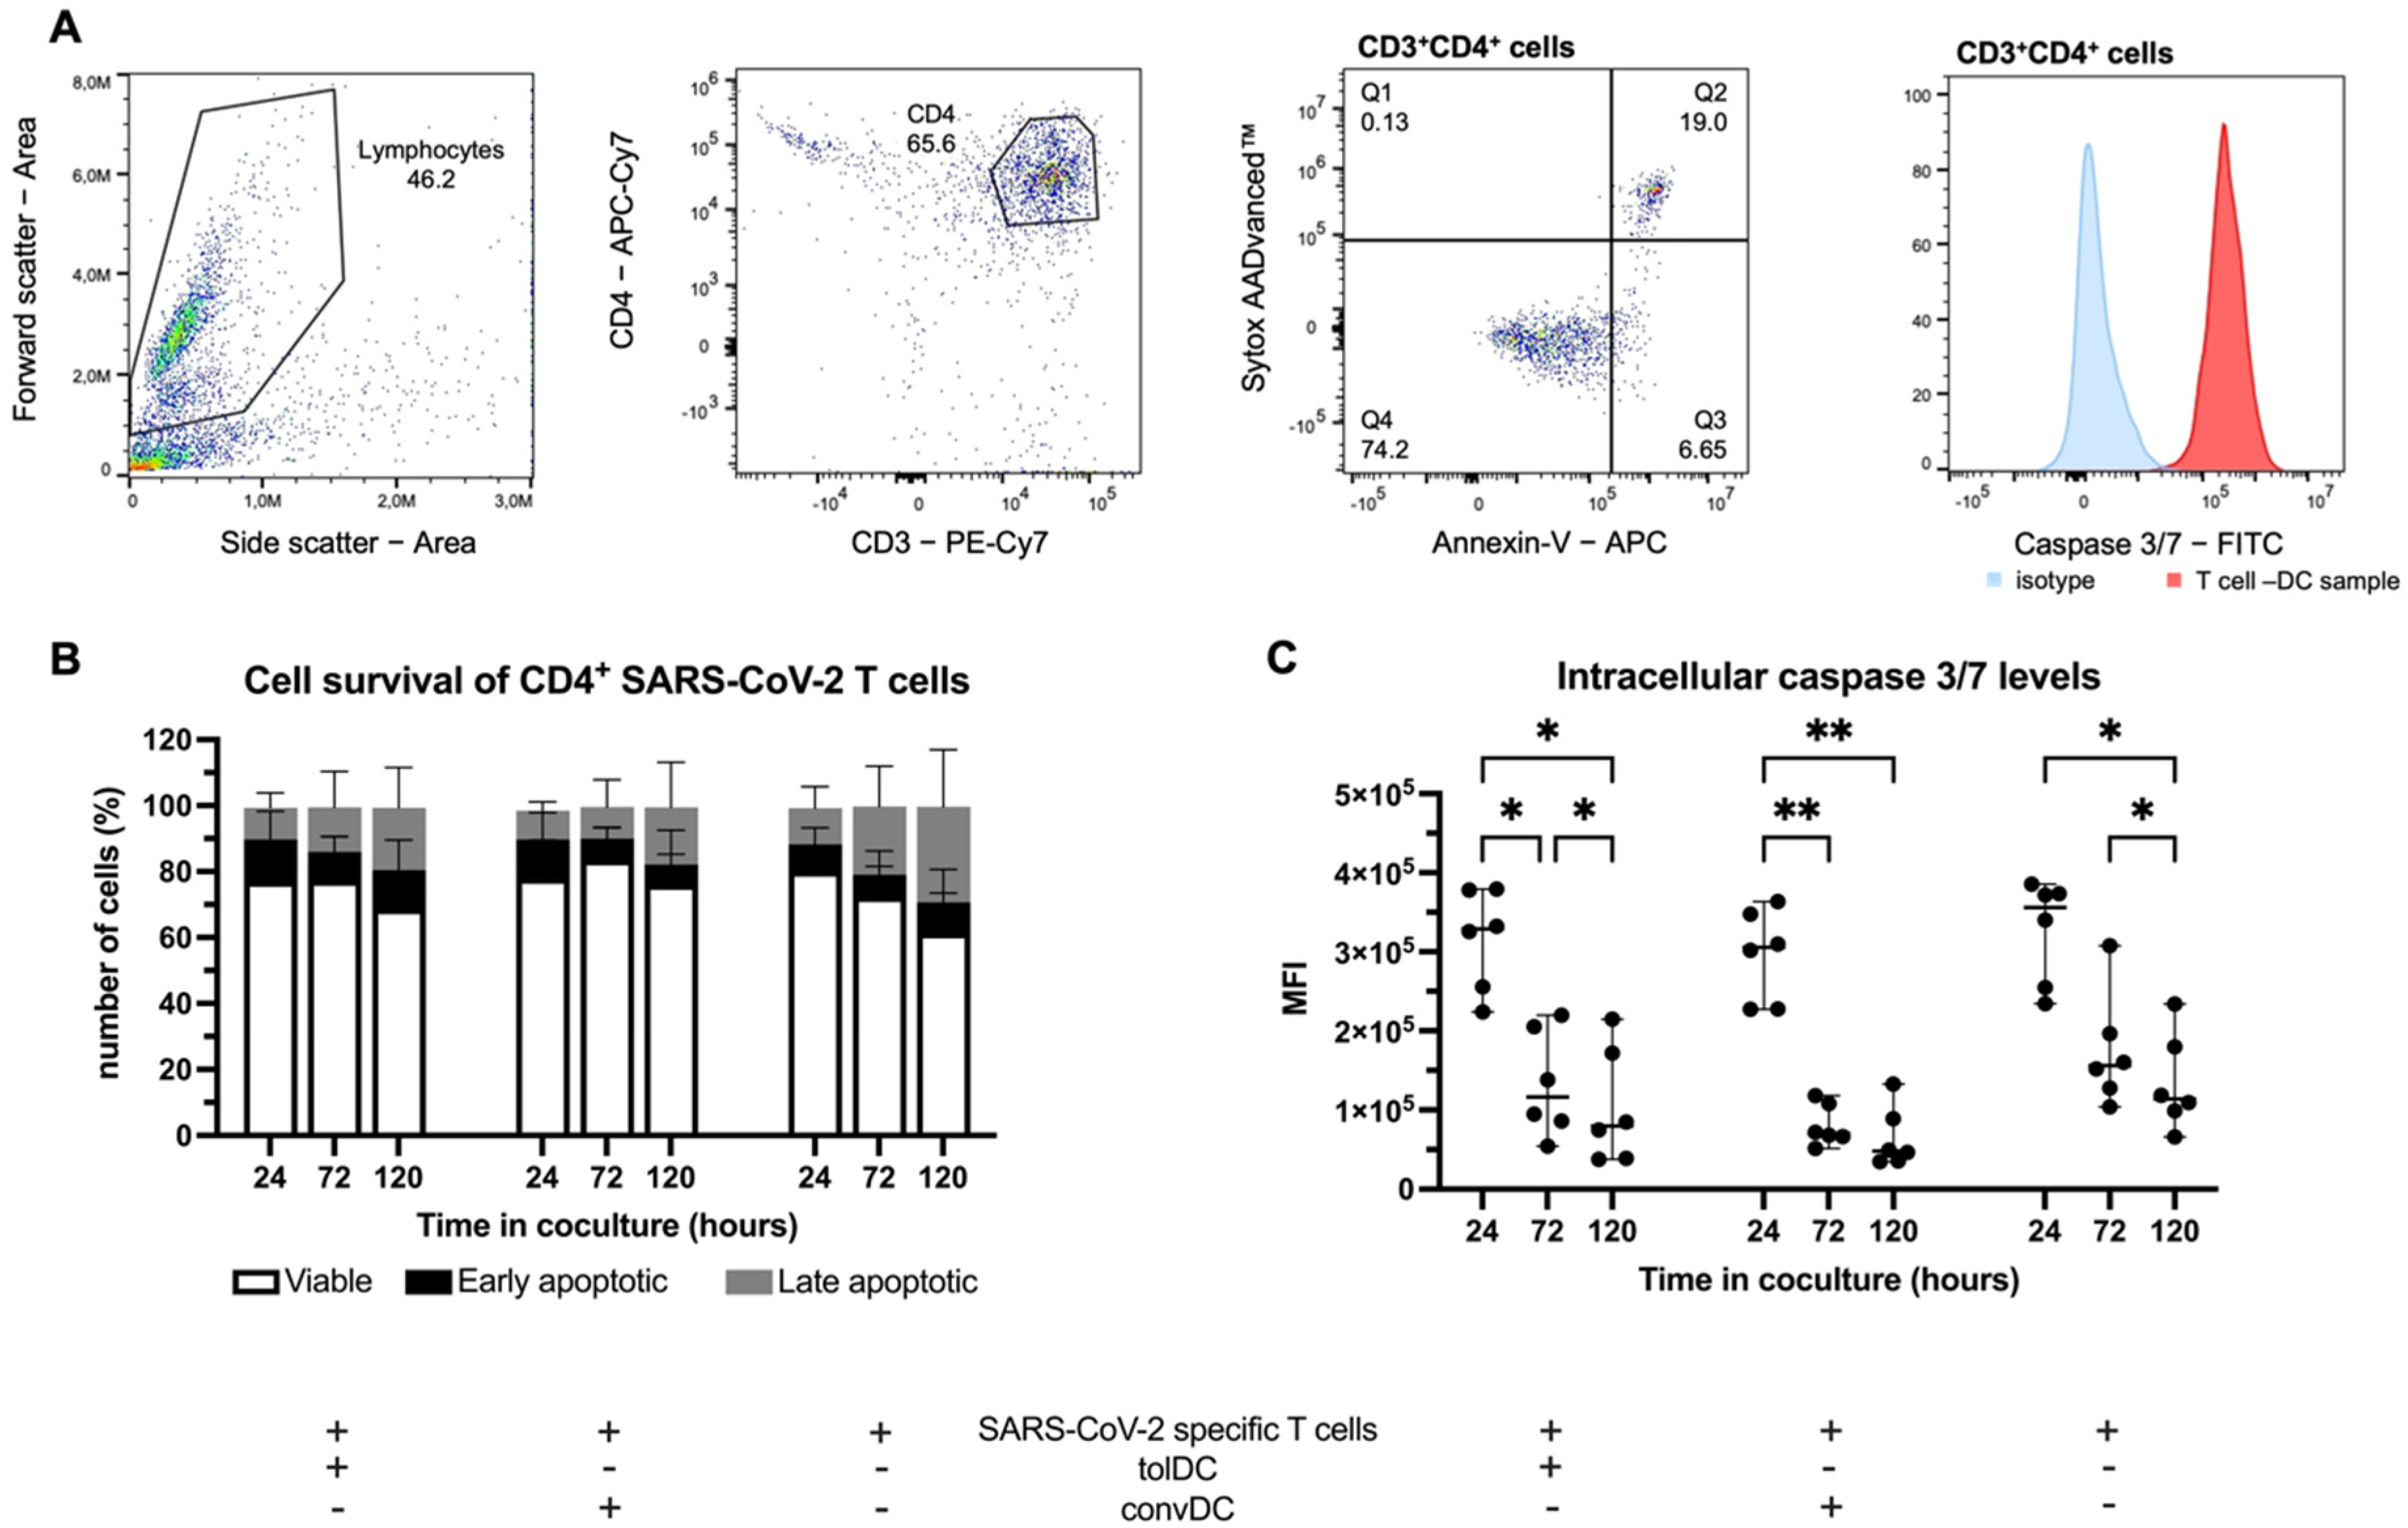
2.3. SARS-CoV-2-Specific T Cell Hyporesponsiveness Induced by tolDC Is Not Mediated by the Apoptosis of CD4+ T Cells
3. Discussion
4. Materials and Methods
4.1. Human COVID-19 Seropositive Blood Samples
4.2. Monocyte-Derived Dendritic Cell Culture
4.3. Immunophenotyping of DC
4.4. Allogeneic Mixed Lymphocyte Reaction (Allo-MLR)
4.5. In Vitro Activation and Isolation of SARS-CoV-2-Specific T Cell Populations
4.6. DC-T Cell and DC-PBL Coculture
4.7. Statistical Analysis
5. Conclusions
Supplementary Materials
Author Contributions
Funding
Institutional Review Board Statement
Informed Consent Statement
Data Availability Statement
Acknowledgments
Conflicts of Interest
References
- Ganesh, B.; Rajakumar, T.; Malathi, M.; Manikandan, N.; Nagaraj, J.; Santhakumar, A.; Elangovan, A.; Malik, Y.S. Epidemiology and pathobiology of SARS-CoV-2 (COVID-19) in comparison with SARS, MERS: An updated overview of current knowledge and future perspectives. Clin. Epidemiol. Glob. Health 2021, 10, 100694. [Google Scholar] [CrossRef] [PubMed]
- World Health Organization. WHO Coronavirus (COVID-19) Dashboard; WHO: Geneva, Switzerland, 2021. [Google Scholar]
- Hu, B.; Guo, H.; Zhou, P.; Shi, Z.L. Characteristics of SARS-CoV-2 and COVID-19. Nat. Rev. Microbiol. 2021, 19, 141–154. [Google Scholar] [CrossRef] [PubMed]
- Fernández-Sarmiento, J.; Acevedo, L.; Mulett, H.; Bastidas, S.; Sarta, M.; Durán, N.; Chacón, S.; Bejarano-Quintero, A.M.; Mizar, O.; Pérez, A.; et al. Severe SARS-CoV-2 infection in critical care. Trends Anaesth. Crit. Care 2020, 34, 28–37. [Google Scholar] [CrossRef]
- Diao, B.; Wang, C.; Tan, Y.; Chen, X.; Liu, Y.; Ning, L.; Chen, L.; Li, M.; Liu, Y.; Wang, G.; et al. Reduction and Functional Exhaustion of T Cells in Patients with Coronavirus Disease 2019 (COVID-19). Front. Immunol. 2020, 11, 827. [Google Scholar] [CrossRef]
- Chen, Z.; John Wherry, E. T cell responses in patients with COVID-19. Nat. Rev. Immunol. 2020, 20, 529–536. [Google Scholar] [CrossRef]
- Shrotri, M.; van Schalkwyk, M.C.I.; Post, N.; Eddy, D.; Huntley, C.; Leeman, D.; Rigby, S.; Williams, S.V.; Bermingham, W.H.; Kellam, P.; et al. T cell response to SARS-CoV-2 infection in humans: A systematic review. PLoS ONE 2021, 16, e0245532. [Google Scholar] [CrossRef]
- Wang, F.; Hou, H.; Luo, Y.; Tang, G.; Wu, S.; Huang, M.; Liu, W.; Zhu, Y.; Lin, Q.; Mao, L.; et al. The laboratory tests and host immunity of COVID-19 patients with different severity of illness. JCI Insight 2020, 5, e137799. [Google Scholar] [CrossRef] [Green Version]
- Jamal, M.; Bangash, H.I.; Habiba, M.; Lei, Y.; Xie, T.; Sun, J.; Wei, Z.; Hong, Z.; Shao, L.; Zhang, Q. Immune dysregulation and system pathology in COVID-19. Virulence 2021, 12, 918–936. [Google Scholar] [CrossRef]
- Salton, F.; Confalonieri, P.; Campisciano, G.; Cifaldi, R.; Rizzardi, C.; Generali, D.; Pozzan, R.; Tavano, S.; Bozzi, C.; Lapadula, G.; et al. Cytokine Profiles as Potential Prognostic and Therapeutic Markers in SARS-CoV-2-Induced ARDS. J. Clin. Med. 2022, 11, 2951. [Google Scholar] [CrossRef]
- Ghazavi, A.; Ganji, A.; Keshavarzian, N.; Rabiemajd, S.; Mosayebi, G. Cytokine profile and disease severity in patients with COVID-19. Cytokine 2021, 137, 155323. [Google Scholar] [CrossRef]
- Kalfaoglu, B.; Almeida-Santos, J.; Tye, C.A.; Satou, Y.; Ono, M. T-Cell Hyperactivation and Paralysis in Severe COVID-19 Infection Revealed by Single-Cell Analysis. Front. Immunol. 2020, 11, 589380. [Google Scholar] [CrossRef] [PubMed]
- Gadotti, A.C.; de Castro Deus, M.; Telles, J.P.; Wind, R.; Goes, M.; Garcia Charello Ossoski, R.; de Padua, A.M.; de Noronha, L.; Moreno-Amaral, A.; Baena, C.P.; et al. IFN-gamma is an independent risk factor associated with mortality in patients with moderate and severe COVID-19 infection. Virus Res. 2020, 289, 198171. [Google Scholar] [CrossRef] [PubMed]
- Kang, C.K.; Han, G.C.; Kim, M.; Kim, G.; Shin, H.M.; Song, K.H.; Choe, P.G.; Park, W.B.; Kim, E.S.; Kim, H.B.; et al. Aberrant hyperactivation of cytotoxic T-cell as a potential determinant of COVID-19 severity. Int J. Infect. Dis. 2020, 97, 313–321. [Google Scholar] [CrossRef]
- Schub, D.; Klemis, V.; Schneitler, S.; Mihm, J.; Lepper, P.M.; Wilkens, H.; Bals, R.; Eichler, H.; Gartner, B.C.; Becker, S.L.; et al. High levels of SARS-CoV-2-specific T cells with restricted functionality in severe courses of COVID-19. JCI Insight 2020, 5, 2951. [Google Scholar] [CrossRef]
- Weiskopf, D.; Schmitz, K.S.; Raadsen, M.P.; Grifoni, A.; Okba, N.M.A.; Endeman, H.; van den Akker, J.P.C.; Molenkamp, R.; Koopmans, M.P.G.; van Gorp, E.C.M.; et al. Phenotype and kinetics of SARS-CoV-2-specific T cells in COVID-19 patients with acute respiratory distress syndrome. Sci. Immunol. 2020, 5, eabd2071. [Google Scholar] [CrossRef] [PubMed]
- Littlefield, K.M.; Watson, R.O.; Schneider, J.M.; Neff, C.P.; Yamada, E.; Zhang, M.; Campbell, T.B.; Falta, M.T.; Jolley, S.E.; Fontenot, A.P.; et al. SARS-CoV-2-specific T cells associate with inflammation and reduced lung function in pulmonary post-acute sequalae of SARS-CoV-2. PLoS Pathog 2022, 18, e1010359. [Google Scholar] [CrossRef] [PubMed]
- Rahman, S.; Montero, M.T.V.; Rowe, K.; Kirton, R.; Kunik, F., Jr. Epidemiology, pathogenesis, clinical presentations, diagnosis and treatment of COVID-19: A review of current evidence. Expert Rev. Clin. Pharmacol. 2021, 14, 601–621. [Google Scholar] [CrossRef]
- choot, T.S.; Kerckhoffs, A.P.M.; Hilbrands, L.B.; van Marum, R.J. Immunosuppressive Drugs and COVID-19: A Review. Front. Pharmacol. 2020, 11, 1333. [Google Scholar]
- Group, R.C.; Horby, P.; Lim, W.S.; Emberson, J.R.; Mafham, M.; Bell, J.L.; Linsell, L.; Staplin, N.; Brightling, C.; Ustianowski, A.; et al. Dexamethasone in Hospitalized Patients with COVID-19. N. Engl. J. Med. 2021, 384, 693–704. [Google Scholar]
- Cools, N.; Ponsaerts, P.; Van Tendeloo, V.F.; Berneman, Z.N. Balancing between immunity and tolerance: An interplay between dendritic cells, regulatory T cells, and effector T cells. J. Leukoc. Biol. 2007, 82, 1365–1374. [Google Scholar] [CrossRef] [Green Version]
- Mellman, I. Dendritic cells: Master regulators of the immune response. Cancer Immunol. Res. 2013, 1, 145–149. [Google Scholar] [CrossRef] [PubMed] [Green Version]
- Hilkens, C.M.; Isaacs, J.D. Tolerogenic dendritic cell therapy for rheumatoid arthritis: Where are we now? Clin. Exp. Immunol. 2013, 172, 148–157. [Google Scholar] [CrossRef] [PubMed]
- Willekens, B.; Presas-Rodriguez, S.; Mansilla, M.J.; Derdelinckx, J.; Lee, W.P.; Nijs, G.; De Laere, M.; Wens, I.; Cras, P.; Parizel, P.; et al. Tolerogenic dendritic cell-based treatment for multiple sclerosis (MS): A harmonised study protocol for two phase I clinical trials comparing intradermal and intranodal cell administration. BMJ Open 2019, 9, e030309. [Google Scholar] [CrossRef] [PubMed] [Green Version]
- Lee, W.P.; Willekens, B.; Cras, P.; Goossens, H.; Martinez-Caceres, E.; Berneman, Z.N.; Cools, N. Immunomodulatory Effects of 1,25-Dihydroxyvitamin D3 on Dendritic Cells Promote Induction of T Cell Hyporesponsiveness to Myelin-Derived Antigens. J. Immunol. Res. 2016, 2016, 5392623. [Google Scholar] [CrossRef] [PubMed] [Green Version]
- Macedo, C.; Turquist, H.; Metes, D.; Thomson, A.W. Immunoregulatory properties of rapamycin-conditioned monocyte-derived dendritic cells and their role in transplantation. Transplant. Res. 2012, 1, 16. [Google Scholar] [CrossRef] [Green Version]
- Comi, M.; Amodio, G.; Gregori, S. Interleukin-10-Producing DC-10 Is a Unique Tool to Promote Tolerance Via Antigen-Specific T Regulatory Type 1 Cells. Front. Immunol. 2018, 9, 682. [Google Scholar] [CrossRef]
- Boks, M.A.; Kager-Groenland, J.R.; Haasjes, M.S.; Zwaginga, J.J.; van Ham, S.M.; ten Brinke, A. IL-10-generated tolerogenic dendritic cells are optimal for functional regulatory T cell induction--A comparative study of human clinical-applicable DC. Clin. Immunol. 2012, 142, 332–342. [Google Scholar] [CrossRef]
- Giannoukakis, N.; Phillips, B.; Finegold, D.; Harnaha, J.; Trucco, M. Phase I (safety) study of autologous tolerogenic dendritic cells in type 1 diabetic patients. Diabetes Care 2011, 34, 2026–2032. [Google Scholar] [CrossRef] [Green Version]
- Kim, S.H.; Jung, H.H.; Lee, C.K. Generation, Characteristics and Clinical Trials of Ex Vivo Generated Tolerogenic Dendritic Cells. Yonsei Med. J. 2018, 59, 807–815. [Google Scholar] [CrossRef]
- Ritprajak, P.; Kaewraemruaen, C.; Hirankarn, N. Current Paradigms of Tolerogenic Dendritic Cells and Clinical Implications for Systemic Lupus Erythematosus. Cells 2019, 8, 1291. [Google Scholar] [CrossRef] [Green Version]
- Domogalla, M.P.; Rostan, P.V.; Raker, V.K.; Steinbrink, K. Tolerance through Education: How Tolerogenic Dendritic Cells Shape Immunity. Front. Immunol. 2017, 8, 1764. [Google Scholar] [CrossRef] [PubMed] [Green Version]
- Torres-Aguilar, H.; Aguilar-Ruiz, S.R.; Gonzalez-Perez, G.; Munguia, R.; Bajana, S.; Meraz-Rios, M.A.; Sanchez-Torres, C. Tolerogenic dendritic cells generated with different immunosuppressive cytokines induce antigen-specific anergy and regulatory properties in memory CD4+ T cells. J. Immunol. 2010, 184, 1765–1775. [Google Scholar] [CrossRef] [PubMed]
- Jansen, M.A.A.; Spiering, R.; Ludwig, I.S.; van Eden, W.; Hilkens, C.M.U.; Broere, F. Matured Tolerogenic Dendritic Cells Effectively Inhibit Autoantigen Specific CD4(+) T Cells in a Murine Arthritis Model. Front. Immunol. 2019, 10, 2068. [Google Scholar] [CrossRef] [PubMed]
- Morante-Palacios, O.; Fondelli, F.; Ballestar, E.; Martinez-Caceres, E.M. Tolerogenic Dendritic Cells in Autoimmunity and Inflammatory Diseases. Trends Immunol. 2021, 42, 59–75. [Google Scholar] [CrossRef] [PubMed]
- Sim, W.J.; Ahl, P.J.; Connolly, J.E. Metabolism Is Central to Tolerogenic Dendritic Cell Function. Mediat. Inflamm. 2016, 2016, 2636701. [Google Scholar] [CrossRef] [PubMed] [Green Version]
- Suwandi, J.S.; Nikolic, T.; Roep, B.O. Translating Mechanism of Regulatory Action of Tolerogenic Dendritic Cells to Monitoring Endpoints in Clinical Trials. Front. Immunol. 2017, 8, 1598. [Google Scholar] [CrossRef] [Green Version]
- Elias, G.; Ogunjimi, B.; van Tendeloo, V. Tracking Dye-Independent Approach to Identify and Isolate In Vitro Expanded T Cells. Cytom. A 2019, 95, 1096–1107. [Google Scholar] [CrossRef]
- Keller, K.G.; Reangsing, C.; Schneider, J.K. Clinical presentation and outcomes of hospitalized adults with COVID-19: A systematic review. J. Adv. Nurs. 2020, 76, 3235–3257. [Google Scholar] [CrossRef]
- Oliveira, E.; Parikh, A.; Lopez-Ruiz, A.; Carrilo, M.; Goldberg, J.; Cearras, M.; Fernainy, K.; Andersen, S.; Mercado, L.; Guan, J.; et al. ICU outcomes and survival in patients with severe COVID-19 in the largest health care system in central Florida. PLoS ONE 2021, 16, e0249038. [Google Scholar] [CrossRef]
- Bohn, M.K.; Hall, A.; Sepiashvili, L.; Jung, B.; Steele, S.; Adeli, K. Pathophysiology of COVID-19: Mechanisms Underlying Disease Severity and Progression. Physiology 2020, 35, 288–301. [Google Scholar] [CrossRef]
- Tario, J.D., Jr.; Conway, A.N.; Muirhead, K.A.; Wallace, P.K. Monitoring Cell Proliferation by Dye Dilution: Considerations for Probe Selection. Methods Mol. Biol. 2018, 1678, 249–299. [Google Scholar] [PubMed] [Green Version]
- Elias, G.; Ogunjimi, B.; van Tendeloo, V. Activation-induced surface proteins in the identification of antigen-responsive CD4 T cells. Immunol. Lett. 2020, 219, 1–7. [Google Scholar] [CrossRef] [PubMed]
- Navarro-Barriuso, J.; Mansilla, M.J.; Quirant-Sanchez, B.; Teniente-Serra, A.; Ramo-Tello, C.; Martinez-Caceres, E.M. Vitamin D3-Induced Tolerogenic Dendritic Cells Modulate the Transcriptomic Profile of T CD4(+) Cells Towards a Functional Hyporesponsiveness. Front. Immunol. 2020, 11, 599623. [Google Scholar] [CrossRef] [PubMed]
- Harry, R.A.; Anderson, A.E.; Isaacs, J.D.; Hilkens, C.M. Generation and characterisation of therapeutic tolerogenic dendritic cells for rheumatoid arthritis. Ann. Rheum. Dis. 2010, 69, 2042–2050. [Google Scholar] [CrossRef] [PubMed] [Green Version]
- van Wigcheren, G.F.; Roelofs, D.; Figdor, C.G.; Florez-Grau, G. Three distinct tolerogenic CD14(+) myeloid cell types to actively manage autoimmune disease: Opportunities and challenges. J. Autoimmun. 2021, 120, 102645. [Google Scholar] [CrossRef] [PubMed]
- Porritt, R.A.; Paschold, L.; Rivas, M.N.; Cheng, M.H.; Yonker, L.M.; Chandnani, H.; Lopez, M.; Simnica, D.; Schultheiss, C.; Santiskulvong, C.; et al. Identification of a unique TCR repertoire, consistent with a superantigen selection process in Children with Multi-system Inflammatory Syndrome. bioRxiv 2020. [Google Scholar] [CrossRef]
- Moreews, M.; Le Gouge, K.; Khaldi-Plassart, S.; Pescarmona, R.; Mathieu, A.L.; Malcus, C.; Djebali, S.; Bellomo, A.; Dauwalder, O.; Perret, M.; et al. Polyclonal expansion of TCR Vbeta 21.3(+) CD4(+) and CD8(+) T cells is a hallmark of Multisystem Inflammatory Syndrome in Children. Sci. Immunol. 2021, 6, eabh1516. [Google Scholar] [CrossRef]
- Graciano-Machuca, O.; Villegas-Rivera, G.; Lopez-Perez, I.; Macias-Barragan, J.; Sifuentes-Franco, S. Multisystem Inflammatory Syndrome in Children (MIS-C) Following SARS-CoV-2 Infection: Role of Oxidative Stress. Front. Immunol. 2021, 12, 723654. [Google Scholar] [CrossRef]
- Knoop, C.; Ismaili, J.; Bulte, F.; Abramowicz, D.; Estenne, M.; Goldman, M. Impaired antigen-presenting cell function contributes to T-cell hyporesponsiveness in stable lung transplant recipients. Transplantation 2000, 69, 1332–1336. [Google Scholar] [CrossRef]
- Gilboa, E. DC-based cancer vaccines. J. Clin. Investig. 2007, 117, 1195–1203. [Google Scholar] [CrossRef]
- Grunebach, F.; Muller, M.R.; Nencioni, A.; Brossart, P. Delivery of tumor-derived RNA for the induction of cytotoxic T-lymphocytes. Gene Ther. 2003, 10, 367–374. [Google Scholar] [CrossRef] [PubMed] [Green Version]
- Raiotach-Regue, D.; Grau-Lopez, L.; Naranjo-Gomez, M.; Ramo-Tello, C.; Pujol-Borrell, R.; Martinez-Caceres, E.; Borras, F.E. Stable antigen-specific T-cell hyporesponsiveness induced by tolerogenic dendritic cells from multiple sclerosis patients. Eur. J. Immunol. 2012, 42, 771–782. [Google Scholar] [CrossRef] [PubMed]
- Sochorova, K.; Budinsky, V.; Rozkova, D.; Tobiasova, Z.; Dusilova-Sulkova, S.; Spisek, R.; Bartunkova, J. Paricalcitol (19-nor-1,25-dihydroxyvitamin D2) and calcitriol (1,25-dihydroxyvitamin D3) exert potent immunomodulatory effects on dendritic cells and inhibit induction of antigen-specific T cells. Clin. Immunol. 2009, 133, 69–77. [Google Scholar] [CrossRef] [PubMed]
- Derdelinckx, J.; Mansilla, M.J.; De Laere, M.; Lee, W.P.; Navarro-Barriuso, J.; Wens, I.; Nkansah, I.; Daans, J.; De Reu, H.; Jolanta Keliris, A.; et al. Clinical and immunological control of experimental autoimmune encephalomyelitis by tolerogenic dendritic cells loaded with MOG-encoding mRNA. J. Neuroinflamm. 2019, 16, 167. [Google Scholar] [CrossRef] [PubMed] [Green Version]
- Walsh, J.G.; Cullen, S.P.; Sheridan, C.; Luthi, A.U.; Gerner, C.; Martin, S.J. Executioner caspase-3 and caspase-7 are functionally distinct proteases. Proc. Natl. Acad. Sci. USA 2008, 105, 12815–12819. [Google Scholar] [CrossRef] [PubMed] [Green Version]
- Herault, O.; Colombat, P.; Domenech, J.; Degenne, M.; Bremond, J.L.; Sensebe, L.; Bernard, M.C.; Binet, C. A rapid single-laser flow cytometric method for discrimination of early apoptotic cells in a heterogenous cell population. Br. J. Haematol. 1999, 104, 530–537. [Google Scholar] [CrossRef]
- Bacher, P.; Scheffold, A. Flow-cytometric analysis of rare antigen-specific T cells. Cytom. A 2013, 83, 692–701. [Google Scholar] [CrossRef]
- Marin, E.; Bouchet-Delbos, L.; Renoult, O.; Louvet, C.; Nerriere-Daguin, V.; Managh, A.J.; Even, A.; Giraud, M.; Vu Manh, T.P.; Aguesse, A.; et al. Human Tolerogenic Dendritic Cells Regulate Immune Responses through Lactate Synthesis. Cell Metab. 2019, 30, 1075–1090.e8. [Google Scholar] [CrossRef]
- Ochando, J.; Ordikhani, F.; Jordan, S.; Boros, P.; Thomson, A.W. Tolerogenic dendritic cells in organ transplantation. Transpl. Int. 2020, 33, 113–127. [Google Scholar] [CrossRef]
- Nuyts, A.H.; Ponsaerts, P.; Van Tendeloo, V.F.; Lee, W.P.; Stein, B.; Nagels, G.; D’Hooghe M, B.; Willekens, B.; Cras, P.; Wouters, K.; et al. Except for C-C chemokine receptor 7 expression, monocyte-derived dendritic cells from patients with multiple sclerosis are functionally comparable to those of healthy controls. Cytotherapy 2014, 16, 1024–1030. [Google Scholar] [CrossRef]


Publisher’s Note: MDPI stays neutral with regard to jurisdictional claims in published maps and institutional affiliations. |
© 2022 by the authors. Licensee MDPI, Basel, Switzerland. This article is an open access article distributed under the terms and conditions of the Creative Commons Attribution (CC BY) license (https://creativecommons.org/licenses/by/4.0/).
Share and Cite
Van Delen, M.; Janssens, I.; Dams, A.; Roosens, L.; Ogunjimi, B.; Berneman, Z.N.; Derdelinckx, J.; Cools, N. Tolerogenic Dendritic Cells Induce Apoptosis-Independent T Cell Hyporesponsiveness of SARS-CoV-2-Specific T Cells in an Antigen-Specific Manner. Int. J. Mol. Sci. 2022, 23, 15201. https://doi.org/10.3390/ijms232315201
Van Delen M, Janssens I, Dams A, Roosens L, Ogunjimi B, Berneman ZN, Derdelinckx J, Cools N. Tolerogenic Dendritic Cells Induce Apoptosis-Independent T Cell Hyporesponsiveness of SARS-CoV-2-Specific T Cells in an Antigen-Specific Manner. International Journal of Molecular Sciences. 2022; 23(23):15201. https://doi.org/10.3390/ijms232315201
Chicago/Turabian StyleVan Delen, Mats, Ibo Janssens, Amber Dams, Laurence Roosens, Benson Ogunjimi, Zwi N. Berneman, Judith Derdelinckx, and Nathalie Cools. 2022. "Tolerogenic Dendritic Cells Induce Apoptosis-Independent T Cell Hyporesponsiveness of SARS-CoV-2-Specific T Cells in an Antigen-Specific Manner" International Journal of Molecular Sciences 23, no. 23: 15201. https://doi.org/10.3390/ijms232315201
APA StyleVan Delen, M., Janssens, I., Dams, A., Roosens, L., Ogunjimi, B., Berneman, Z. N., Derdelinckx, J., & Cools, N. (2022). Tolerogenic Dendritic Cells Induce Apoptosis-Independent T Cell Hyporesponsiveness of SARS-CoV-2-Specific T Cells in an Antigen-Specific Manner. International Journal of Molecular Sciences, 23(23), 15201. https://doi.org/10.3390/ijms232315201