Article

Transcriptome Analysis Reveals Potential Mechanism in Storage Protein Trafficking within Developing Grains of Common Wheat

1
State Key Laboratory of Crop Stress Biology in Arid Areas, College of Agronomy, Northwest A & F University, Xianyang 712100, China
2
State Key Laboratory of Wheat and Maize Crop Science, College of Agronomy, Center for Crop Genome Engineering, Longzi Lake Campus, Henan Agricultural University, Zhengzhou 450046, China
3
College of Life Sciences, Northwest A & F University, Xianyang 712100, China
4
CIMMYT-China Joint Center of Wheat and Maize Improvement, National Key Laboratory of Wheat and Maize Crop Science, Agronomy College, Henan Agricultural University, Zhengzhou 450046, China
5
Jiangsu Key Laboratory of Crop Genetics and Physiology, Jiangsu Key Laboratory of Crop Cultivation and Physiology, Jiangsu Co-Innovation Center for Modern Production Technology of Grain Crops, Research Institute of Rice Industrial Engineering Technology, Yangzhou University, Yangzhou 225009, China
*
Authors to whom correspondence should be addressed.
Int. J. Mol. Sci. 2022, 23(23), 14851; https://doi.org/10.3390/ijms232314851
Submission received: 13 September 2022 / Revised: 7 October 2022 / Accepted: 18 October 2022 / Published: 27 November 2022
(This article belongs to the Section Molecular Plant Sciences)

Abstract

:
Gluten proteins are the major storage protein fraction in the mature wheat grain. They are restricted to the starchy endosperm, which defines the viscoelastic properties of wheat dough. The synthesis of these storage proteins is controlled by the endoplasmic reticulum (ER) and is directed into the vacuole via the Golgi apparatus. In the present study, transcriptome analysis was used to explore the potential mechanism within critical stages of grain development of wheat cultivar “Shaannong 33” and its sister line used as the control (CK). Samples were collected at 10 DPA (days after anthesis), 14 DPA, 20 DPA, and 30 DPA for transcriptomic analysis. The comparative transcriptome analysis identified that a total of 18,875 genes were differentially expressed genes (DEGs) between grains of four groups “T10 vs. CK10, T14 vs. CK14, T20 vs. CK20, and T30 vs. CK30”, including 2824 up-regulated and 5423 down-regulated genes in T30 vs. CK30. Further, the Kyoto Encyclopedia of Genes and Genomes (KEGG) pathway enrichment highlighted the maximum number of genes regulating protein processing in the endoplasmic reticulum (ER) during grain enlargement stages (10–20 DPA). In addition, KEGG database analysis reported 1362 and 788 DEGs involved in translation, ribosomal structure, biogenesis, flavonoid biosynthesis pathway and intracellular trafficking, secretion, and vesicular transport through protein processing within ER pathway (ko04141). Notably, consistent with the higher expression of intercellular storage protein trafficking genes at the initial 10 DPA, there was relatively low expression at later stages. Expression levels of nine randomly selected genes were verified by qRT-PCR, which were consistent with the transcriptome data. These data suggested that the initial stages of “cell division” played a significant role in protein quality control within the ER, thus maintaining the protein quality characteristics at grain maturity. Furthermore, our data suggested that the protein synthesis, folding, and trafficking pathways directed by a different number of genes during the grain enlargement stage contributed to the observed high-quality characteristics of gluten protein in Shaannong 33 (Triticum aestivum L.).

1. Introduction

Bread wheat (Triticum aestivum L.) is one of the main sources of protein (20%) and dietary calories for 2.5 billion of the world’s population [1,2,3,4,5]. The annual production of wheat is 722.4 million metric tons in an area of 220 million hectares worldwide, making it one of the dominant cereal crops [6,7,8]. The two species, Triticum aestivum and Triticum turgidum var durum, represent a significant contribution to global wheat production. However, the hexaploid T. aestivum or common bread wheat accounts for 95% in global wheat production for bread making [9,10]. Further, distinguished properties of wheat flour provide opportunities to process it into different end products, such as steamed bread, noodles, pasta, cookies, and dumplings [11,12,13,14,15,16]. Thus, the end product quality of wheat is determined by gluten proteins, comprised of polymeric glutenins and monomeric gliadins. The gliadins and glutenin have intermolecular disulfide bonds shaped into gluten complexes, which determine the dough viscoelasticity during flour processing [17,18], among which glutenins offer strength and elasticity [19,20], whereas gliadins offer viscosity to the dough [20,21,22]. Among all the constituents, grain storage protein (GSP) or “Gluten” plays a significant role in the high-quality end product. Therefore, selection of cultivated wheat by grain and yield traits has shaped the unique features of wheat cultivars. However, the potential mechanism that controls the underpinning mechanism of GSP within the developing grain is still mystery.
Wheat genotypes vary in native glutenin subunit composition, influencing dough quality and determining the suitability of the genotype for any specific end-products. There are four classes of wheat proteins, namely albumin, globulin, gliadin, and glutenins [21,22,23,24]. The extremely strong flour confers so much elasticity that the expansion of dough is reduced, thus resulting in poor-quality bread but good-quality noodles. Most importantly, the accumulation and expression of gluten protein taking place within developing grains accumulate to relatively high amounts in the endospermic tissues [25,26]. However, the expression of different transcription factors associated with synthesis and trafficking during grain enlargement is not known. Specifically, at different development stages, in developing endosperm, the seed GSP is transported from the rough endoplasmic reticulum (ER) to Golgi bodies using two distinct routes: one comprises the vesicle bud direct to the ER, while the other transports through Golgi [27,28,29,30,31]. Previous successful work has demonstrated that different clades of genes mediate this transport and represent a significant contribution to altering the processing quality of wheat [32,33]. Further, a combination of genotype and cultivation environment plays a pivotal role in defining the structure properties of GSPs [32,33,34,35,36]. Therefore, the ER works as an entry port of protein and the quality control function during transport to the Golgi complex [28,29,37,38,39,40]. Further, it controlled the function of protein quality by synthesis and folding. Therefore, it is still a matter of interest to understand the specific stage and underlying mechanism of the ER protein quality control mechanism in high-quality wheat cultivars.
Next-generation sequencing (NGS) is rapidly gaining ground. It has provided an important platform for genome-wide transcriptional profiling [41,42,43,44,45,46,47,48,49]. In wheat, due to the occurrence of multiple copies of gene sequences (homologous or paralogous genes), sequence assembly and annotation seem very daunting [43,44,46,47,50]. Transcriptomic profiling of the developing grain has provided a novel approach to increase the understanding of the biology of the developing grain in association with candidate genes [42,43,44,45,46,47,48,49,50,51]. Previous studies have reported three stages of gene expression within the developing wheat grain [52,53,54,55]. The first major transition stage is within 10 days post anthesis (DPA): “extensive cell division, expansion, and differentiation”, to make milky endosperm and embryo [48,56,57]. The second major transition stage remains until 20 DPA, accumulating “starch and seed storage proteins” within cells to make semi-solid endosperm with optimum transcriptional activities, occurring at 14 DPA [53,54,56,57]. The third transition starts at 30 DPA through the deposition of storage reserves [56,57,58]. The present study used Shaannong-33 acknowledged as the first extra-strong gluten wheat cultivar released in China, reported tensile resistance valued 1038 E.U, introduced in Henan Province, while the sister line of Shaannong-33 was reported with one third of its maximum tensile resistance, provided in detail in Table 1. The samples were collected at four important stages, 10 DPA, 14 DPA, 20 DPA, and 30 DPA, of the developing grain, to study crucial stages of the ER protein quality control mechanism and identify new candidate genes within developing grains.

2. Results

2.1. Sequence Assembly Based on cDNA Libraries

A total of 51,306,098, 57,143,490, 48,289,034, 48,697,252, of 10 DPA (T10), 14 DPA (T14), 20 DPA (T20), 30 DPA (T30) and 51,814,526, 51,232,492, 48,113,392, and 50,053,338 respectively reported clean reads libraries of CK10, CK14, CK20, and CK30. The raw reads consisted of 52,242,026, 58,357,186, 49,861,908, 49,553,172, 52,674,730, 52,215,230, 48,982,074, and 51,353,948 of T10, T14, T20, T30, and CK10, CK14, CK20, CK30, respectively. The raw bases showed 788,8545,926, 8,811,935,086, 7,529,148,108, and 7,482,528,972 at T10, T14, T20, and T30, respectively. GC content, Q20, and Q30 were 54.64%, 98.03%, and 94.4% for T10; 53.14%, 97.75%, and 93.89% for T14; 52.91%, 97.17%, and 92.6% for T20; 54.35%, 97.96%, and 94.25% for T30, respectively. Similarly, CK10 showed 55.02, 98.11, and 94.59 GC, Q20, and Q30 respectively; further detail is given in Table 2. Q20 and Q30 express the chance of error, with >97% confidence and <3% chance of error, respectively. Therefore, all the data represent the suitability to be used for downstream analysis. Further, the grain transcript reads for all collected samples are showed in Figure 1. The transcript numbers between 0–200, 201–400, 401–600, and 601–800 were 804, 12,014, 12,376, and 13,310, respectively, with complete detail in Figure 2 and Supplementary File S5, sheet 1. There were eight library constructions for all collected samples (T10, T14, T20, and T30 and CK10, CK14, CK20, and CK30) used for the current study, showing >85% CDS reads. The transcription length reported within the used sample is given in Figure 2 for comprehensive analysis of Shaannong 33 (Triticum aestivm L.) and CK. Further, we divided all collected stages into four groups (T10 vs. CK10, T14 vs. CK14, T20 vs. CK20, and T30 vs. CK30).
A total of 717, 1281, 1198, and 3206 were DEGs for all four groups (T10 vs. CK10, T14 vs. CK14, T20 vs. CK20, and T30 vs. CK30), respectively, given in Figure 3. The maximum similarity index of 14% was between “T10 vs. Ck10” and “T20 vs. CK20”. Similarly, the lowest similarity index was 5.3% for “T10 vs. Ck10” and “T14 vs. CK14” in Figure 3. Further, the heatmap of all collected samples (T10, T14, T20, T30, CK10, CK14, CK20, and CK30) correlated, based on the samples tested at different stages (Figure 4 detail shown in Supplementary File S5, sheet 2).

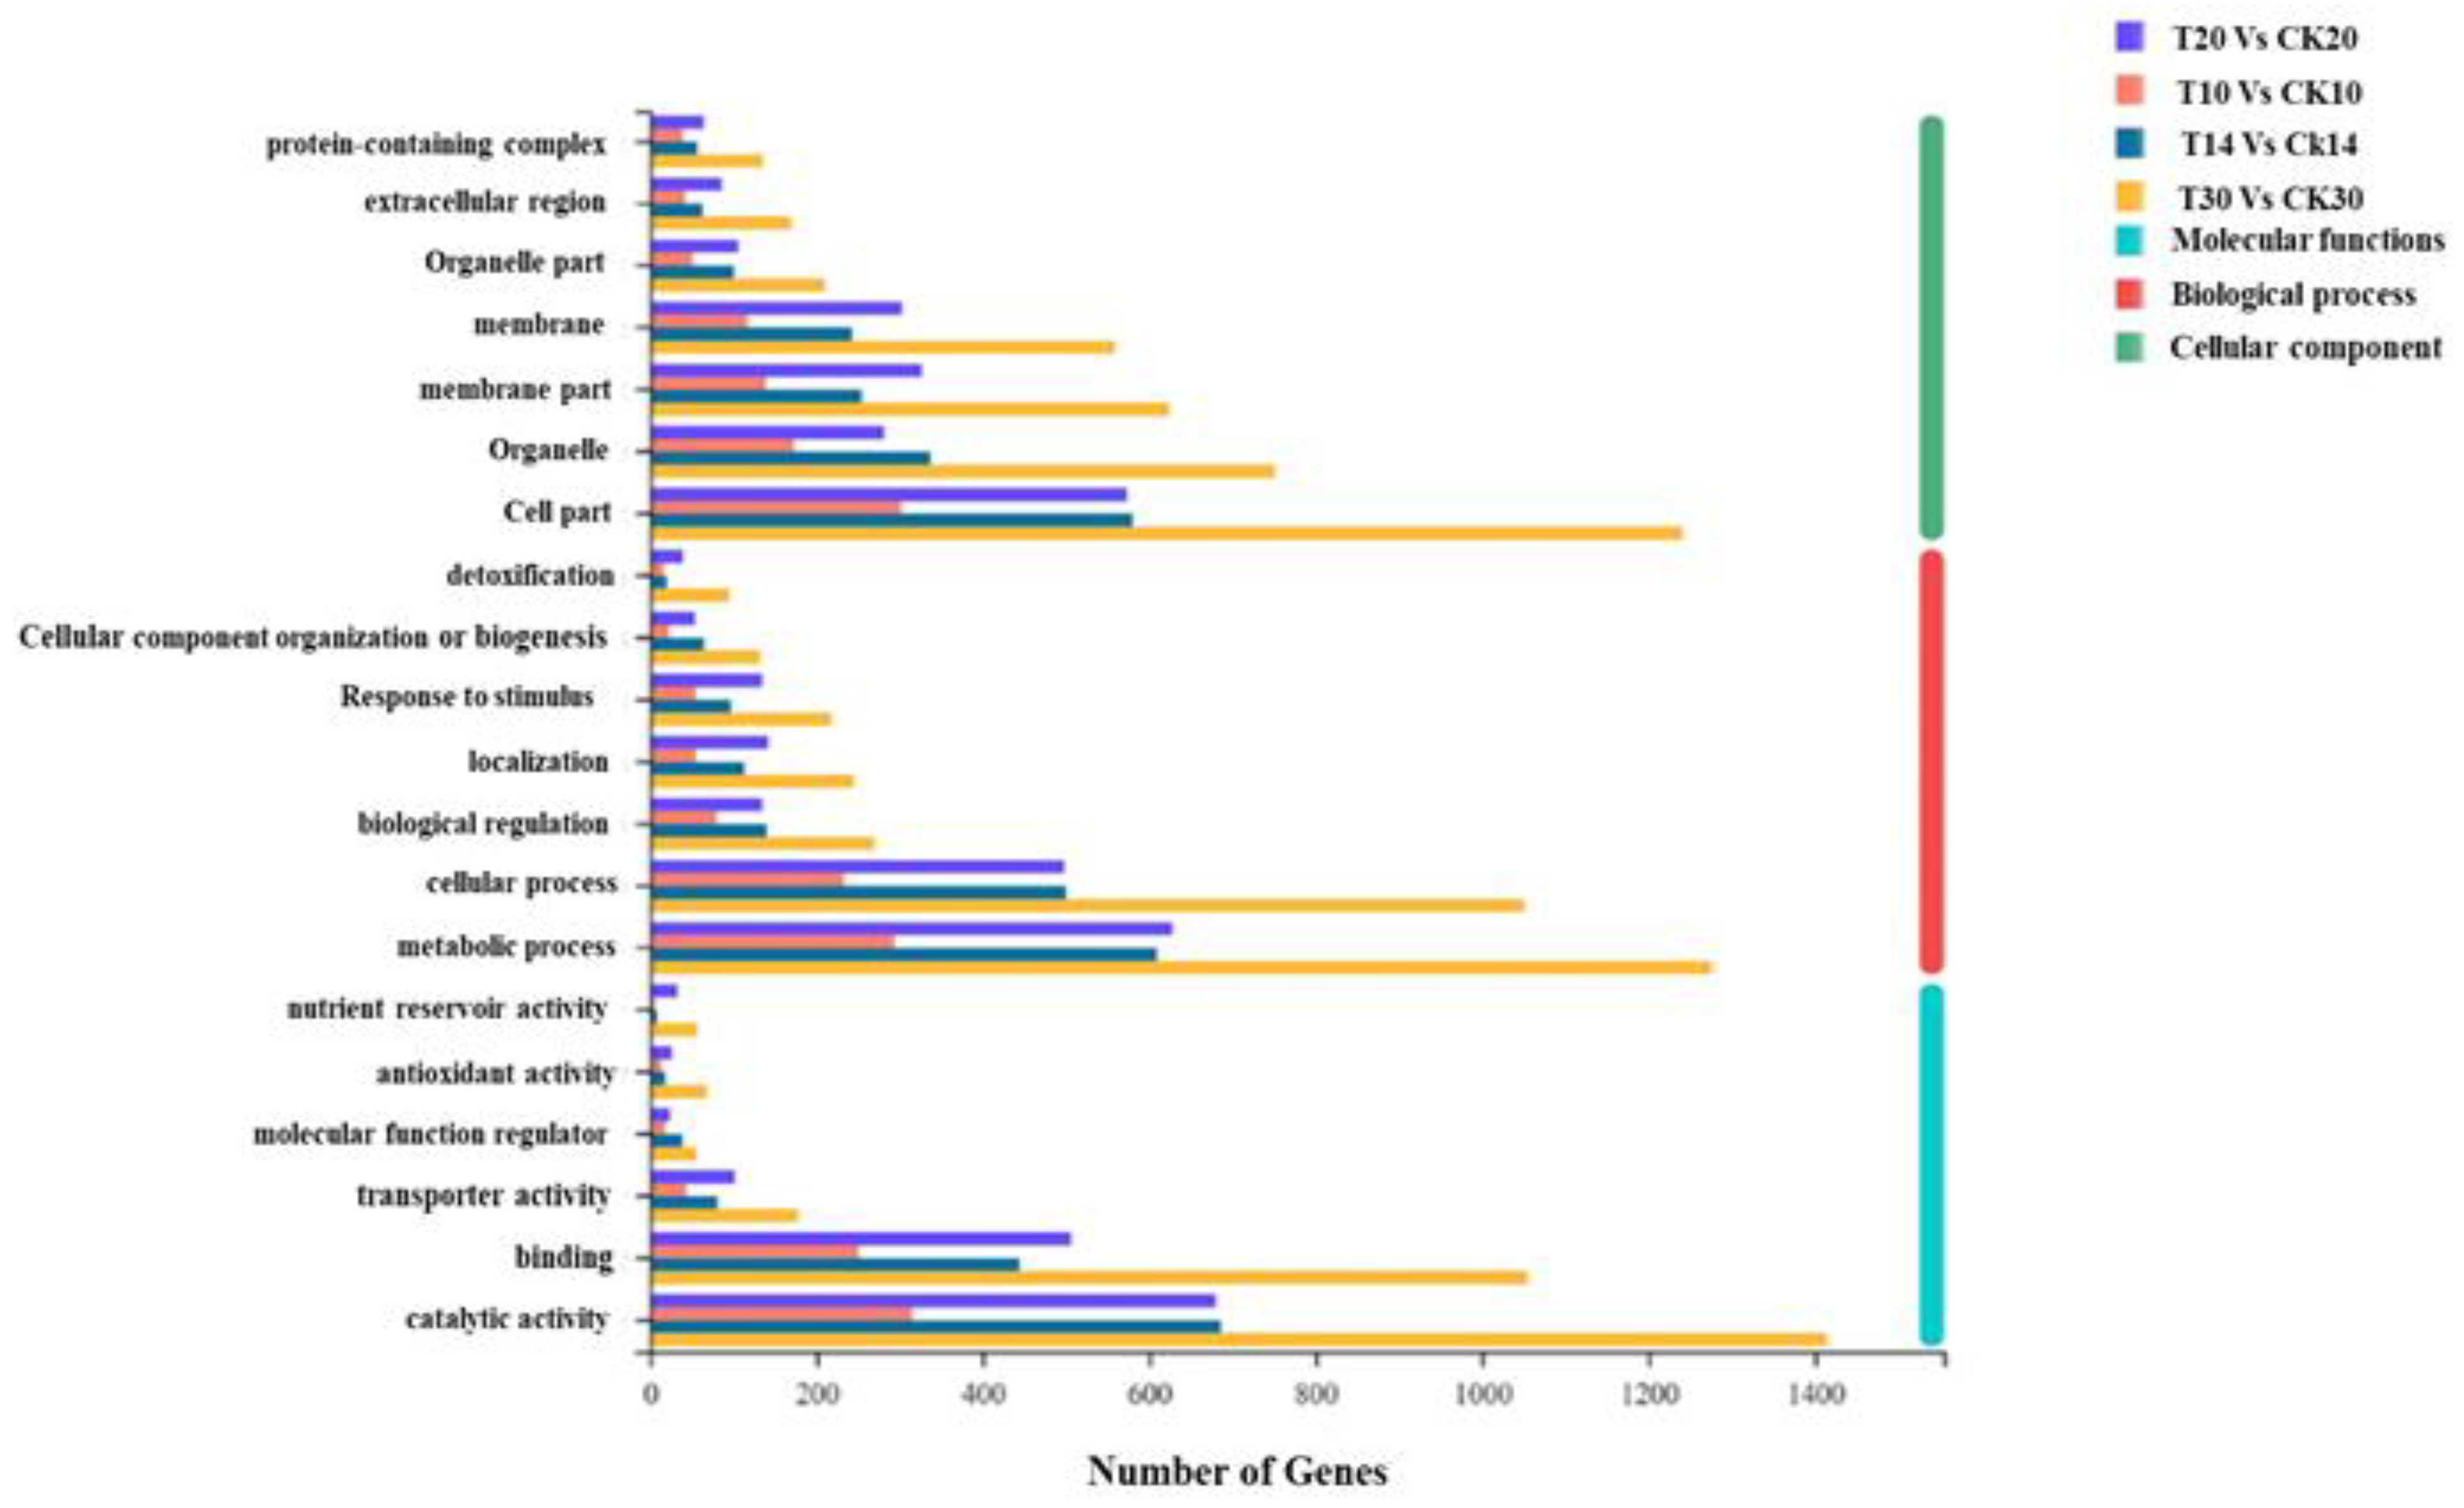
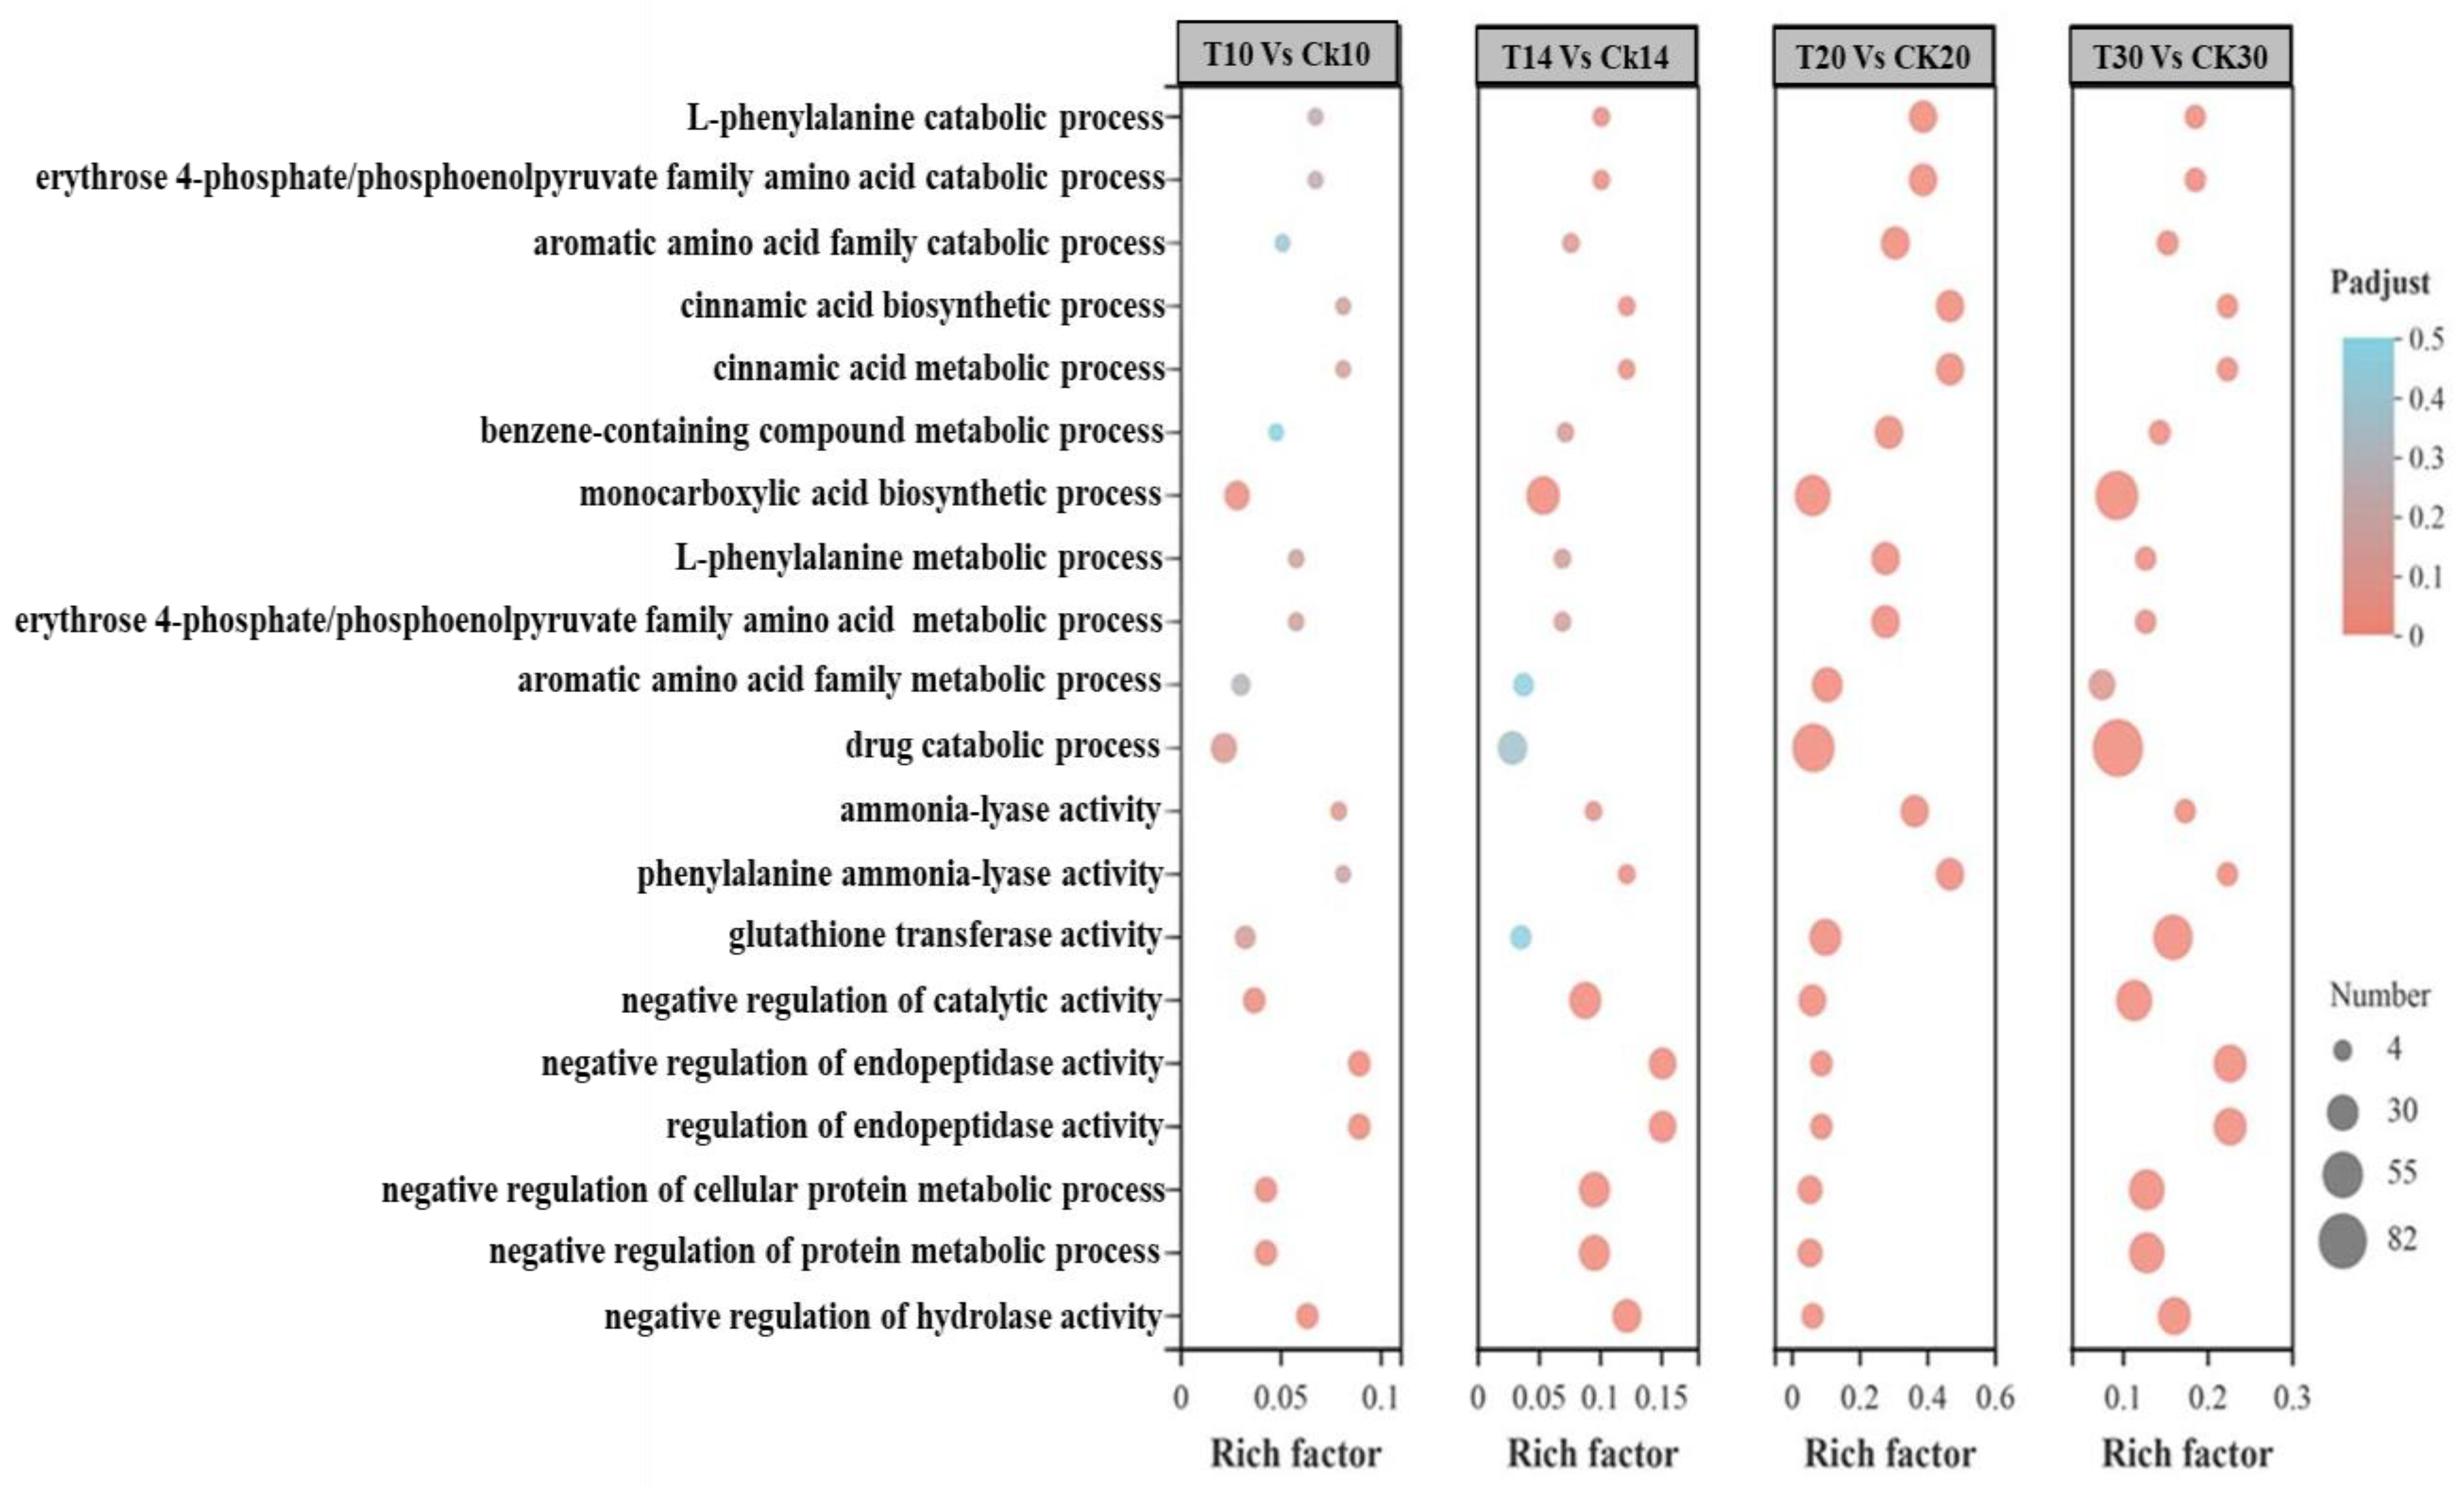
2.2. Functional Annotation between Different Grain Development Stages

First, KEGG enrichment analysis was conducted by using DEGs at all four stages and libraries of all collected samples (T10, T14, T20, and T30 and CK10, CK14, CK20, and CK30), as shown in Figure 5 and Supplementary File S1 sheet 2. The maximum functional annotation of 315 DEGs in pathway id (map04141) is linked with protein processing within the ER; that in the secondary category is described as folding, sorting, and degradation of GSPs; 237 DEGs were observed in starch and sucrose metabolism in pathway id (map00500); 213 in pathway id map04075 were associated with plant hormone signal transduction. Further, the KEGG enrichment analysis was conducted by using all four groups (T10 vs. CK10, T14 vs. CK14, T20 vs. CK20, and T30 vs. CK30), provided in Figure 6 in detail, Supplementary File S1 (sheets 1–4). The rich factor with Padjust (0–0.5) showed phenylpropanoid biosynthesis and carotenoid biosynthesis, of which the pathway id was “map00940”. There were 8, 3, 8, and 8 numbers of genes in association with pathway map00906 in all four groups of (T30 vs. CK30, T20 vs. CK20, T14 vs. CK14, and T10 vs. CK10). For further improvement of our knowledge about the total number of genes involved in grain development, function classification of clusters of orthologous groups (COGs) was conducted for all four groups. There was a distribution of 20 COG categories based on COG functional classification, shown in Figure 7. The cell part involved of 1200 genes in group “T30 vs. CK30”, in comparison with >200 DEGs involved in protein processing of “T30 vs. CK30” of cellular components. Furthermore, a functional description is given in Supplementary File S1, sheet 3. A total of 1362 DEGs were reported in translation, ribosomal structure, and biogenesis in “T14 vs. CK14”, in comparison with other groups. Consistent with functional analysis, we performed GO enrichment analysis of all four groups (T10 vs. CK10, T14 vs. CK14, T20 vs. CK20, and T30 vs. CK30), as shown in Figure 8 and Supplementary File S3, sheets 1–4. There were 20 categories of functional classification, comprised of negative regulation of the protein metabolic process, negative regulation of the cellular protein metabolism process, and so on, with further detail given in Figure 8 and Supplementary File S3.

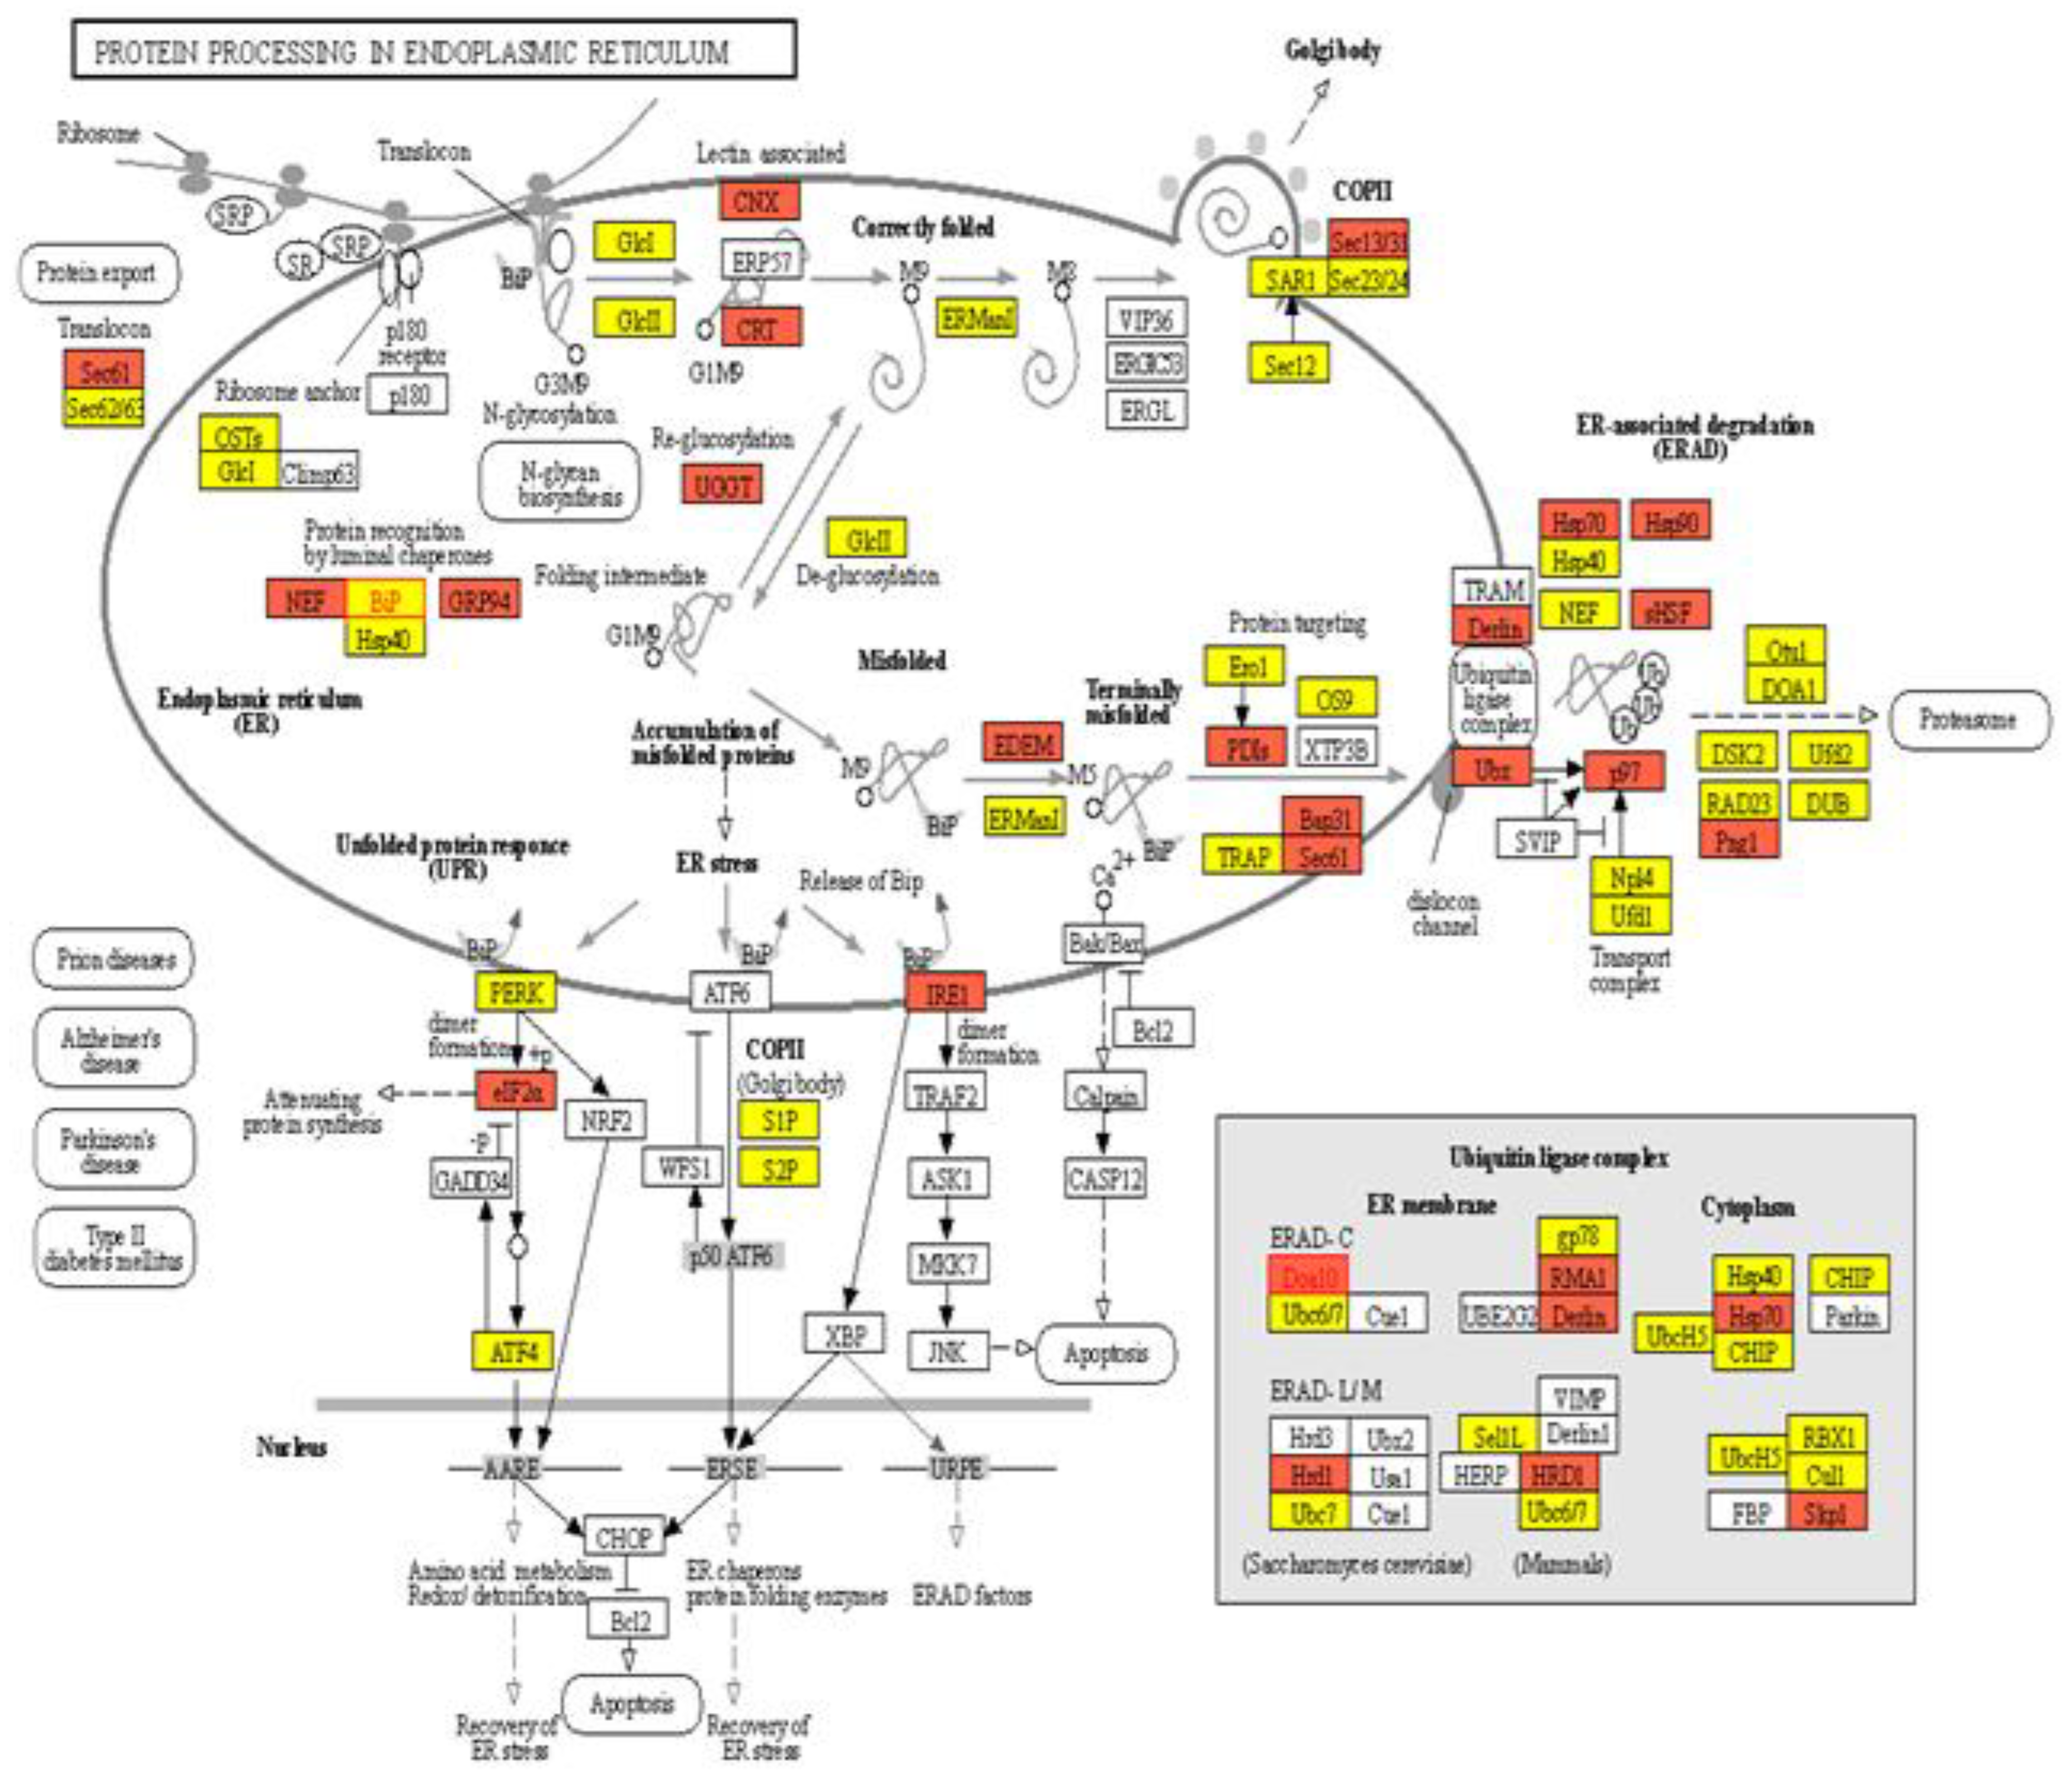
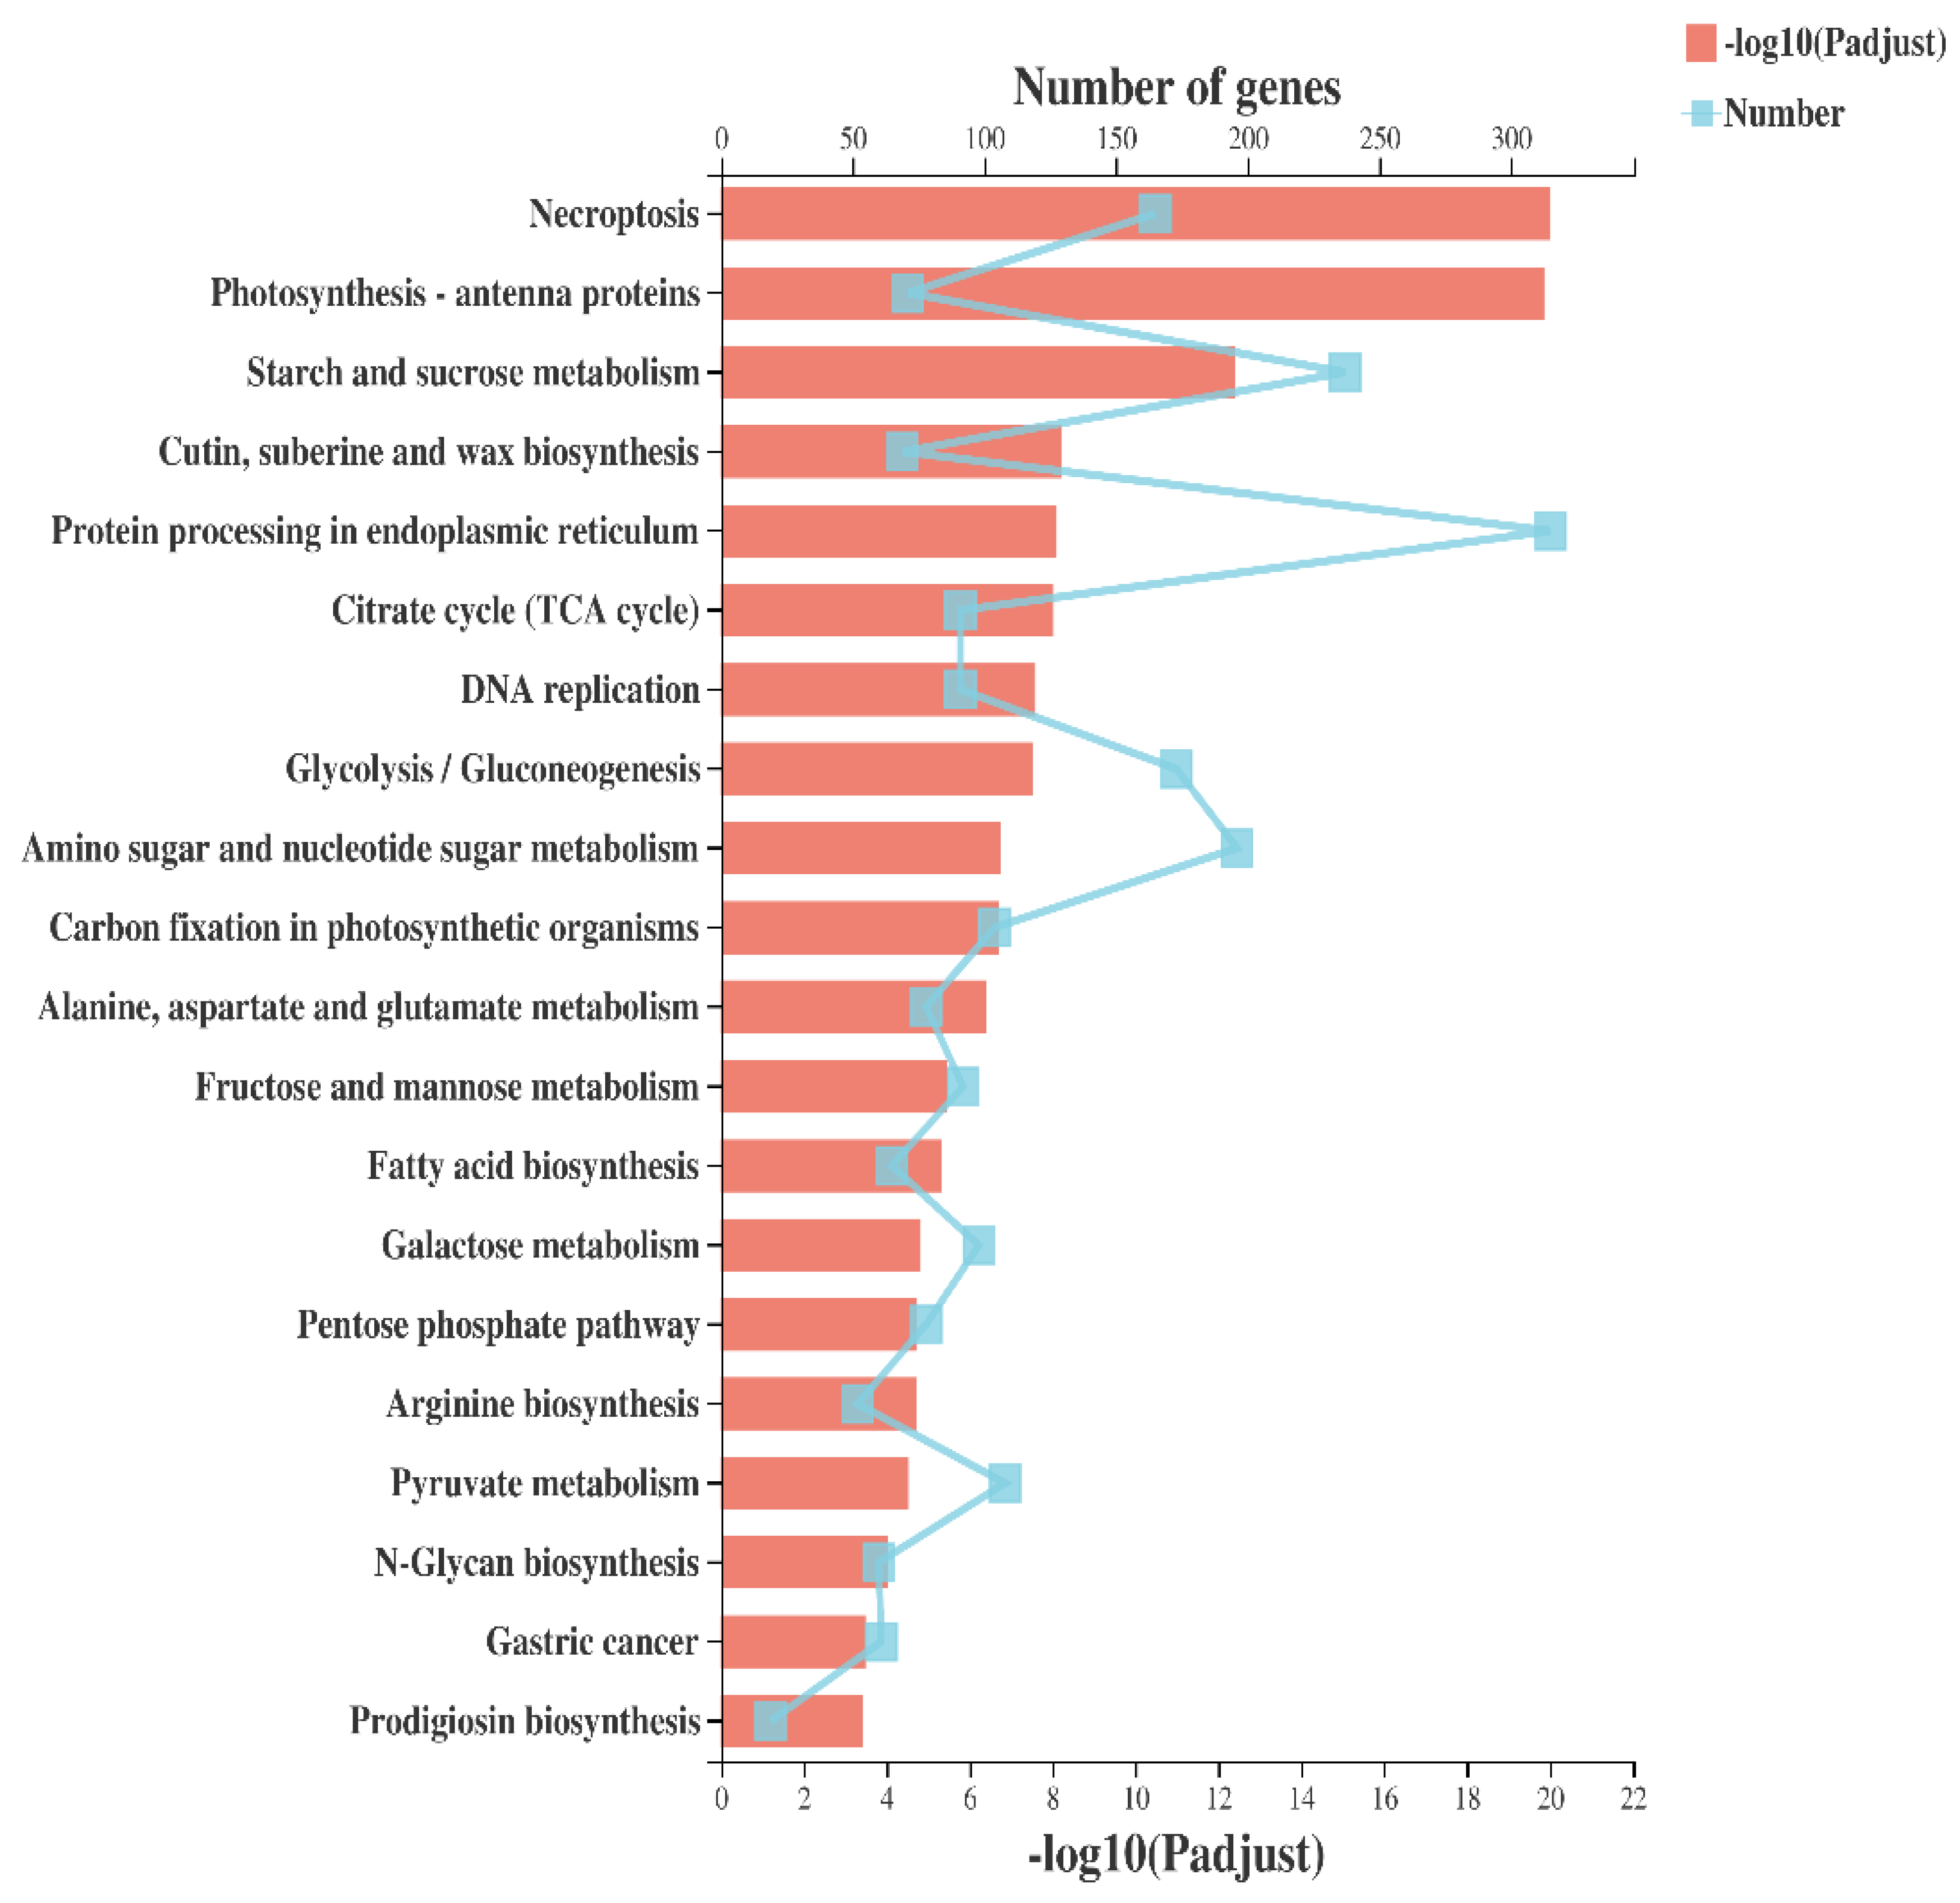
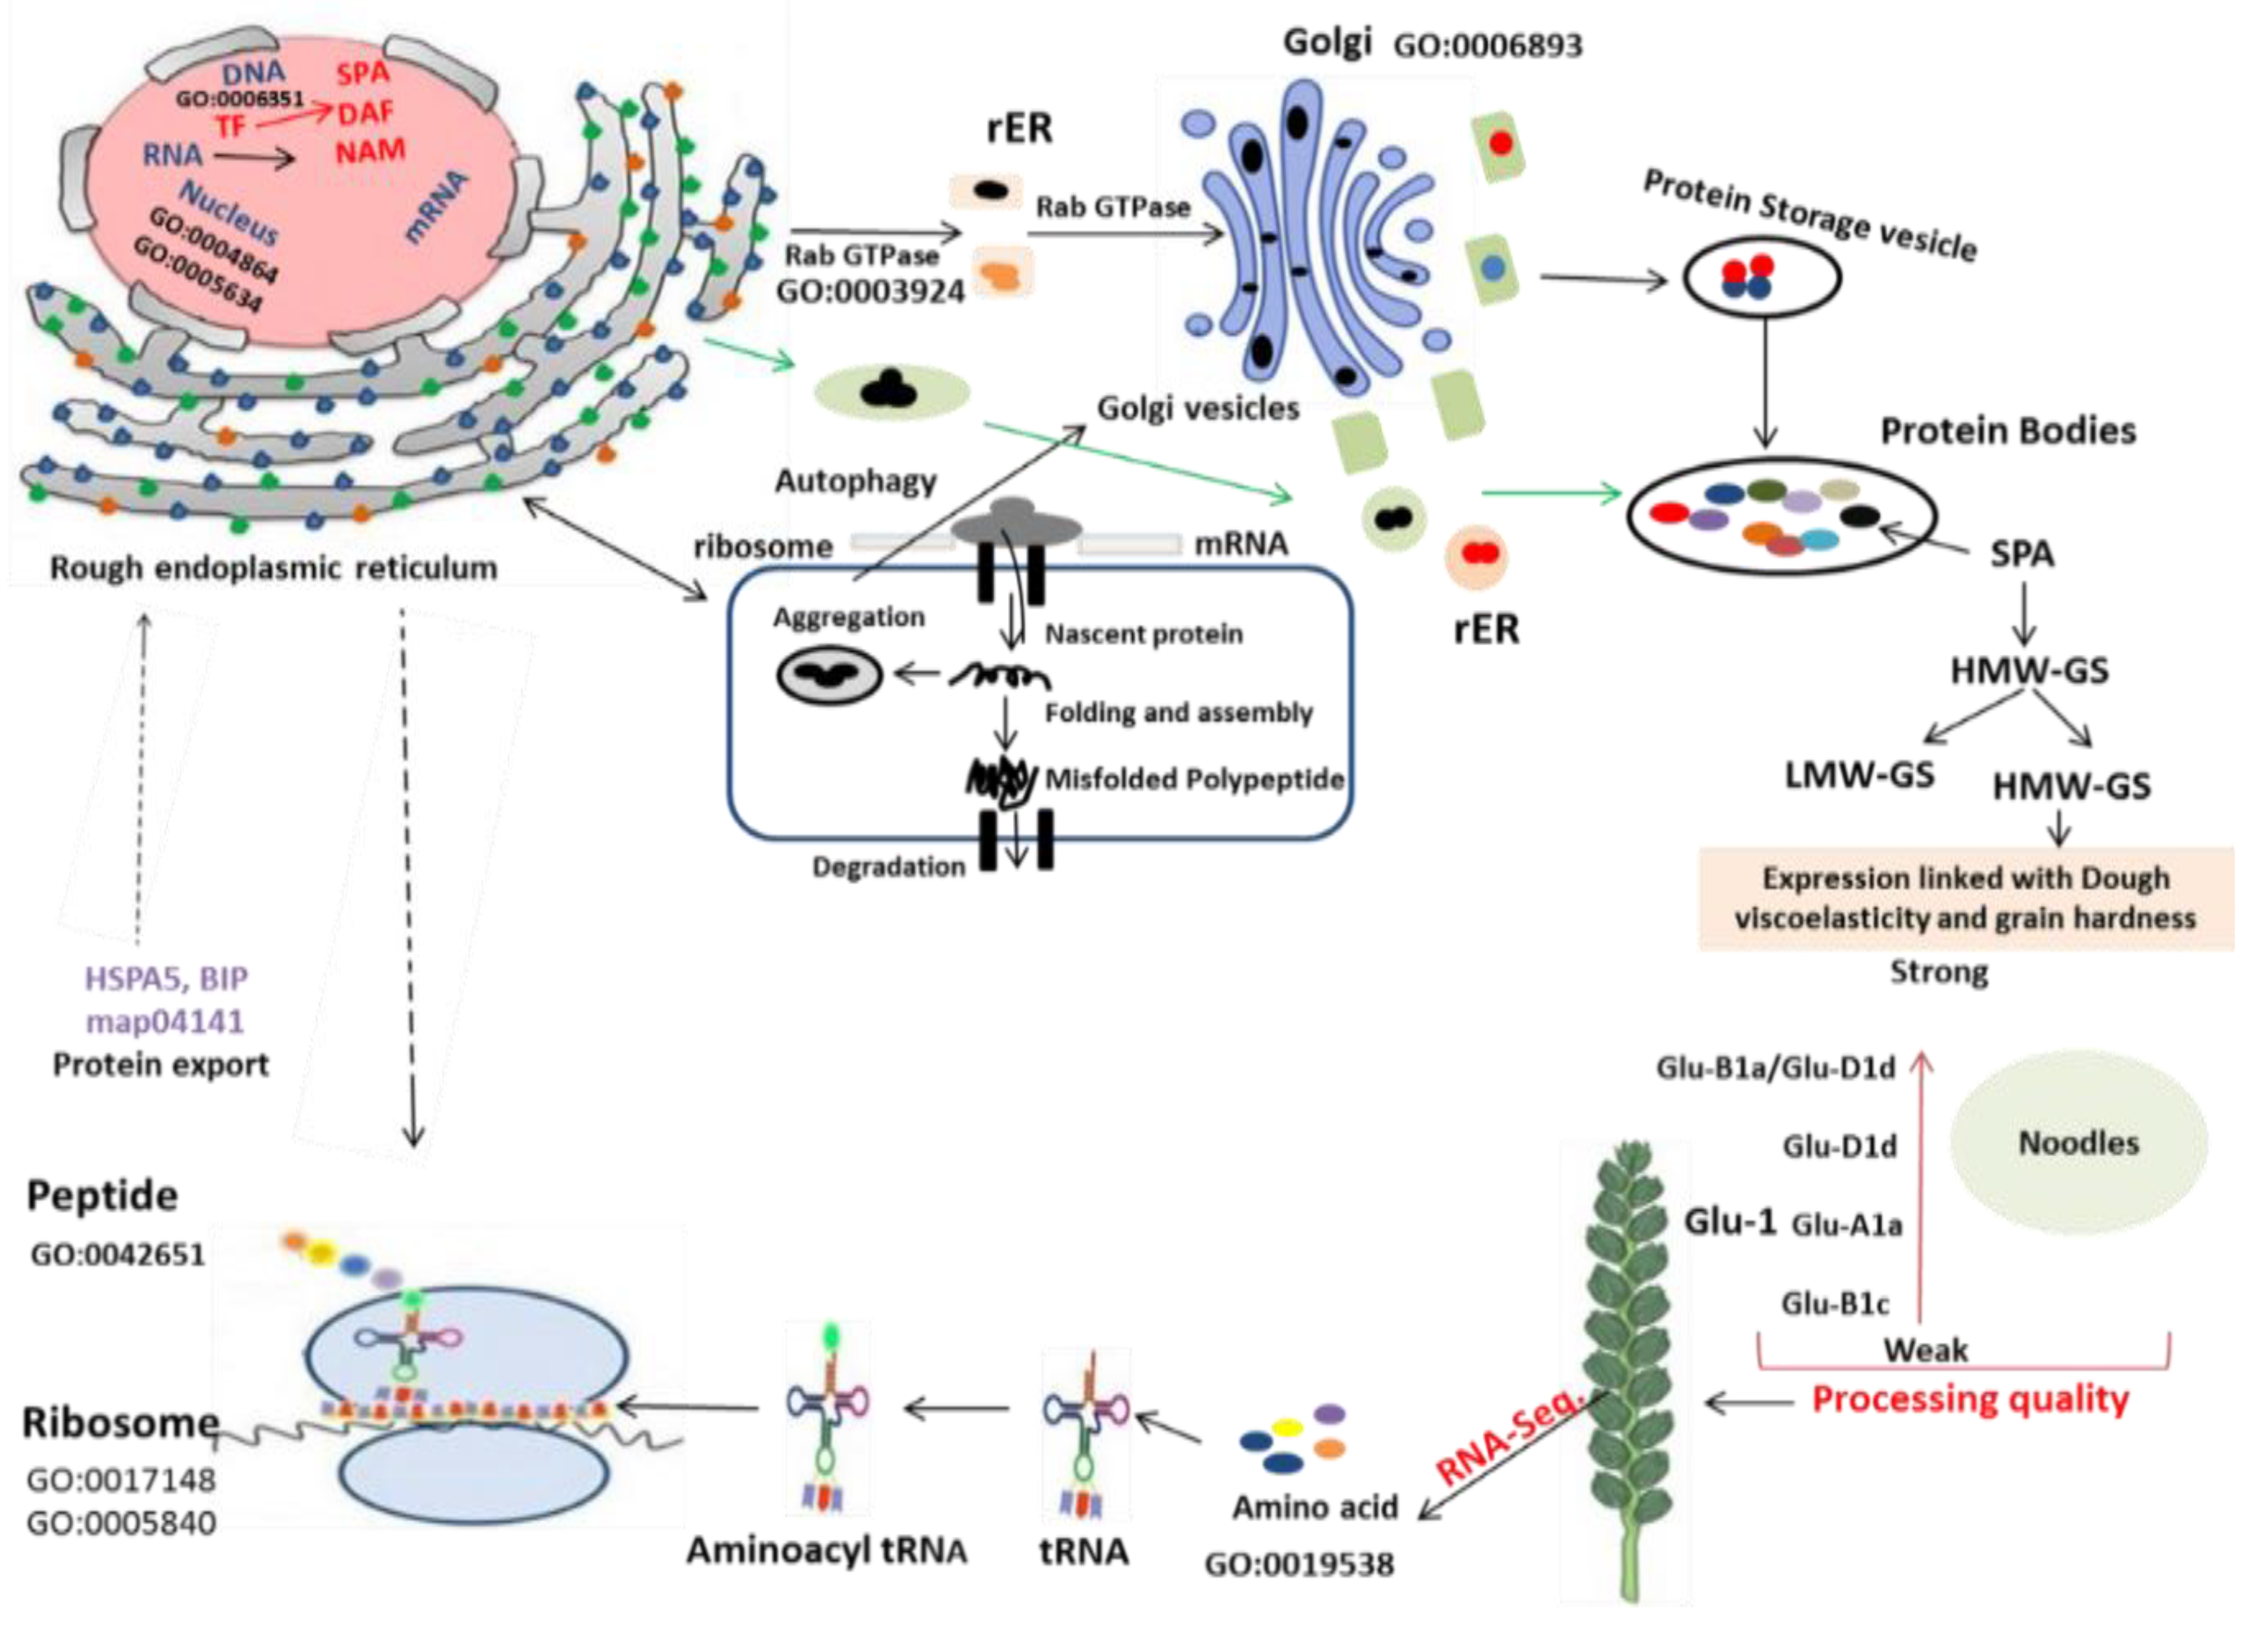
2.3. Pathway Analysis of Protein Processing in Endoplasmic Reticulum (ER)

The synthesis, folding, and deposition of the gluten proteins take place within the endomembrane system of a developing grain. They fold in the lumen or membrane of the ER from where they are sorted toward their site of action [26,58,59]. ER protein quality control in the biological processes has long been a subject of intensive study. In the present study, KEGG pathway analysis identified 7, 9, 19, and 17 DEGs for the cellular amino acid metabolic process, protein metabolic process, Golgi vesicle transport, and protein serine/threonine kinase activity, respectively, in association with protein processing in the ER pathway (ko04141) (Figure 9), and for the protein export pathway (map03060) (Figure S1). The protein quality is controlled within the ER. The protein synthesis, folding, and trafficking are marked by the composition of N-glycan. Here, we observed that the folding sensor UGGT acts as an unusual molecular chaperone and covalently modifies (G1M9) the folding intermediate to correctly folded M9 ERMan1. The putative genes take part in recognition of folding and misfolded proteins within the ER; in addition, genes are listed in Table 3.

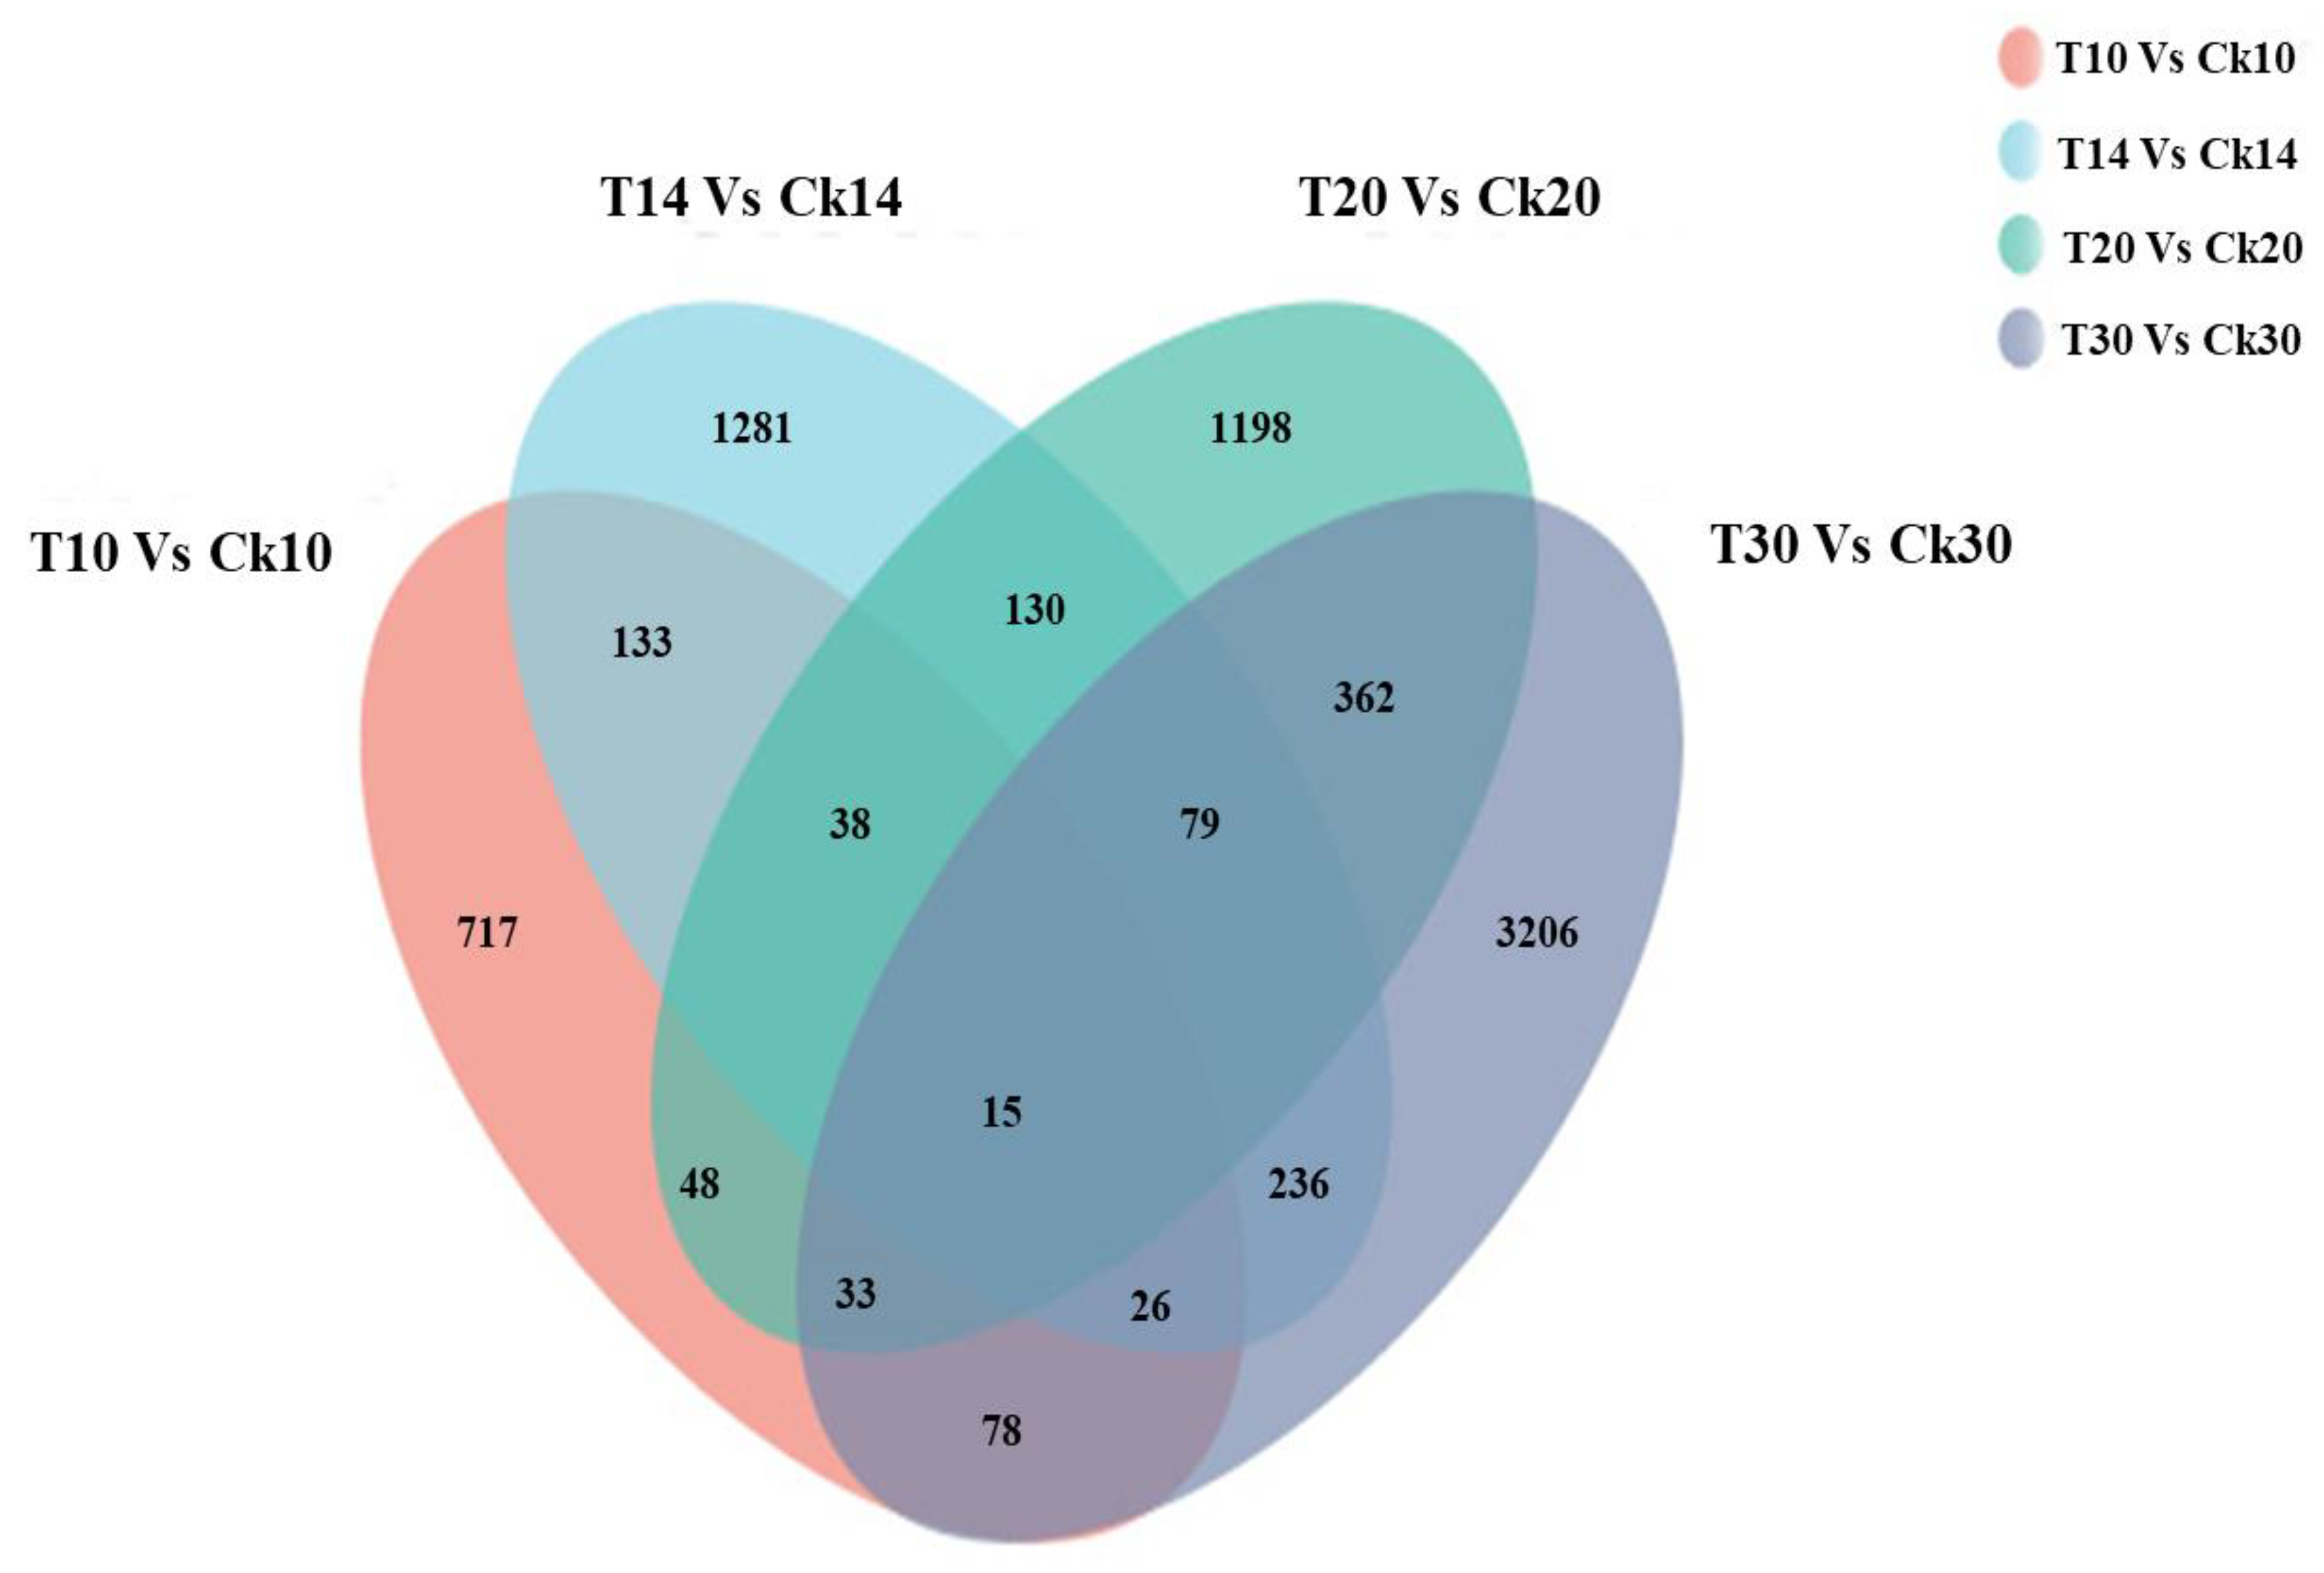
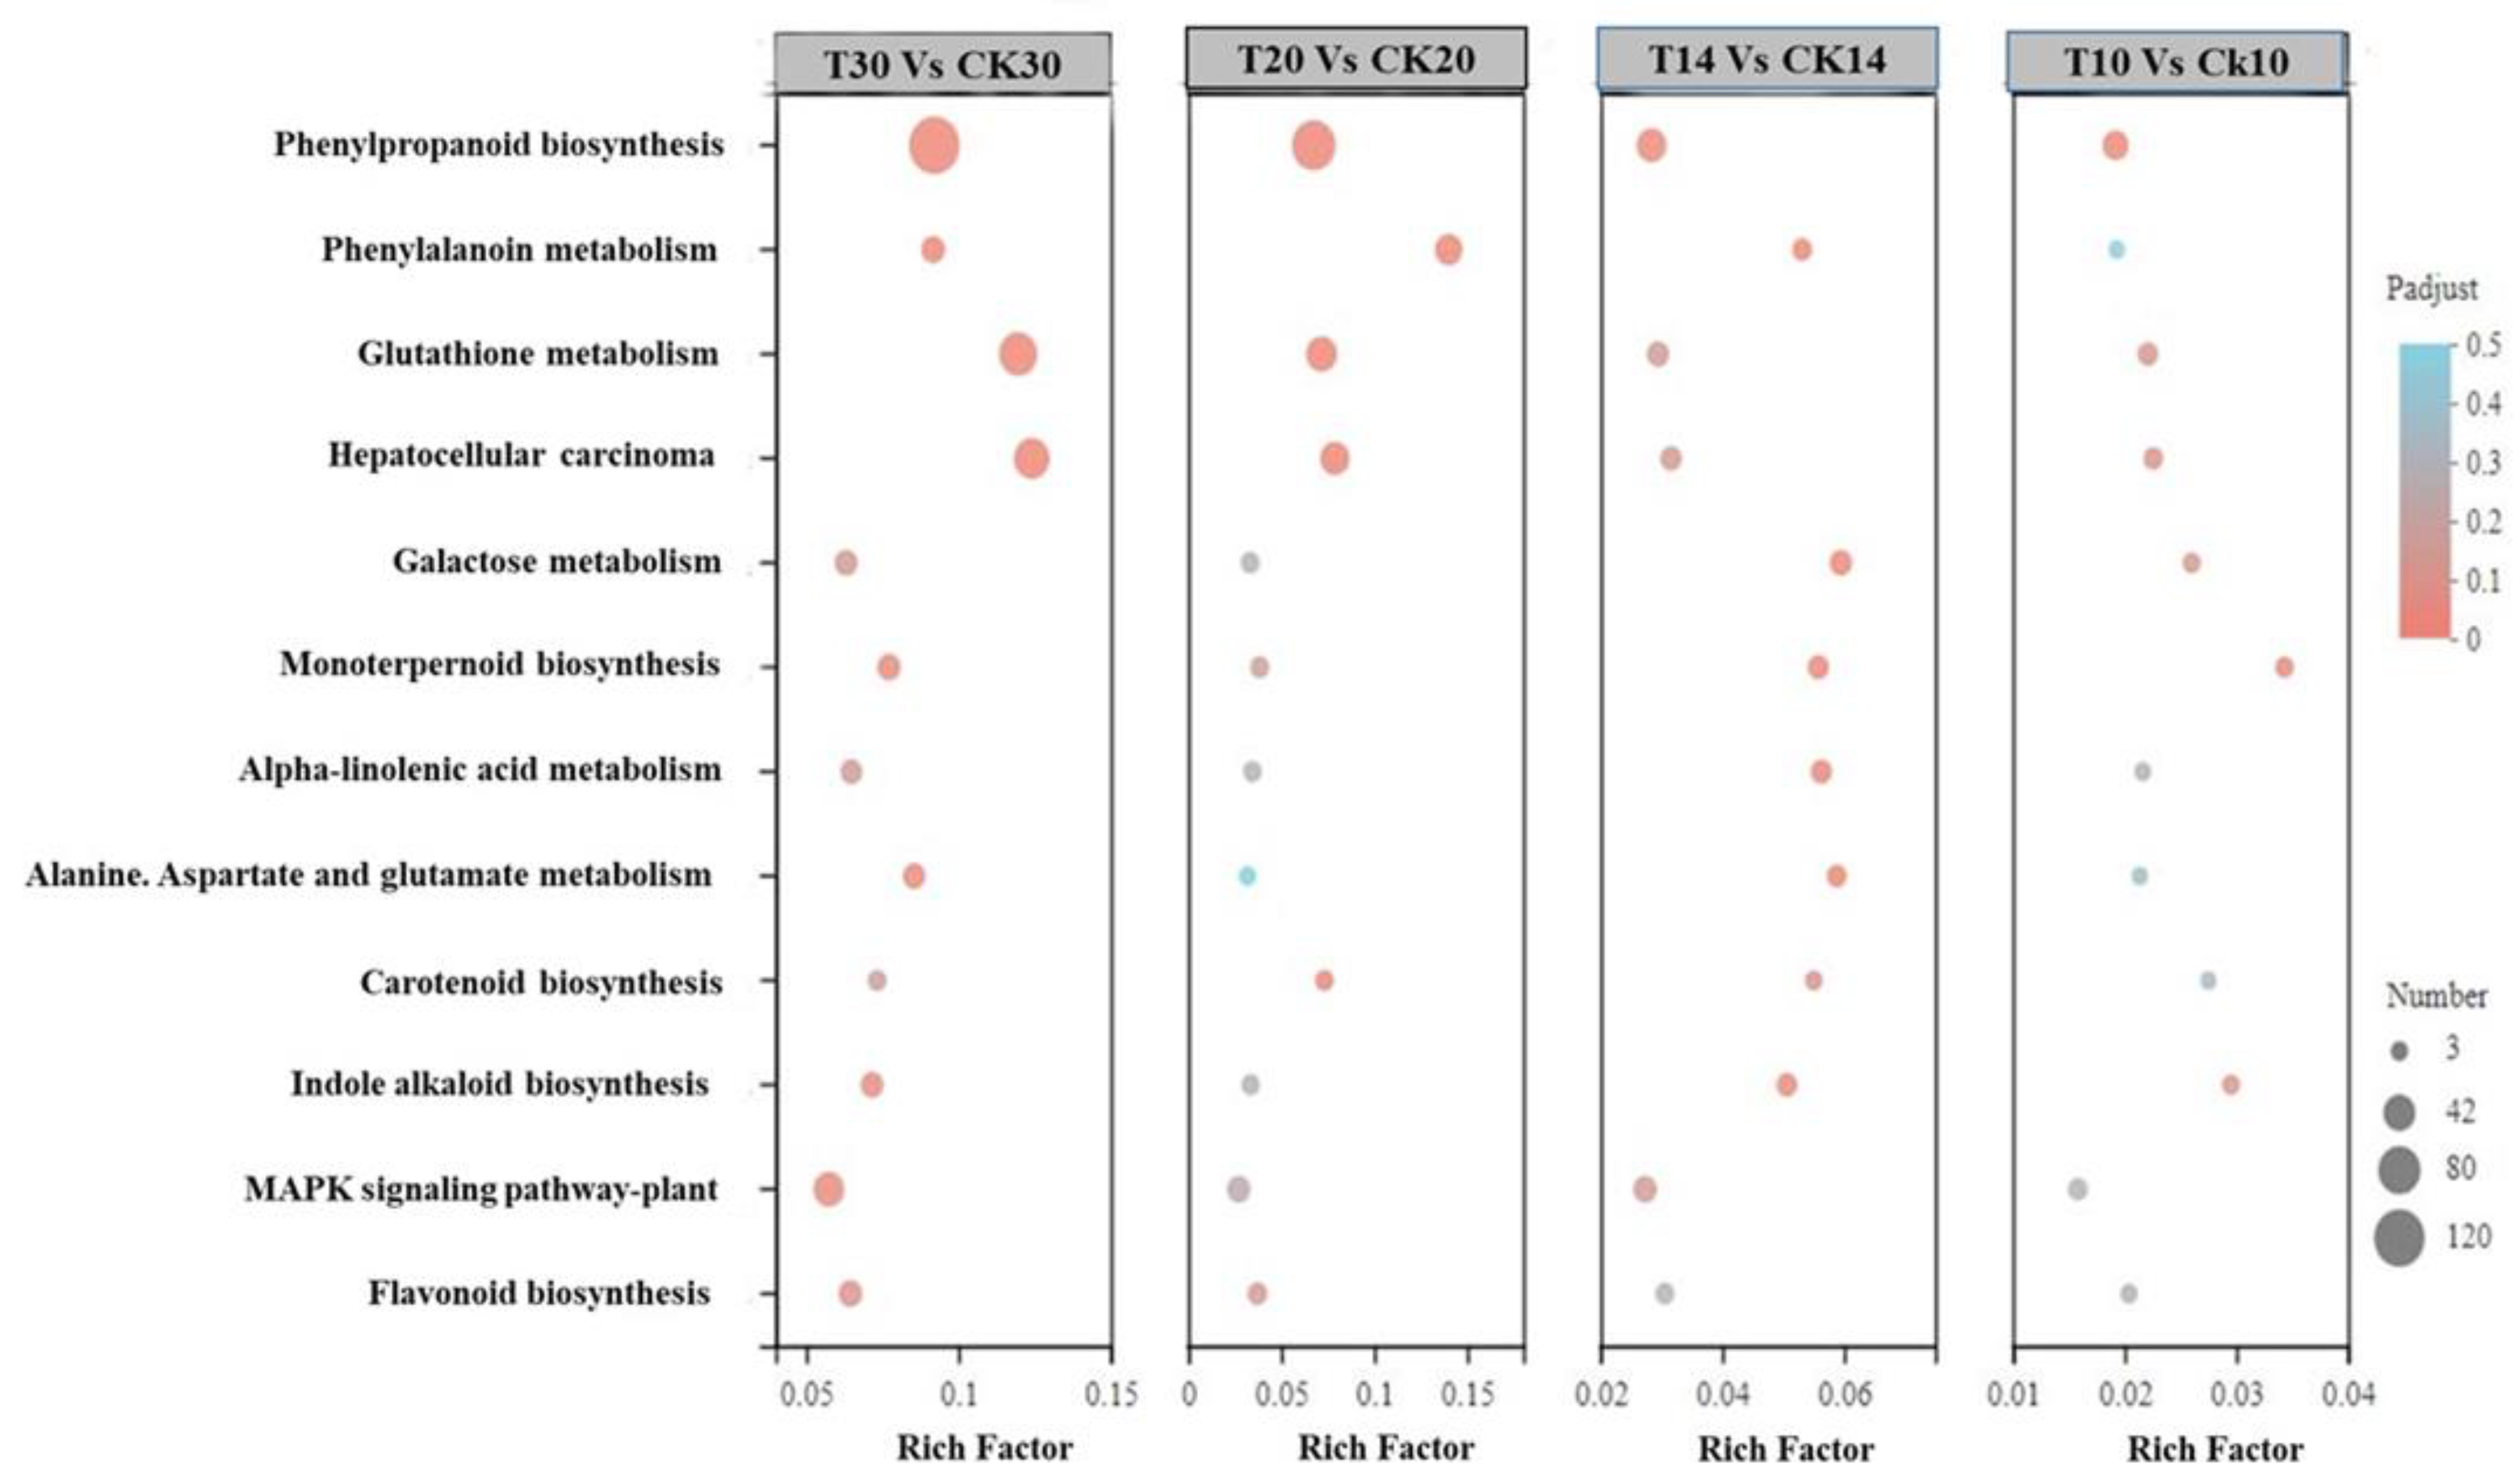
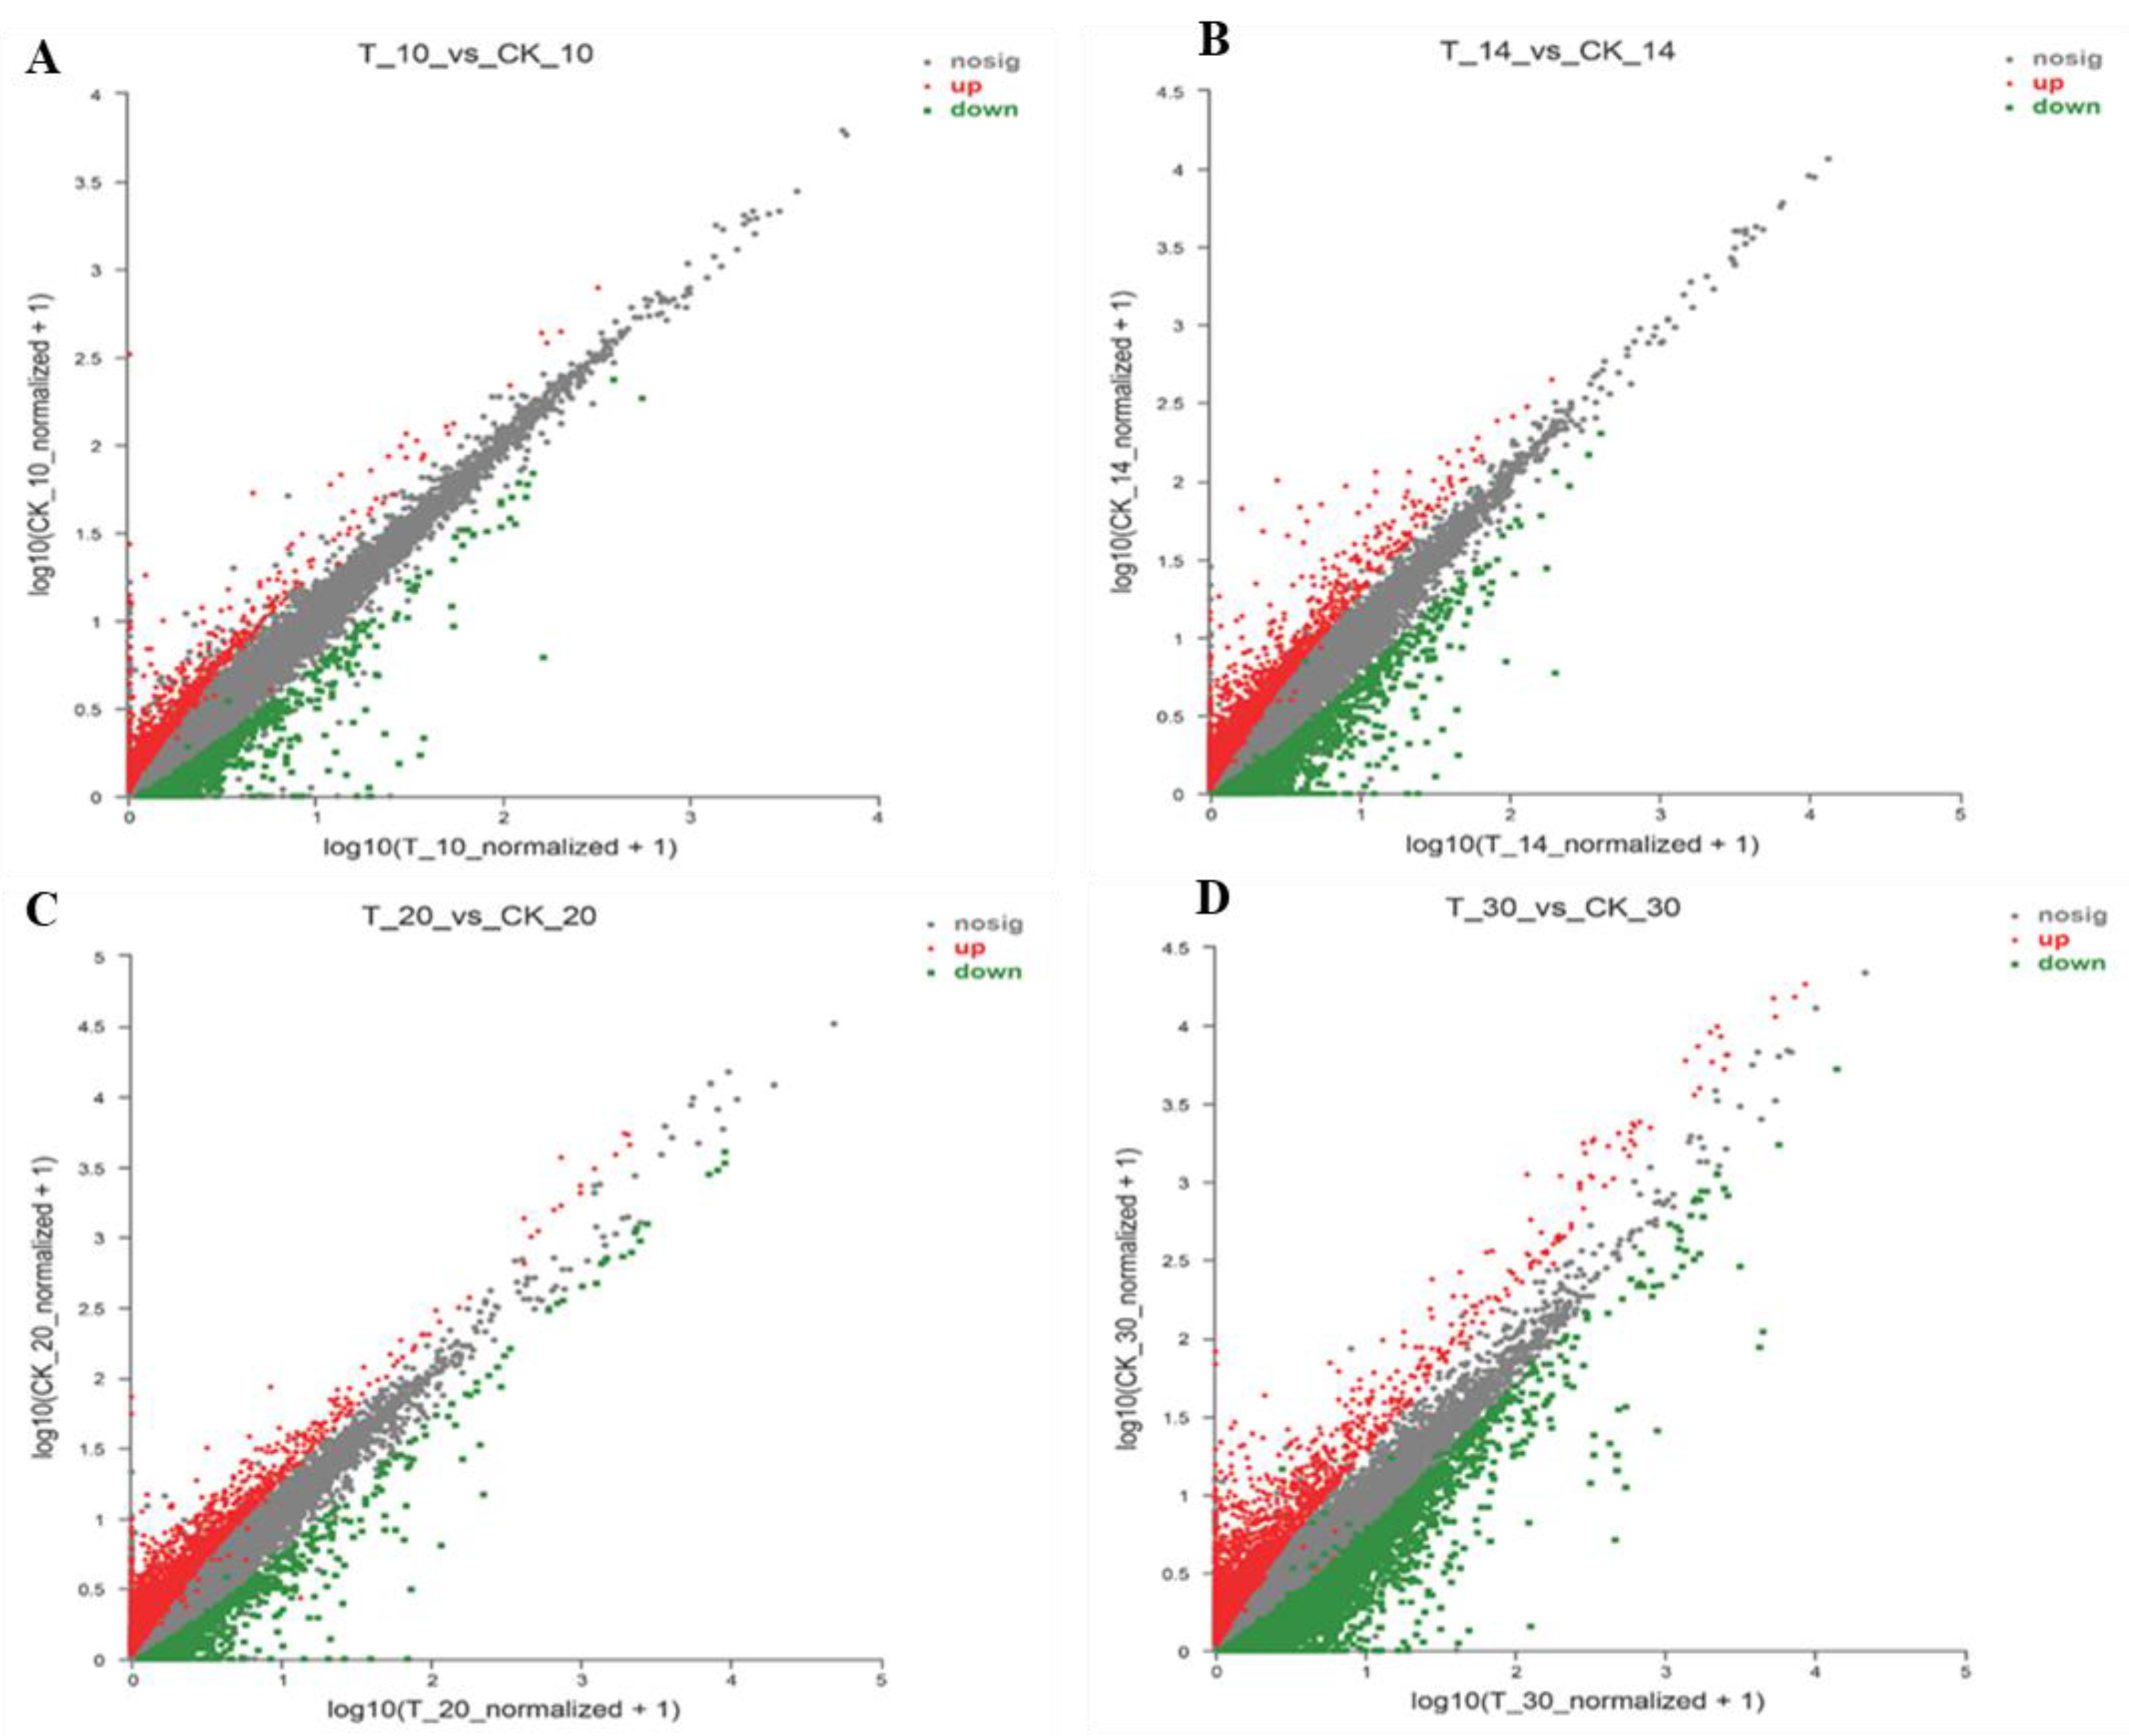
2.4. Analysis of Different Groups of Differently Expressed Genes

For comprehensive analysis, to understand the comparative difference between different groups in association with DEGs, which controlled the protein procession within the ER, all four constructed groups “T10 vs. CK10, T14 vs. CK14, T20 vs. CK20, and T30 vs. CK30” were analyzed. The similarity index of DEGs between all used groups is provided in Figure 10. There were 1838 genes reported in “T10 vs. CK10” in comparison with “T14 vs. CK14” were 4137. The minimum number of DEGs were seen in “T10 vs. CK10” in comparison with the three other groups. This suggested the primary involvement of the “cell division” phase of 10 DPA in protein quality control of the ER. Further, to identify the transcript level of DEGs in comparison with different developing stages of both used wheat samples, the transcript level of each gene in all four groups was compared and filtered with |log10 (TPM)|> = 1 and FDR < 0.001; for further detail, see Supplementary File S1, sheet 4.

2.5. Putative Genes Related to Protein Quality Control

To further investigate the role of ER-associated protein folding, sorting, and degradation, at different stages of grain development in wheat, the candidate genes related to cell wall organization or biogenesis, protein transporter activity, the structural constituent of ribosomes, protein folding, unfolded protein, intracellular protein transport, GTPase activity, ATPase activity, vesicle-mediated transport, N-glycan processing (ER), intracellular protein transport (COPI vesicle coat), intra-Golgi vesicle-mediated transport, mismatch repair, retrograde vesicle-mediated transport, Golgi to ER, Full - Glutenin, protein serine/threonine kinase activity, beta-amylase activity, low-molecular-weight glutenin (LMW) subunit, glycogen (starch) synthase activity, and cysteine-type endopeptidase activity were identified according to the GO annotation and local TBLAST search. Only the genes with more than a two-fold change in FPKM within the developing grain of all selected stages are enlisted, with details given in (Supplementary File S4, sheets 1–5).
A total of 219 and 175 genes were identified to be linked with protein folding, unfolding, a structural constituent of ribosomes (ER), and intracellular protein trafficking such as GTPase activity and ATPase activity, respectively, given in Supplementary File S4, sheet 1. The genes regarding the defense mechanism are mainly involved in response to the biotic stimulus and disease resistance protein RPP13 (Supplementary File S4, sheet 3), and intracellular-trafficking-, secretion-, and vesicular-transport-related DEGs (Supplementary File S1, Sheet 3 (Table S1) & S4, sheet 2). The 84 genes identified here encode for grain quality characteristics such as grain hardness (protein serine/threonine kinase activity), starch synthesis, and viscoelasticity (cysteine-type endopeptidase activity) (Supplementary File S4 and sheet 4). Further, all the expressed genes in all collected samples of Shaannong 33 and CK are shown in Figure 11, with detail given in Supplementary File S5. There were a total of 696 DEGs in all collected samples, from which TraesCS1A02G011300, TraesCS1B02G017000, and TraesCS1B02G276200 showed a two-fold transcript level in T30 samples. TraesCS4A02G316000 and TraesCS5D02G551600 reported an optimum two-fold transcript level in T10. In comparison, TraesCS4A02G316000 reported an optimum transcript level, with further detail shown in Figure 11, Supplementary File S5. The expression profile of all genes involved in protein trafficking and protein folding and unfolding were well consistent with FPKM values from different developing stages (Figure 11). The expression profiles of all genes involved in protein trafficking and protein folding and unfolding were well consistent with FPKM values from different development stages (Figure 11). TraesCS1A02G133100 was associated with GO: 0006457 (20 DPA) and T30 (30 DPA). This suggested intracellular protein quality control within the ER. GTPase activity has been approved as an important regulator in gluten quality characteristics, through controlling ER-to-Golgi vesicle trafficking [59,60,61,62,63]. TraesCS1A02G137213 linked with GO: 0043547 (positive regulation of GTPase activity) showed a higher expression at 10 DPA (cell division phase), which decreased at 30 DPA. Similarly, TraesCS1A02G131500 showed a higher GO: 0007264 (mall-GTPase-mediated signal transduction) expression at 10 DPA, which then decreased with exposure to increasing DPA. TraesCS1A02G060700 suggested a linkage with translation, ribosomal structure, and biogenesis expression decrease until 30 DPA. TraesCS1A02G092900 gene showed that GO: 0003735 (structural constituent of ribosome) expression increases with increasing development, a putative regulator during protein processing within the ER quality controlling process. TraesCS1A02G126800 showed that the GO: 0080163 (regulation of protein serine/threonine phosphatase activity) expression level was medium when exposed to grain development stages. Defense-mechanisms-related putative genes such as TraesCS1A02G081300 showed optimum expression at 30 DPA. A total of nine randomly selected genes were validated through RT-qPCR analysis (Figure 12).

3. Discussion

In the developing endosperm of bread wheat (Tritium aestivum L.), seed storage proteins are produced on the rough Endoplasmic Reticulum (rER) and transported to protein bodies, specialized vacuoles for the GSP (Gluten) synthesis. The GSP is the main source of gluten protein synthesis within endosperm, governing its end-use value [27,28,30,31,32,33,34,35,36,64]. However, the underlying mechanism of protein quality during ER-to-Golgi trafficking, specifically folding and unfolding, is still a challenging factor in molecular terms [65]. The present study conducted a compressive analysis by using a deep transcriptomic survey at four critical stages (10 DPA, 14 DPA, 20 DPA, and 30 DPA), to observe systematic changes and the potential mechanism associated within the developing grain of high-quality characteristics of wheat cultivar Shaannong33 (Triticum aestivum L.), in association with its low-quality sister line (CK). The peak mitotic division within starchy endosperm occurs after 10 DPA in maize, after 12 in barley, and in wheat, it remains until 16 DPA [66,67,68,69,70]. A sum total of 125,729 DEGs were retrieved at all selected stages and 94,972 genes were classified in all four groups (T10 vs. CK10, T14 vs. CK14, T20 vs. CK20, and T30 vs. CK30) for further study. They were mainly involved in translation, ribosomal structure and biogenesis, intracellular trafficking, secretion, vesicular transport, defense mechanism, serine synthesis, cell wall modeling, carbohydrate metabolism, starch and sucrose metabolism, and many unknown functions (Table 3 and Figure 5, Figure 6, Figure 7 and Figure 8), which were also widely studied in other plant species. A number of studies had confirmed that the rule of the effects of GSP trafficking between the ER to Golgi body is linked with grain processing quality characteristics, especially during grain filling [27,28,65,70,71,72]. Here, we identified 315 DEGs in pathway id (map04141) that are linked with protein processing within the ER in the secondary category described as folding, sorting, and degradation, linked with GSPs degradation (Figure 9 and Table 3). The maximum translation, ribosomal structure, and biogenesis took place within T10 vs. CK10, T14 vs. CK14, and T20 vs. CK20 suggested optimum mitotic cell division, as previously reported by [68,69,70,71,72,73]. Further, we found that protein folding, sorting, and degradation-associated genes were enriched within 10 DPA-20 DPA. This might indicate the systematic role in quality control within ER to Golgi bodies, resulting in the enhancement of GSP quality improvement with storage protein activator (SPA). The SPA as a transcriptional regulator plays a significant role in GSP trafficking, ultimately defining dough viscoelasticity and grain hardness [57,73,74]. The 12 cysteine residues have a prominent effect on HMW-GS subunit “5 + 10” (more possible disulfide bonds in its chemical structure), leading to higher strength compared to the HMW-GS subunit (2 + 12), which possesses 11 cysteines [74,75]. Therefore, we suggested the significant number of genes in association with serine/threonine kinase activity, enlisted in Supplementary File S4. TraesCS1A02G148428 showed a 63.71-fold expression level at 10 DPA, which was recognized in GO: 0006535 (cysteine biosynthetic process from serine), suggesting the putative role in increasing tensile resistance of the used wheat cultivar “Shaanong 33”. It further signifies the role of GSP trafficking to the ER. Furthermore, the specific stage of grain development could be helpful for further investigation and could open a new venue toward an ER protein quality control mechanism.
The ER is the largest organelle in the cell and is a major site of protein synthesis and transport, protein folding, calcium storage, and carbohydrate metabolism [58,59,76,77]. The maximum activity of starchy endosperm development took place until 16 DPA [31,56,78,79]. The transcript driving the progression of endosperm development was differently expressed at different stages of harvest [9,76,79], as shown in Figure 11. The 60–80% GSP consists of gluten, developed within starchy endosperm. It determines the dough cohesiveness and viscoelasticity [9,74,80,81], which is a highly recommended wheat for bread and Chinese yellow alkaline noodles making. The extensive role of GSP highly endorses it for further extensive studies. In addition, the dynamic role of quantitative genetic variation in GSP composition has been reported for wheat [3,9,39,40,82]. In this study, we detected 315 DEGs encoding GSPs translocation in association with map0414, shown in Figure 9, Supplementary File S4 (sheets 1–4). They trigger protein processing pathways to maintain a homeostasis of the total amount of protein per grain [75,82,83]. The Rab GTPase is best characterized in Arabidopsis thaliana for its key involvement in specifically the trafficking mechanism. It works as a molecular switch to drive the transport of vesicles between membranous compartments. The motor proteins within the membrane regulate vesicle and compartment motility [28,29,30,33,61,62,84]. Hence, different Rab sub-clades have been classified in protein vesicle bodies trafficking to the Golgi apparatus and vacuole [85]. Consistent with the previous successful work, the present study also reported 177 DEGs in protein vesicle bodies trafficking to Golgi apparatus (Supplementary File S4, sheet 2), from which TraesCS1A02G223800 showed a 651.31-fold expression at 14 DPA, linked with GO: 0043547 functional association of positive regulation of GTPase activity. Further, at 14 DPA, the second major transition stage is where starch and seed storage proteins accumulate within cells to make semi-solid endosperm [56,79,86]. This suggested the role of storage protein activator SPA, in the key functional mechanism to maintain a homeostasis supply of nutrients between the maternal cells and the starchy endosperm, and linked with the serine-to-cysteine biosynthesis process. Rab GTPase has been approved in different quality characteristics of mango, and others [63,87]. Therefore, further investigation is needed to improve our knowledge. However, the current study could lead to a specific stage and candidate gene in association with protein processing within the developing grain.

4. Materials and Method

4.1. Plant Materials

Shaannong 33 is a newly released high-quality, strong gluten wheat variety that has been approved in Shaanxi Province and introduced in Henan Province, China [88,89]. A summary and details of Shaannong 33 are shown in Table 4, and the sister line of Shaannong 33, used as the control (CK), reported with low-quality traits, given in Table 1, represents three-year field trails. The plant material was planted in a 2 m row length, the plant-to-plant distance was 0.25 m, and each line was comprised of 40 plants, in three biological replicates [88,89,90,91], grown at Northwest Agriculture and Forestry University (Field station) under non-stressed conditions from October 2019 to 2020. The main individual spikes were tagged at the first day of anthesis. The tagged spikes were harvested at four main seed developmental stages, i.e., 10 DPA, 14 DPA, 20 DPA, and 30 DPA, immediately frozen in liquid nitrogen, and stored at −80 °C. The embryos of these samples were used for RNA extraction to isolate the entire RNA expressed in both used planted materials.

4.2. RNA Extraction

Total RNA was extracted from grains at 10, 14, 20, and 30 DPAs of Shaannong 33 and the control with three biological replicates by using Trizol Reagent according to the manufacturer’s instructions [88,89,92] (Invitrogen, Carlsbad, CA, USA), and genomic DNA was removed using DNase I (TaKara). Then, RNA quality was determined by the 2100 Bioanalyser (Agilent) and quantified using the ND-2000 (NanoDrop technologies). Only a high-quality RNA sample (OD260/280 = 1.8~2.2, OD260/230 ≥ 2.0, RIN ≥ 6.5, 28 S: 18 S ≥ 1.0, >10 μg) was used to construct the sequencing library [91]. For each of the samples at 10 DPA, 14 DPA, 20 DPA, and 30 DPA, three replicates of each time point were performed for the RNA-seq.

4.3. Library Preparation and Illumina Hiseq4000 Sequencing

There were 24 RNA-seq transcriptome libraries that were prepared following the TruSeqTM RNA sample preparation Kit from Illumina (San Diego, CA, USA) using 5 µg of total RNA. First, messenger RNA was isolated according to the polyA selection method by oligo (dT) beads and then fragmented by fragmentation buffer. Secondly, double-stranded cDNA was synthesized using a Superscript double-stranded cDNA synthesis kit (Invitrogen, Carlsbad, CA, USA) with random hexamer primers (Illumina). Then, the synthesized cDNA was subjected to end-repair, phosphorylation, and “A” base addition according to Illumina’s library construction protocol. Libraries were size-selected for cDNA target fragments of 200–300 bp on 2% low-range ultra-Agarose followed by PCR amplified using Phusion DNA polymerase (NEB) for 15 PCR cycles. After quantification by TBS380, the paired-end RNA-seq sequencing library was sequenced with the Illumina HiSeq 4000 (2 × 150 bp read length) [91,92].

4.4. Read Mapping

The raw paired-end reads were trimmed and quality-controlled by 11 October 2021 SeqPrep (https://github.com/justjohn/SeqPrep) and 11 October 2021 Sickle (https://github.com/najoshi/sickle) with default parameters. Then, clean reads were separately aligned to reference Triticum_aestivum version: iwgsc_refseqv1.0 source: http://www.wheatgenome.org/News/Latest-news/All-IWGSC-reference-sequence-resources-now-publicly-available-at-URGI with the orientation mode using TopHat 2.0.12 (Johns Hopkins University, Baltimore, Maryland) (http://tophat.cbcb.umd.edu/.version2.0.0) [93] software. The mapping of a criterion of bowtie was as follows: sequencing reads should be uniquely mated to the genome, allowing up to 2 mismatches, without insertions or deletions. Then, the region of the gene was expanded following depths of sites, and the operon was obtained. In addition, the whole genome was spilt into multiple 15 kbp windows that share 5 kbp. New transcribed regions were defined as more than 2 consecutive windows without overlapped regions of the gene, where there were at least 2 reads mapped per window in the same orientation.

4.5. Differential Expression Analysis and Functional Enrichment

A total of 24 RNA samples from Shaannong 33 and CK samples at four spike developmental stages (10, 14, 20, and 30 DAA) were sent to Shanghai Majorbio Bio-Pharm Technology Co., Ltd. (Shanghai, China) using paired-end sequencing on an Illumina HiSeq PE150 platform Shanghai Meiji Biomedical Technology (Shanghai, China) for RNA-sequencing and transcriptome assembly using previously described protocols [91,92]. Fragments per kilo-base of transcript per million mapped reads (FPKM) values were used to calculate transcript abundance in Shaannong 33 and CK collected samples. 21 October 2021 RSEM (http://dewelab.biostat.wisc.edu/rsem/) [94] was used to quantify gene abundances. A summary of the sequencing statistics for reads and bases obtained in each sample and statistics for the mapping of clean reads from each sample to the reference genome are given in Supplementary File S1. Further, the significance of differentially expressed genes (DEGs) was analyzed using R Statistical package software at 30 October 2021, EdgeR (empirical analysis digital gene expression in R, http://www.bioconductor.org/packages/2.12/bioc/html/edeR.html), a published method [95]. The biological processes associated with each gene in each sample were evaluated using Gene Ontology (GO) analysis 1 November 2021 (http://www.geneontology.org/). KEGG pathways with corrected p-values < 0.01 were considered to be significantly enriched (http://www.genome.jp/kegg/) [96].

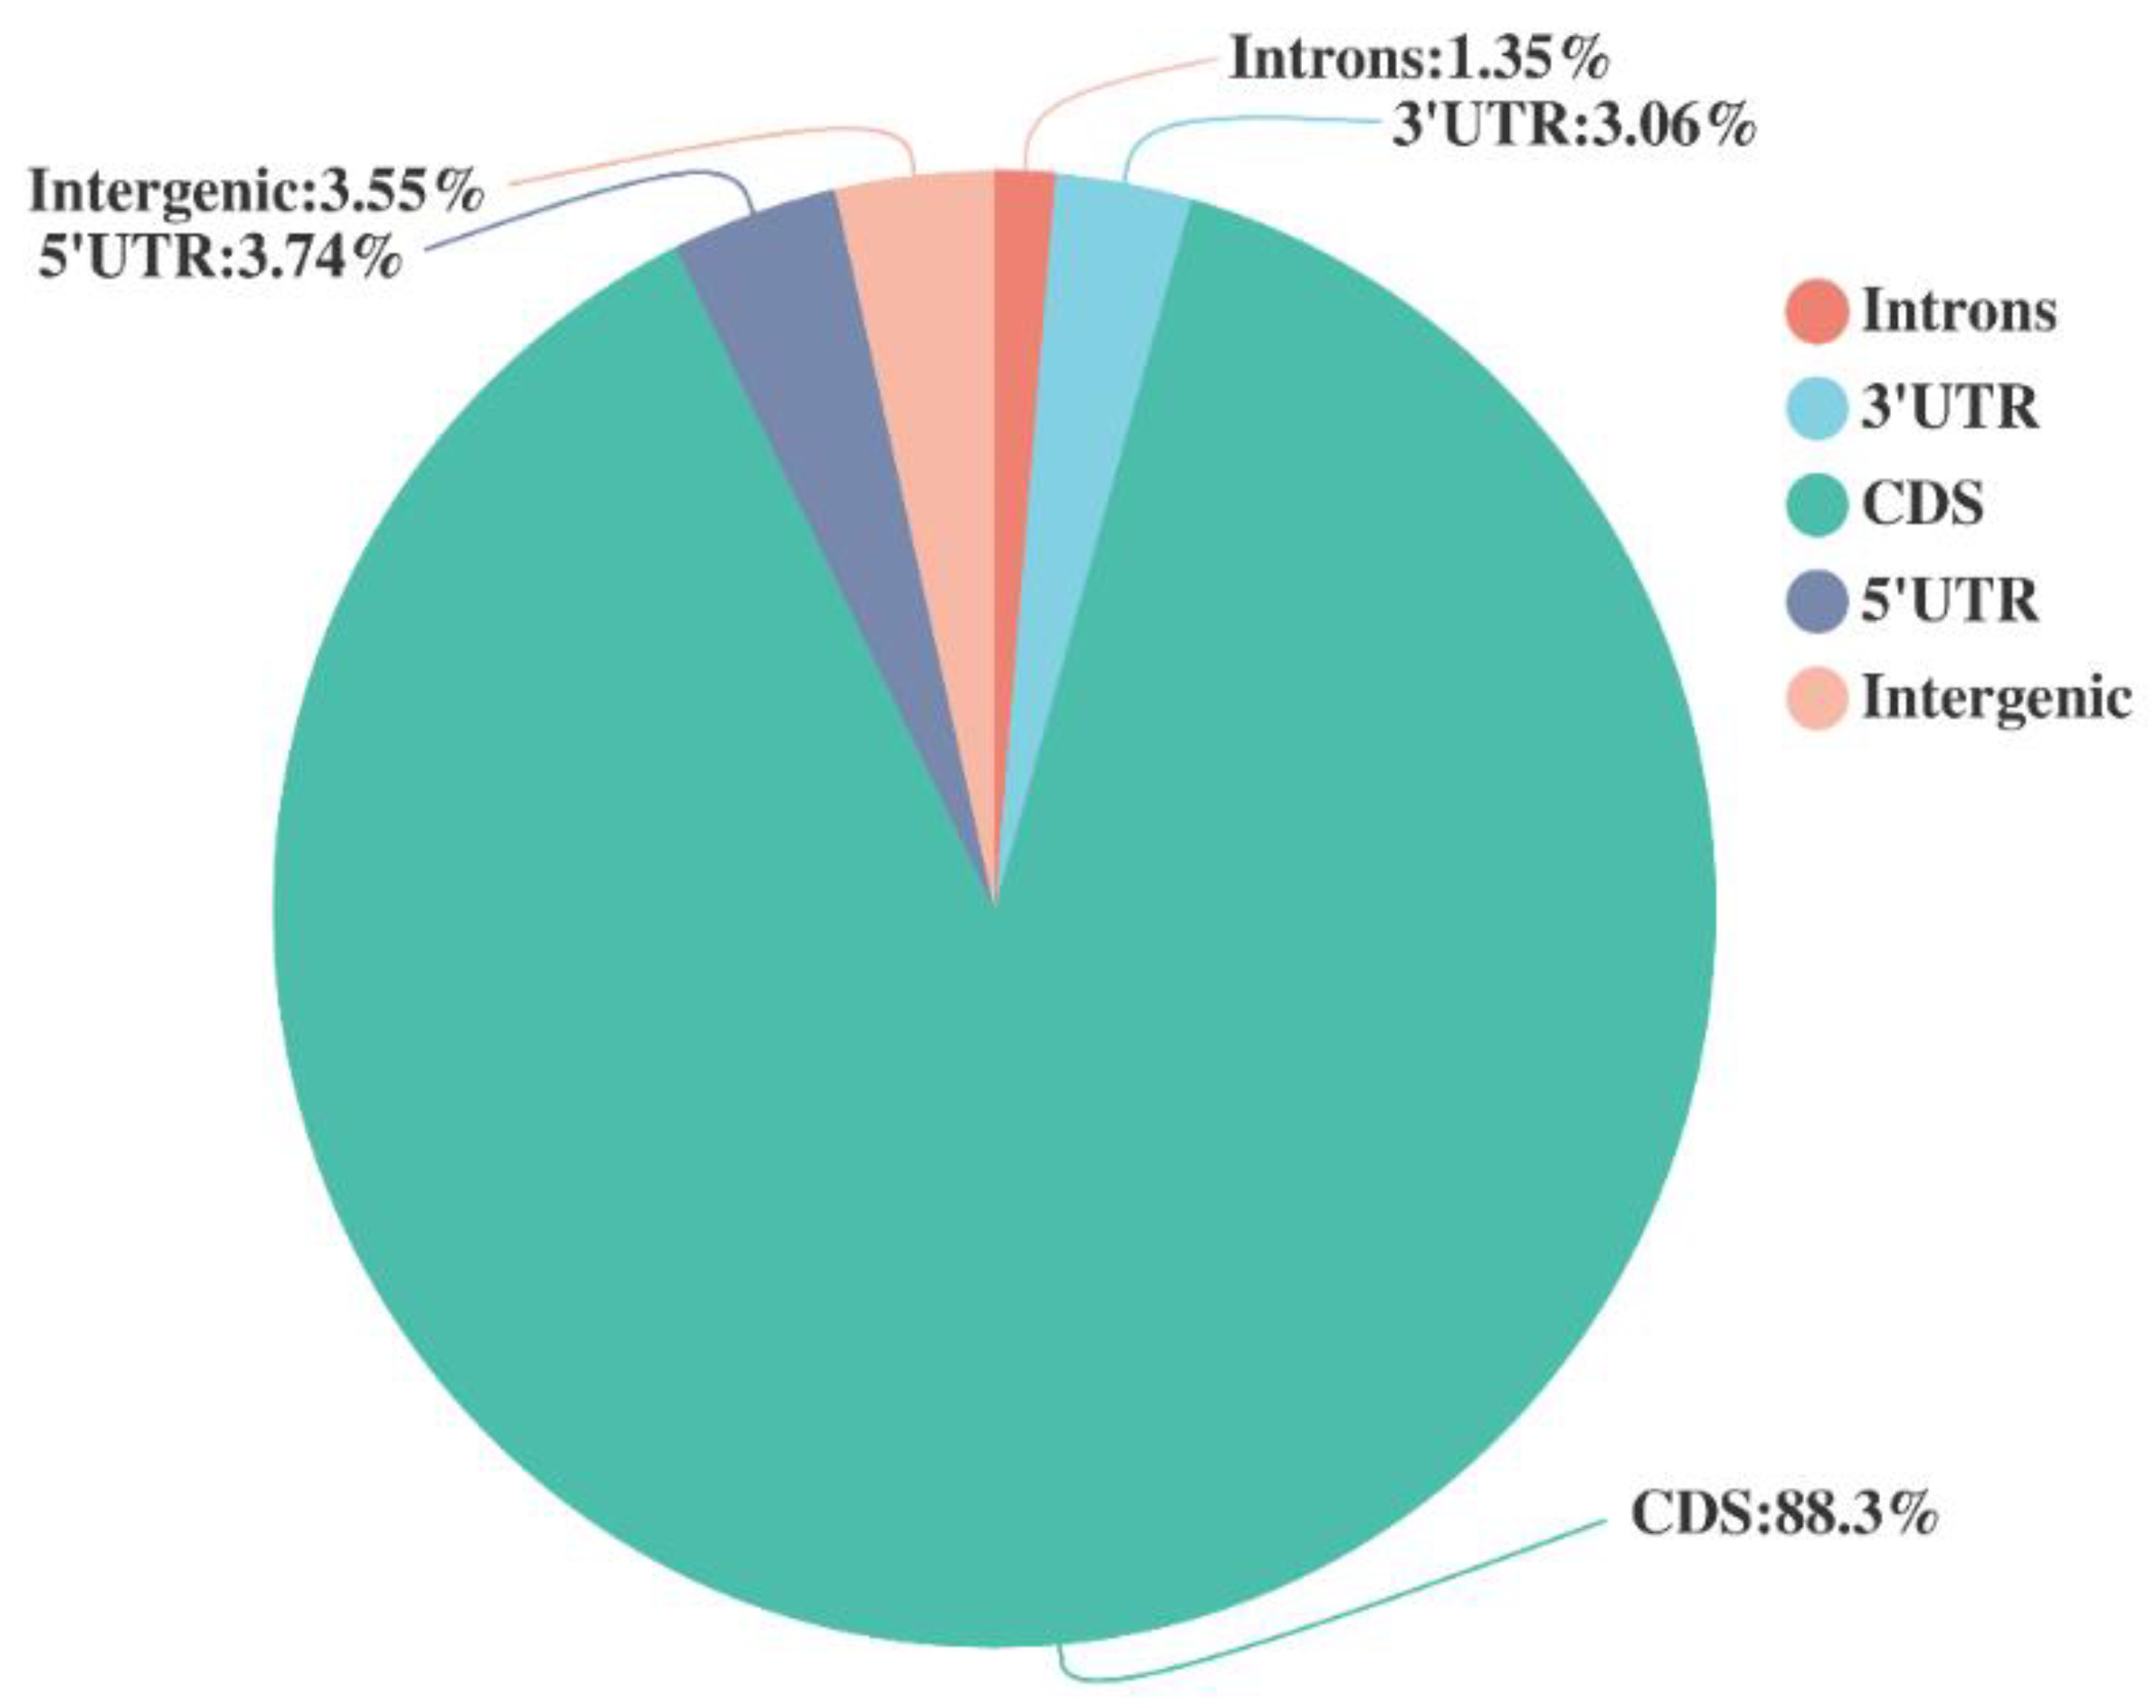
4.6. New Isoforms Prediction

The TOpHat-Cufflinks pipeline was used to predict gene isoforms from our RNA-seq data. In 1 January 2022 TopHat (http://tophat.cbcb.umd.edu/, version 2.0.0) [93], the option “min-isofom-fraction” was disabled; instead, “coverage-search”, “butterfly-search”, and “microexon-search” were used. The expected fragment length was set to 200 bp and the “small-anchor-fraction” was set to 0.08, which requires at least 8 bp on each side of an exon junction for our 100-bp RNA-seq data. Cuffcompare was used to compare and merge the reference annotation and the isoform predictions.

4.7. Alternative Splice Events Identification

All the alternative splice events that occurred in our sample were identified by using the recently released program Multivariate analysis of 1 December 2021 Transcript Splicing (MATS, http://rnaseq-mats.sourceforage.net/) [97]. Only the isoforms that were similar to the reference or comprised novel splice junctions were considered, and the splicing differences were detected as exon inclusion, exclusion, alternative 5’, 3’, and intron retention events.

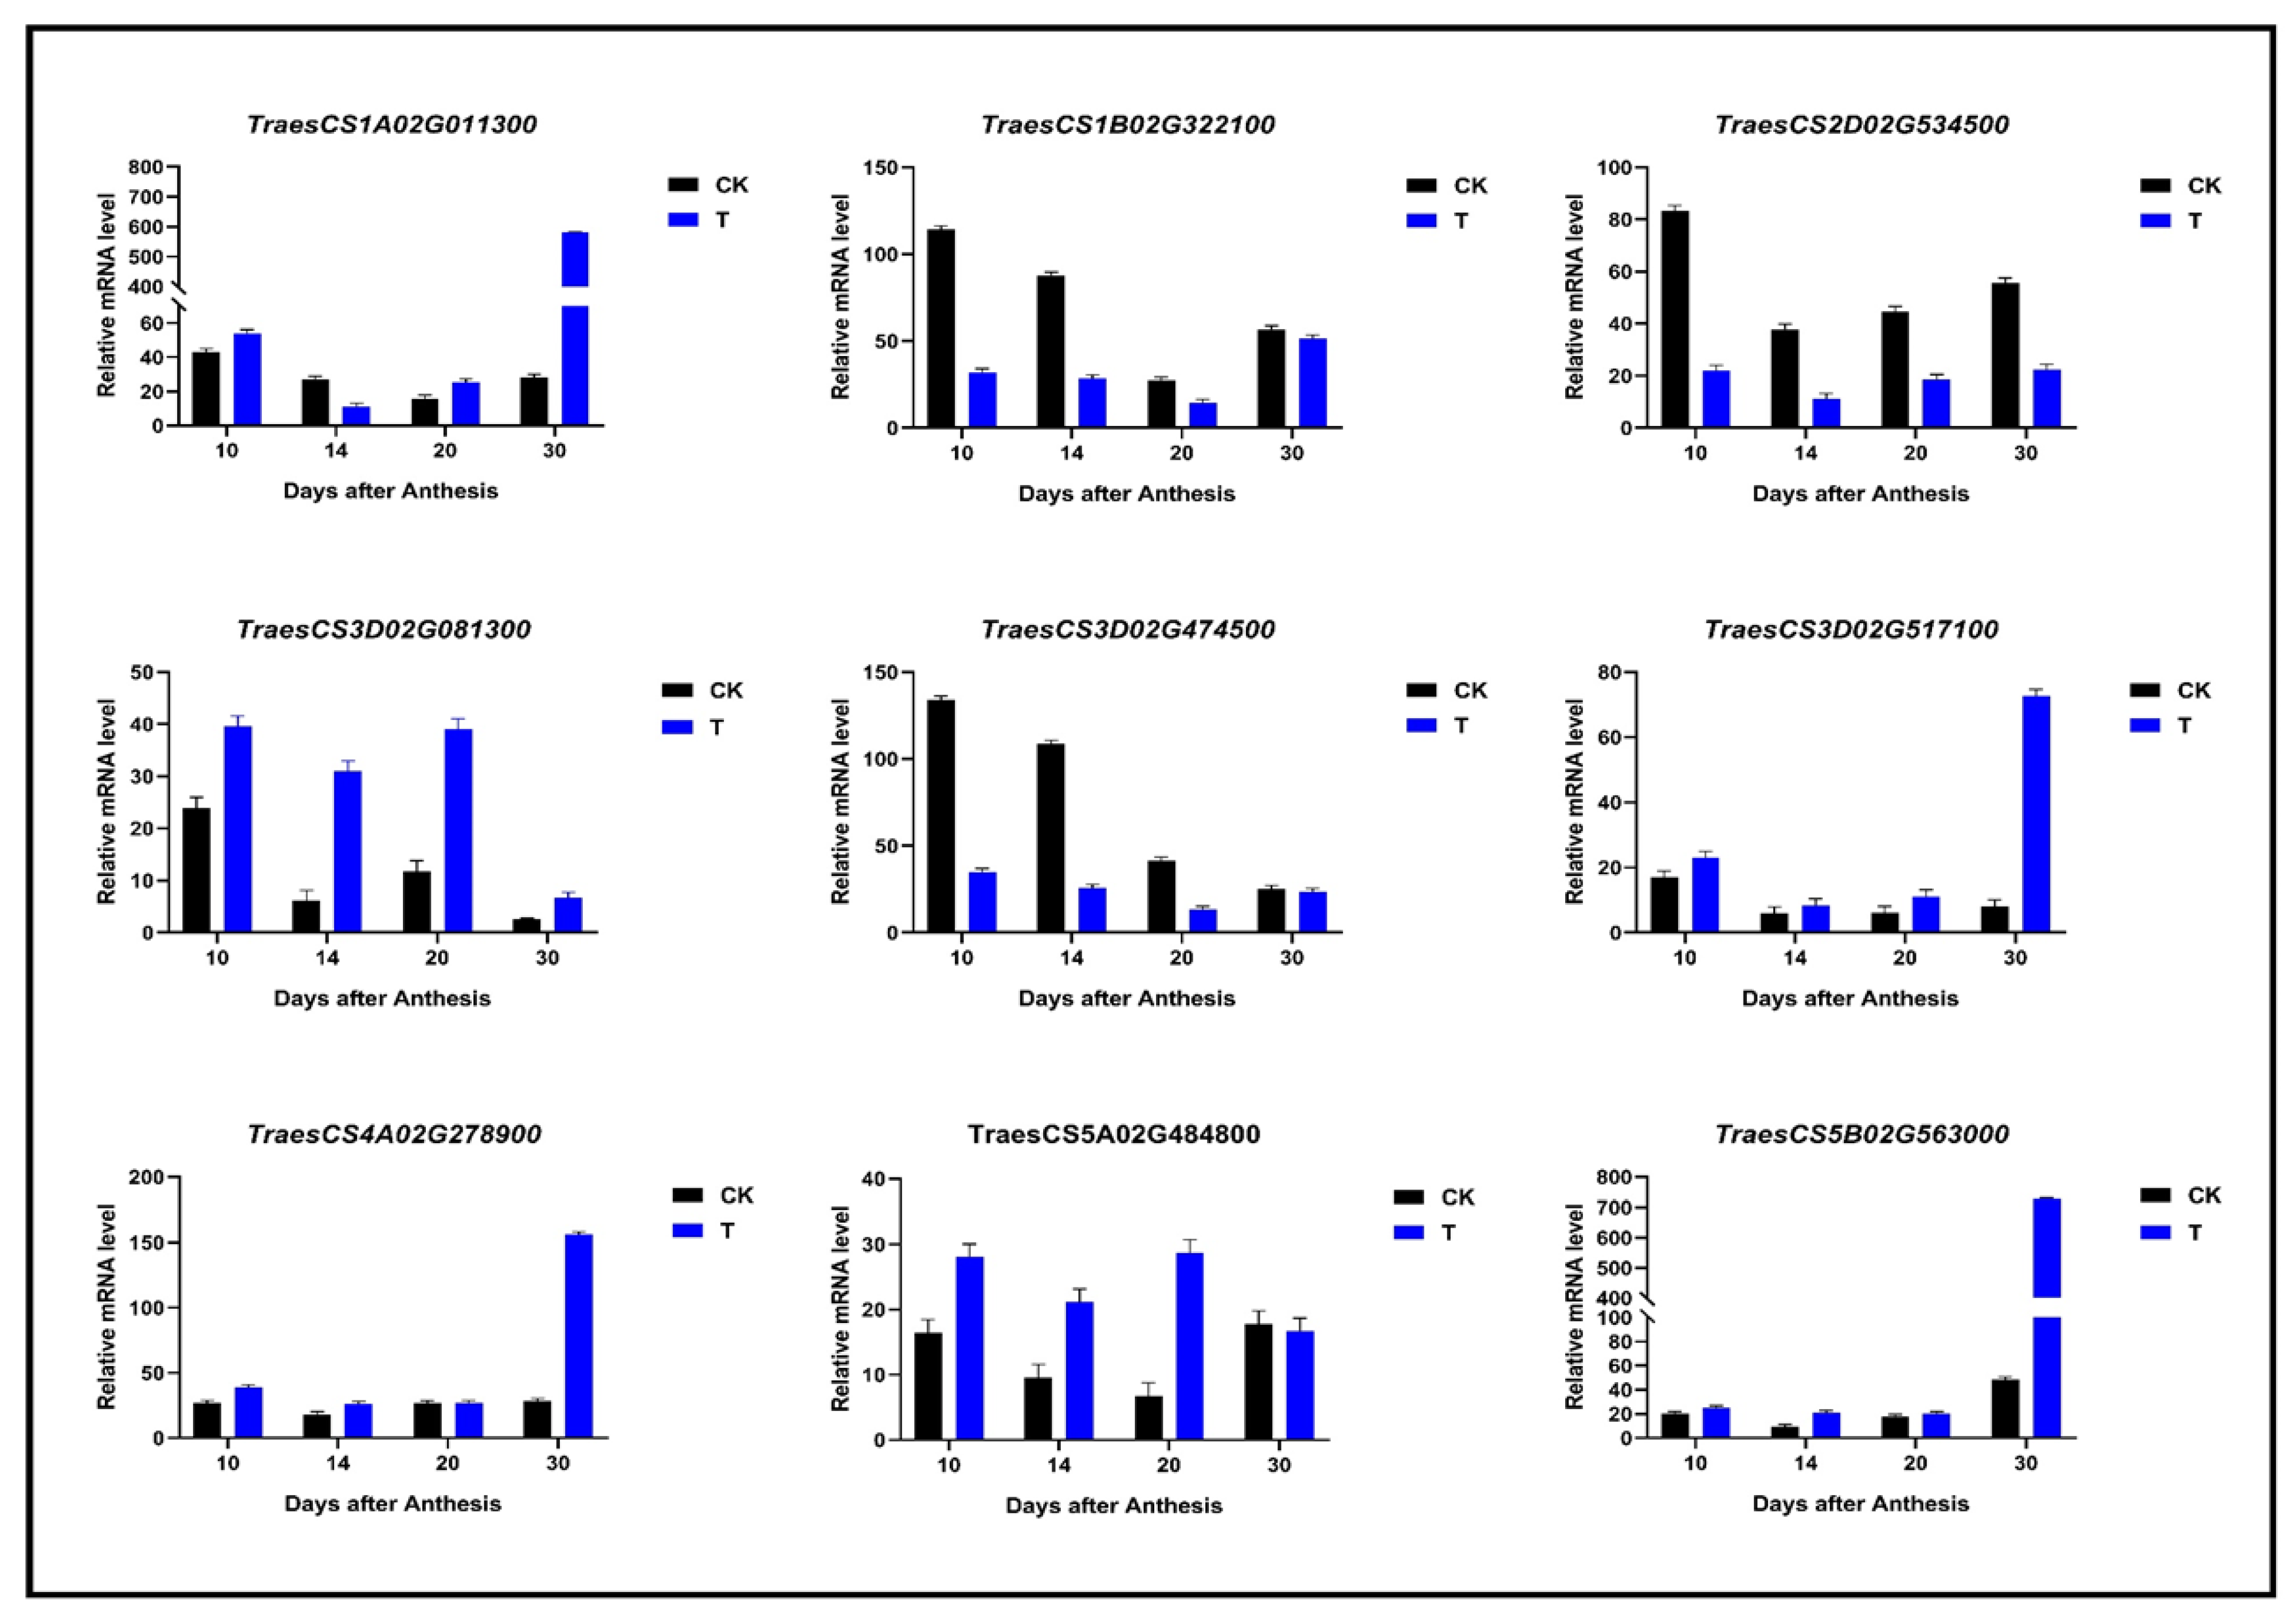
4.8. Gene Expression Level Validation by qRT-PCR

Total RNA was isolated by using a total RNA kit (TIAGEN, Beijing, China) following the manufacturer’s instructions, followed by [88,89]. For the complementary DNA (cDNA) synthesis, 2 mg of total RNA was reverse-transcribed using a Prime-Script TM II First-Strand cDNA synthesis Kit (TakaRa, Dalian, China). The quantitative real-time PCR (qRT-PCR) analysis was performed with a Light Cycle 480 II system (Roche, Basel, Switzerland) using an SYNR Premix Ex TaqTM kit (TakaRa, Dalian, China). The UBI-eq gene was used as an internal control. The primer sequences used for the PCR are given in (Supplementary File S5, sheet 2). Three replicates were made for three separate RNA extracts from the three samples.

5. Conclusions

The accumulation of protein bodies is taken either directly within the lumen of the ER or through the Golgi apparatus into the vacuole [27,28,29,30,31,59,60,61,62,63,70,98]. Here, we proposed a model through combining our results and previous successful works, which could be used to test how trafficking of GSP within the developing grain improves the wheat grain end-product quality (Figure 13). This proposal begins with the expression of the translation-, ribosomal-structure- and biogenesis-, and protein-folding- and unfolding-related DEGs. The TFs bind with the promoter region of a suite of genes, improving storage proteins and protein synthesis regulator proteins in wheat grains. Thus, the composition changes within the ribosome lead to a higher demand for protein synthesis and more molecular chaperones assisting nascent proteins to fold properly and be stored. The abundances of chaperones and other storage proteins into the protein storage vacuoles with enhanced stability led to a broad increase in the abundance of HMW-GSs, further enhancing storage protein synthesis and deposition, and leading to a significant improvement in the dough quality with changes in gluten composition. Therefore, this study suggested the identification of putative DEGs that could contribute to enhanced protein content, at different stages of DPA in wheat grains.

Supplementary Materials

The supporting information can be downloaded at: https://www.mdpi.com/article/10.3390/ijms232314851/s1.

Author Contributions

Z.A.B. and C.W. (Chaojie Wang), conceptualization, formal analysis, methodology, writing—original draft; A.S., data curation, funding acquisition, formal analysis, investigation, resources, writing—review and editing; C.W. (Chengshe Wang), S.H., and M.N., formal analysis, writing—review and editing, methodology, resources, investigation, writing—review and editing. All authors participated in writing the manuscript and approved the final version. All authors have read and agreed to the published version of the manuscript.

Funding

This work was financially supported by the National Key Research and Development Program of China (2016YFD0102101), the Chinese Universities Scientific Fund (2452022112), the National Natural Science Foundation of China (31101139), and the special fund of Nanyang wheat experimental and Demonstration Station (2022NY).

Institutional Review Board Statement

Not applicable.

Informed Consent Statement

Not applicable.

Data Availability Statement

The main data supporting the results of this article are included within the article and the provided in Supplementary Materials.

Acknowledgments

The authors would like to acknowledge “Shanghai Majorbio Bio-Pharm Technology Co., Ltd. (Shanghai, China) using paired-end sequencing on an Illumina HiSeq PE150 platform” for conducting the RNA-sequencing experiment and also providing kind assistance in analyzing the data.

Conflicts of Interest

The authors declare that they have no competing interests.

Abbreviations

ER: Endoplasmic reticulum; GO: gene ontology; HC: high confidence; IWGSC: International Wheat Genome Sequencing Consortium; QTL: quantitative trait loci; ROS: reactive oxygen species; RT-qPCR: real-time quantitative PCR. Statement: All methods and material used are complied with relevant institutional, national, and international guidelines and legislation in the methods section of the manuscript.

References

  1. Beecher, B.; Bettge, A.; Smidansky, E.; Giroux, M. Expression of wild-type pinB sequence in transgenic wheat complements a hard phenotype. Theor. Appl. Genet. 2002, 105, 870–877. [Google Scholar] [CrossRef]
  2. Day, L.; Augustin, M.A.; Batey, I.L.; Wrigley, C.W. Wheat-gluten uses and industry needs. Trends Food Sci. Technol. 2006, 17, 82–90. [Google Scholar] [CrossRef]
  3. Shewry, P.R.; Hey, S.J. The contribution of wheat to human diet and health. Food Energy Secur. 2015, 4, 178–202. [Google Scholar] [CrossRef] [PubMed]
  4. Juliana, P.; Poland, J.; Huerta-Espino, J.; Shrestha, S.; Crossa, J.; Crespo-Herrera, L.; Toledo, F.H.; Govindan, V.; Mondal, S.; Kumar, U.; et al. Improving grain yield, stress resilience and quality of bread wheat using large-scale genomics. Nat. Genet. 2019, 51, 1530–1539. [Google Scholar] [CrossRef] [PubMed]
  5. Sharif, R.; Su, L.; Chen, X.; Qi, X. Involvement of auxin in growth and stress response of cucumber. Veg. Res. 2022. [Google Scholar] [CrossRef]
  6. Curtis, T.; Halford, N.G. Food security: The challenge of increasing wheat yield and the importance of not compromising food safety. Ann. Appl. Biol. 2014, 164, 354–372. [Google Scholar] [CrossRef] [Green Version]
  7. FAOSTAT. (FAOSTAT Analytical Brief 41. (ISSN2709-006x [Print]. ISSN2709-0078 [Online]). 2018. Available online: http://www.fao.org/faostat/ (accessed on 12 September 2022).
  8. Ray, D.K.; Mueller, N.D.; West, P.C.; Foley, J.A. Yield trends are insufficient to double global crop production by 2050. PLoS ONE 2013, 8, e66428. [Google Scholar] [CrossRef] [Green Version]
  9. Shewry, P.R. Wheat. J. Exp. Bot. 2009, 60, 1537–1553. [Google Scholar] [CrossRef]
  10. Xiang, D.; Quilichini, T.D.; Liu, Z.; Gao, P.; Pan, Y.; Li, Q.; Nilsen, K.T.; Venglat, P.; Esteban, E.; Pasha, A.; et al. The Transcriptional landscape of polypoid wheats and their diploid ancestors during embryogenesis and grain development. Plant Cell 2019, 31, 2888–2911. [Google Scholar] [CrossRef] [Green Version]
  11. Michel, S.; Gallee, M.; Löschenberger, F.; Buerstmayr, H.; Kummer, C. Improving the baking quality of bread wheat using rapid tests and genomics: The prediction of dough rheological parameters by gluten peak indices and genomic selection models. J. Cereal Sci. 2017, 77, 24–34. [Google Scholar] [CrossRef]
  12. Wang, D.; Li, F.; Cao, S.; Zhang, K. Genomic and functional genomics analyses of gluten proteins and prospect for simultaneous improvement of end-use and health-related traits in wheat. Theor. Appl. Genet. 2020, 133, 1521–1539. [Google Scholar] [CrossRef] [PubMed] [Green Version]
  13. Zhou, Z.; Liu, C.; Qin, M.; Li, W.; Hou, J.; Shi, X.; Dai, Z.; Yao, W.; Tian, B.; Lei, Z.; et al. Promoter DNA hypermethylation of TaGli-γ-2.1 positively regulates gluten strength in bread wheat. J. Adv. Res. 2022, 36, 163–173. [Google Scholar] [CrossRef] [PubMed]
  14. Zhang, H.; Si, X.; Ji, X.; Fan, R.; Liu, J.; Chen., K.; Wang, D.; Gao, C. Genome editing of upstream open reading frames enables translational control in plants. Nat. Biotechnol. 2018, 36, 894–898. [Google Scholar] [CrossRef]
  15. Li, D.; Jin, H.; Zhang, K.; Wang, Z.; Wang, F.; Zhao, Y.; Huo, N.; Liu, X.; Gu, Y.Q.; Wang, D.; et al. Analysis of the Gli-D2 locus identifies a genetic target for simultaneously improving the bread-making and health-related traits of common wheat. Plant J. 2018, 95, 414–426. [Google Scholar] [CrossRef] [PubMed] [Green Version]
  16. Wang, Z.; Li, Y.; Yang, Y.; Liu, X.; Qin, H.; Dong, Z.; Zheng, S.; Zhang, K.; Wang, D. New insight into the function of wheat glutenin proteins as investigated with two series of genetic mutants. Sci. Rep. 2017, 7, 3428. [Google Scholar] [CrossRef]
  17. Ma, W.; Yu, Z.; She, M.; Zhao, Y.; Islam, S. Wheat gluten protein and its impacts on wheat processing quality. Front. Agric. Sci. Eng. 2019, 6, 279. [Google Scholar] [CrossRef] [Green Version]
  18. Anjum, F.M.; Khan, M.R.; Din, A.; Saeed, M.; Pasha, I.; Arshad, M.U. Wheat gluten: High molecular weight glutenin subunits—structure, genetics, and relation to dough elasticity. J. Food Sci. 2007, 72, R56–R63. [Google Scholar] [CrossRef]
  19. Gupta, R.B.; Shepherd, K.W. Two-step one-dimensional SDS-PAGE analysis of LMW subunits of glutelin. Theor. Appl. Genet. 1990, 80, 183–187. [Google Scholar] [CrossRef]
  20. Rehman, S.U.; Paterson, A.; Piggott, J.R. Optimization of flours for chapatti preparation using a mixture design. J. Sci. Food Agric. 2007, 87, 425–430. [Google Scholar] [CrossRef]
  21. Shewry, P.R.; Popineau, Y.; Lafiandra, D.; Belton, P. Wheat glutenin subunits and dough elasticity: Findings of the EUROWHEAT project. Trends Food Sci. Technol. 2000, 11, 433–441. [Google Scholar] [CrossRef]
  22. Osborne, T.B. The Proteins of the Wheat Kerne; Carnegie Institution of Washington, Publication No.84; Judd & Detweiler, Inc.: Washington, DC, USA, 1907. [Google Scholar] [CrossRef] [Green Version]
  23. Shewry, P.R. What is gluten—Why is it special? Front Nutr. 2019, 6, 101. [Google Scholar] [CrossRef] [PubMed]
  24. Shewry, P.R.; Halford, N.G.; Lafiandra, D. Genetics of wheat gluten proteins. Adv. Genet. 2003, 49, 111–184. [Google Scholar] [PubMed]
  25. Evers, T.; Millar, S. Cereal Grain Structure and Development: Some Implications for Quality. J. Cereal Sci. 2002, 36, 261–284. [Google Scholar] [CrossRef]
  26. Laudencia-Chingcuanco, D.L.; Stamova, B.S.; Lazo, G.R.; Cui, X.; Anderson, O.D. Analysis of the wheat endosperm transcriptome. J. Appl. Genet. 2006, 47, 287–302. [Google Scholar] [CrossRef]
  27. Cao, X.; Dong, Z.; Tian, D.; Dong, L.; Qian, W.; Liu, J.; Liu, X.; Qin, H.; Zhai, W.; Gao, C.; et al. Development and characterization of marker-free and transgene insertion site-defined transgenic wheat with improved grain storability and fatty acid content. Plant Biotechnol. J. 2020, 18, 129–140. [Google Scholar] [CrossRef]
  28. Tyler, A.M.; Bhandari, D.G.; Poole, M.; Napier, J.A.; Jones, H.D.; Lu, C.; Lycett, G.W. Gluten quality of bread wheat is associated with activity of RabD GTPases. Plant Biotechnol. J. 2015, 13, 163–176. [Google Scholar] [CrossRef] [PubMed] [Green Version]
  29. Batoko, H.; Zheng, H.Q.; Hawes, C.; Moore, I. A Rab1 GTPase is required for transport between the endoplasmic reticulum and Golgi apparatus and for normal Golgi movement in plants. Plant Cell 2000, 12, 2201–2217. [Google Scholar] [CrossRef] [Green Version]
  30. Adam Micheal Tyler. Manipulating Rab GTPase Activity in Wheat to Alter Gluten Quality for Bread-making. 2012. Available online: http://eprints.nottingham.ac.uk/12914/1/Thesis_Hardbound_AMT_6.pdf (accessed on 12 September 2022).
  31. Tosi, P.; Parker, M.; Gritsch, C.S.; Carzaniga, R.; Martin, B.; Shewry, P.R. Trafficking of storage proteins in developing grain of wheat. J. Exp. Bot. 2009, 60, 979–991. [Google Scholar] [CrossRef] [PubMed] [Green Version]
  32. Parker, M.L. Protein Body Inclusions in Developing Wheat Endosperm. Ann. Bot. 1980, 46, 29–36. [Google Scholar] [CrossRef]
  33. Zheng, H.; Camacho, L.; Wee, E.; Batoko, H.; Legen, J.; Leaver, C.J.; Malhó, R.; Hussey, P.; Moore, I. A Rab-E GTPase Mutant Acts Downstream of the Rab-D Subclass in Biosynthetic Membrane Traffic to the Plasma Membrane in Tobacco Leaf Epidermis. Plant Cell 2005, 17, 2020–2036. [Google Scholar] [CrossRef] [Green Version]
  34. Rasheed, F.; Plivelic, T.S.; Kuktaite, R.; Hedenqvist, M.S.; Johansson, E. Unraveling the Structural Puzzle of the Giant Glutenin Polymer—An Interplay between Protein Polymerization, Nano morphology, and Functional Properties in Bioplastic Films. ACS Omega 2018, 3, 5584–5592. [Google Scholar] [CrossRef] [PubMed]
  35. Johansson, E.; Nilsson, H.; Mazhar, H.; Skerritt, J.; MacRitchie, F.; Svensson, G. Seasonal effects on storage proteins and gluten strength in four Swedish wheat cultivars. J. Sci. Food Agric. 2002, 82, 1305–1311. [Google Scholar] [CrossRef]
  36. Rasheed, F.; Kuktaite, R.; Hedenqvist, M.S.; Gallstedt, M.; Plivelic, T.S.; Johansson, E. The use of plants as a green factory to produce high strength gluten-based materials. Green Chem. 2016, 18, 2782–2792. [Google Scholar] [CrossRef]
  37. Vitale, A.; Ceriotti, A.; Denecke, J. The Role of the Endoplasmic Reticulum in Protein Synthesis, Modification and Intracellular Transport. J. Exp. Bot. 1993, 44, 1417–1444. [Google Scholar] [CrossRef]
  38. Parker, M.L. Protein accumulation in the developing endosperm of a high protein line of Triticum dicoccoides. Plant Cell Environ. 1982, 5, 37–43. [Google Scholar]
  39. Kim, W.T.; Franceschi, V.R.; Krishnan, H.B.; Okita, T.W.; Okita, T. Formation of wheat protein bodies: Involvement of the Golgi apparatus in gliadin transport. Planta 1988, 176, 173–182. [Google Scholar] [CrossRef]
  40. Loussert, C.; Popineau, Y.; Mangavel, C. Protein bodies ontogeny and localization of prolamin components in the developing endosperm of wheat caryopses. J. Cereal Sci. 2008, 47, 445–456. [Google Scholar] [CrossRef]
  41. Grimberg, Å.; Wilkinson, M.; Snell, P.; De Vos, R.P.; González-Thuillier, I.; Tawfike, A.; Ward, J.L.; Carlsson, A.S.; Shewry, P.; Hofvander, P. Transitions in wheat endosperm metabolism upon transcriptional induction of oil accumulation by oat endosperm WRINKLED1. BMC Plant Biol. 2020, 20, 235. [Google Scholar] [CrossRef]
  42. Cullum, R.; Alder, O.; Hoodless, P.A. The next generation: Using new sequencing technologies to analyses gene regulation. Respirology 2011, 16, 210–222. [Google Scholar] [CrossRef]
  43. Yu, K.; Liu, D.; Chen, Y.; Wang, D.; Yang, W.; Yang, W.; Yin, L.; Zhang, C.; Zhao, S.; Sun, J.; et al. Unraveling the genetic architecture of grain size in einkorn wheat through linkage and homology mapping and transcriptomic profiling. J. Exp. Bot. 2019, 70, 4671–4688. [Google Scholar] [CrossRef]
  44. Baird, N.A.; Etter, P.D.; Atwood, T.S.; Currey, M.C.; Shiver, A.L.; Lewis, Z.A.; Selker, E.U.; Cresko, W.A.; Johnson, E.A. Rapid SNP Discovery and Genetic Mapping Using Sequenced RAD Markers. PLoS ONE 2008, 3, e3376. [Google Scholar] [CrossRef] [PubMed]
  45. Margarido, G.R.A.; Heckerman, D. ConPADE: Genome Assembly Ploidy Estimation from Next-Generation Sequencing Data. PLOS Comput. Biol. 2015, 11, e1004229. [Google Scholar] [CrossRef] [PubMed]
  46. Gardiner, L.-J.; Bansept-Basler, P.; Olohan, L.; Joynson, R.; Brenchley, R.; Hall, N.; O’Sullivan, D.M.; Hall, A. Mapping-by-sequencing in complex polyploid genomes using genic sequence capture: A case study to map yellow rust resistance in hexaploid wheat. Plant J. 2016, 87, 403–419. [Google Scholar] [CrossRef] [PubMed] [Green Version]
  47. Wan, Y.; Poole, R.L.; Huttly, A.K.; Toscano-Underwood, C.; Feeney, K.; Welham, S.; Gooding, M.J.; Mills, C.; Edwards, K.J.; Shewry, P.R.; et al. Transcriptome analysis of grain development in hexaploid wheat. BMC Genom. 2008, 9, 121. [Google Scholar] [CrossRef] [PubMed] [Green Version]
  48. Meng, F.; Liu, H.; Wang, K.; Liu, L.; Wang, S.; Zhao, Y.; Yin, J.; Li, Y. Development-associated microRNAs in grains of wheat (Triticum aestivum L.). BMC Plant Biol. 2013, 13, 140. [Google Scholar] [CrossRef] [Green Version]
  49. Jackson, D.; Buell, C.R. Crop domestication: Past, present and future. Plant Cell Physiol. 2022, 63, 1527–1528. [Google Scholar] [CrossRef]
  50. Brinton, J.; Uauy, C. A reductionist approach to dissecting grain weight and yield in wheat. J. Integr. Plant Biol. 2018, 61, 337–358. [Google Scholar] [CrossRef] [Green Version]
  51. Adamski, N.M.; Borrill, P.; Brinton, J.; Harrington, S.A.; Marchal, C.; Bentley, A.R.; Bovill, W.D.; Cattivelli, L.; Cockram, J.; Contreras-Moreira, B.; et al. A roadmap for gene functional characterization in crops with large genomes: Lessons from polyploid wheat. eLife 2020, 9, 55646. [Google Scholar] [CrossRef]
  52. Barrero, J.M.; Cavanagh, C.; Verbyla, K.L.; Tibbits, J.F.; Verbyla, A.P.; Huang, B.E.; Rosewarne, G.M.; Stephen, S.; Wang, P.; Whan, A.; et al. Transcriptomic analysis of wheat near-isogenic lines identifies PM19-A1 and A2 as candidates for a major dormancy QTL. Genome Biol. 2015, 16, 93. [Google Scholar] [CrossRef] [Green Version]
  53. Zhai, H.; Jiang, C.; Zhao, Y.; Yang, S.; Li, Y.; Yan, K.; Wu, S.; Luo, B.; Du, Y.; Jin, H.; et al. Wheat heat tolerance is impaired by heightened deletions in the distal end of 4AL chromosomal arm. Plant Biotechnol. J. 2021, 19, 1038–1051. [Google Scholar] [CrossRef]
  54. Arenas-M, A.; Castillo, F.M.; Godoy, D.; Canales, J.; Calderini, D.F. Transcriptomic and Physiological Response of Durum Wheat Grain to Short-Term Heat Stress during Early Grain Filling. Plants 2022, 11, 59. [Google Scholar] [CrossRef] [PubMed]
  55. Rogers, S.O.; Quatrano, R.S. Morphological Staging of Wheat Caryopsis Development. Am. J. Bot. 1983, 70, 308–311. [Google Scholar] [CrossRef]
  56. Survase, A.R. Genomics of Consumer Traits in Chapatti Quality. Queensland Alliance for Agriculture and Food Innovation. 2017. Available online: https://espace.library.uq.edu.au/data/UQ_701980/s4306877_thesis.pdf (accessed on 12 September 2022).
  57. Ravel, C.; Martre, P.; Romeuf, I.; Dardevet, M.; El-Malki, R.; Bordes, J.; Charmet, G. Nucleotide Polymorphism in the Wheat Transcriptional Activator Spa Influences Its Pattern of Expression and Has Pleiotropic Effects on Grain Protein Composition, Dough Viscoelasticity, and Grain Hardness. Plant Physiol. 2009, 151, 2133–2144. [Google Scholar] [CrossRef] [PubMed] [Green Version]
  58. Oszvald, M.; Tamas, L.; Shewry, P.R.; Tosi, P. The trafficking pathway of a wheat storage protein in transgenic rice endosperm. Ann. Bot. 2014, 113, 807–815. [Google Scholar] [CrossRef] [PubMed] [Green Version]
  59. Galili, G.; Sengupta-Gopalan, C.; Ceriotti, A. The endoplasmic reticulum of plant cells and its role in protein maturation and biogenesis of oil bodies. Plant Mol. Biol. 1998, 38, 1–29. [Google Scholar] [CrossRef] [PubMed]
  60. Jo, Y.-M.; Cho, K.; Lee, H.-J.; Lim, S.-H.; Kim, J.S.; Kim, Y.-M.; Lee, J.-Y. Cellular Localization of Wheat High Molecular Weight Glutenin Subunits in Transgenic Rice Grain. Int. J. Mol. Sci. 2017, 18, 2458. [Google Scholar] [CrossRef] [Green Version]
  61. Stenmark, H. Rab GTPases as coordinators of vesicle traffic. Nat. Rev. Mol. Cell Biol. 2009, 10, 513–525. [Google Scholar] [CrossRef]
  62. Zerial, M.; Mcbride, H. Rab proteins as membrane organizers. Nat. Rev. Mol. Cell Biol. 2001, 2, 107–117. [Google Scholar] [CrossRef]
  63. Lawson, T.; Lycett, G.W.; Mayes, S.; Ho, W.K.; Chin, C.F. Transcriptome-wide identification and characterization of the Rab GTPase family in mango. Mol. Biol. Rep. 2020, 47, 4183–4197. [Google Scholar] [CrossRef]
  64. Ma, D.; Gao, H.; Du, C.; Li, L.; Sun, W.; Liu, S.; Wang, C.; Xie, Y.; Kang, G. Transcriptomic and Metabolomics Analysis of Different Endosperm Region under Nitrogen Treatments. Int. J. Mol. Sci. 2019, 20, 4212. [Google Scholar] [CrossRef]
  65. Määttänen, P.; Gehring, K.; Bergeron, J.J.; Thomas, D.Y. Protein quality control in the ER: The recognition of misfolded proteins. Semin. Cell Dev. Biol. 2010, 21, 500–511. [Google Scholar] [CrossRef] [PubMed]
  66. Olsen, O.-A. The Modular Control of Cereal Endosperm Development. Trends Plant Sci. 2020, 25, 279–290. [Google Scholar] [CrossRef] [PubMed]
  67. Brown, R.C.; Lemmon, B.E.; Olsen, O.A. Endosperm development in barley: Microtubule involvement in the morphogenetic pathway. Plant Cell 1994, 6, 1241–1252. [Google Scholar] [CrossRef] [PubMed] [Green Version]
  68. Kiesselbach, T.A. The Structure and Eeproduction of Corn; (Research bulletin of the Agricultural Experiment Station of Nebraska No. 161); University of Nebraska: Lincoln, NE, USA, 1949. [Google Scholar]
  69. Briarty, L.G.; Hughes, C.E.; Evers, A.D. The Developing Endosperm of Wheat—A Stereological Analysis. Ann. Bot. 1979, 44, 641–658. [Google Scholar] [CrossRef]
  70. Cao, H.; Duncan, O.; Millar, A.H. Protein turnover in the developing Tritium aestium grain. New Phytol. 2022, 233, 1188–1201. [Google Scholar] [CrossRef]
  71. Zhang, Y.; Xu, Y.H.; Yi, H.Y.; Gong, J.M. Vacuolar membrane transporters OsVIT1 and OsVIT2 modulate iron translocation between fag leaves and seeds in rice. Plant J. 2012, 72, 400–410. [Google Scholar] [CrossRef]
  72. Luo, G.; Shen, L.; Song, Y.; Yu, K.; Ji, J.; Zhang, C.; Yang, W.; Li, X.; Sun, J.; Zhan, K.; et al. The MYB family transcription factor TuODORANT1 from Triticum urartu and the homolog TaODORANT1 from Triticum aestivum inhibit seed storage protein synthesis in wheat. Plant Biotechnol. J. 2021, 19, 1863–1877. [Google Scholar] [CrossRef]
  73. Shewry, P.R.; Halford, N.G.; Tatham, A.S. High molecular weight subunits of wheat glutenin. J. Cereal Sci. 1992, 15, 105–120. [Google Scholar] [CrossRef]
  74. Lawrance, G.; Moss, H.; Shepherd, K.; Wrigley, C. Dough quality of biotypes of eleven Australian wheat cultivars that differ in high-molecular-weight glutenin subunit composition. J. Cereal Sci. 1987, 6, 99–101. [Google Scholar]
  75. Schwarz, D.S.; Blower, M.D. The endoplasmic reticulum: Structure, function and response to cellular signaling. Cell. Mol. Life Sci. 2016, 73, 79–94. [Google Scholar] [CrossRef] [Green Version]
  76. Zhang, R.; Tucker, M.R.; Burton, R.A.; Shirley, N.J.; Little, A.; Morris, J.; Milne, L.; Houston, K.; Hedley, P.E.; Waugh, R.; et al. The dynamics of transcript abundance during cellularisation of developing barley endosperm. Plant Physiol. 2016, 170, 1549–1565. [Google Scholar] [CrossRef] [PubMed]
  77. Tabe, L.; Hagan, N.; Higgins, T.J.V. Plasticity of seed protein composition in response to nitrogen and sulfur availability. Curr. Opin. Plant Biol. 2002, 5, 212–217. [Google Scholar] [CrossRef] [PubMed]
  78. Islam, N.; Upadhyaya, N.M.; Campbell, P.M.; Akhurst, R.; Hagan, N.; Higgins, T.J.V. Decreased accumulation of glutelin types in rice grains constitutively expressing a sunflower seed albumin gene. Phytochemistry 2005, 66, 2534–2539. [Google Scholar] [CrossRef]
  79. Zhang, S.; Ghatak, A.; Bazargani, M.M.; Bajaj, P.; Varshney, R.K.; Chaturvedi, P.; Jiang, D.; Weckwerth, W. Spatial distribution of proteins and metabolites in developing wheat grain and their differential regulatory response during the grain filling process. Plant J. 2021, 107, 667–668. [Google Scholar] [CrossRef] [PubMed]
  80. Mumolo, M.G.; Rettura, F.; Melissari, S.; Costa, F.; Ricchiuti, A.; Ceccarelli, L.; de Bortoli, N.; Marchi, S.; Bellini, M. Is Gluten the Only Culprit for Non-Celiac Gluten/Wheat Sensitivity? Nutrients 2020, 12, 3785. [Google Scholar] [CrossRef]
  81. Zhen, S.; Han, C.; Ma, C.; Gu, A.; Zhang, M.; Shen, X.; Li, X.; Yan, Y. Deletion of the low-molecular-weight glutenin subunit allele Glu-A3a of wheat (Triticum aestivum L.) significantly reduces dough strength and breadmaking quality. BMC Plant Biol. 2014, 14, 367. [Google Scholar] [CrossRef] [Green Version]
  82. Cao, H.; Duncan, O.; Islam, S.; Zhang, J.; Ma, W.; Millar, A.H. Increased Wheat Protein Content via Introgression of an HMW Glutenin Selectively Reshapes the Grain Proteome. Mol. Cell Proteom. 2021, 20, 100097. [Google Scholar] [CrossRef]
  83. Li, P.; Chen, Y.H.; Lu, J.; Zhang, C.Q.; Liu, Q.Q.; Li, Q.F. Genes and Their Molecular Functions Determining Seed Structure, Components, and Quality of Rice. Rice 2022, 15, 18. [Google Scholar] [CrossRef]
  84. Gutkowska, M.; Kaus-Drobek, M.; Hoffman-Sommer, M.; Małgorzata Pamuła, M.; Daria Leja, A.; Perycz, M.; Lichocka, M.; Witek, A.; Wojtas, M.; Dadlez, M.; et al. Impact of C-terminal truncations in the Arabidopsis Rab escort protein (REP) on REP-Rab interaction and plant fertility. Plant J. 2021, 108, 1400–1421. [Google Scholar] [CrossRef]
  85. Pan, T.; Wang, Y.; Jing, R.; Wang, Y.; Wei, Z.; Zhang, B.; Lei, C.; Qi, Y.; Wang, F.; Bao, X.; et al. Post-Golgi trafficking of rice storage proteins requires the small GTPase Rab7 activation complex MON1-CCZ1. Plant Physiol. 2021, 187, 2174–2191. [Google Scholar] [CrossRef]
  86. Alhabbar, Z.; Yang, R.; Juhasz, A.; Xin, H.; She, M.; Anwar, M.; Sultana, N.; Diepeveen, D.; Ma, W.; Islam, S. NAM gene allelic composition and its relation to grain-filling duration and nitrogen utilisation efficiency of Australian wheat. PLoS One 2018, 13, e0205448. [Google Scholar] [CrossRef] [PubMed]
  87. El-Esawi, M.A.; Alayafi, A.A. Overexpression of Rice Rab7 Gene Improves Drought and Heat Tolerance and Increases Grain Yield in Rice (Oryza sativa L.). Genes 2019, 10, 56. [Google Scholar] [CrossRef] [PubMed] [Green Version]
  88. Buttar, Z.; Wu, S.; Arnao, M.; Wang, C.; Ullah, I.; Wang, C. Melatonin Suppressed the Heat Stress-Induced Damage in Wheat Seedlings by Modulating the Antioxidant Machinery. Plants 2020, 9, 809. [Google Scholar] [CrossRef] [PubMed]
  89. Wang, C.; Zhang, L.; Li, Y.; Buttar, Z.A.; Wang, N.; Xie, Y.; Wang, C. Single Nucleotide Mutagenesis of the TaCHLI Gene Suppressed Chlorophyll and Fatty Acid Biosynthesis in Common Wheat Seedlings. Front. Plant Sci. 2020, 11, 97. [Google Scholar] [CrossRef] [PubMed] [Green Version]
  90. Wen, D.; Xu, H.; Xie, L.; He, M.; Hou, H.; Zhang, C. A loose endosperm structure of wheat seed produced under low nitrogen level promotes early germination by accelerating water uptake. Sci. Rep. 2017, 7, 3116. [Google Scholar] [CrossRef] [PubMed] [Green Version]
  91. Guan, Y.; Li, G.; Chu, Z.; Ru, Z.; Jiang, X.; Wen, Z.; Zhang, G.; Wang, Y.; Zhang, Y.; Wei, W. Transcriptome analysis reveals important candidate genes involved in grain-size formation at the stage of grain enlargement in common wheat cultivar “Bainong 4199”. PLoS ONE 2019, 14, e0214149. [Google Scholar] [CrossRef]
  92. Chen, Q.; Xu, L.; Guan, Y.; Buttar, Z.A.; Li, G.; Zhang, G.; Li, C.; Huang, J.; Liu, M.; Wei, W. Small RNA and degradome analysis uncovering the extensive effects of miRNAs and Targets in Early developing grains of common wheat. PLoS ONE 2020. preprint. [Google Scholar] [CrossRef]
  93. Trapnell, C.; Pachter, L.; Salzberg, S.L. TopHat; Discovering splice junctions with RNA-seq. Bioinformatics 2009, 25, 1105–1111. [Google Scholar] [CrossRef]
  94. Li, B.; Dewey, C.N. RSEM: Accurate transcript quantification from RNA-Seq data with or without a reference genome. BMC Bioinform. 2011, 12, 387. [Google Scholar] [CrossRef] [Green Version]
  95. Robinson, M.D.; McCarthy, D.J.; Smyth, G.K. EdgeR: A Bioconductor package for differential expression analysis of digital gene expression data. Bioinformatics 2010, 26, 139–140. [Google Scholar] [CrossRef] [Green Version]
  96. Xie, C.; Mao, X.; Huang, J.; Ding, Y.; Wu, J.; Dong, S.; Kong, L.; Gao, G.; Li, C.-Y.; Wei, L. KOBAS 2.0: A web server for annotation and identification of enriched pathways and diseases. Nucleic Acids Res. 2011, 39, W316–W322. [Google Scholar] [CrossRef] [PubMed]
  97. Shen, S.; Park, J.W.; Huang, J.; Dittmar, K.A.; Lu, Z.; Zhou, Q.; Carstens, R.P.; Xing, Y. MATS: A Bayesian framework for flexible detection of differential alternative splicing from RNA-Seq data. Nucleic Acids Res. 2012, 40, e61. [Google Scholar] [CrossRef] [PubMed]
  98. Muntz, K. Deposition of storage proteins. Plant Mol. Biol. 1998, 38, 77–99. [Google Scholar] [CrossRef] [PubMed]
Figure 1. Pie charts showing the percentage of different repeated elements identified in wheat genome of collected samples. The most abundant components identified were CDS, intergenic, introns, and 3’UTR: 3.06% followed by 5’UTR.
Ijms 23 14851 g001
Figure 2. The length distribution of reads of transcripts length. The length and distribution of reads aligning to the reference genome Triticum_aestivum, version: iwgsc_refseqv1.0 source, from selected 0–200 (brown), 201–400 (Cyan), 401–600 (Aqua), 601–800 (Cadet blue), 801–1000 (Light salmon), 1001–1200 (Light steel blue), 1201–1400 (Aquamarine), etc.
Ijms 23 14851 g002
Figure 3. Venn diagram showing the number of common and unique DEGs among four colored group samples. Dark gray group shows the highest number of DEGs and shares more DEGs with the other three groups in comparison to red, blue, and green groups.
Ijms 23 14851 g003
Figure 4. Correlation heat map for all 8 samples. The heat map plots the correlation coefficient score between any two samples. Samples #10, #14, #20, and #30 were clear outliers relative to the other samples.
Ijms 23 14851 g004
Figure 5. KEGG pathway enrichment analysis for 127 candidate genes. The x-axis shows the gene ratio; the y-axis corresponds to KEGG pathways. The dot color represents the corrected P value of <0.05, and the dot size represents the number of genes enriched in the reference pathway. The protein processing in endoplasmic reticulum, starch and sucrose metabolism, amino sugar and nucleotide sugar metabolism, glycolysis/gluconeogenesis, necroptosis, and pyruvate metabolism was significantly enriched, detail given in Supplementary File S1, sheet 1.
Ijms 23 14851 g005
Figure 6. Clusters of KEGG function classification of DEGs based on significantly enriched KEG terms are indicated by dot for corrected p value of <0.05. The dot size represents the number of genes enriched in the reference pathway. There were a total of 108, 115, 99, and 104 DEGs for 715, 697, 366, and 1535 pathways in (T10 vs. CK10, T14 vs. CK14, T20 vs. CK20, and T30 vs. CK30), respectively. Detail given in Supplementary File S2.
Ijms 23 14851 g006
Figure 7. Histogram of Gene Ontology (GO) classifications of DEGs between T10 vs. CK10, T14 vs. CK14, T14 vs. CK14, T20 vs. CK20, and T30 vs. CK30. A total of 373, 378, 203, and 444 DEGs were assigned to three main GO functional categories and then divided into 20 sub-categories.
Ijms 23 14851 g007
Figure 8. Clusters of GO function classification of DEGs. A total of 1920 DEGs were mapped to 107 KEGG pathways. There were 373, 379, 444, and 203 DEGs for (T10 vs. CK10, T14 vs. CK14, T20 vs. CK20, and T30 vs. CK30), respectively.
Ijms 23 14851 g008
Figure 9. KEGG pathway analysis identified the ER-associated protein trafficking pathway (ko04141) for DEGs between 10 DPA, 14 DPA, 20 DPA, and 30 DPA. Red, yellow, and white indicate genes expression increase, decrease, and mixed change at all selected 10, 14, 20, and 30 DPA, respectively.
Ijms 23 14851 g009
Figure 10. Volcano plots of DEGs in green versus red sectors. Data for all genes are plotted as log10 fold change (FC) versus the –log10 of raw p-value (pval). (A) Group T10 vs. CK10, (B) Group T14 vs. CK14, (C) Group T20 vs. CK20, and (D) Group T30 vs. CK30. Points outside the gray area indicate >100-fold-differences in expression. Green points indicate down-regulated genes and red points indicate up-regulated genes in each contrast, detail given in Supplementary file S1, sheet 3 (Table S1).
Ijms 23 14851 g010
Figure 11. Hierarchical clustering analysis of all DEGs of all collected samples T10, T14, T20, T30, CK10, Ck14, Ck20, and CK30. A total of 696 genes were identified at p < 0.05 (ANOVA and Tukey HSD test); means ± SD. The color key represents the FPKM (Fragments per Kilobase of exon per Million fragments mapped)-normalized log2 transformed counts. Blue and Brown represent high and low expression, respectively. Each row represents a gene, with further detail given in Supplementary File S5.
Ijms 23 14851 g011
Figure 12. QRT-PCR analysis of 9 randomly selected mRNA expressions from transcriptome database, (T) Shaanong 33 (Triticum aestivum L.) and CK (Triticum aestivum L.), at 10, 14, 20, and 30 DPA. Data are means of three biological replicates (n = 3); significant differences at p < 0.05 (ANOVA and Tukey HSD test); means ± SD.
Ijms 23 14851 g012
Figure 13. Potential mechanism of protein synthesis and trafficking from ER to Golgi body and ultimate linkage with processing quality characteristics in wheat grain.
Ijms 23 14851 g013
Table 1. Analysis of variance for quality parameters of the used material in this study.
VarietyFlour RateSettlement IndexWater AbsorptionFormation TimeMax. Tensile Resistance
Shannong 3373.3%66 mL58.715.61038
Sister line (C.K)71%27.6 mL633.1358
Table 2. Summary of sequencing outcomes from grain enlargement stage.
SampleRaw ReadsRaw BasesClean ReadsClean BasesError Rate (%)GC%Q20 (%) aQ30 (%) bTotal Mapped
T1052,242,0267,888,545,92651,306,0987,650,889,1930.024854.6498.0394.445,136,960
(87.98%)
T1458,357,1868,811,935,08657,143,4908,473,951,4420.025453.1497.7593.8945,153,078
(79.02%)
T2049,861,9087,529,148,10848,289,0347,121,352,2010.026852.9197.1792.637,102,266
(76.83%)
T3049,553,1727,482,528,97248,697,2527,236,265,3130.02554.3597.9694.2537,230,131
(76.45%)
CK1052,674,7307,953,884,23051,814,5267,742,996,8210.024655.0298.1194.5946,754,208
(90.23%)
CK1452,215,2307,884,499,73051,232,4927,611,938,7550.025353.7597.89443,115,178
(84.16%)
CK2048,982,0747,396,293,17448,113,3927,143,015,2180.025252.6497.894.0334,274,380
(71.24%)
Ck3051,353,9487,754,446,14850,053,3387,410,668,7720.025553.8597.793.835,435,811
(70.8%)
a Q20 indicates a quality score of 20, a 1% chance of error, and 99% confidence. b Q30 indicates a quality score of 30, a 0.1% chance of error, and 99.9% confidence.
Table 3. Summary of DEGs related to ER protein quality control pathways based on the KEGG database of developing grain at all selected stages.
Pathway TypePathway IDDEGsUp/Down
(Numbers of Genes)
Gene ID
Cell wall synthesis (ER or Golgi cellular components)map04714Up4TraesCS1A02G133900, TraesCS1A02G116200
TraesCS1A02G124600, TraesCS1A02G137216
structural constituent of ribosome (ER or ER cellular components)map03010Up6TraesCS1A02G092900, TraesCS1A02G105400, TraesCS1A02G137294, TraesCS1A02G137403, TraesCS1A02G137409, TraesCS1A02G137505
Protein folding (During ER protein processing)map03060Up8TraesCS1A02G112400, TraesCS1A02G138121, TraesCS1A02G133100, TraesCS1A02G133700, TraesCS1A02G124400, TraesCS1A02G145979, TraesCS1A02G099300, TraesCS1A02G137277, TraesCS1A02G137424, TraesCS1A02G137449
ATPase activity, GTPase activity
(ER to Golgi trafficking)
map03060Up18TraesCS1A02G126900, TraesCS1A02G131500, TraesCS1A02G144411, TraesCS1A02G144222, TraesCS1A02G143755, TraesCS1A02G143642, TraesCS1A02G143622, TraesCS1A02G143335, TraesCS1A02G143297, TraesCS1A02G142230, TraesCS1A02G137242, TraesCS1A02G137259, TraesCS1A02G137367, TraesCS1A02G137536, TraesCS1A02G137607, TraesCS1A02G137612
TraesCS1A02G137736, TraesCS1A02G137782
vascular transport (ER to Golgi vesicle-mediated transport)map03060Up8TraesCS1A02G144928, TraesCS1A02G143916, TraesCS1A02G106000, TraesCS1A02G133100, TraesCS1A02G137356, TraesCS1A02G137364, TraesCS1A02G137405, TraesCS1A02G151679
Protein quality control Up4TraesCS1A02G137200, TraesCS1A02G150621, TraesCS1A02G151217, TraesCS1A02G108100
Table 4. Detail of the wheat varieties used in this study.
VarietyParentageYear (Releasing Committee)Developed byArea of AdoptionSource
Shaannong 33Xinmai 18sp-28-14/Shannong 981sp-12-162011-Shaanxi Provincial crop variety appraisal committeeWang Chengshe, Liu Luxiang, Zou Shufang, Xu xitang Chen, Guangdou, Xie YangzhouShaanxi, and Henan Province ChinaNWAFU
Publisher’s Note: MDPI stays neutral with regard to jurisdictional claims in published maps and institutional affiliations.

