
Transcriptome Profiling in the Hippocampi of Mice with Experimental Autoimmune Encephalomyelitis

 ,
, 
 and
and 
Abstract
1. Introduction
2. Results
2.1. Clinical Score following Immunization
2.2. Differentially Expressed Genes (DEGs) in the Hippocampi of Mice with EAE
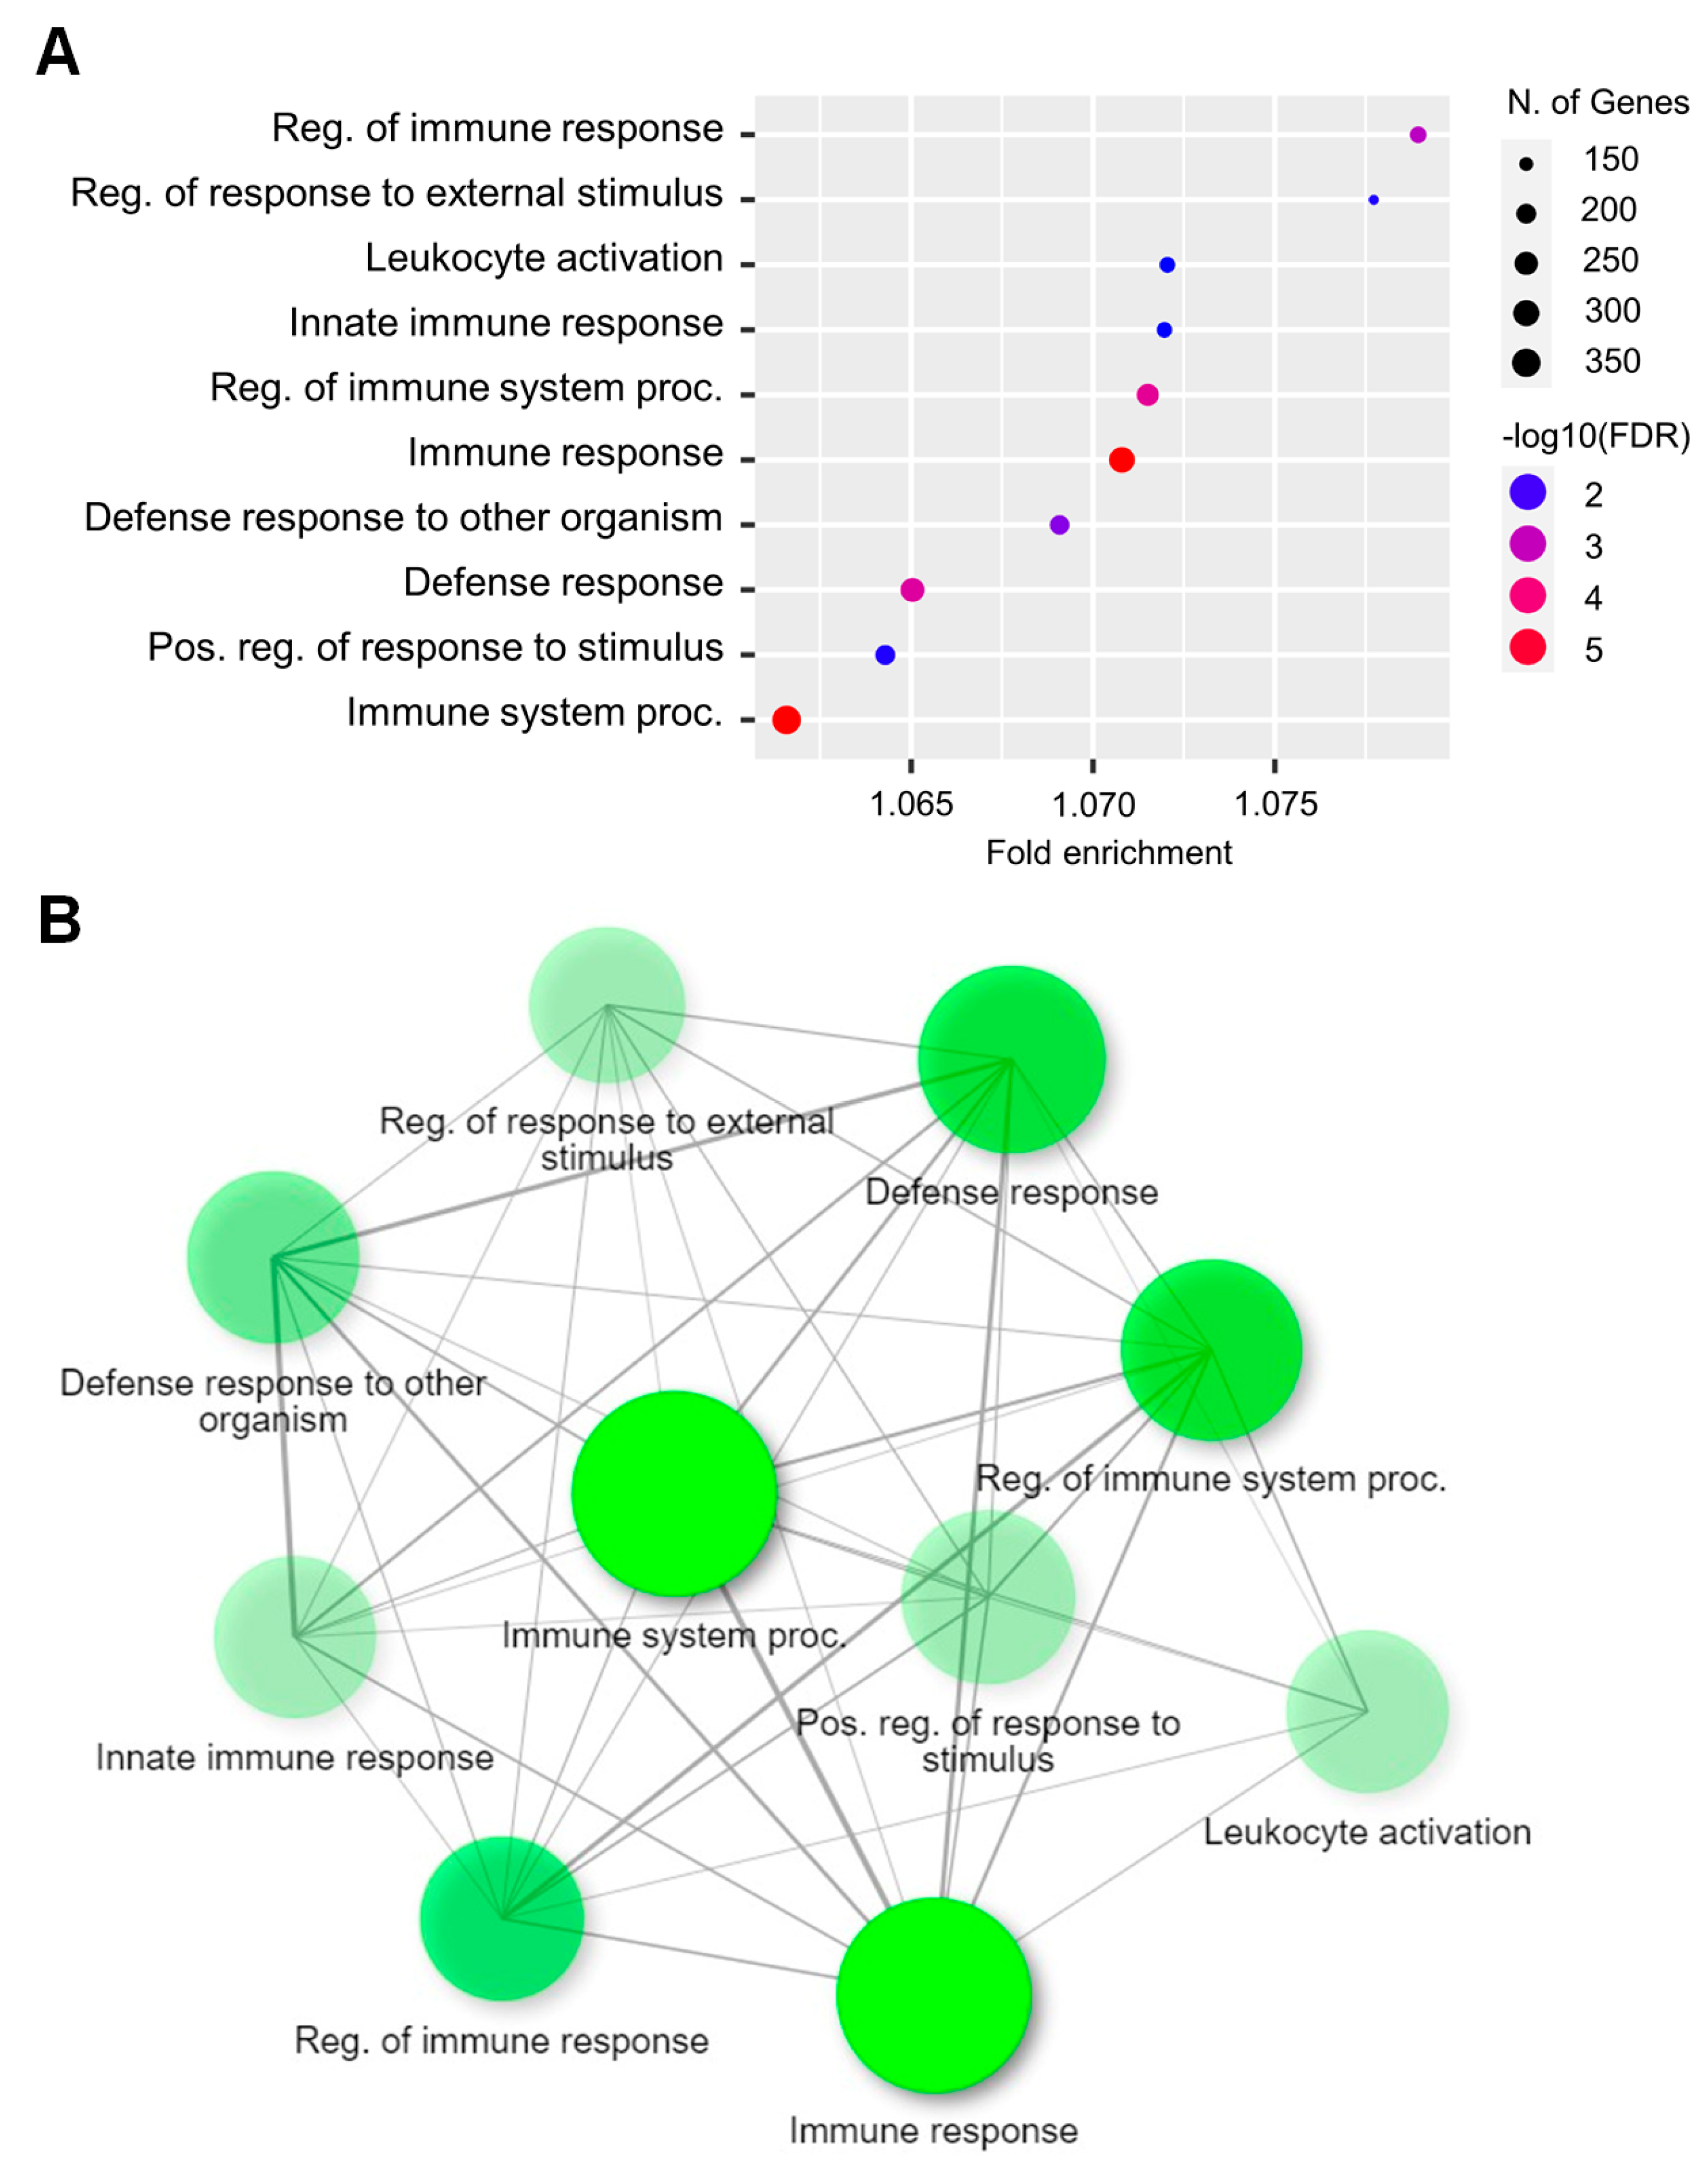
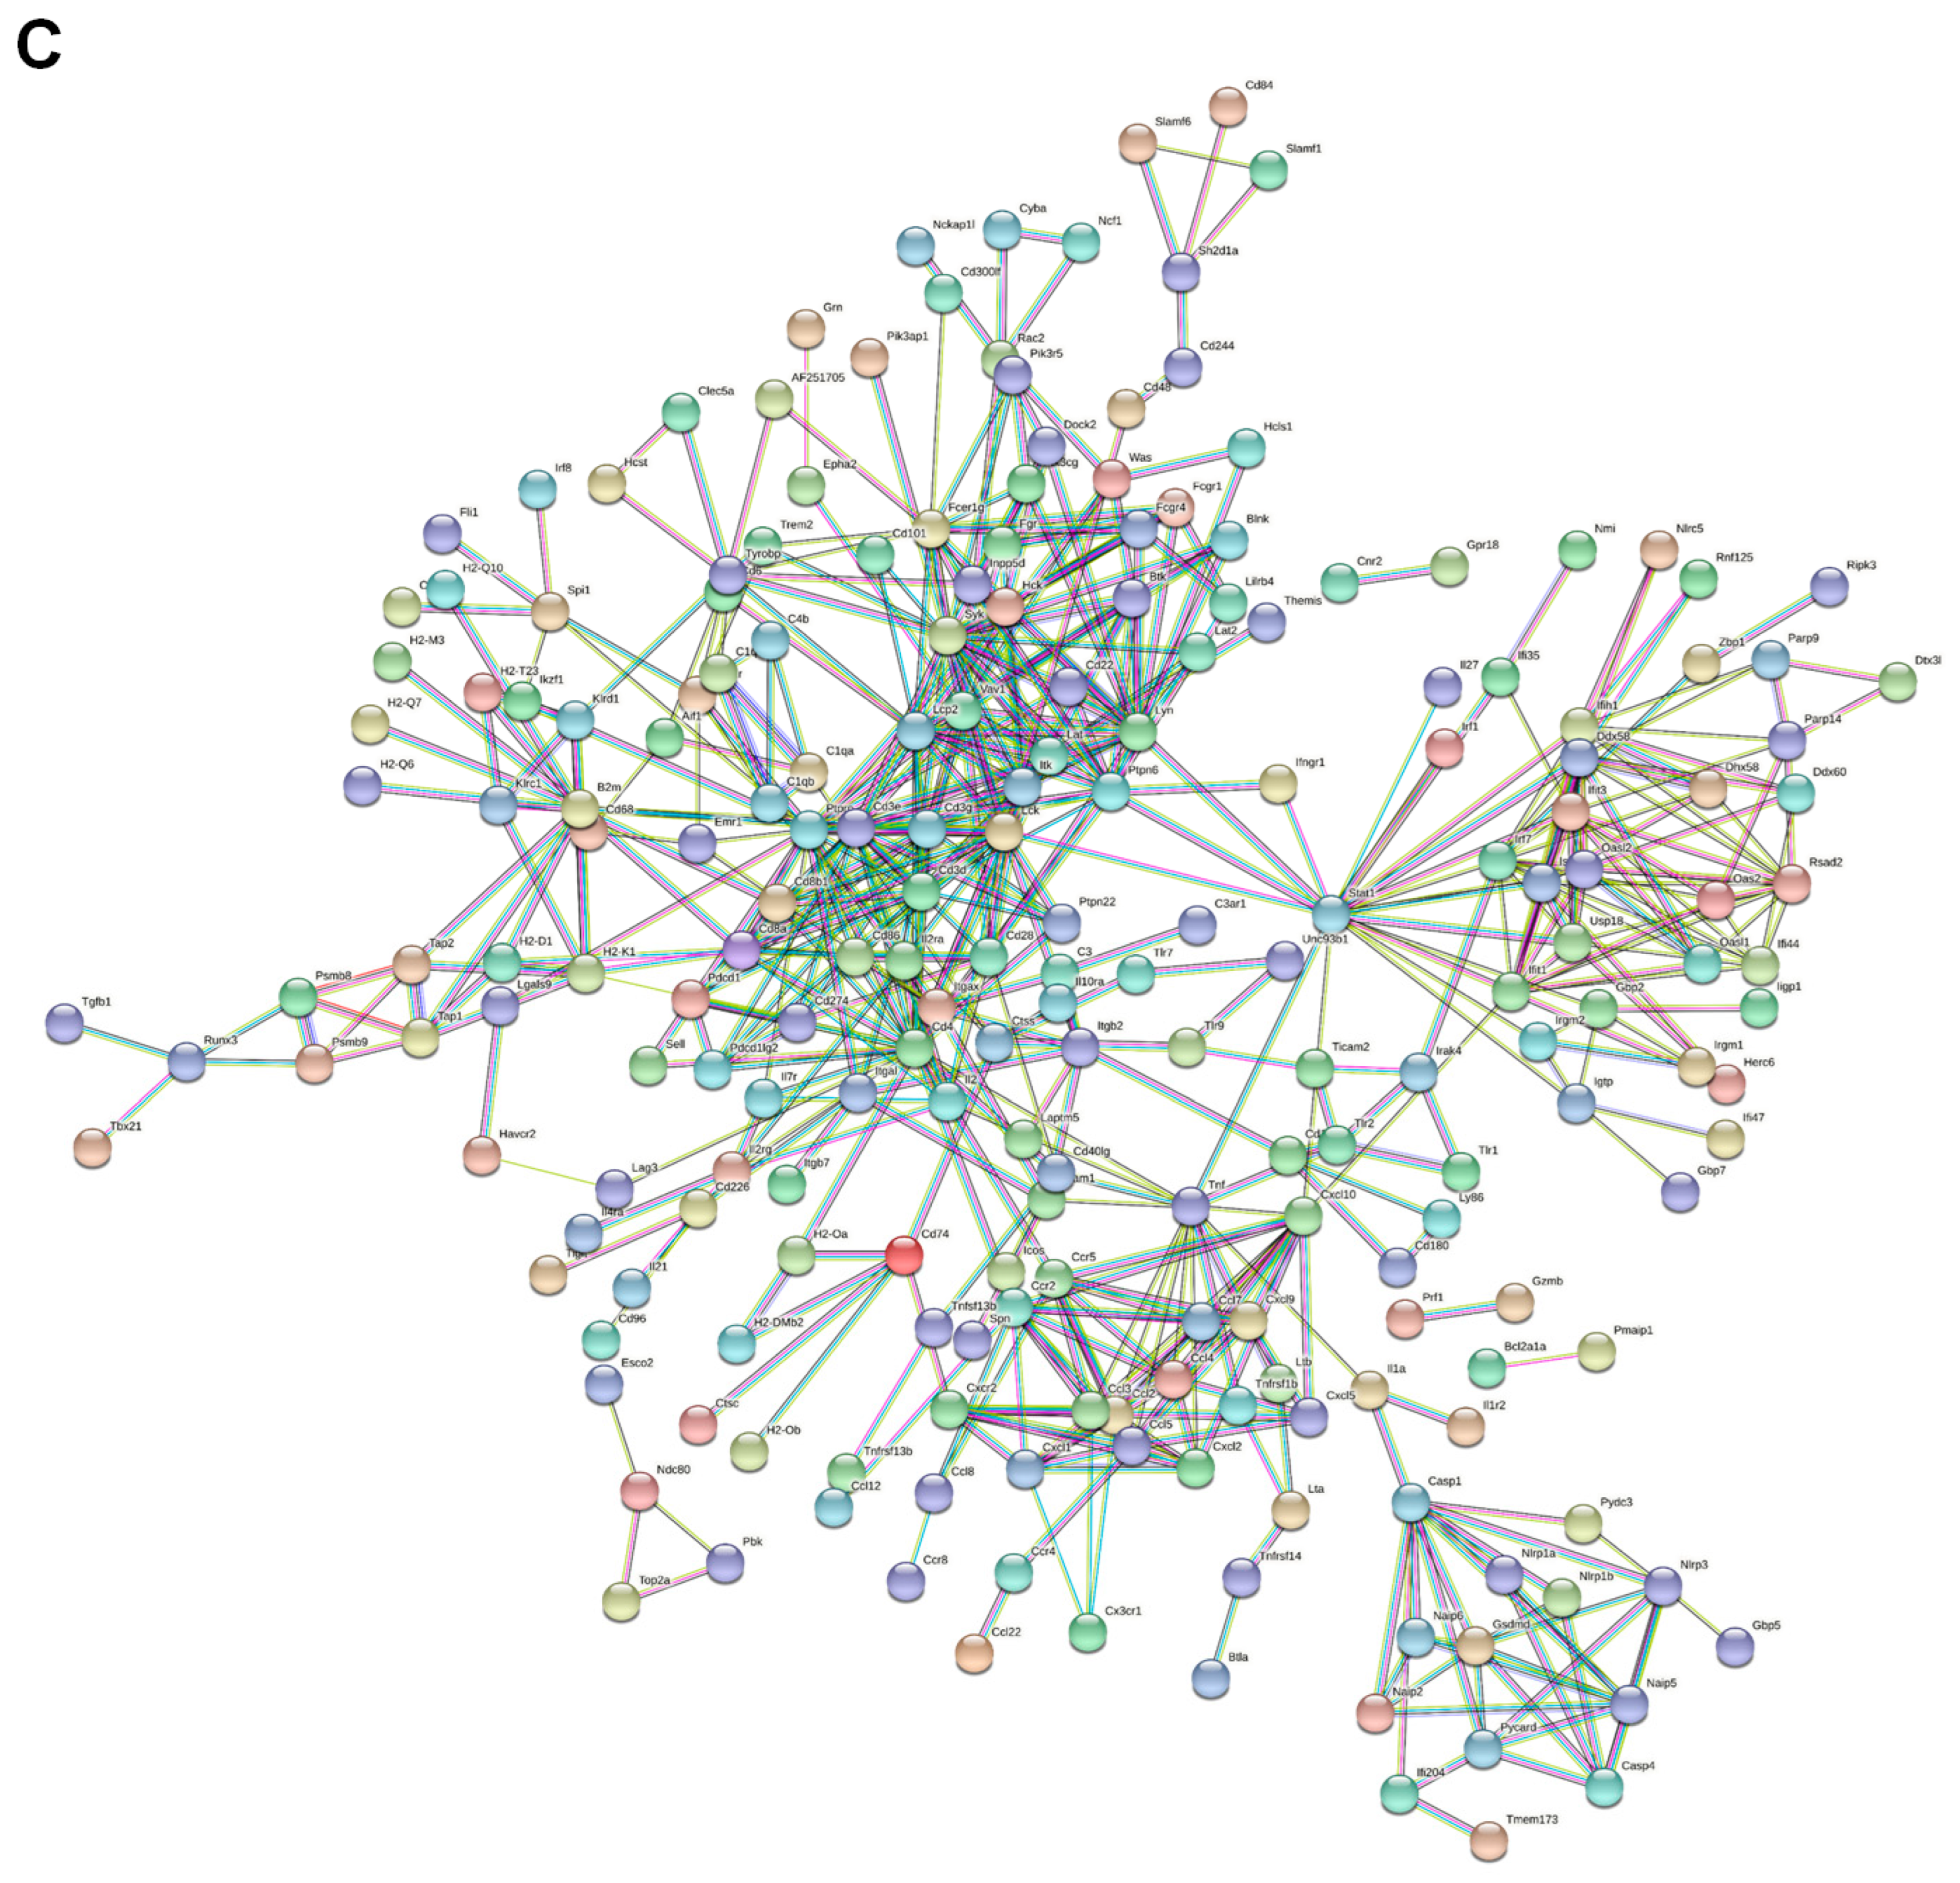
2.3. Functional Analysis of DEGs
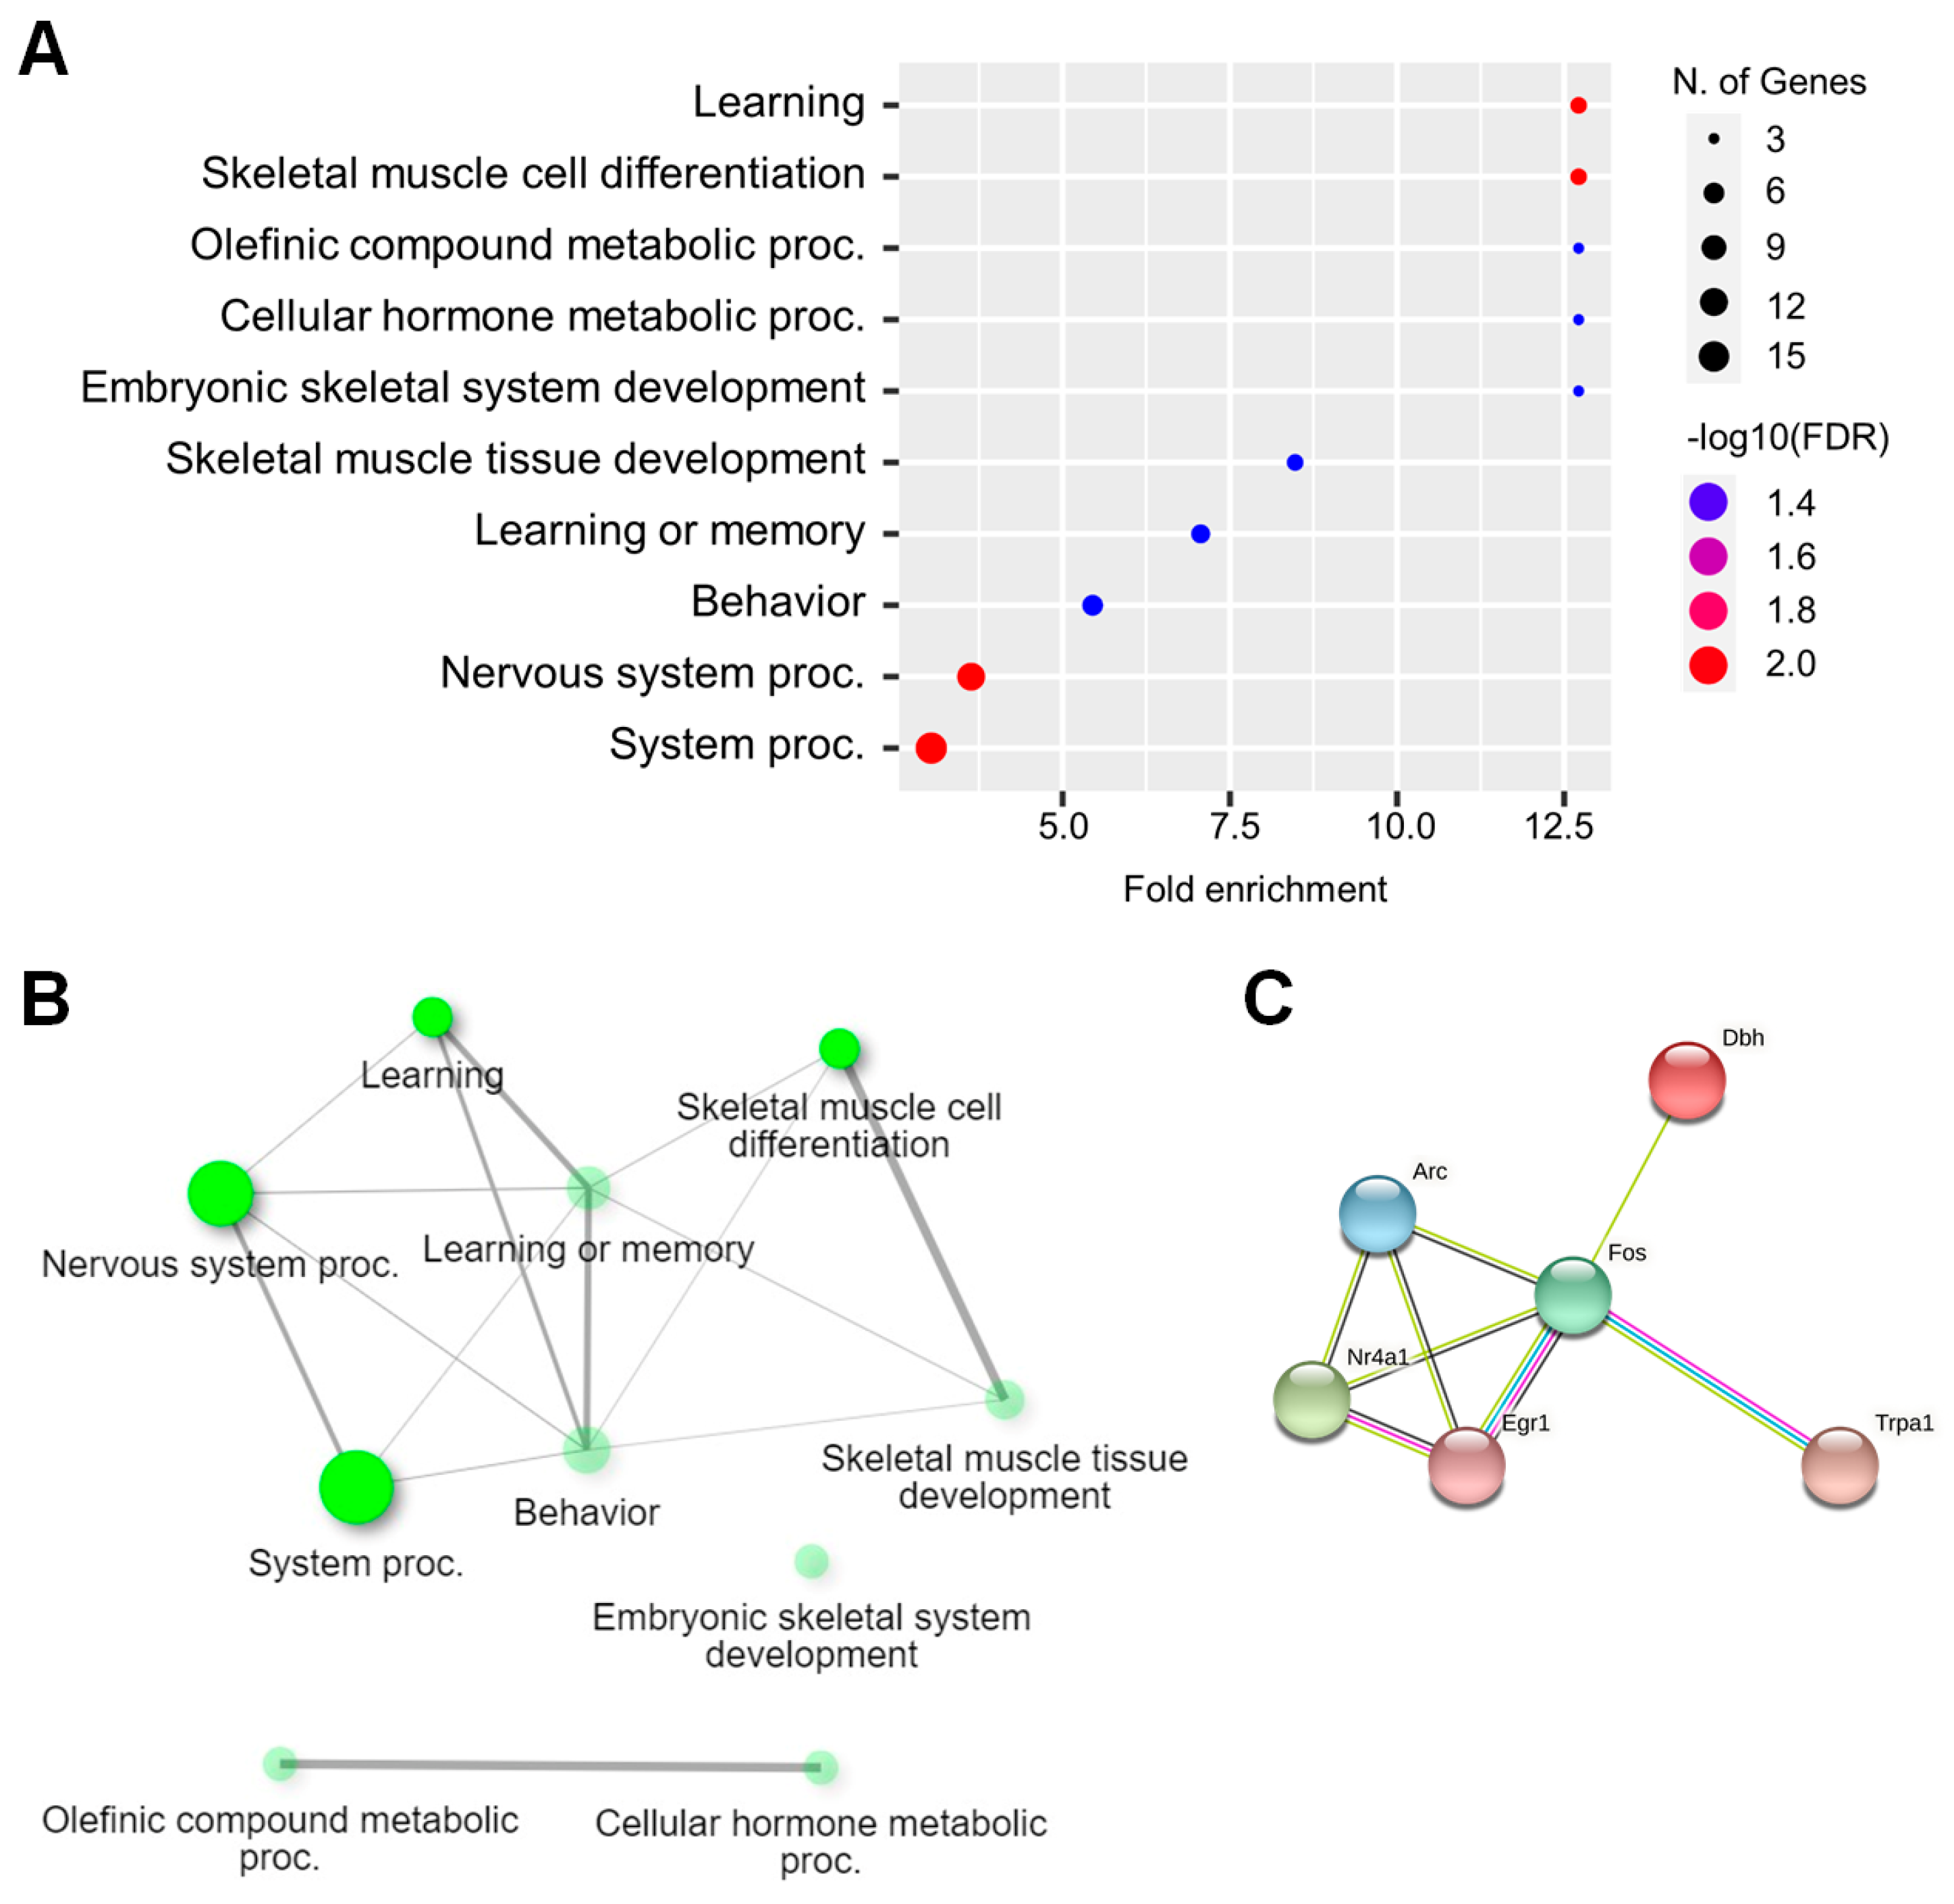
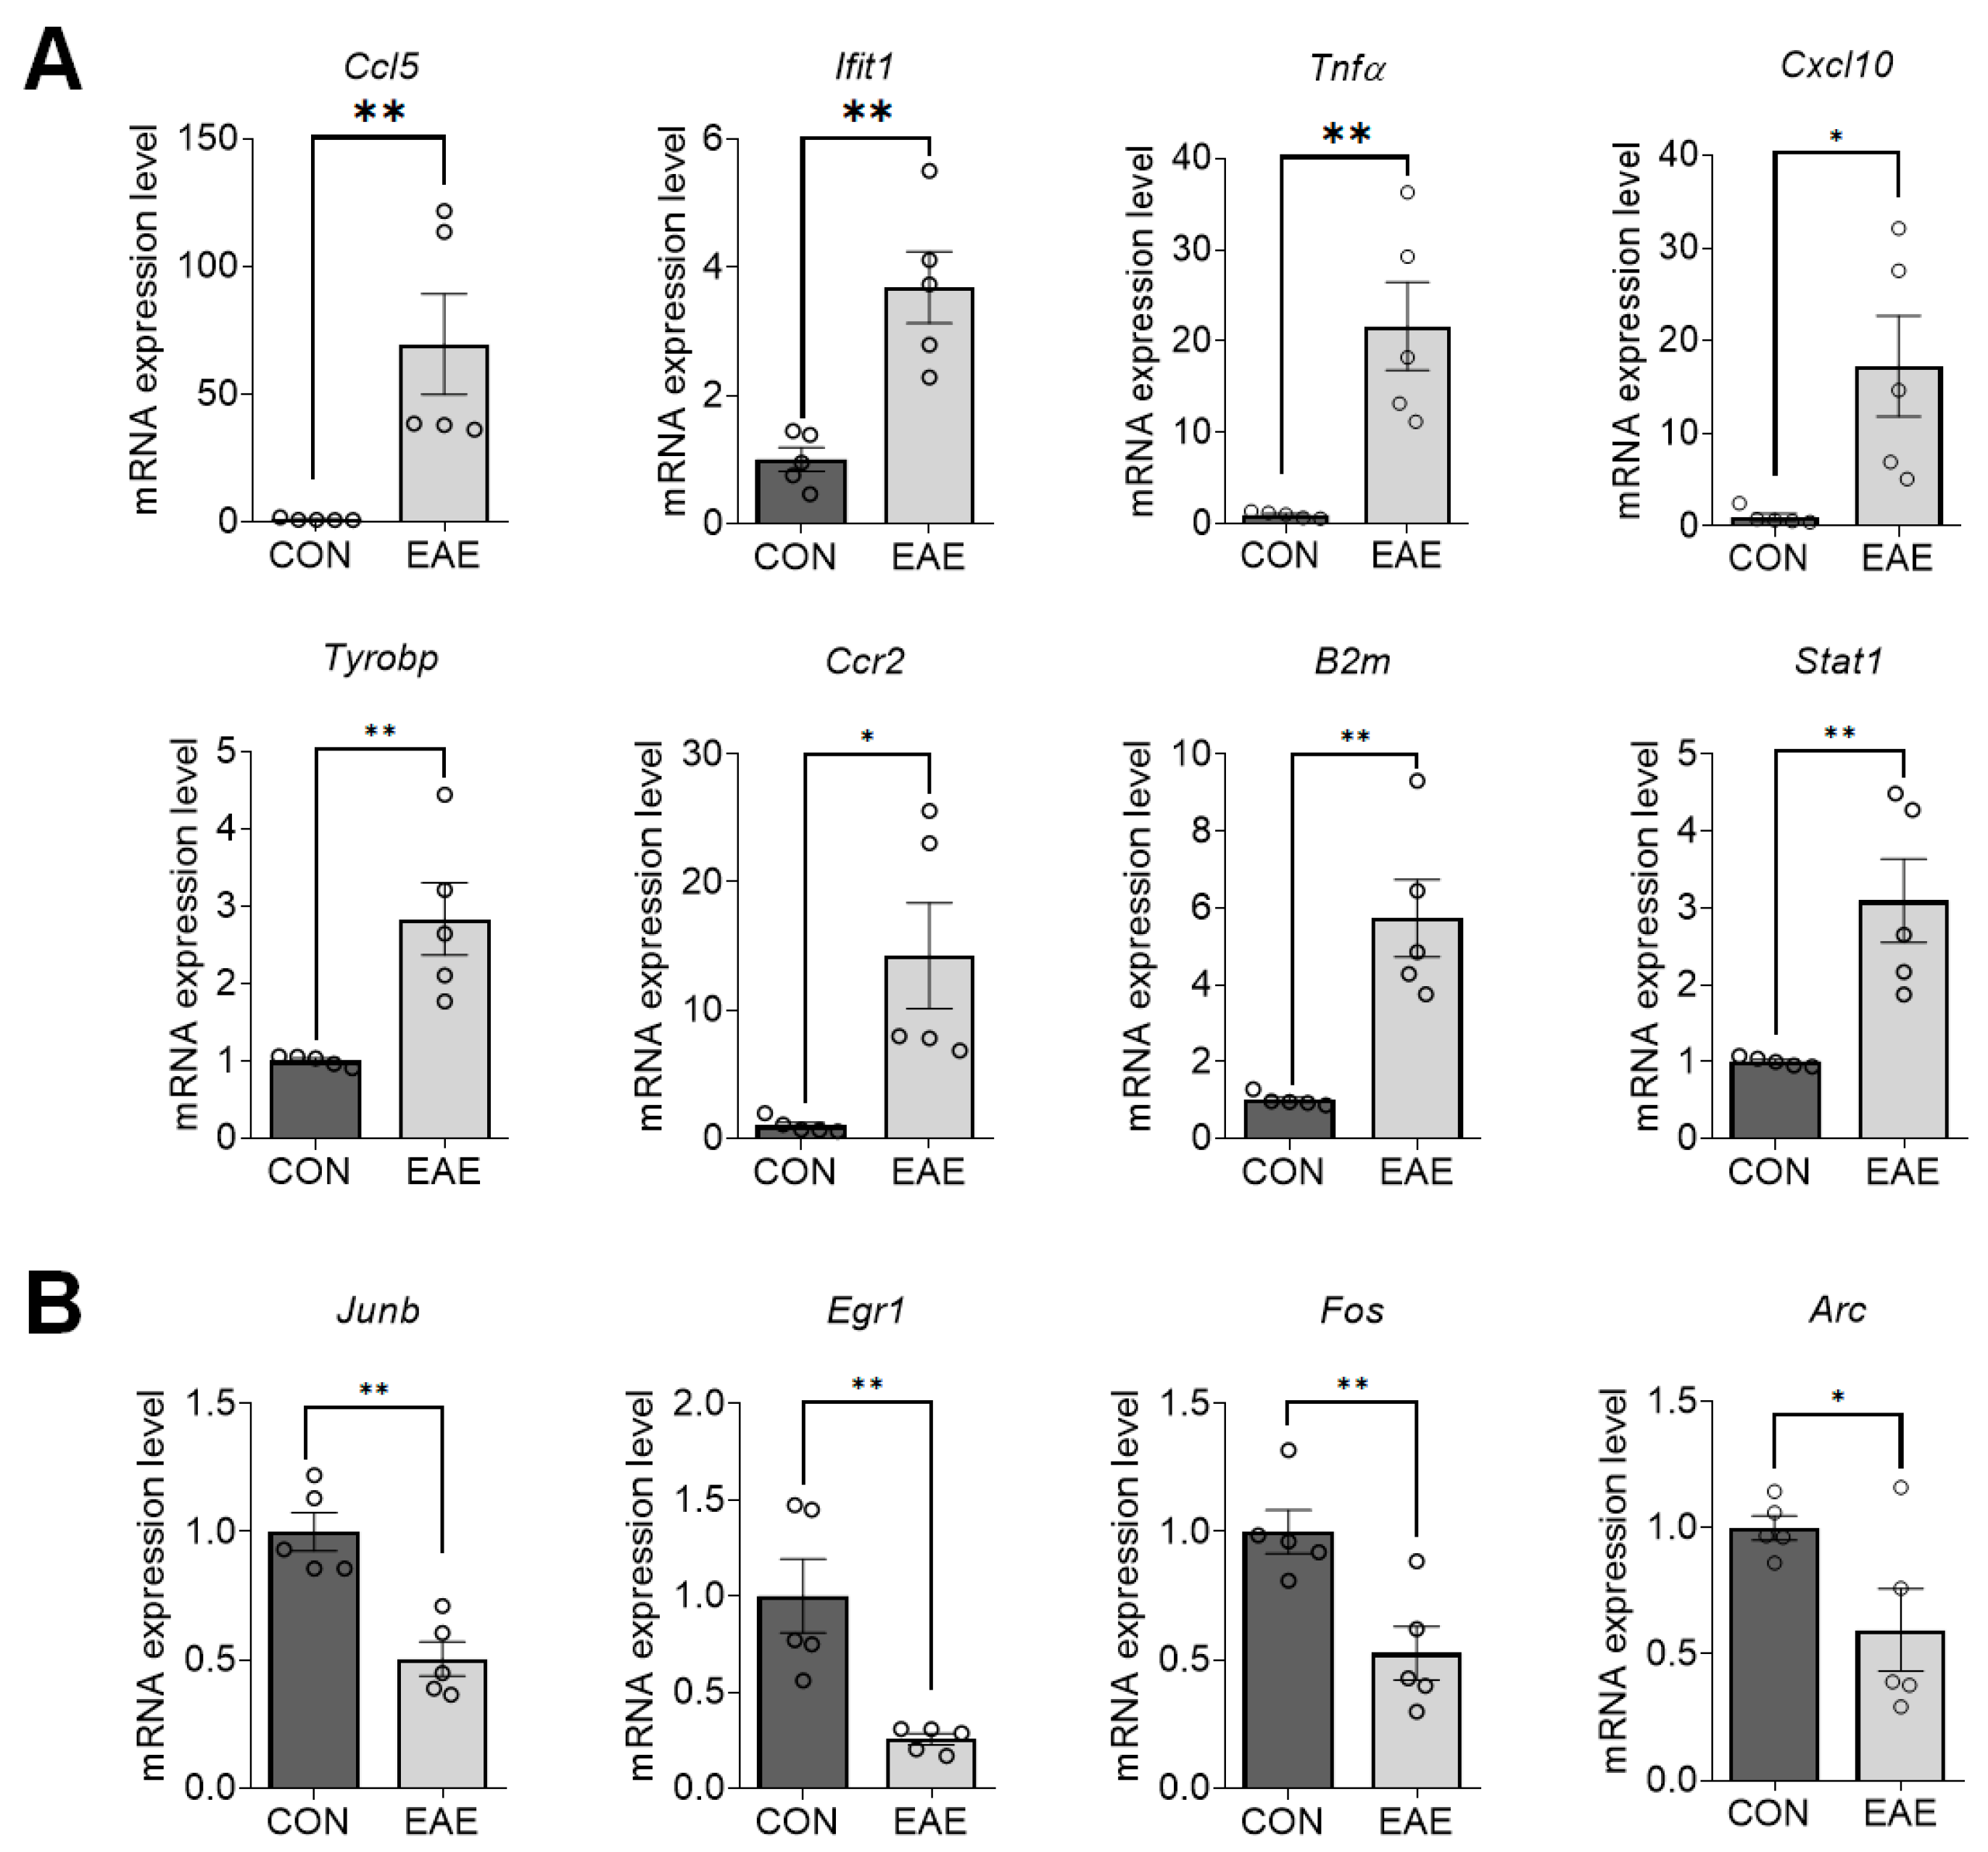
2.4. Validation of DEGs in EAE-Affected Hippocampi
2.5. Additional Assessment of Functional Differences Using Gene Set Enrichment Analysis (GSEA)
3. Discussion
4. Materials and Methods
4.1. Animals and EAE Induction
4.2. RNA Isolation and RNA-Seq
4.3. DEGs, Enrichment Analysis, and Protein–Protein Interaction Analysis
4.4. RNA Extraction, cDNA Synthesis, and RT-qPCR
4.5. Statistical Analysis
5. Conclusions
Supplementary Materials
Author Contributions
Funding
Institutional Review Board Statement
Informed Consent Statement
Data Availability Statement
Conflicts of Interest
References
- Ransohoff, R.M.; Hafler, D.A.; Lucchinetti, C.F. Multiple sclerosis—A quiet revolution. Nat. Rev. Neurol. 2015, 11, 134–142. [Google Scholar] [CrossRef] [PubMed]
- Geurts, J.J.; Bo, L.; Roosendaal, S.D.; Hazes, T.; Daniels, R.; Barkhof, F.; Witter, M.P.; Huitinga, I.; van der Valk, P. Extensive hippocampal demyelination in multiple sclerosis. J. Neuropathol. Exp. Neurol. 2007, 66, 819–827. [Google Scholar] [CrossRef] [PubMed]
- Colasanti, A.; Guo, Q.; Giannetti, P.; Wall, M.B.; Newbould, R.D.; Bishop, C.; Onega, M.; Nicholas, R.; Ciccarelli, O.; Muraro, P.A.; et al. Hippocampal Neuroinflammation, Functional Connectivity, and Depressive Symptoms in Multiple Sclerosis. Biol. Psychiatry. 2016, 80, 62–72. [Google Scholar] [CrossRef] [PubMed]
- Carassiti, D.; Altmann, D.R.; Petrova, N.; Pakkenberg, B.; Scaravilli, F.; Schmierer, K. Neuronal loss, demyelination and volume change in the multiple sclerosis neocortex. Neuropathol. Appl. Neurobiol. 2018, 44, 377–390. [Google Scholar] [CrossRef]
- Dutta, R.; Chang, A.; Doud, M.K.; Kidd, G.J.; Ribaudo, M.V.; Young, E.A.; Fox, R.J.; Staugaitis, S.M.; Trapp, B.D. Demyelination causes synaptic alterations in hippocampi from multiple sclerosis patients. Ann. Neurol. 2011, 69, 445–454. [Google Scholar] [CrossRef]
- Chiaravalloti, N.D.; DeLuca, J. Cognitive impairment in multiple sclerosis. Lancet Neurol. 2008, 7, 1139–1151. [Google Scholar] [CrossRef]
- Gentile, A.; Mori, F.; Bernardini, S.; Centonze, D. Role of amyloid-beta CSF levels in cognitive deficit in MS. Clin. Chim. Acta 2015, 449, 23–30. [Google Scholar] [CrossRef]
- Michailidou, I.; Willems, J.G.; Kooi, E.J.; van Eden, C.; Gold, S.M.; Geurts, J.J.; Baas, F.; Huitinga, I.; Ramaglia, V. Complement C 1q-C 3–associated synaptic changes in multiple sclerosis hippocampus. Ann. Neurol. 2015, 77, 1007–1026. [Google Scholar] [CrossRef]
- Miyamoto, A.; Wake, H.; Moorhouse, A.J.; Nabekura, J. Microglia and synapse interactions: Fine tuning neural circuits and candidate molecules. Front. Cell. Neurosci. 2013, 7, 70. [Google Scholar] [CrossRef]
- Rocca, M.A.; Barkhof, F.; De Luca, J.; Frisen, J.; Geurts, J.J.G.; Hulst, H.E.; Sastre-Garriga, J.; Filippi, M.; Group, M.S. The hippocampus in multiple sclerosis. Lancet Neurol. 2018, 17, 918–926. [Google Scholar] [CrossRef]
- Barkus, C.; McHugh, S.B.; Sprengel, R.; Seeburg, P.H.; Rawlins, J.N.; Bannerman, D.M. Hippocampal NMDA receptors and anxiety: At the interface between cognition and emotion. Eur. J. Pharmacol. 2010, 626, 49–56. [Google Scholar] [CrossRef]
- Acharjee, S.; Nayani, N.; Tsutsui, M.; Hill, M.N.; Ousman, S.S.; Pittman, Q.J. Altered cognitive-emotional behavior in early experimental autoimmune encephalitis--cytokine and hormonal correlates. Brain Behav. Immun. 2013, 33, 164–172. [Google Scholar] [CrossRef]
- Dutra, R.C.; Moreira, E.L.; Alberti, T.B.; Marcon, R.; Prediger, R.D.; Calixto, J.B. Spatial reference memory deficits precede motor dysfunction in an experimental autoimmune encephalomyelitis model: The role of kallikrein-kinin system. Brain Behav. Immun. 2013, 33, 90–101. [Google Scholar] [CrossRef]
- Tu, J.L.; Zhao, C.B.; Vollmer, T.; Coons, S.; Lin, H.J.; Marsh, S.; Treiman, D.M.; Shi, J. APOE 4 polymorphism results in early cognitive deficits in an EAE model. Biochem. Biophys. Res. Commun. 2009, 384, 466–470. [Google Scholar] [CrossRef]
- Centonze, D.; Muzio, L.; Rossi, S.; Furlan, R.; Bernardi, G.; Martino, G. The link between inflammation, synaptic transmission and neurodegeneration in multiple sclerosis. Cell Death Differ. 2010, 17, 1083–1091. [Google Scholar] [CrossRef]
- Herrero-Herranz, E.; Pardo, L.A.; Gold, R.; Linker, R.A. Pattern of axonal injury in murine myelin oligodendrocyte glycoprotein induced experimental autoimmune encephalomyelitis: Implications for multiple sclerosis. Neurobiol. Dis. 2008, 30, 162–173. [Google Scholar] [CrossRef]
- Glatigny, S.; Bettelli, E. Experimental Autoimmune Encephalomyelitis (EAE) as Animal Models of Multiple Sclerosis (MS). Cold Spring Harb. Perspect. Med. 2018, 8, a028977. [Google Scholar] [CrossRef]
- Di Filippo, M.; de Iure, A.; Durante, V.; Gaetani, L.; Mancini, A.; Sarchielli, P.; Calabresi, P. Synaptic plasticity and experimental autoimmune encephalomyelitis: Implications for multiple sclerosis. Brain Res. 2015, 1621, 205–213. [Google Scholar] [CrossRef]
- Novkovic, T.; Shchyglo, O.; Gold, R.; Manahan-Vaughan, D. Hippocampal function is compromised in an animal model of multiple sclerosis. Neuroscience 2015, 309, 100–112. [Google Scholar] [CrossRef]
- Prochnow, N.; Gold, R.; Haghikia, A. An electrophysiologic approach to quantify impaired synaptic transmission and plasticity in experimental autoimmune encephalomyelitis. J. Neuroimmunol. 2013, 264, 48–53. [Google Scholar] [CrossRef]
- Demosthenes, A.; Sion, B.; Giraudet, F.; Moisset, X.; Daulhac, L.; Eschalier, A.; Begou, M. In-Depth Characterization of Somatic and Orofacial Sensitive Dysfunctions and Interfering-Symptoms in a Relapsing-Remitting Experimental Autoimmune Encephalomyelitis Mouse Model. Front. Neurol. 2021, 12, 789432. [Google Scholar] [CrossRef] [PubMed]
- Luhder, F.; Gold, R.; Flugel, A.; Linker, R.A. Brain-derived neurotrophic factor in neuroimmunology: Lessons learned from multiple sclerosis patients and experimental autoimmune encephalomyelitis models. Arch. Immunol. Ther. Exp. 2013, 61, 95–105. [Google Scholar] [CrossRef] [PubMed]
- Ge, S.X.; Jung, D.; Yao, R. ShinyGO: A graphical gene-set enrichment tool for animals and plants. Bioinformatics 2020, 36, 2628–2629. [Google Scholar] [CrossRef] [PubMed]
- Subramanian, A.; Tamayo, P.; Mootha, V.K.; Mukherjee, S.; Ebert, B.L.; Gillette, M.A.; Paulovich, A.; Pomeroy, S.L.; Golub, T.R.; Lander, E.S.; et al. Gene set enrichment analysis: A knowledge-based approach for interpreting genome-wide expression profiles. Proc. Natl. Acad. Sci. USA 2005, 102, 15545–15550. [Google Scholar] [CrossRef]
- Howe, G.T.; Horvath, D.P.; Dharmawardhana, P.; Priest, H.D.; Mockler, T.C.; Strauss, S.H. Extensive Transcriptome Changes During Natural Onset and Release of Vegetative Bud Dormancy in Populus. Front. Plant. Sci. 2015, 6, 989. [Google Scholar] [CrossRef]
- Lassmann, H.; Bruck, W.; Lucchinetti, C.F. The immunopathology of multiple sclerosis: An overview. Brain Pathol. 2007, 17, 210–218. [Google Scholar] [CrossRef]
- Lublin, F.D. Clinical features and diagnosis of multiple sclerosis. Neurol. Clin. 2005, 23, 1–15. [Google Scholar] [CrossRef]
- Oreja-Guevara, C.; Ayuso Blanco, T.; Brieva Ruiz, L.; Hernandez Perez, M.A.; Meca-Lallana, V.; Ramio-Torrenta, L. Cognitive Dysfunctions and Assessments in Multiple Sclerosis. Front. Neurol. 2019, 10, 581. [Google Scholar] [CrossRef]
- Di Filippo, M.; Sarchielli, P.; Picconi, B.; Calabresi, P. Neuroinflammation and synaptic plasticity: Theoretical basis for a novel, immune-centred, therapeutic approach to neurological disorders. Trends Pharmacol. Sci. 2008, 29, 402–412. [Google Scholar] [CrossRef]
- Tamaru, M.; Tominaga, Y.; Yatsunami, K.; Narumi, S. Cloning of the murine interferon-inducible protein 10 (IP-10) receptor and its specific expression in lymphoid organs. Biochem. Biophys. Res. Commun. 1998, 251, 41–48. [Google Scholar] [CrossRef]
- Tamaru, M.; Nishioji, K.; Kobayashi, Y.; Watanabe, Y.; Itoh, Y.; Okanoue, T.; Murai, M.; Matsushima, K.; Narumi, S. Liver-infiltrating T lymphocytes are attracted selectively by IFN-inducible protein-10. Cytokine 2000, 12, 299–308. [Google Scholar] [CrossRef]
- Kim, D.Y.; Hao, J.; Liu, R.; Turner, G.; Shi, F.D.; Rho, J.M. Inflammation-mediated memory dysfunction and effects of a ketogenic diet in a murine model of multiple sclerosis. PLoS ONE 2012, 7, e35476. [Google Scholar] [CrossRef]
- Di Prisco, S.; Merega, E.; Milanese, M.; Summa, M.; Casazza, S.; Raffaghello, L.; Pistoia, V.; Uccelli, A.; Pittaluga, A. CCL5-glutamate interaction in central nervous system: Early and acute presynaptic defects in EAE mice. Neuropharmacology 2013, 75, 337–346. [Google Scholar] [CrossRef]
- Chu, F.; Shi, M.; Zheng, C.; Shen, D.; Zhu, J.; Zheng, X.; Cui, L. The roles of macrophages and microglia in multiple sclerosis and experimental autoimmune encephalomyelitis. J. Neuroimmunol. 2018, 318, 1–7. [Google Scholar] [CrossRef]
- Brambilla, R. The contribution of astrocytes to the neuroinflammatory response in multiple sclerosis and experimental autoimmune encephalomyelitis. Acta Neuropathol. 2019, 137, 757–783. [Google Scholar] [CrossRef]
- Hou, B.; Zhang, Y.; Liang, P.; He, Y.; Peng, B.; Liu, W.; Han, S.; Yin, J.; He, X. Inhibition of the NLRP3-inflammasome prevents cognitive deficits in experimental autoimmune encephalomyelitis mice via the alteration of astrocyte phenotype. Cell Death Dis. 2020, 11, 377. [Google Scholar] [CrossRef]
- Habbas, S.; Santello, M.; Becker, D.; Stubbe, H.; Zappia, G.; Liaudet, N.; Klaus, F.R.; Kollias, G.; Fontana, A.; Pryce, C.R.; et al. Neuroinflammatory TNFalpha Impairs Memory via Astrocyte Signaling. Cell 2015, 163, 1730–1741. [Google Scholar] [CrossRef]
- Nistico, R.; Mango, D.; Mandolesi, G.; Piccinin, S.; Berretta, N.; Pignatelli, M.; Feligioni, M.; Musella, A.; Gentile, A.; Mori, F.; et al. Inflammation subverts hippocampal synaptic plasticity in experimental multiple sclerosis. PLoS ONE 2013, 8, e54666. [Google Scholar] [CrossRef]
- Rizzo, F.R.; Guadalupi, L.; Sanna, K.; Vanni, V.; Fresegna, D.; De Vito, F.; Musella, A.; Caioli, S.; Balletta, S.; Bullitta, S.; et al. Exercise protects from hippocampal inflammation and neurodegeneration in experimental autoimmune encephalomyelitis. Brain Behav. Immun. 2021, 98, 13–27. [Google Scholar] [CrossRef]
- Ziehn, M.O.; Avedisian, A.A.; Tiwari-Woodruff, S.; Voskuhl, R.R. Hippocampal CA1 atrophy and synaptic loss during experimental autoimmune encephalomyelitis, EAE. Lab. Investig. 2010, 90, 774–786. [Google Scholar] [CrossRef]
- Girdlestone, J.; Wing, M. Autocrine activation by interferon-gamma of STAT factors following T cell activation. Eur. J. Immunol. 1996, 26, 704–709. [Google Scholar] [CrossRef] [PubMed]
- Suto, A.; Wurster, A.L.; Reiner, S.L.; Grusby, M.J. IL-21 inhibits IFN-γ production in developing Th1 cells through the repression of Eomesodermin expression. J. Immunol. 2006, 177, 3721–3727. [Google Scholar] [CrossRef] [PubMed]
- Kotelnikova, E.; Kiani, N.A.; Messinis, D.; Pertsovskaya, I.; Pliaka, V.; Bernardo-Faura, M.; Rinas, M.; Vila, G.; Zubizarreta, I.; Pulido-Valdeolivas, I.; et al. MAPK pathway and B cells overactivation in multiple sclerosis revealed by phosphoproteomics and genomic analysis. Proc. Natl. Acad. Sci. USA 2019, 116, 9671–9676. [Google Scholar] [CrossRef] [PubMed]
- Göschl, L.; Preglej, T.; Hamminger, P.; Bonelli, M.; Andersen, L.; Boucheron, N.; Gülich, A.F.; Müller, L.; Saferding, V.; Mufazalov, I.A. AT cell-specific deletion of HDAC1 protects against experimental autoimmune encephalomyelitis. J. Autoimmun. 2018, 86, 51–61. [Google Scholar] [CrossRef]
- Lee, E.; Chanamara, S.; Pleasure, D.; Soulika, A.M. IFN-gamma signaling in the central nervous system controls the course of experimental autoimmune encephalomyelitis independently of the localization and composition of inflammatory foci. J. Neuroinflammation. 2012, 9, 7. [Google Scholar] [CrossRef]
- Liu, B.; Gu, Y.; Pei, S.; Peng, Y.; Chen, J.; Pham, L.V.; Shen, H.Y.; Zhang, J.; Wang, H. Interleukin-1 receptor associated kinase (IRAK)-M -mediated type 2 microglia polarization ameliorates the severity of experimental autoimmune encephalomyelitis (EAE). J. Autoimmun. 2019, 102, 77–88. [Google Scholar] [CrossRef]
- Liu, Y.; Holdbrooks, A.T.; De Sarno, P.; Rowse, A.L.; Yanagisawa, L.L.; McFarland, B.C.; Harrington, L.E.; Raman, C.; Sabbaj, S.; Benveniste, E.N.; et al. Therapeutic efficacy of suppressing the Jak/STAT pathway in multiple models of experimental autoimmune encephalomyelitis. J. Immunol. 2014, 192, 59–72. [Google Scholar] [CrossRef]
- Li, J.; Zhou, Y.; Du, G.; Qin, X.; Gao, L. Integration of transcriptomics and network analysis deciphers the mechanisms of baicalein in improving learning and memory impairment in senescence-accelerated mouse prone 8 (SAMP8). Eur. J. Pharmacol. 2019, 865, 172789. [Google Scholar] [CrossRef]
- Liu, H.; Zhang, Z.; Zang, C.; Wang, L.; Yang, H.; Sheng, C.; Shang, J.; Zhao, Z.; Yuan, F.; Yu, Y.; et al. GJ-4 ameliorates memory impairment in focal cerebral ischemia/reperfusion of rats via inhibiting JAK2/STAT1-mediated neuroinflammation. J. Ethnopharmacol. 2021, 267, 113491. [Google Scholar] [CrossRef]
- Karch, C.M.; Goate, A.M. Alzheimer’s disease risk genes and mechanisms of disease pathogenesis. Biol. Psychiatry 2015, 77, 43–51. [Google Scholar] [CrossRef]
- Bakker, A.B.H.; Hoek, R.M.; Cerwenka, A.; Blom, B.; Lucian, L.; McNeil, T.; Murray, R.; Phillips, J.H.; Sedgwick, J.D.; Lanier, L.L. DAP12-deficient mice fail to develop autoimmunity due to impaired antigen priming. Immunity 2000, 13, 345–353. [Google Scholar] [CrossRef]
- Roumier, A.; Bechade, C.; Poncer, J.C.; Smalla, K.H.; Tomasello, E.; Vivier, E.; Gundelfinger, E.D.; Triller, A.; Bessis, A. Impaired synaptic function in the microglial KARAP/DAP12-deficient mouse. J. Neurosci. 2004, 24, 11421–11428. [Google Scholar] [CrossRef]
- Paloneva, J.; Kestila, M.; Wu, J.; Salminen, A.; Bohling, T.; Ruotsalainen, V.; Hakola, P.; Bakker, A.B.; Phillips, J.H.; Pekkarinen, P.; et al. Loss-of-function mutations in TYROBP (DAP12) result in a presenile dementia with bone cysts. Nat. Genet. 2000, 25, 357–361. [Google Scholar] [CrossRef]
- Huh, G.S.; Boulanger, L.M.; Du, H.; Riquelme, P.A.; Brotz, T.M.; Shatz, C.J. Functional requirement for class I MHC in CNS development and plasticity. Science 2000, 290, 2155–2159. [Google Scholar] [CrossRef]
- Hasan, M.; Seo, J.E.; Rahaman, K.A.; Min, H.; Kim, K.H.; Park, J.H.; Sung, C.; Son, J.; Kang, M.J.; Jung, B.H.; et al. Novel genes in brain tissues of EAE-induced normal and obese mice: Upregulation of metal ion-binding protein genes in obese-EAE mice. Neuroscience 2017, 343, 322–336. [Google Scholar] [CrossRef]
- Falcao, A.M.; van Bruggen, D.; Marques, S.; Meijer, M.; Jakel, S.; Agirre, E.; Samudyata; Floriddia, E.M.; Vanichkina, D.P.; Ffrench-Constant, C.; et al. Disease-specific oligodendrocyte lineage cells arise in multiple sclerosis. Nat. Med. 2018, 24, 1837–1844. [Google Scholar] [CrossRef]
- Freria, C.M.; Zanon, R.G.; Santos, L.M.; Oliveira, A.L. Major histocompatibility complex class I expression and glial reaction influence spinal motoneuron synaptic plasticity during the course of experimental autoimmune encephalomyelitis. J. Comp. Neurol. 2010, 518, 990–1007. [Google Scholar] [CrossRef] [PubMed]
- Jain, M.R.; Bian, S.; Liu, T.; Hu, J.; Elkabes, S.; Li, H. Altered proteolytic events in experimental autoimmune encephalomyelitis discovered by iTRAQ shotgun proteomics analysis of spinal cord. Proteome Sci. 2009, 7, 25. [Google Scholar] [CrossRef]
- Lee, T.S.; Li, A.Y.; Rapuano, A.; Mantis, J.; Eid, T.; Seyfried, T.N.; de Lanerolle, N.C. Gene expression in the epileptic (EL) mouse hippocampus. Neurobiol. Dis. 2021, 147, 105152. [Google Scholar] [CrossRef]
- Goddard, C.A.; Butts, D.A.; Shatz, C.J. Regulation of CNS synapses by neuronal MHC class I. Proc. Natl. Acad. Sci. USA 2007, 104, 6828–6833. [Google Scholar] [CrossRef]
- Gallo, F.T.; Katche, C.; Morici, J.F.; Medina, J.H.; Weisstaub, N.V. Immediate Early Genes, Memory and Psychiatric Disorders: Focus on c-Fos, Egr1 and Arc. Front. Behav. Neurosci. 2018, 12, 79. [Google Scholar] [CrossRef] [PubMed]
- Koldamova, R.; Schug, J.; Lefterova, M.; Cronican, A.A.; Fitz, N.F.; Davenport, F.A.; Carter, A.; Castranio, E.L.; Lefterov, I. Genome-wide approaches reveal EGR1-controlled regulatory networks associated with neurodegeneration. Neurobiol. Dis. 2014, 63, 107–114. [Google Scholar] [CrossRef] [PubMed]
- Zalcman, G.; Federman, N.; de la Fuente, V.; Romano, A. Nuclear factor kappa B-dependent Zif268 expression in hippocampus is required for recognition memory in mice. Neurobiol. Learn. Mem. 2015, 119, 10–17. [Google Scholar] [CrossRef] [PubMed]
- Katche, C.; Goldin, A.; Gonzalez, C.; Bekinschtein, P.; Medina, J.H. Maintenance of long-term memory storage is dependent on late posttraining Egr-1 expression. Neurobiol. Learn. Mem. 2012, 98, 220–227. [Google Scholar] [CrossRef] [PubMed]
- Penke, Z.; Chagneau, C.; Laroche, S. Contribution of Egr1/zif268 to Activity-Dependent Arc/Arg3.1 Transcription in the Dentate Gyrus and Area CA1 of the Hippocampus. Front. Behav. Neurosci. 2011, 5, 48. [Google Scholar] [CrossRef] [PubMed]
- Korb, E.; Finkbeiner, S. Arc in synaptic plasticity: From gene to behavior. Trends Neurosci. 2011, 34, 591–598. [Google Scholar] [CrossRef]
- Fleischmann, A.; Hvalby, O.; Jensen, V.; Strekalova, T.; Zacher, C.; Layer, L.E.; Kvello, A.; Reschke, M.; Spanagel, R.; Sprengel, R.; et al. Impaired long-term memory and NR2A-type NMDA receptor-dependent synaptic plasticity in mice lacking c-Fos in the CNS. J. Neurosci. 2003, 23, 9116–9122. [Google Scholar] [CrossRef]
- Minatohara, K.; Akiyoshi, M.; Okuno, H. Role of Immediate-Early Genes in Synaptic Plasticity and Neuronal Ensembles Underlying the Memory Trace. Front. Mol. Neurosci. 2015, 8, 78. [Google Scholar] [CrossRef]
- Ramirez-Amaya, V.; Vazdarjanova, A.; Mikhael, D.; Rosi, S.; Worley, P.F.; Barnes, C.A. Spatial exploration-induced Arc mRNA and protein expression: Evidence for selective, network-specific reactivation. J. Neurosci. 2005, 25, 1761–1768. [Google Scholar] [CrossRef]
- Guzowski, J.F.; McNaughton, B.L.; Barnes, C.A.; Worley, P.F. Environment-specific expression of the immediate-early gene Arc in hippocampal neuronal ensembles. Nat. Neurosci. 1999, 2, 1120–1124. [Google Scholar] [CrossRef]
- Centonze, D.; Muzio, L.; Rossi, S.; Cavasinni, F.; De Chiara, V.; Bergami, A.; Musella, A.; D’Amelio, M.; Cavallucci, V.; Martorana, A.; et al. Inflammation triggers synaptic alteration and degeneration in experimental autoimmune encephalomyelitis. J. Neurosci. 2009, 29, 3442–3452. [Google Scholar] [CrossRef]
- Kim, J.; Ahn, M.; Choi, Y.; Ekanayake, P.; Park, C.M.; Moon, C.; Jung, K.; Tanaka, A.; Matsuda, H.; Shin, T. Gene Expression Profile of Olfactory Transduction Signaling in an Animal Model of Human Multiple Sclerosis. Exp. Neurobiol. 2019, 28, 74–84. [Google Scholar] [CrossRef]
- Zhang, J.; Li, Y.; Chen, J.; Cui, Y.; Lu, M.; Elias, S.B.; Mitchell, J.B.; Hammill, L.; Vanguri, P.; Chopp, M. Human bone marrow stromal cell treatment improves neurological functional recovery in EAE mice. Exp. Neurol. 2005, 195, 16–26. [Google Scholar] [CrossRef]
- Roberts, A.; Trapnell, C.; Donaghey, J.; Rinn, J.L.; Pachter, L. Improving RNA-Seq expression estimates by correcting for fragment bias. Genome Biol. 2011, 12, R22. [Google Scholar] [CrossRef]
- Hong, G.; Zhang, W.; Li, H.; Shen, X.; Guo, Z. Separate enrichment analysis of pathways for up- and downregulated genes. J. R. Soc. Interface. 2014, 11, 20130950. [Google Scholar] [CrossRef]
- Ang, M.J.; Kim, J.; Lee, S.; Kim, S.H.; Kim, J.C.; Jeon, T.I.; Im, S.S.; Moon, C. Transcriptome Profiling Reveals Novel Candidate Genes Related to Hippocampal Dysfunction in SREBP-1c Knockout Mice. Int. J. Mol. Sci. 2020, 21, 4131. [Google Scholar] [CrossRef]


| Gene Symbol | FC–RNAseq | FC–RT-qPCR | NCBI Sequence | Primer Pair (5′-3′) | Length (bp) |
|---|---|---|---|---|---|
| Ccl5 | 20.954 * | 69.55 ** | NM_013653.3 | F-CAATCTTGCAGTCGTGTTTGTC R-AGGGGATTACTGAGTGGCATC | 197 |
| Ifit1 | 3.945 * | 3.688 ** | NM_008331.3 | F-TACAGCAACCATGGGAGAGAATG R-ACTGGACCTGCTCTGAGATT | 143 |
| Tnfα | 16.693 * | 21.64 ** | NM_013693.3 | F-CCCAAAGGGATGAGAAGTTCC R-TGGGCTACAGGCTTGTCACTC | 109 |
| Cxcl10 | 13.65 * | 17.28 * | NM_021274.2 | F-CCACGTGTTGAGATCATTGCC R-GAGGCTCTCTGCTGTCCATC | 184 |
| Tyrobp | 2.8097 * | 2.832 ** | NM_011662.3 | F-TTAAGTCCCGTACAGGCCCA R-TTGTTTCCGGGTCCCTTCCG | 170 |
| Ccr2 | 19.534 * | 14.26 * | NM_009915.2 | F-AGGAGCCATACCTGTAAATGCC R-ATGCCGTGGATGAACTGAGG | 163 |
| B2m | 5.464 ** | 5.728 ** | NM_009735.3 | F-CTCACACTGAATTCACCCCC R-TCACATGTCTCGATCCCAGTAG | 300 |
| Stat1 | 2.803 * | 3.091 ** | NM_001357627.1 | F-GCCTCTCATTGTCACCGAAGAAC R-TGGCTGACGTTGGAGATCACCA | 100 |
| Junb | −1.7655 *** | −1.982 ** | NM_008416.3 | F-GGATCCCTATCGGGGTCTCA R-TTGCTGTTGGGGACGATCAA | 156 |
| Egr1 | −2.397 *** | −3.915 ** | NM_007913.5 | F-GCACCTGACCACAGAGTCCTTT R-GGCCACTGACTAGGCTGAAAA | 188 |
| Fos | −2.3463 *** | −1.898 ** | BC029814 | F-GGGCTGCACTACTTACACGT R-TGCCTTGCCTTCTCTGACTG | 169 |
| Arc | −1.94 ** | −1.676 * | NM_018790.3 | F-GATCTTTCCTGCTGTGCCCT R-CGCAACAAGGCCTACTCAGA | 109 |
| Gapdh | NM_008084 | F-CATCACTGCCACCCAGAAGACTG R-ATGCCAGTGAGCTTCCCGTTCAG | 153 |
| MSigDB Gene Set | Size | NES | FDR q-value | NOM p-value |
|---|---|---|---|---|
| Negatively enriched gene sets | ||||
| Wnt_beta-catenin signaling | 41 | −1.74 | 0.015 | 0.008 |
| Hedgehog signaling | 36 | −1.45 | 0.06 | 0.033 |
| Estrogen response early | 197 | −1.44 | 0.05 | 0 |
| Myogenesis | 200 | −1.38 | 0.06 | 0 |
| Positively enriched gene sets | ||||
| Interferon gamma response | 192 | 2.78 | 0 | 0 |
| Allograft rejection | 194 | 2.68 | 0 | 0 |
| Interferon alpha response | 93 | 2.67 | 0 | 0 |
| Il6_jak_stat3 signaling | 85 | 2.49 | 0 | 0 |
| Inflammatory response | 197 | 2.33 | 0 | 0 |
| Complement | 193 | 2.24 | 0 | 0 |
| Il2_stat5 signaling | 199 | 2.09 | 0 | 0 |
| Kras signaling up | 199 | 1.85 | 0 | 0 |
| E2f targets | 200 | 1.82 | 0 | 0 |
| G2m checkpoint | 196 | 1.81 | 0 | 0 |
| Coagulation | 138 | 1.79 | 0 | 0 |
| Apoptosis | 161 | 1.77 | 0 | 0 |
| Tnfα signaling via nfκb | 198 | 1.62 | 0.005 | 0 |
| P13k_akt_mtor signaling | 105 | 1.35 | 0.096 | 0.041 |
| MSigDB Gene Set | Size | NES | FDR q-value | NOM p-value |
|---|---|---|---|---|
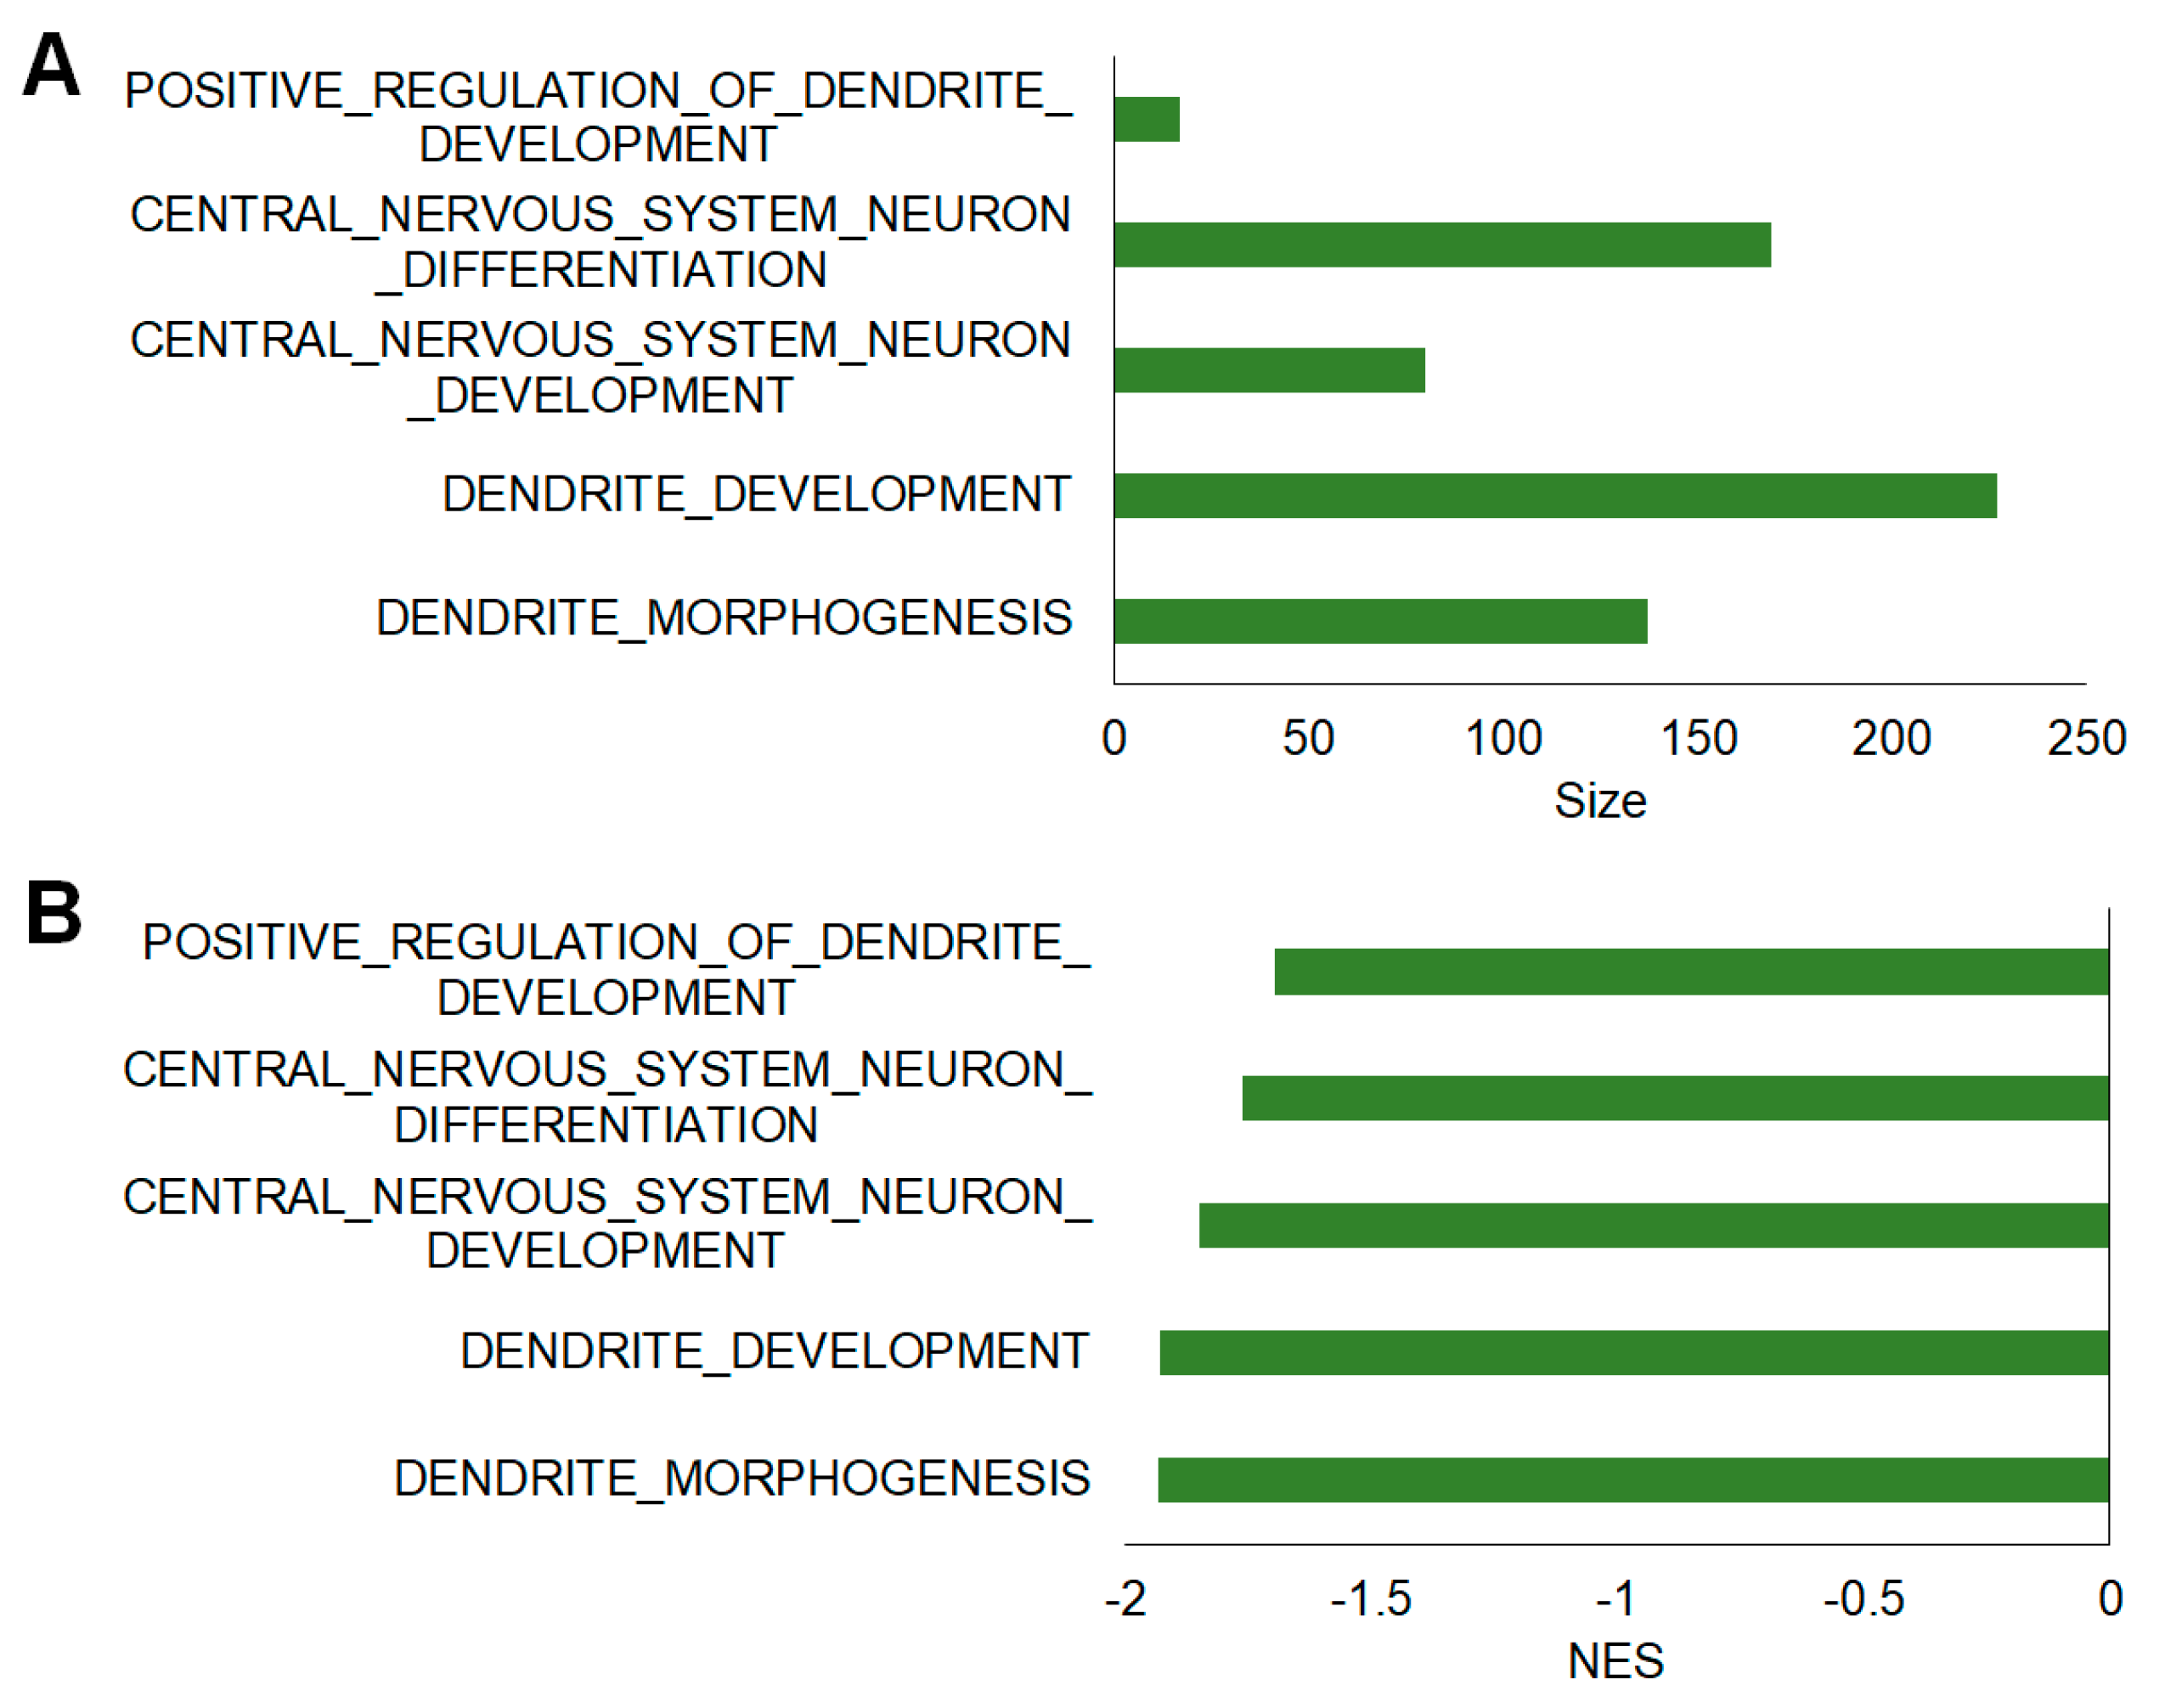
| Dendrite morphogenesis | 137 | −1.933 | 0.01 | 0 |
| Dendrite development | 227 | −1.929 | 0.01 | 0 |
| Central nervous system neuron development | 80 | −1.849 | 0.01 | 0 |
| Central nervous system neuron differentiation | 169 | −1.763 | 0.02 | 0 |
| Positive regulation of dendrite development | 17 | −1.698 | 0.02 | 0.01 |
| Dendritic spine morphogenesis | 57 | −1.694 | 0.02 | 0.01 |
| Regulation of dendrite development | 97 | −1.686 | 0.02 | 0 |
| Regulation of dendrite morphogenesis | 63 | −1.667 | 0.02 | 0.01 |
| Dendritic spine development | 89 | −1.591 | 0.03 | 0.01 |
| Regulation of dendritic spine morphogenesis | 43 | −1.578 | 0.03 | 0.02 |
| Dendrite terminus | 12 | −1.574 | 0.03 | 0.03 |
| Regulation of dendrite extension | 25 | −1.551 | 0.03 | 0.02 |
| Dendrite extension | 35 | −1.524 | 0.04 | 0.03 |
| Positive regulation of dendrite morphogenesis | 34 | −1.502 | 0.04 | 0.01 |
Publisher’s Note: MDPI stays neutral with regard to jurisdictional claims in published maps and institutional affiliations. |
© 2022 by the authors. Licensee MDPI, Basel, Switzerland. This article is an open access article distributed under the terms and conditions of the Creative Commons Attribution (CC BY) license (https://creativecommons.org/licenses/by/4.0/).
Share and Cite
Weerasinghe-Mudiyanselage, P.D.E.; Kang, S.; Kim, J.-S.; Kim, J.-C.; Kim, S.-H.; Wang, H.; Shin, T.; Moon, C. Transcriptome Profiling in the Hippocampi of Mice with Experimental Autoimmune Encephalomyelitis. Int. J. Mol. Sci. 2022, 23, 14829. https://doi.org/10.3390/ijms232314829
Weerasinghe-Mudiyanselage PDE, Kang S, Kim J-S, Kim J-C, Kim S-H, Wang H, Shin T, Moon C. Transcriptome Profiling in the Hippocampi of Mice with Experimental Autoimmune Encephalomyelitis. International Journal of Molecular Sciences. 2022; 23(23):14829. https://doi.org/10.3390/ijms232314829
Chicago/Turabian StyleWeerasinghe-Mudiyanselage, Poornima D. E., Sohi Kang, Joong-Sun Kim, Jong-Choon Kim, Sung-Ho Kim, Hongbing Wang, Taekyun Shin, and Changjong Moon. 2022. "Transcriptome Profiling in the Hippocampi of Mice with Experimental Autoimmune Encephalomyelitis" International Journal of Molecular Sciences 23, no. 23: 14829. https://doi.org/10.3390/ijms232314829
APA StyleWeerasinghe-Mudiyanselage, P. D. E., Kang, S., Kim, J.-S., Kim, J.-C., Kim, S.-H., Wang, H., Shin, T., & Moon, C. (2022). Transcriptome Profiling in the Hippocampi of Mice with Experimental Autoimmune Encephalomyelitis. International Journal of Molecular Sciences, 23(23), 14829. https://doi.org/10.3390/ijms232314829