Article

Genome-Scale Investigation of GARP Family Genes Reveals Their Pivotal Roles in Nutrient Stress Resistance in Allotetraploid Rapeseed

1
School of Agricultural Sciences, Zhengzhou University, Zhengzhou 450001, China
2
School of Life Sciences, Zhengzhou University, Zhengzhou 450001, China
*
Authors to whom correspondence should be addressed.
These authors contributed equally to this work.
Int. J. Mol. Sci. 2022, 23(22), 14484; https://doi.org/10.3390/ijms232214484
Submission received: 16 October 2022 / Revised: 14 November 2022 / Accepted: 18 November 2022 / Published: 21 November 2022

Abstract

:
The GARP genes are plant-specific transcription factors (TFs) and play key roles in regulating plant development and abiotic stress resistance. However, few systematic analyses of GARPs have been reported in allotetraploid rapeseed (Brassica napus L.) yet. In the present study, a total of 146 BnaGARP members were identified from the rapeseed genome based on the sequence signature. The BnaGARP TFs were divided into five subfamilies: ARR, GLK, NIGT1/HRS1/HHO, KAN, and PHL subfamilies, and the members within the same subfamilies shared similar exon-intron structures and conserved motif configuration. Analyses of the Ka/Ks ratios indicated that the GARP family principally underwent purifying selection. Several cis-acting regulatory elements, essential for plant growth and diverse biotic and abiotic stresses, were identified in the promoter regions of BnaGARPs. Further, 29 putative miRNAs were identified to be targeting BnaGARPs. Differential expression of BnaGARPs under low nitrate, ammonium toxicity, limited phosphate, deficient boron, salt stress, and cadmium toxicity conditions indicated their potential involvement in diverse nutrient stress responses. Notably, BnaA9.HHO1 and BnaA1.HHO5 were simultaneously transcriptionally responsive to these nutrient stresses in both hoots and roots, which indicated that BnaA9.HHO1 and BnaA1.HHO5 might play a core role in regulating rapeseed resistance to nutrient stresses. Therefore, this study would enrich our understanding of molecular characteristics of the rapeseed GARPs and will provide valuable candidate genes for further in-depth study of the GARP-mediated nutrient stress resistance in rapeseed.

1. Introduction

The transcriptional regulation of plant genes is a complex and accurate network system. In this process, transcription factors (TFs) play crucial roles in plant growth and development, species origin, and stress responses by precisely binding to the cis-acting regions of target genes [1]. After the identification of the Arabidopsis genome, the TFs were classified into 58 TF families [2]. Plant responses to nutrient stresses are regulated by complex signaling pathways and networks which are coordinated by TFs [3].
The GARP gene is a plant-specific TF and plays a key role in regulating plant development, disease resistance, hormone signaling, circadian clock oscillations, and abiotic stress resistance [4]. GARP is named from the Golden 2 (G2) protein in maize, the type B authentic response regulator (ARR-B) protein in A. thaliana, and the phosphate starvation response 1 (PSR1) protein in Chlamydomonas [5]. In the GARP family, the members can be classified if the derived protein contains the conserved signature motif called the B-motif (GARP motif) [6]. The B motif is a signature of type-B response regulators (ARRs) involved in His-to-Asp phosphorelay signal transduction systems in Arabidopsis, which contains an HTH (helix-turn-helix) motif [5]. HTH motifs can regulate a variety of physiological processes, as well as participate in TF dimerization. The B motif is highly similar to MYB-DBD (Myb-DNA binding domain), and this also leads to frequent confusion with MYB-related TFs [5]. In contrast to MYB-related proteins characterized by the (SHAQK(Y/F) F) motif, GARP TFs contain a different consensus sequence (SHLQ(K/M) (Y/F)) [6].
The GARP TFs have been identified in Arabidopsis, rice, cotton, tea plant, and other species, and related studies have shown that they are involved in the regulation of plant growth and development, abiotic stress resistance, and other biological processes [7,8,9,10]. AtGARPs have been defined as important regulators of diverse nutrient stresses. The expression of AtHHO3 (NIGT1.1) and AtHHO2 (NIGT1.2) was induced in nitrogen (N) deficiency, while AtHHO1(NIGT1.3) is involved in primary root shortening under phosphate (Pi)-deficient conditions [11]. AtKAN1 acts as a transcriptional repressor involved in auxin biosynthesis, auxin transport, and auxin response [12], and AtKAN4 is shown to broadly control the flavonoid pathway in Arabidopsis seed [13]. In addition, AtBOA is a component of the Arabidopsis circadian clock [14]. In rice, OsPHR1-4 has been linked to controlling Pi homeostasis-regulating sensing and signaling cascades in rice [15]. The expression of OsARR-B5, OsARR-B22, and OsARR-B23 was upregulated under alkaline stress and was implicated in plant development modulation by controlling cellular processes, molecular activities, and biological functions [16]. OsHHO2 inhibits Pi starvation response [17], whereas OsHHO3 and OsHHO4 play critical roles in the N deficiency response [18]. In cotton, GhGLK1 is reported to be involved in the regulation of drought and cold stress responses [19]. Thus, GARP TFs play significant roles in the responses of different plant species to nutrient stress.
The GARP TFs are involved in the responses to nutrient stresses and include probable nutrient sensors of plants. CrPsr1 is the first reported GARP TF to be involved in the nutritional responses, and it is essential for the adaptation of C. reinhardtii to Pi starvation [20]. Then, NIGT1/HRS1/HHOs were found to be the most robustly and quickly nitrate (NO3) regulated TFs [21]. N and Pi are essential macronutrients for the growth and development of plants. N participates in a variety of physiological and biochemical processes as a component of proteins, nucleic acids, and plant growth regulators [19]. Pi is an essential building block of Important compounds such as DNA, RNA, and proteins, and is involved in glycolysis, respiration, and photosynthesis [22]. In the process of N and Pi absorption and utilization, TFs play an important role in regulation [23,24,25,26]. A number of GARPs, particularly members of the NIGT1/HRS1/HHO subfamily, have been shown to play important roles in the regulation of plant responses to N and Pi stresses. The role of NIGT1/HRS1/HHO in response to N and Pi stresses can be summarized in two pathways: NRT-NLP-NIGT1/HRS1/HHO and NIGT1-SPX-PHR [27]. Specifically, the nitrate transporters NRTs can increase the content of N nutrients, enhancing the expression of the nitrate-responsive nodulin-like proteins (NLPs), and induce the expression of GARPs to suppress the N starvation response. The NIGT1 proteins repress the expression of SPXs by directly binding to the SPX promoters, and the SPX proteins function as the repressors of PHR TFs [28]. Under Pi-sufficient conditions, PHR1 interacts with SPXs (SYG1/PHO81/XPR1), Pi sensor proteins, and inhibitors for PHR1, and the NIGT1-clade genes are not activated. Under Pi starvation conditions, PHR1 is released from SPXs and promotes the expression of the NIGT1-clade genes [29]. In addition to NIGT1/HRS1/HHO, PHR of the GARP gene family has also been reported to affect N and Pi homeostasis [15].
Rapeseed (Brassica napus L.) is a major oilseed crop due to its economic value and oilseed production. However, its productivity has been repressed by many environmental adversities [30]. Under drought tolerance, the shoot and root growth of rapeseed seedlings is greatly inhibited, which ultimately will reduce crop production [31]. For rapeseed, salt stress severely affects all life stages from seed germination to yield production [32]. Cold stress has a negative impact on rapeseed germination and seedling establishment, causing wilting and plant death at the seedling stage [33]. Rapeseed production in the field is also often severely inhibited due to N deficiency [34] and is highly dependent on N fertilizer application, but its N use efficiency (NUE) is very low [35]. Rapeseed is also extremely sensitive to Pi deficiency [36]. A number of gene families, such as superoxide dismutase (SOD) [37], lipid phosphate phosphatases (LPP) [38], and B-box (BBX) [39] play critical roles in rapeseed growth, development, and response to stresses in rapeseed. To date, GARPs have also been identified to play important roles in plant growth and response to stress [16,17,18]. Given the importance of the GARP family in all aspects of plant developmental processes and stress responses, a comprehensive genome-wide investigation of GARPs is warranted in rapeseed.
However, few systematic analyses of GARPs in B. napus have been available so far. Thus, this study is aimed to (i) identify the genome-wide GARPs in B. napus, (ii) characterize the genomic characteristics and transcriptional responses of the GARPs to N stresses (including NO3 limitation and ammonium (NH4+) toxicity) and Pi limitation, and (iii) investigate the transcriptional responses of GARPs to other nutrient stresses, including boron deficiency, cadmium toxicity, and salt stress. This study would enrich our understanding of molecular characteristics of the rapeseed GARPs and will provide valuable candidate genes for further in-depth study of the GARP-mediated nutrient stress resistance in rapeseed.

2. Results

2.1. Genome-Wide Identification of the GARP Family Genes in B. napus

Since the GARP proteins are highly similar to MYB or MYB-like TFs in terms of both sequences and structures, the candidate GARP genes were compared and screened according to the methods reported by Safi et al. [6]. In this study, a total of 146 BnaGARPs were identified in the rapeseed genome (AnAnCnCn: A1-A10, C1-C9).
The physical and chemical characteristics, including the gene length and molecular weights (MW), of a total of 146 GARP proteins were analyzed and provided. The BnaGARPs have varying physicochemical characteristics (Table S1). The length of the GARP protein sequences ranged between 101 (BnaA3.MYBC1a) and 1022 (BnaC8.GLK1) amino acids in B. napus. The isoelectric point (pI) ranged between 4.74 (BnaA2.PHL1) and 11.06 (BnaA5.MYBC1). The molecular weight (MW) ranged from 11.62 to 111.69 kDa for BnaA3.MYBC1a and BnaC8.GLK1, respectively.

2.2. Phylogenetic Analysis and Ka/Ks Ratio Calculation

To elucidate the evolutionary relationships and functional divergence among Brassica GARP proteins, the sequences of 146 B. napus GARP proteins, and 56 A. thaliana GARP proteins were used to construct a phylogenetic tree (Figure 1). In general, the GARP homologs in B. napus significantly expanded compared to those in A. thaliana. Moreover, the number of GARPs in B. napus is much more than three times of those in A. thaliana.
Based on the topologies and bootstrap support values of the NJ phylogenetic tree, the candidate GARPs were divided into five subfamilies, which were identical to the previous study [7]. The distribution of BnaGARPs among different subfamilies was as follows: ARR (34 members), GLK (17 members), NIGT1/HRS1/HHO (27 members), KAN (17 members), and PHL1 (52 members). The differences in the number of BnaGARPs within the five subfamilies indicated a distinct expansion trend among these subfamilies.
To explore the selective pressure on BnaGARPs, the non-synonymous/synonymous mutation ratio (Ka/Ks) was calculated; Ka/Ks > 1.0 indicates positive selection, Ka/Ks = 1.0 indicates neutral selection, and Ka/Ks < 1.0 indicates purifying selection [40]. The Ka/Ks ratio for all BnaGARPs was <1.0, ranging between 0.0697 (BnaA5.ARR1) and 0.5771 (BnaA6.APRR4), implying that the replicated GARPs could experience strong purification selection (Table S2).

2.3. Conserved Motif and Gene Structure Analyses

To further clarify the potential functions of GARPs in B. napus, MEME was used to identify 10 conserved motifs (Figure 2). Motif 1 and motif 2 in the BnaARR-B subfamilies, and the motif1 and motif 4 in the BnaNIGT1/HRS1/HHO subfamilies are the B-motif of the GARP signature motif and extensively distributed in BnaGARPs (Figure 2B). Furthermore, motif 7 and motif 10 only exist in APRR2, while motif 8 is specific to BnaARR2 and BnaARR1, and in the PHL subfamily, motif 8 only occurs in PHL14 (Figure S1). However, the motif patterns of BnaGARPs within a subgroup are similar.
To evaluate the sequence diversity of BnaGARPs, the exon–intron structures of each BnaGARP were detected. In detail, most of BnaGARPs had six exons and five introns, and several genes had five exons and four introns, while BnaARR21s contained 12 introns and BnaMYBC1 contained one intron (Figure S2). Similarly, the majority of BnaGARPs in the same subgroups generally had similar gene structures (Figure 3).
We also found that the intron lengths are slightly different among different BnaGARPs. In comparison with BnaPHL12s, the introns within BnaPHL5s were relatively large. Although the exon-intron structures of most closely related genes exhibited high similarity and conservation, there still exist several differences.

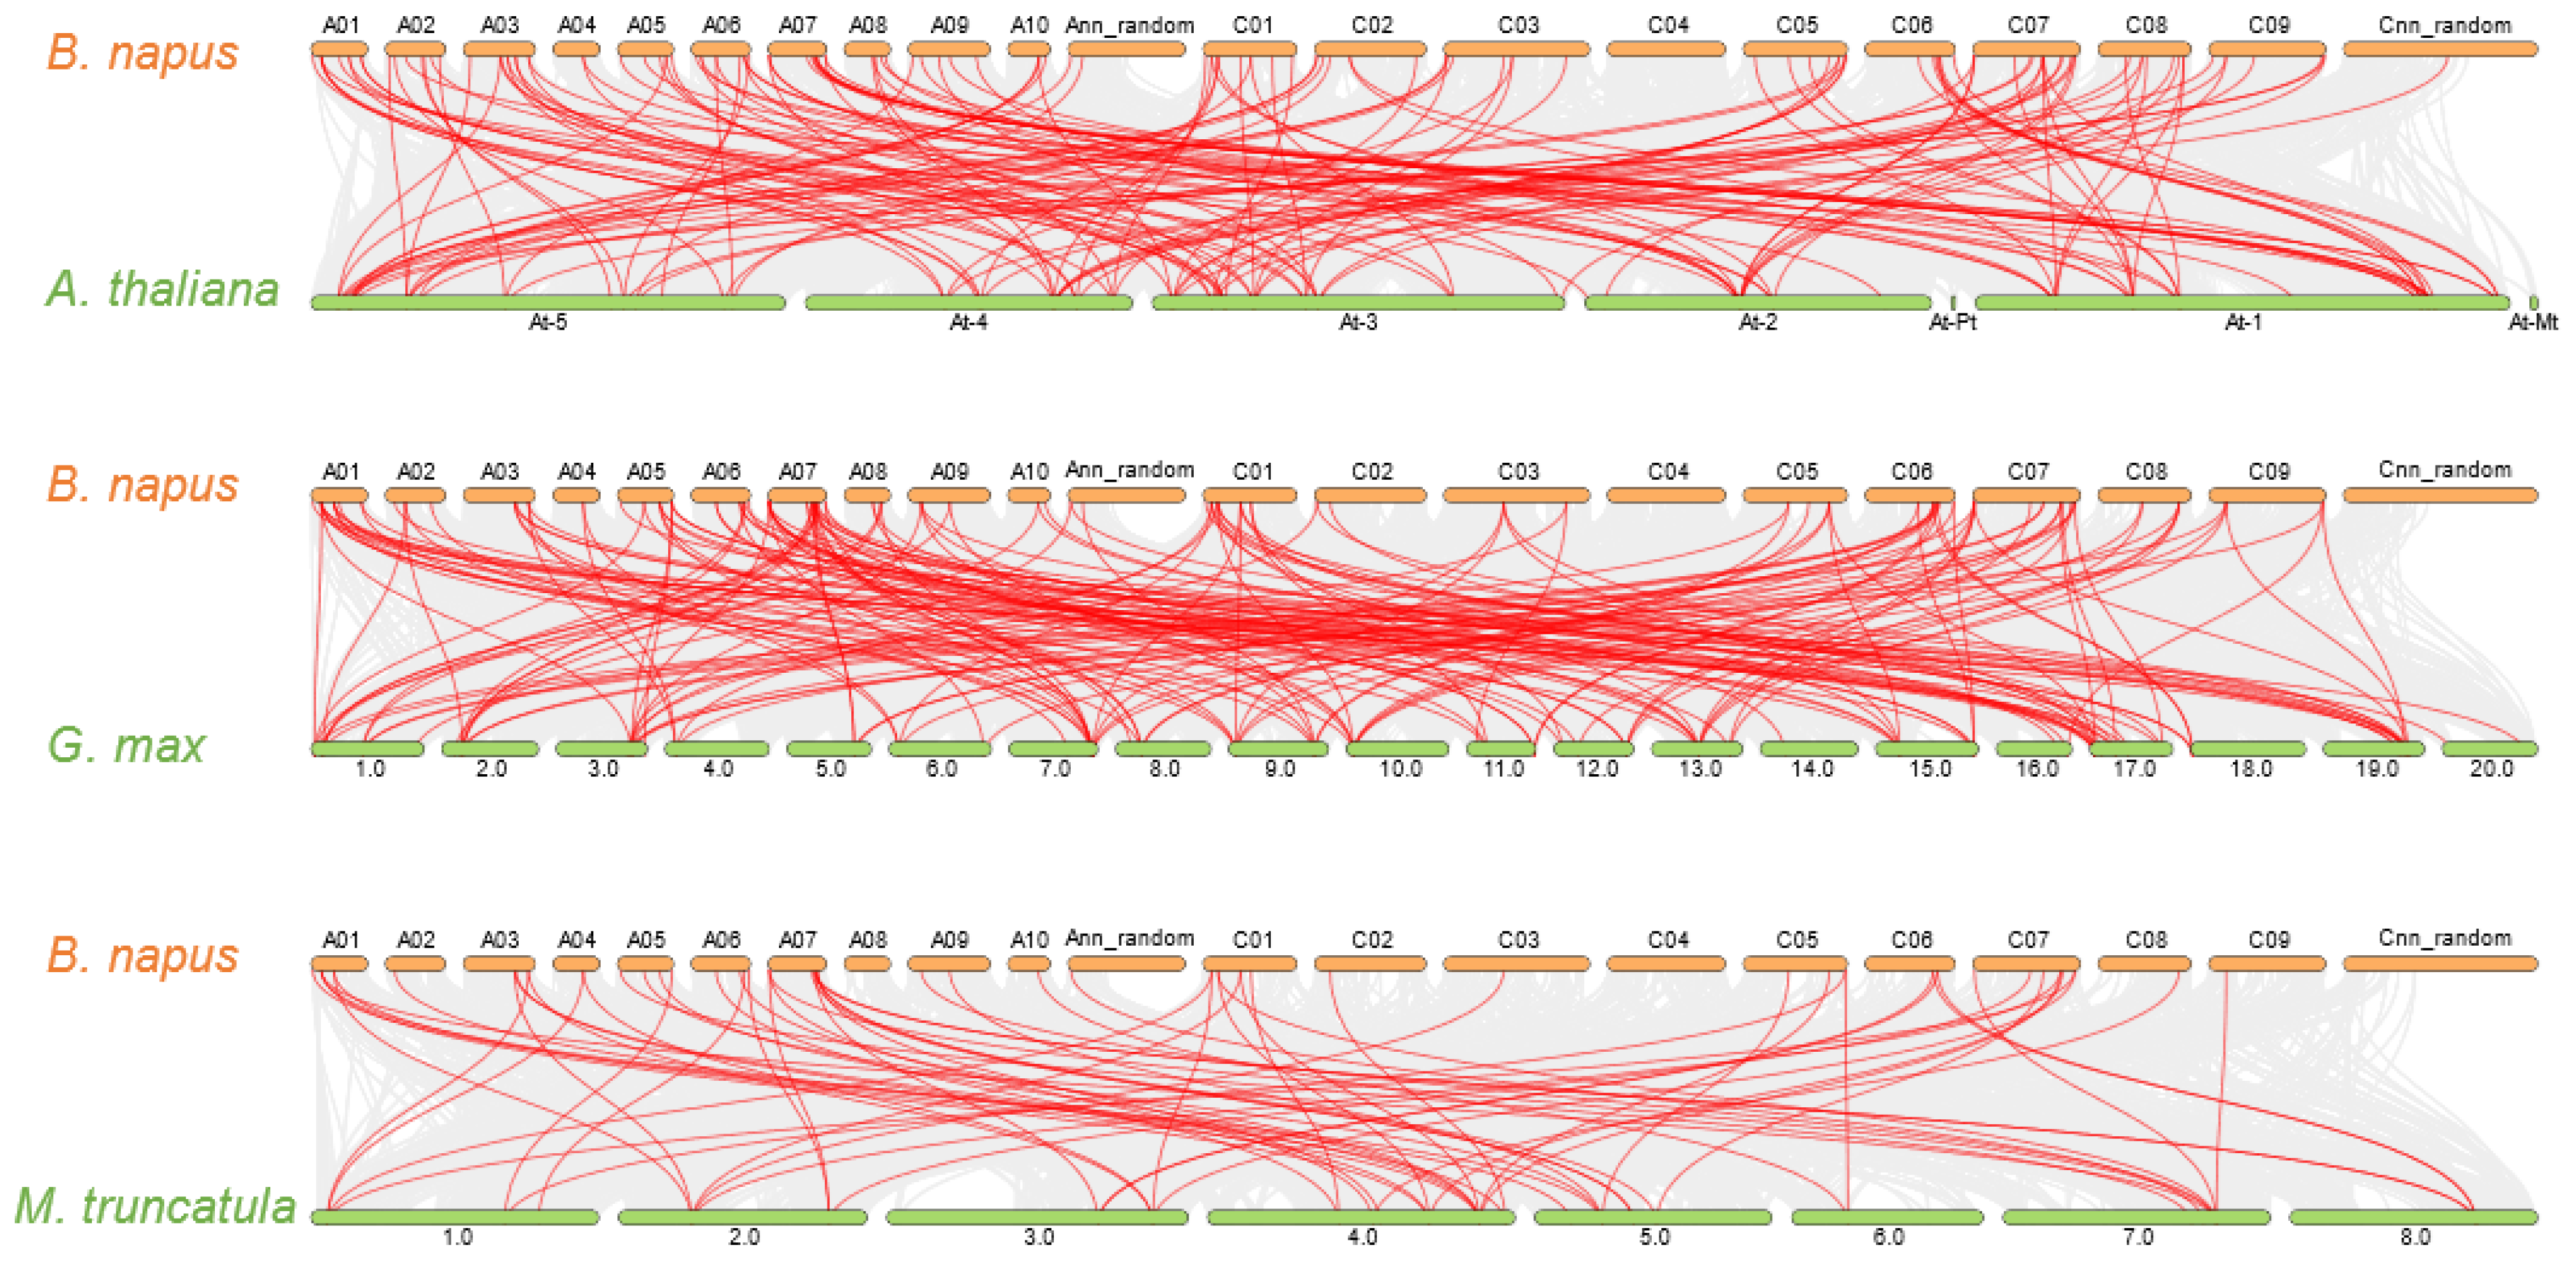
2.4. Gene Duplication and Synteny Analysis of GARP Gene Families

The genomic positions of the identified GARPs were physically mapped onto the rapeseed chromosomes using the MapGene2Chrom program. Ultimately, a total of 146 GARPs were mapped onto 20 chromosomes in B. napus (Figure 4). Evidently, there are only two GARPs on chromosomes chrA4, four on chrA10, while chrC4 has the most genes. The distribution of genes on the chromosomes is relatively scattered, and the genes on the same chromosome are far apart.
Gene duplication events can lead to the expansion of gene families and play crucial roles in the adaptation of plant species to the external environment by acquiring new gene functions. Given the importance of gene duplication in the evolution of plant gene families, the duplication patterns of 146 GARP family genes were analyzed in B. napus. Between the two sub-genomes of B. napus, 45 duplication events took place on the A subgenome, 36 events on the C subgenome, and 136 events across the A/C subgenomes (Table S3).
To better understand the evolution of BnaGARPs, the synteny of the GARP pairs between the genomes of B. napus and A. thaliana, G. max, and M. truncatula was constructed (Figure 5 and Tables S4–S8). We found that 115 BnaGARPs exhibited syntenic relationships with AtGARPs. Some AtGARPs were associated with more than one orthologous copy in B. napus. For example, KAN2/AT1G32240 showed a syntenic relationship with BnaC5.KAN2b, BnaC5.KAN2a, and BnaC8.KAN2 (Table S4). As shown in Figure 5 and Figure S5, BnaGARPs shared 172 syntenic gene pairs with G. max, 66 with M. truncatula, and 3 with T. aestivum (Tables S5–S7). Additionally, syntenic gene pairs were identified between rapeseed and rice, which constituted the fewest number of background collinear blocks (Table S8). Interestingly, 46 genes were found in the comparative synteny maps between B. napus and other plant species (A. thaliana, M. truncatula, and G. max), and these collinear gene pairs were highly conserved within several syntenic blocks, such as BnaA1.APRR2, BnaA1.HHO5, BnaA1.KAN3, BnaA1.PHR1, and BnaA10.MYR1 on the A1 chromosome and BnaA3.APRR2, BnaA3.ARR10, and BnaA3.ARR2 on the A3 chromosome.

2.5. Cis-Regulatory Element Prediction in the Promoter Regions of BnaGARPs

To investigate the potential regulatory mechanisms underlying GARPs in response to abiotic stresses and hormones, the cis-regulatory elements (CREs) in the 2000 bp upstream promoter sequences of each GARP gene were scanned by the plantCARE database. The results revealed that the promoter regions of each BnaGARPs have stress and hormone-related CREs.
In total, 20 types of CREs were detected, including 1848 light responsiveness CREs, 442 MeJA responsiveness CREs, 372 abscisic acid responsiveness CREs, and 365 anaerobic induction CREs (Table S9). The most and least CREs found in the promoter regions of the GARP genes were light responsiveness CREs (1848) and wound-responsive CREs (3), respectively. Meanwhile, a mass of putative CREs that were involved in hormone responses, such as GA, MeJA, and BHA, were found in a series of BnaGARP promoters. As well, many putative CREs associated with abiotic stress, such as the low-temperature responsive CREs, defense and stress responsive CREs, and drought inducibility CREs, were found in many BnaGARP promoter regions (Figure 6).

2.6. Genome-Wide Analysis of miRNA Targeting BnaGARPs

In plants, miRNAs are important regulators of gene expression and play pivotal roles in abiotic stress responses [41]. To identify whether miRNAs are involved in the regulation of the BnaGARP expression, we identified 29 putative miRNAs targeting 34 BnaGARPs (Figure 7). Some of the miRNA-targeted sites are presented in Figure S3, while the detailed information of all miRNAs targeted genes is presented in Table S10. The results showed that four members of the bna-miR164 family targeted three BnaGARPs (including BnaC3.ARR1, BnaC6.HHO2, and BnaA7.HHO2). Four members of the bna-miR172 family targeted two BnaGARPs (including BnaC2.ARR18a and BnaC2.ARR18b). Three members of the bna-miR390 family targeted two BnaGARPs (including BnaA3.PHL2 and BnaC3.PHL2). Two members of the bna-miR397 family targeted three BnaGARPs (including BnaC1.PHR1, BnaA1.PHR1, and BnaC7.PHR1). Three members of the bna-miR156 family targeted BnaC2.ARR18b. One member of the bna-miR6029 family targeted four BnaGARPs (including BnaA6.HRS1, BnaC5.HRS1, BnaA6.PHL6, and BnaCnn.PHL6). One member of the bna-miR860 family targeted eight BnaARRs (Figure 7; Table S10). Predominantly, BnaA3.ARR2, BnaC3.ARR1, BnaC6.HHO2 and BnaC2.ARR18b were predicted to be targeted by several miRNAs (Figure 7; Table S10).

2.7. Transcriptional Analysis of BnaGARPs under N and Pi Stresses

Nitrogen (N) is an essential macronutrient for plant growth and development, whereas rapeseed has a low NUE [42]. To improve the understanding of the role of BnaGARPs in NUE regulation in B. napus, the transcriptional responses of BnaGARPs were explored under low N conditions. Under limited NO3 conditions, 40 members of BnaGARPs were differentially expressed in rapeseed plants compared to sufficient NO3 (Figure 8). In the BnaNIGT1/HRS1/HHOs subfamily, most members were downregulated (87.88–98.12%) in the shoots under low NO3 supply. Notably, the expression levels of BnaC7.HHO3 and BnaA9.HHO1 decreased by 98.12% and 97.60% in the shoots, respectively. In the roots, the expression levels of BnaC9.HHO1 and BnaA9.HHO1 was reduced by 98.62% and 99.55% under low NO3 supply, respectively (Figure 8A). However, different BnaGARPs subfamilies showed distinct transcriptional responses under this circumstance. In detail, most (70%) of the differentially expressed genes (DEGs) of the BnaGLKs subfamily were upregulated in the shoots or roots under deficient NO3 conditions (Figure 8B). In particular, the expression level of BnaA6.GLK2 decreased by 60.37% in the roots, whereas the expression level of BnaA2.GLK2 was increased 1.15-fold in the shoots. In terms of the ARR subfamily, the expression level of BnaA3.APRR2 and BnaC3.ARR1 was repressed by 53.55% and 66.89% in the roots of rapeseed plants exposed to deficient NO3 conditions (Figure 8D). In the BnaPHLs subfamily, the expression level of BnaAnn.PHL5 was increased 1.47-fold in the roots, whereas the expression level of BnaC9.PHL1 was decreased by 79.90% in the shoots (Figure 8C).
To determine the core members that play a dominant role in the NO3 response, a co-expression network analysis of BnaGARPs was performed. The results showed that BnaA9.HHO1 and BnaC7.HHO3 might play a major role in the repression of N-starvation responses in the shoots (Figure 8E); whereas in the roots, BnaA9.HHO1 and BnaC9.HHO1 might play a core role in the adaptation of rapeseed plants to N limitation (Figure 8F).
Under the ammonium (NH4+) supply condition, a total of 23 BnaGARP DEGs were identified in the shoots and roots relative to the condition of NO3 sufficiency (Figure 9A). We found only the expression levels of BnaA8.HHO5, BnaA1.HHO5, and BnaC3.HHO5 were increased by 1.51-fold, 1.24-fold, and 1.44-fold under the NH4+ supply condition than under NO3 sufficiency. Among all the down-regulated genes, particularly the expression level of BnaA6.HHO1 was reduced by 99.28% in the roots under the NH4+ supply condition.
Gene co-expression network analysis showed that BnaA9.HHO1, BnaA7.HHO3 and BnaA6.HHO1 might play a core role in the responses of rapeseed plants to NH4+ as the sole N nutrient source (Figure 9B,C).
Based on expression pattern analysis and co-expression network analysis, we selected several key genes and analyzed their differential expression between the high-NUE (H12) and low-NUE (L73) rapeseed cultivars (Figure 10A). The results showed that these genes were upregulated (1.53 to 6.64-fold) in the L73 rapeseed cultivar under NO3 limitation condition (Figure 10B). In order to explore the role of these key genes involved in the regulation of differential NUE between the rapeseed genotypes, BnaA9.HHO1 was selected to perform a functional analysis. The results showed that the BnaA9. HHO1 fusion protein was mainly located in the nucleus and could colocalize with OsGhd7 in the nucleus (Figure 10C).
Phosphate (Pi) performs a variety of biological functions, including structural elements in nucleic acids and phospholipids, signal transduction cascades, enzyme regulation, and so on [43]. Maeda et al., found that two independent transcriptional cascades for NO3 and Pi-starvation signaling are integrated via expression control of the GARP-clade genes [10]. Under Pi limitation conditions, a total of 45 BnaGARP DEGs were identified in the shoots or roots (Figure 11). In the shoots, most of the DEGs were upregulated except for BnaC7.GLK2, BnaA6.HHO6, and BnaC1.PHL2, which were downregulated. In the BnaNIGT1/HRS1/HHO subfamily, BnaC7.HHO1, BnaC8.HRS1b and BnaA9.HHO1 were remarkably upregulated, increasing by 6.78, 8.26, and 5.03-fold, respectively (Figure 11A). The expression levels of BnaA7.ARR11 and BnaA6.PCL1 had higher expression levels that were increased by 2.86-fold and 2.50-fold in the shoots under Pi deficiency than Pi sufficiency (Figure 11B,C). In terms of the BnaPHLs subfamily, the expression level of BnaA9.PHL1 was decreased by 59.61%, while the expression level of BnaC6.PHL8b was increased by 1.02-fold in the roots under low Pi (Figure 11D).

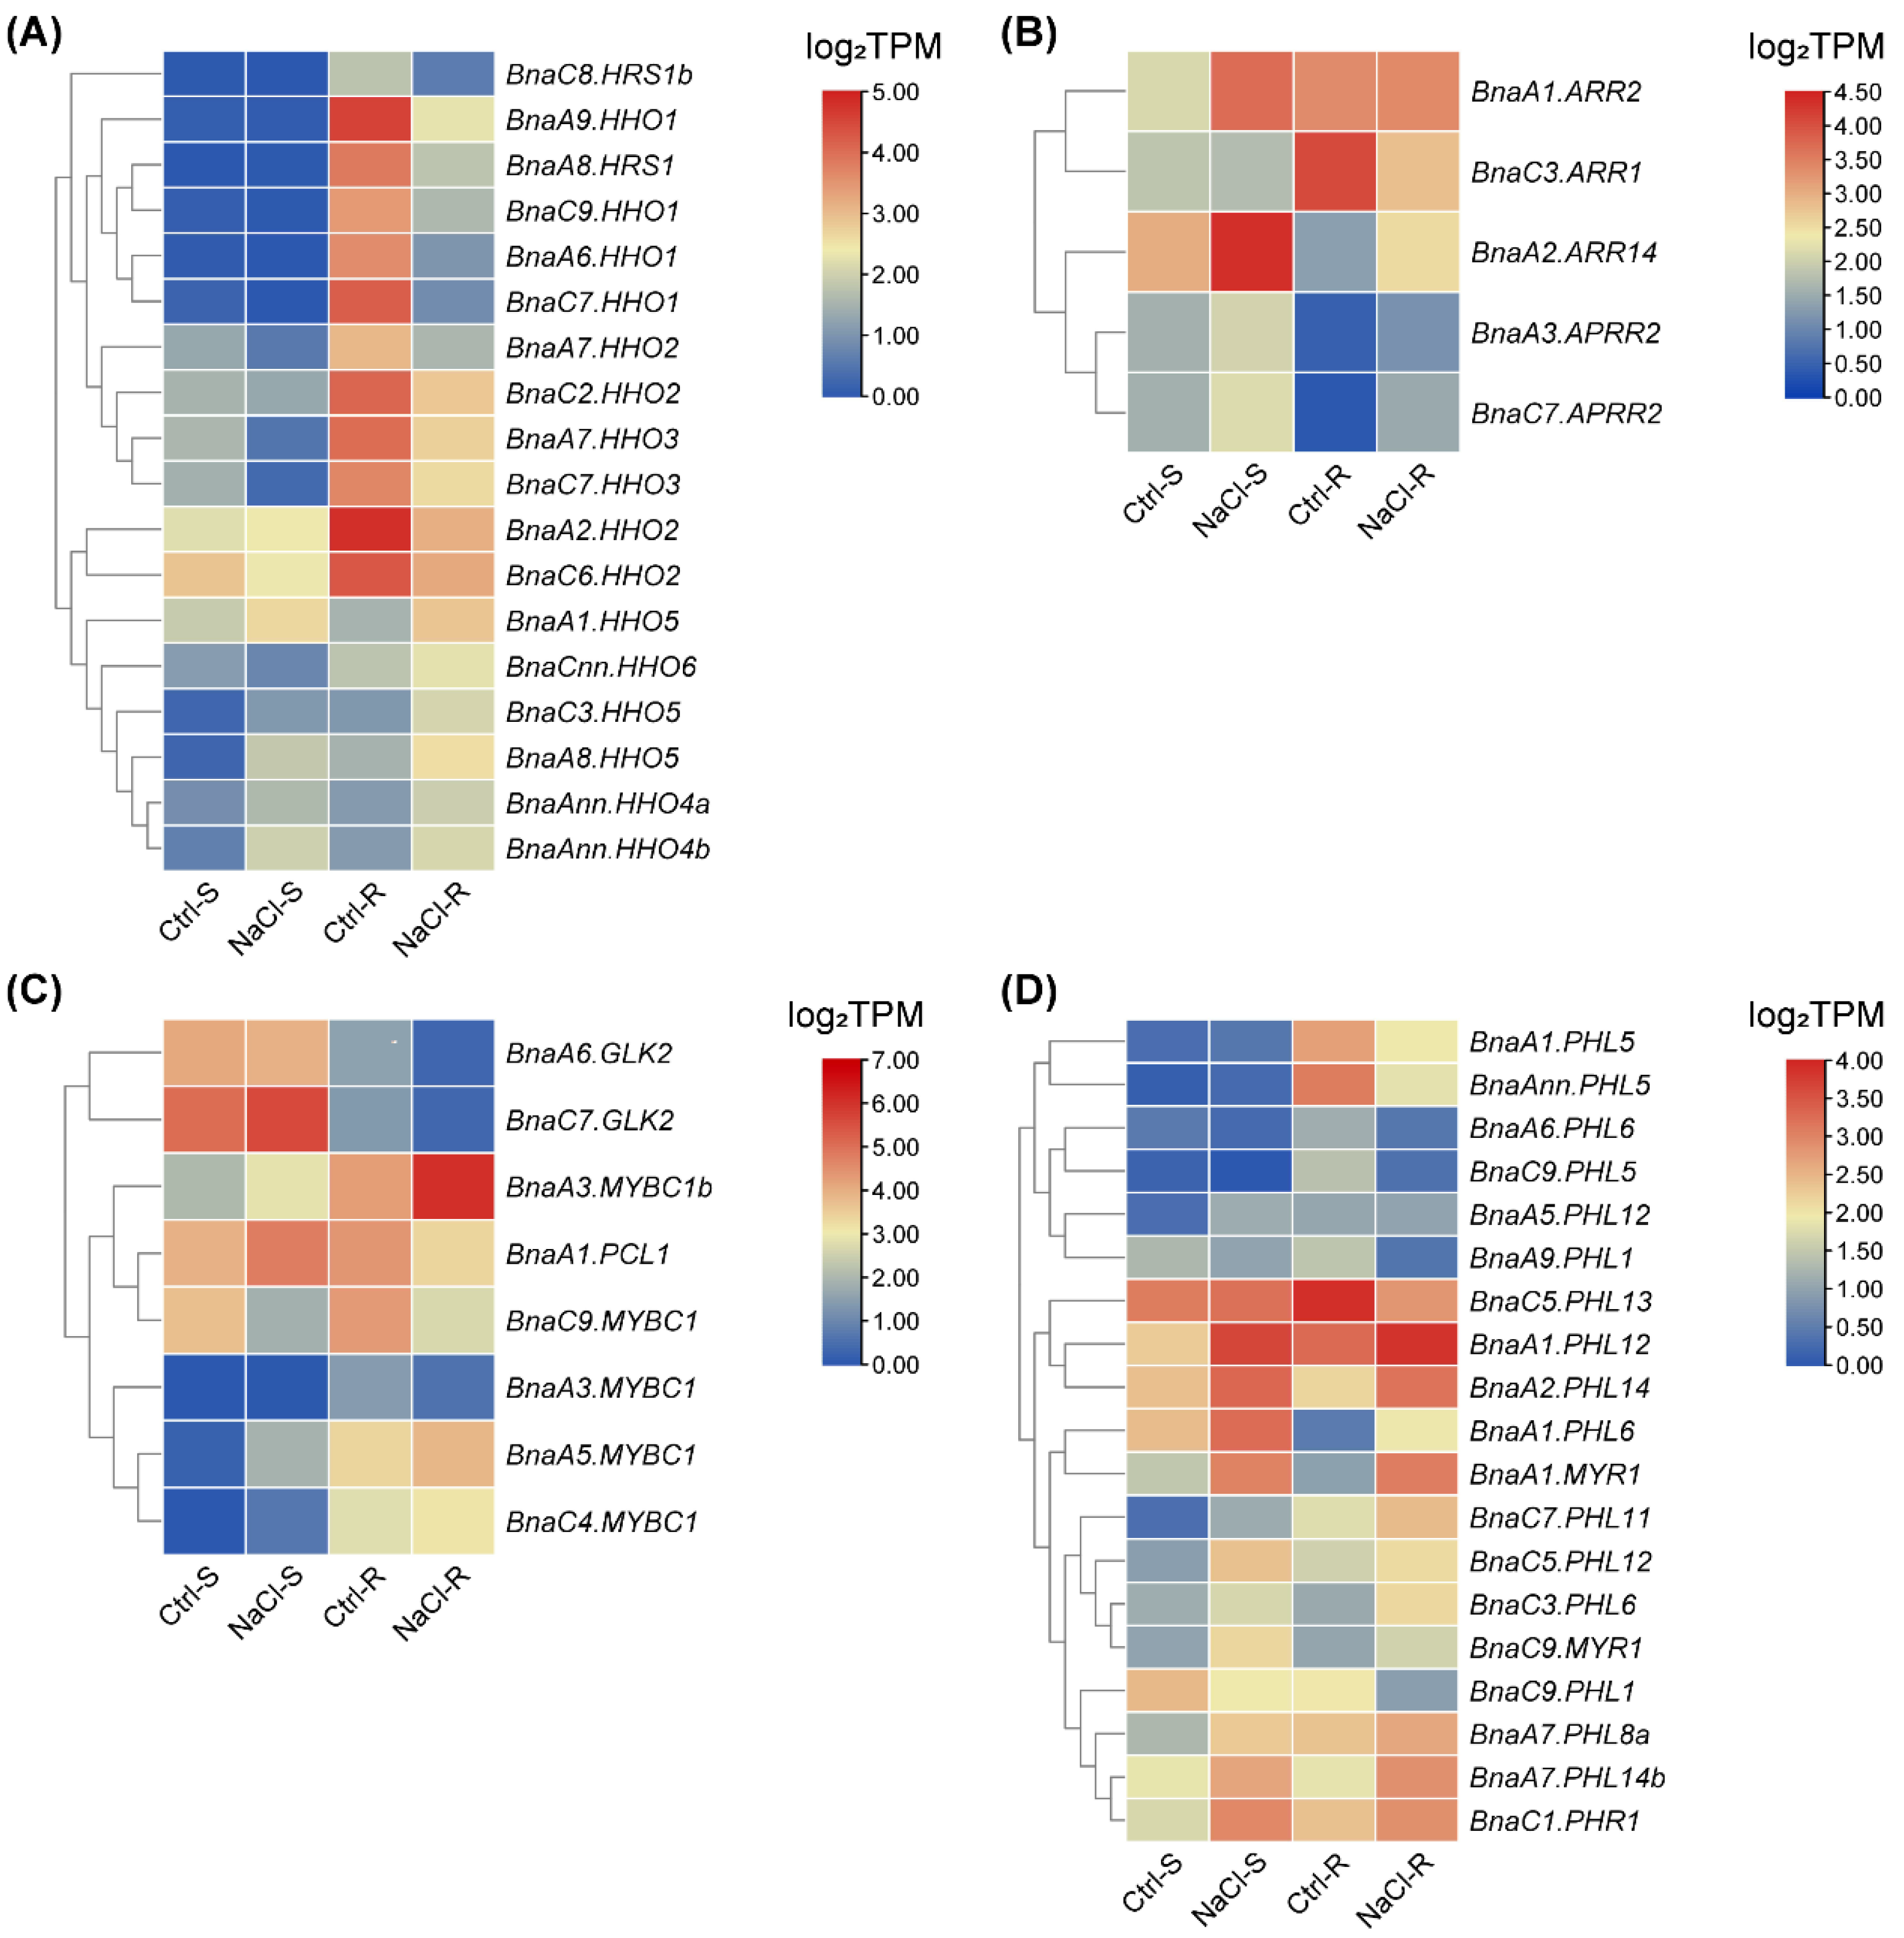
2.8. Expression Profiles of BnaGARPs in Response to Diverse Nutrient Stresses

Further, the expression patterns of BnaGARPs under various nutrient stresses were studied, including deficient boron (B), salt stress, and cadmium (Cd) toxicity. The B requirement of plants varies from species to species, and B. napus is considered one of the highest B-requiring plants, which often suffers from yield and quality losses due to B deficiency, especially in Northern Europe, Canada, and China [44]. Under deficient B conditions, a total of 49 BnaGARP DEGs were identified in the shoots or roots. In the shoots, 39 DEGs were upregulated after B deficiency treatment (Figure 12). In particular, the expression level of BnaAnn.PHL11 was increased 4.01-fold. In the BnaARR-Bs subfamily, the expression of three BnaARRs (including BnaA2.ARR14, BnaA7.ARR11, and BnaC6.ARR11a) was increased in the shoots after B deficiency treatment (Figure 12B). In the subfamily BnaGLKs, most of the genes had high expression levels (1.05 to 1.71-fold) under B deficiency than B sufficiency, whereas the expression of BnaC1.PCL1 was reduced by 57.81% (Figure 12C). The expression pattern in subfamily BnaNIGT1/HRS1/HHOs and BnaPHL1s was similar to that in the subfamily of BnaGLKs. In the shoots, only BnaA6.HHO6 and BnaC1.PHL2 was downregulated (Figure 12D). Eight of 15 (53.33%) DEGs in the BnaNIGT1/HRS1/HHO subfamily and 15 of 18 (83.33%) DEGs in subfamily BnaPHLs were significantly induced by B deficiency.
Cd is a non-essential heavy metal with high biotoxicity to many organisms, while oilseed rape has a high potential for the phytoremediation of Cd-polluted soils [45]. Under Cd toxicity, a total of 43 BnaGARP DEGs were identified in the shoots or roots (Figure 12F). Most genes were downregulated in the roots in response to Cd toxicity, particularly the expression of BnaC5.KAN2b and BnaCnn.PHL6 was reduced by 88.12% and 89.38%. In the shoots, Cd toxicity resulted in an obvious decrease in the expression of BnaA1.PHL5. Under Cd toxicity condition, BnaA8.HHO5 was significantly increased by 2.92-fold in the roots.
Salt stress is one of the most important abiotic factors affecting global agricultural productivity, inhibiting plant growth, development and productivity by disrupting many physiological and biochemical processes [46]. In the salt stress-treated group, the expression of two BnaARRs (including BnaA1.ARR2 and BnaA2.ARR14) was induced by 1.53 and 1.14-fold in the shoots, whereas the expression of BnaC3.ARR1 was significantly decreased (Figure 13). In the roots, BnaA2.ARR14, BnaA3.APRR2, and BnaC7.APRR2 was upregulated by salt stress, while the expression of BnaC3.ARR1 was decreased by 61.96% (Figure 13B). Under salt stress, BnaA3.MYBC1, BnaA6.GLK2 and BnaC9.MYBC1 in the BnaGLK subfamily showed a low expression level in both roots and shoots; however, BnaA3.MYBC1b, BnaA5.MYBC1 and BnaC4.MYBC1 in this subfamily shared higher expression levels under salt stress (Figure 13C). In terms of BnaNIGT1/HRS1/HHO subfamilies, most of them had lower expression levels (40.90% to 87.24%) under salt stress (Figure 13A). After salt treatment, the expression of 16 BnaPHLs was distinctly upregulated in the shoots, while the expression of eight BnaPHLs was obviously downregulated in the roots (Figure 13D).
To characterize the common genes responsive to nutrient stresses, a Venn diagram was constructed with the DEGs identified, respectively, under the diverse nutrient stresses above-mentioned. As shown in Figure 14, BnaA9.HHO1 and BnaA1.HHO5 was simultaneously regulated by low NO3, NH4+ toxicity, limited Pi, deficient B, salt stress, and Cd toxicity in the shoots and roots (Figure 14). This result indicated that BnaA9.HHO1 and BnaA1.HHO5 might play a multifaceted role in regulating rapeseed resistance to nutrient stresses.

3. Discussion

Previous studies have shown that the GARP family members play critical roles in phytohormone transport and signaling, plant organ development, and nutrient responses [47,48,49]. However, there have been few systematic studies on GARPs in B. napus. In the present study, the genome-scale GARP family genes were identified in B. napus and their phylogenetic relationships, conserved motif and domain, gene structures, duplication and synteny relationships, CREs, and chromosomal locations were performed. In addition, we delineated the differential expression profile of BnaGARPs under low NO3, NH4+ toxicity, limited Pi, deficient B, salt stress, and Cd toxicity. The global identification of BnaGARPs provides the foundation for further in-depth functional studies of these genes.

3.1. An Integrated Bioinformatics Analysis Provided Comprehensive Insights into the Molecular Features of BnaGARPs

In this study, a total of 146 BnaGARPs were identified (Table S1). A previous study has revealed 56 GARPs in A. thaliana, 69 GARPs in Camellia sinensis, and 35 GARPs in S. polyrhiza [8,10,50], suggesting that the GARP TF family is ubiquitous in plants (Table S11). The GARP gene family in rapeseed is larger than those in other plant species, which might be due to complex whole genome duplication and subsequent evolution of the rapeseed genome. [51]. Phylogenetic analysis showed that the B. napus genome retains the orthologs of AtGARPs and the gene phylogeny roughly followed the species phylogeny (Figure 1). Furthermore, the phylogenetic tree also showed that all subfamilies have expanded during the evolution process. A lineage-specific expansion of BnaGARP via the partial alteration of the genome is used to adapt to internal and external environments during evolution [52,53]. Generally, the Ka/Ks ratios for all the homologous GARP pairs were less than 1.0, indicating that BnaGARPs might have undergone purifying selection pressure (Table S2). Arabidopsis and Brassica diverged about 20 million years ago, and evolutionary selection pressure analysis suggested that the divergence of GARPs also occurred during this period.
Due to the similarity between the B-motif and the MYB-like domain, the GARP TFs were frequently mistaken for MYB or MYB-like TFs. However, the MYB TFs contain the (SHAQK(Y/F) F) motif, while the GARP TFs contain a different consensus sequence (SHLQ (K/M) (Y/F)) [5]. All the BnaGARPs were predicted to contain some conserved motifs, which are components of the B-motif and are important for DNA binding (Figure 2). In this study, the conserved motifs in each subfamily of BnaGARPs are essentially similar, indicating that their amino acid residues are very conserved in terms of evolution, and have essential roles in gene function or structure. In addition, we found that BnaNIGT1/HRS1/HHO subfamily contains two different motifs EAR-like at their N or C terminal. The EAR-like motifs play an important role in inhibiting gene expression as transcription repressors or recruit corepressors [54]. In this study, different gene structures were found among BnaGARPs, and BnaNIGT1/HRS1/HHO subfamily had fewer exons than the BnaPHL subfamily, implying structural diversification among the BnaGARP subfamilies (Figure 3). The differences in the intron lengths suggested a possible role in the functional diversification of BnaGARPs. Chromosomal localization results showed that 146 genes are unevenly distributed on 20 chromosomes, presumably due to multiple polyploidization events in the genome of oilseed rape during its evolution [55]. Previous research revealed that tandem duplication events or segmental duplication events act as a mechanism for family expansion, and it also could promote the emergence of new functional genes that plants can better cope with abiotic stress during evolution [56,57].
To further elucidate the synteny relationships of BnaGARPs with GARPs in other model plants, we identified 172, 152, 66, 3, and 1 orthologous gene pairs between BnaGARPs with other GARPs in G. max, A. thaliana, M. truncatula, O. sativa, and T. aestivum, respectively (Figure 5). Synteny analysis results suggested that some BnaGARPs possibly came into being during gene duplication, and the segmental duplication events could play key roles in the expansion of GARP genes in B. napus [58]. In addition, B. napus and A. thaliana shared 152 syntenic gene pairs within the GARP family, indicating that B. napus and A. thaliana are closely evolutionarily related. Additionally, the allotetraploid Brassica napus L. (AnAnCnCn, 2n = 4x = 38) was formed by natural distant hybridization of diploid Brassica rapa L. (ArAr, 2n = 2x = 20) and diploid Brassica oleracea L. (CoCo, 2n = 2x = 18) [59]. In the present study, 45 duplication events took place on the An sub-genome, 36 events on the Cn sub-genome, and 136 events across An/Cn sub-genomes. Therefore, we proposed that the BnaGARP expansion is a synergistic effect of polyploidization and hybridization working together [60].
The CREs in the promoter regions play an important role in regulating and functioning genes [61]. In this study, the CRE analysis confirmed the potential roles of BnaGARPs in the regulation of stress resistance (Figure 6). Many stresses and phytohormone-related CREs were identified in the promoter regions of most GARPs, including the ARE, G-box, MBS, and LTR elements. The most common CREs were light responsiveness CREs. Studies have confirmed that AtHHO4 can interact with JMJ30, which is the H3K36Me2 demethylase and is involved in light-responsive circadian clock [62].
MicroRNAs (miRNAs) are crucial non-coding regulators of gene expression in plants [63] and play essential roles in plant–environment interactions [64]. Over the past few years, a number of miRNAs have been recognized through genome-wide examination in rapeseed to participate in diverse nutrient stresses [38,65]. In this study, we identified 29 miRNAs targeting 34 BnaGARPs (Figure 7; Tables S4–S8). miRNA164 has been reported to be involved in lateral root development in maize (Zea mays L.) [66]. miRNA156 has been reported to be significantly upregulated under dehydration stress responsiveness in different species [67]. Similarly, miR172 has also been found to regulate drought escape and drought tolerance by affecting sugar signaling in A. thaliana [68]. miR396 is a conserved miRNA and is involved in plant growth, development, and abiotic stress response in various plant species through regulating its targets, Growth Regulating Factor (GRF) TFs [69]. Some miRNAs have also been reported in rapeseed, playing a significant role in rapeseed genetic improvement [70,71]. These findings suggest that these bna-miRNAs might play pivotal roles against a variety of stresses by modifying the transcriptional or translational levels of BnaGARPs.

3.2. Differential Expression Profiling of BnaGARPs Implied Their Potential Involvement in the Responses of Rapeseed to Diverse Nutrient Stresses

TFs regulate gene expression by recognizing and combining CREs on the promoter regions of target genes [72]. TFs play key roles in plant developmental processes, phytohormone signaling pathways, and disease resistance responses. Given that expression patterns can lead to the estimation of gene functions [73]. For example, through analyzing the expression profile of TaWRKY family members under drought, cold, and high-temperature conditions, a considerable number of TaWRKY genes are shown to respond to drought stresses [3]. When exposed to ZnSO4 and FeCl3 solutions, the TaZIP genes showed differential expression patterns [74].
Previous studies have confirmed that GARPs play an important role in nutrient sensing [6]. The first GARP TF shown to be involved in nutritional responses was the Chlamydomonas phosphorus-stress response 1 (Psr1) [75]. Under Pi starvation, OsPHR2 binds to a CRE (P1BS) in the promoter of various PSI genes and upregulates their transcription, thus optimizing rice Pi acquisition and utilization [76]. Another GARP subfamily that attracted recently lots of attention was NIGT1/HRS1/HHO subfamily. NIGT1/HRS1/HHOs have recently been confirmed to be involved in the perception and transduction of N and Pi nutritional signals in plant transcriptional regulatory networks [27].
In this study, we found that most BnaGARPs were significantly downregulated in the shoots or roots under NO3 limitation conditions, among which the downregulated levels of BnaNIGT1/HRS1/HHOs were the highest (Figure 8). This finding highlighted the crucial role of BnaNIGT1/HRS1/HHOs in the regulation of NO3 starvation. It has been demonstrated that NIGT1(HHO1-HHO3, HRS1) expression was induced by NO3 signaling, and it also inhibited N starvation response (NSR) genes (NRT2.1 and NRT2.4) under N sufficient conditions [10]. The GARP TFs modulate the expression of target genes by positive or negative feedforward mechanisms under abiotic stress [10]. For example, AtNIGT1/HRS1 binds to the promoter of NRT2.4 and represses an array of N starvation-responsive genes under conditions of high N availability [77]. HRS1 and HHO1 control ROS accumulation in response to NSR and directly repress NSR sentinel genes (NRT2.5) [78]. NLPs (including NLP5 and NLP7) expression were downregulated by NLP-induced NIGT1s [10]. SPX1, SPX2, and SPX4 are putative Pi-dependent inhibitors of Arabidopsis PHOSPHATE STARVATION RESPONSE1 (PHR1) [79]. To improve the understanding of BnaGARP-mediated transcriptional networks under abiotic stress responses, the transcriptional responses of 25 target genes were explored under these circumstances (Figure S4). Under NO3 limitation conditions, BnaAn.NRT2.4, BnaC9.NRT2.4, and BnaA8.NRT2.5 were upregulated, while BnaA7.NLP5 and BnaC6.NLP5 also shared higher expression levels. It indicates that BnaNRT2.4 and BnaNLP5 might play key roles in the BnaGARP-mediated transcriptional networks.
NH4+ is also a major N source for plants, and it is also an indispensable intermediate in the biosynthesis of essential cellular components [80]. In general, compared with NO3, NH4+ as the sole N nutrient source had a weakened effect on the transcriptional responses of BnaGARPs. Under Pi limitation conditions, most of the BnaGARP DEGs were upregulated in the shoots or roots, among which the upregulated levels of BnaC8.HRS1b was the highest (Figure 11). Previous studies have reported Pi deprivation increased the HRS1 expression level and expanded its expression domain [81]. Transcripts of SPX1 and SPX2 accumulate in the roots and shoots of Pi-limited plants in a PHR1-dependent manner [82]. In this study, BnaSPX1 and BnaSPX2 were upregulated in the roots and shoots under Pi-limited conditions. Moreover, we found no differences in the expression of BnaKANs under both NO3 limitation and NH4+ toxicity conditions. A previous study has revealed that AtKANs regulate auxin biosynthesis, transport, and signaling [12]. Therefore, BnaKANs might be not involved in N absorption and utilization.
The expression patterns of BnaGARPs were also studied under various nutrient stresses. Under deficient B conditions, most BnaGARP DEGs were upregulated. Therefore, it could be concluded that BnaGARPs are also involved in response to B deficiency and might play important roles in B absorption in B. napus (Figure 12). Most members of the BnaGARPs have been shown to play a role in salt stress [18,83,84]. For instance, HRS1 has transcriptional repressive activity and appears to suppress the expression of factors that negatively regulate salt tolerance, ZmGLK3, SlGLK7, and SlGLK15 were upregulated under salt stress. In our results, we found that the expression level of BnaHRS1 was significantly downregulated after salt stress (Figure 12). In the roots, BnaA6.GLK2 and BnaC7.GLK2 were upregulated. These results suggested that homologous genes should have similar expression patterns under abiotic stress. Moreover, most BnaGARP DEGs were downregulated under Cd toxicity (Figure 12F). It is worth noting that although some differential genes of BnaGARPs have been found, there are still some genes that have not been identified, which may be the problem of variety, expression site, and genome assembly.
In short, BnaGARPs were responsive to diverse nutrient stresses, which implied the essential roles of BnaGARPs in the resistance or adaptation of rapeseed to stresses.

3.3. BnaNIGT1/HRS1/HHOs Might Be Major Regulators of N-Starvation Responses

It has been reported that NIGT1/HRS1/HHOs were key regulators involved in plant response to limited NO3 conditions. In Arabidopsis, the NIGT1/HRS1/HHO subfamily directly represses the expression of the NRT2 genes (including NRT2.1, NRT2.4, and NRT2.5), NLP TFs directly activate genes encoding NIGT1/HRS1/HHO family TFs [10]. In rice, the overexpression of NIGT1 might have a negative effect on NUE and thus reduce the chlorophyll content [85]. In this study, BnaNIGT1/HRS1/HHOs were significantly downregulated under N-starvation responses (Figure 7). Among all the BnaNIGT1/HRS1/HHO DEGs, the transcription levels of BnaA9.HHO1 and BnaC9.HHO1 was most obviously downregulated. Furthermore, GFP-assisted subcellular localization analysis showed that BnaA9.HHO1 was localized in the nucleus (Figure 9). Based on the co-expression network analysis and Venn diagram, we proposed that it was BnaHHO1s that might be the core genes in the N starvation response. However, functional validation is needed to reveal the in-depth functional roles of BnaNIGT1/HRS1/HHOs.

4. Materials and Methods

4.1. Identification of GARP Family Genes in Plants

In this study, the genomic, coding sequences, and protein sequences from A. thaliana and B. napus (Brana_ Dar_V5 genome) were downloaded from the Arabidopsis Information Resource (TAIR10, https://www.arabidopsis.org/, accessed on 1 October 2022) [86] and the Brassica Database (BRAD V3.0, http://brassicadb.cn/#/, accessed on 1 October 2022) [87]. To identify the GARP genes in these species, 56 GARP protein sequences from Arabidopsis were used as queries in a reciprocal Basic Local Alignment Search Tool (BLAST) analysis using the threshold and minimum alignment coverage parameters described previously [6,88]. All the GARP protein sequences were confirmed by comparison with GARP member sequences through searches of the Pfam (V35.0, http://pfam.xfam.org/, accessed on 1 October 2022) [89] and NCBI-CDD (https://www.ncbi.nlm.nih.gov/Structure/bwrpsb/bwrpsb.cgi, accessed on 1 October 2022) [90] database. The protein length, molecular weight (MW), and isoelectric point (pI) of each GARP protein were predicted using the ExPASy server (https://web.expasy.org/protparam/, accessed on 1 October 2022) [91].
The genes in Brassica species were named as follows: abbreviation of species name + chromosome + the name of gene homologs in A. thaliana. For example, BnaC1.APRR2 represents a gene homologous to APRR2 in A. thaliana on the C1 chromosome of B. napus.

4.2. Phylogenetic Analysis of the GARP Family in B. napus

Multiple sequence alignments of the GARP coding sequences between B. napus and A. thaliana were conducted using ClustalW2 (http://www.genome.jp/tools-bin/clustalw, accessed on 1 October 2022) [92] with default parameters. The phylogenetic trees were generated using the Molecular Evolutionary Genetics Analysis (MEGA) 7.0 program (https://megasoftware.net/home, accessed on 1 October 2022) [93] with the NJ method, the p-distance + G substitution model, 1000 bootstrap replications, and conserved sequences with a coverage of 70%. The phylogenetic trees were visualized using iTOL (V5, https://itol.embl.de/, accessed on 1 October 2022) [94]. The coding sequence alignments were imported into KaKs_calculator (https://ngdc.cncb.ac.cn/biocode/tools/BT000001, accessed on 1 October 2022) [95] to calculate the synonymous mutation rate (Ks) and non-synonymous mutation rate (Ka) using the NG method The time (T) of duplication in millions of years (Mya)was estimated with the formula T = Ks/2λ (λ = 1.5 × 10⁻⁸) [96].

4.3. Motif Identification and Gene Structure Analysis

Conserved motifs in the proteins were identified using the Expectation Maximization for Motif Elucidation program (MEME v4.12.0, https://meme-suite.org/meme/, accessed on 1 October 2022) [97] with the following parameter settings: the maximum number of motifs was 10. The conserved domains of GARPs were confirmed by NCBI-CDD search. TBtools was used to visualize the motifs and conserved domains of candidate genes. The gene structure was visualized by Gene Structure Display Server (2.0, http://gsds.gao-lab.org/, accessed on 1 October 2022) [98].

4.4. Chromosomal Locations and Synteny Analyses

Information about the physical locations of the GARP genes in the genomes of B. napus was collected from the BRAD database, and their positions were drafted to chromosomes by using MapGene2Chrom (http://mg2c.iask.in/mg2c_v2.1/, accessed on 1 October 2022) [99].
To uncover the evolutionary linear relationships within species and with ancestral species, the MCScanX plugin in TBtools V1.098 [100] was used to perform a collinearity analysis of B. napus. The circos plots of BnaGARs were generated by the Circos plugin in TBtools [101].

4.5. CRE Analysis

The CREs in the promoter regions of genes are considered to be related to the regulation of genes. In order to further investigate the potential regulatory network of GARPs, the 2000 bp upstream genomic DNA sequences of these genes’ start codon were submitted to PlantCARE (http://bioinformatics.psb.ugent.be/webtools/plantcare/html/, accessed on 1 October 2022) [102] to obtain CREs.

4.6. Prediction of Putative miRNA Targeting BnaGARPs

The cDNA sequences of BnaGARPs were used to identify possible target miRNAs in the psRNATarget database (V. 2017, Available online: https://www.zhaolab.org/psRNATarget/, accessed on 1 October 2022) [103] with default parameters, except maximum expectation (E) = 5.0. The targeted sites with high degrees of complementarity were selected. Cytoscape software (V3.8.2, https://cytoscape.org/download.html, accessed on 1 October 2022) [104] was used to create the interaction network between the prophesied miRNAs and the equivalent target BnaGARPs.

4.7. Plant Materials and Treatments

The B. napus seedlings (Darmor-bzh) germinated in this experiment. “Darmor-bzh” are a French winter oilseed rape variety, whose reference genome sequence was first published in 2014 [59].
First, plump B. napus seeds were selected, disinfected with 1% NaClO for 10 min, cleaned with ultra-pure water, soaked overnight at 4 °C, and then sown on the seedling tray. The 7-d old uniform B. napus seedlings after seed germination were transplanted into black plastic containers with 10 L Hoagland nutrient solution. The basic nutrition solution contained 1.0 mM KH2PO4, 5.0 mM KNO3, 5.0 mM Ca(NO3)2·4H2O, 2.0 mM MgSO4·7H2O, 0.050 mM EDTA-Fe, 9.0 μM MnCl2·4H2O, 0.80 μM ZnSO4·7H2O, 0.30 μM CuSO4·5H2O, 0.10 μM Na2MoO4·2H2O, and 46 μM H3BO3. The rapeseed seedlings were cultivated in an illuminated chamber following the growth regimes: light intensity of 300–320 μmol m−2 s−1, temperature of 25 °C daytime/22 °C night, light period of 16 h photoperiod/8 h dark, and relative humidity of 70% [105].
To further analyze the expression patterns of BnaGARPs under different nutrient stresses, five treatments were set. For the NO3 depletion treatment, the 7-d old uniform B. napus seedlings were hydroponically cultivated under high (6.0 mM) NO3 for 10 d, and then were grown under low (0.30 mM) NO3 for 3 d until sampling. For the NH4+ toxicity treatment, the 7-d-old uniform B. napus seedlings after seed germination were hydroponically cultivated under high NO3 for 10 d and then were grown under N-free conditions for 3 d. Finally, the plants were grown under excess (9.0 mM) NH4+ for 6 h until sampling. For the inorganic Pi starvation treatment, the 7-d-old uniform B. napus seedlings after seed germination were first hydroponically grown under 250 μM Pi (KH2PO4) for 10 d, and then were grown under 5 μM Pi for 3 d until sampling. For the salt stress treatment, the 7-d-old uniform B. napus seedlings after seed germination were hydroponically cultivated in a NaCl-free solution for 10 d and then were transferred to 200 mM NaCl for 1 d until sampling. In the B deficiency treatment, the 7-d-old uniform B. napus seedlings after seed germination were first hydroponically grown under 10 μM H3BO3 for 10 d, and then were transferred to 0.25 μM H3BO3 for 3 d until sampling. For the Cd toxicity treatment, the 7-d-old uniform B. napus seedlings after seed germination were hydroponically cultivated in a Cd-free solution for 10 d and then were transferred to 10 μM CdCl2 for 12 h until sampling. In addition, a high-NUE (H73) and a low-NUE (L12) rapeseed cultivar were also used for the experiment under nitrate limitation conditions [106].
The shoots and roots of fresh rapeseed seedlings above-mentioned were sampled separately and were immediately stored at 80 °C. Each sample contained three independent biological replicates for the transcriptional analyses of BnaGARPs under diverse nutrient stresses.

4.8. Transcriptional Analysis of BnaGARPs under Diverse Nutrient Stresses

A total of 12 RNA samples from each treatment were subjected to an Illumina HiSeq X Ten platform (Illumina Inc., San Diego, CA, USA). The illumine RNA-seq data were analyzed to reveal the transcriptional responses of BnaGARPs under diverse nutrient stresses. To identify the DEGs between different samples/groups, the expression level of each gene was calculated according to the TPM method. RSEM (http://deweylab.biostat.wisc.edu/rsem/, accessed on 1 October 2022) [107] was used to quantify gene abundances. Essentially, differential expression analysis was performed using DESeq2 [108], and the DEGs with |log2 (FC)| ≥ 1 and P-adjust ≤ 0.05.

4.9. Subcellular Localization Assay

Subcellular localization of target genes was determined using polyethylene glycol-mediated protoplast transformation in Arabidopsis [109]. OsGhd7 was used as a nuclear marker and fused with a red fluorescent protein sequence [110]. Fluorescence was observed using a Nikon C2-ER confocal laser-scanning microscope with emission filters set at 510 nm (GFP) and 580 nm (RFP), and excitation was achieved at 488 nm (GFP) and 561 nm (RFP).

5. Conclusions

In this study, a systematic genome-wide analysis and molecular characterization of the 146 GARP members in allotetraploid rapeseed was completed. In addition, RNA-seq data showed that BnaGARPs respond to various nutritional stresses Among all DEGs, BnaA9.HHO1 and BnaA1.HHO5 might play a core role in regulating rapeseed resistance to nutrient stresses. However, additional investigations are required to confirm the functional roles of these core genes. The present results would increase the understanding of the evolution of the GARP family genes and provide valuable candidate genes for further study of the transcriptional regulation mechanism in response to nutrient stresses in rapeseed.

Supplementary Materials

The following supporting information can be downloaded at: https://www.mdpi.com/article/10.3390/ijms232214484/s1, Table S1: Basic Physicochemical properties of GARP transcription factors in B. napus; Table S2: Non-synonymous and synonymous nucleotide substitution rates between AtGARPs and the corresponding orthologs in B. napus; Table S3: Segmentally duplicated B. napus GARP genes; Table S4: One-to-one orthologous relationships of the GARP genes between B. napus and A. thaliana; Table S5: One-to-one orthologous relationships of the GARP genes between B. napus and G.max; Table S6: One-to-one orthologous relationships of the GARP genes between B. napus and M. truncatula; Table S7: One-to-one orthologous relationships of the GARP genes between B. napus and T. aestivum; Table S8: One-to-one orthologous relationships of the GARP genes between B. napus and O. sative; Table S9: Type and number of cis-acting elements; Table S10: Prediction of miRNAs target sites; Table S11: Copy number analysis of GARP family genes in A. thaliana, B. napus, Oryza sativa, Camellia sinensis, Spirodela polyrhiza, and Gossypium hirsutum; Table S12: GARP members and protein sequences in B. napus; Figure S1: Identification and characterization of the conserved motifs in the GARP proteins in B. napus; Figure S2: Exon-intron organizations of BnaGARPs; Figure S3: miRNA targeting sites of BnaGARPs; Figure S4: Expression profiles of BnaGARP target genes under diverse nutrient stresses; Figure S5: Synteny analysis of GARP genes between B. napus and O. sativa and T. aestivum.

Author Contributions

Y.-P.H. and T.Z. designed the experiments; Y.-P.H. and P.-J.W. conceived the project, analyzed the data, and wrote the article with contributions of all the authors; T.-Y.Z., J.-Y.H., C.-P.Y., H.-L.S., Y.-F.Z., T.-Y.Z. and J.-F.C., provided technical assistance to Y.-P.H.; T.S. and T.Z. supervised and complemented the writing. All authors have read and agreed to the published version of the manuscript.

Funding

This study was financially supported by the National Natural Science Foundation of China (U21A20236), National Key R&D Program of China (2021YFD1700900), and National Natural Science Foundation of China (31801923).

Institutional Review Board Statement

Not applicable.

Informed Consent Statement

Not applicable.

Data Availability Statement

All the data and plant materials in relation to this work can be obtained through contacting with the corresponding author Dr. Ting Zhou ([email protected]).

Acknowledgments

We are very grateful to the editor and reviewers for critically evaluating the manuscript and providing constructive comments for its improvement.

Conflicts of Interest

The authors declare that they have no competing interest.

Abbreviations

At: Arabidopsis thaliana; Bna: Brassica napus; Bol: Brassica oleracea; Bra: Brassica rapa; BRAD: Brassica Database; CDS: Coding sequence; CRE: cis-acting regulatory element; DEGs: differentially expressed genes; MEME: Multiple expectation maximization for motif elicitation; MW: Molecular weight; N: Nitrogen; NCBI: National Center for Biotechnology Information; NH4+: ammonium; NO3: nitrate; Pi: Inorganic phosphate; TF: transcription factor; NRT: NO3 transporter; NLP: Nodule Inception-like Protein.

References

  1. Yang, T.; Hao, L.; Yao, S.; Zhao, Y.; Lu, W.; Xiao, K. TabHLH1, a bHLH-type transcription factor gene in wheat, improves plant tolerance to Pi and N deprivation via regulation of nutrient transporter gene transcription and ROS homeostasis. Plant Physiol. Biochem. 2016, 104, 99–113. [Google Scholar] [CrossRef] [PubMed]
  2. Jin, J.; Tian, F.; Yang, D.-C.; Meng, Y.-Q.; Kong, L.; Luo, J.; Gao, G. PlantTFDB 4.0: Toward a central hub for transcription factors and regulatory interactions in plants. Nucleic Acids Res. 2017, 45, D1040–D1045. [Google Scholar] [CrossRef] [PubMed] [Green Version]
  3. Ye, H.; Qiao, L.; Guo, H.; Guo, L.; Ren, F.; Bai, J.; Wang, Y. Genome-Wide Identification of Wheat WRKY Gene Family Reveals That TaWRKY75-A Is Referred to Drought and Salt Resistances. Front. Plant Sci. 2021, 12, 663118. [Google Scholar] [CrossRef] [PubMed]
  4. Riechmann, J.L.; Heard, J.; Martin, G.; Reuber, L.; Jiang, C.; Keddie, J.; Adam, L.; Pineda, O.; Ratcliffe, O.J.; Samaha, R.R.; et al. Arabidopsis transcription factors: Genome-wide comparative analysis among eukaryotes. Science 2000, 290, 2105–2110. [Google Scholar] [CrossRef] [PubMed]
  5. Hosoda, K.; Imamura, A.; Katoh, E.; Hatta, T.; Tachiki, M.; Yamada, H.; Mizuno, T.; Yamazaki, T. Molecular structure of the GARP family of plant Myb-related DNA binding motifs of the Arabidopsis response regulators. Plant Cell 2002, 14, 2015–2029. [Google Scholar] [CrossRef] [Green Version]
  6. Safi, A.; Medici, A.; Szponarski, W.; Ruffel, S.; Lacombe, B.; Krouk, G. The world according to GARP transcription factors. Curr. Opin. Plant Biol. 2017, 39, 159–167. [Google Scholar] [CrossRef]
  7. Liu, J.; Mehari, T.G.; Xu, Y.; Umer, M.J.; Hou, Y.; Wang, Y.; Peng, R.; Wang, K.; Cai, X.; Zhou, Z.; et al. GhGLK1 a Key Candidate Gene From GARP Family Enhances Cold and Drought Stress Tolerance in Cotton. Front. Plant Sci. 2021, 12, 759312. [Google Scholar] [CrossRef]
  8. Yue, C.; Chen, Q.Q.; Hu, J.; Li, C.; Luo, L.; Zeng, L. Genome-Wide Identification and Characterization of GARP Transcription Factor Gene Family Members Reveal Their Diverse Functions in Tea Plant (Camellia sinensis). Front. Plant Sci. 2022, 13, 947072. [Google Scholar] [CrossRef]
  9. Ueda, Y.; Ohtsuki, N.; Kadota, K.; Tezuka, A.; Nagano, A.J.; Kadowaki, T.; Kim, Y.; Miyao, M.; Yanagisawa, S. Gene regulatory network and its constituent transcription factors that control nitrogen-deficiency responses in rice. New Phytol. 2020, 227, 1434–1452. [Google Scholar] [CrossRef]
  10. Maeda, Y.; Konishi, M.; Kiba, T.; Sakuraba, Y.; Sawaki, N.; Kurai, T.; Ueda, Y.; Sakakibara, H.; Yanagisawa, S. A NIGT1-centred transcriptional cascade regulates nitrate signaling and incorporates phosphorus starvation signals in Arabidopsis. Nat. Commun. 2018, 9, 1376. [Google Scholar] [CrossRef]
  11. Medici, A.; Marshall-Colon, A.; Ronzier, E.; Szponarski, W.; Wang, R.; Gojon, A.; Crawford, N.M.; Ruffel, S.; Coruzzi, G.M.; Krouk, G. AtNIGT1/HRS1 integrates nitrate and phosphate signals at the Arabidopsis root tip. Nat. Commun. 2015, 6, 6274. [Google Scholar] [CrossRef] [Green Version]
  12. Huang, T.B.; Harrar, Y.; Lin, C.F.; Reinhart, B.; Newell, N.R.; Talavera-Rauh, F.; Hokin, S.A.; Barton, M.K.; Kerstetter, R.A. Arabidopsis KANADI1 acts as a transcriptional repressor by interacting with a specific cis-element and regulates auxin biosynthesis, transport, and signaling in opposition to HD-ZIPIII factors. Plant Cell 2014, 26, 246–262. [Google Scholar] [CrossRef] [Green Version]
  13. Gao, P.; Li, X.; Cui, D.J.; Wu, L.; Parkin, I.; Gruber, M.Y. A new dominant Arabidopsis transparent testa mutant, sk21-D, and modulation of seed flavonoid biosynthesis by KAN4. Plant Biotechnol. J. 2010, 8, 979–993. [Google Scholar] [CrossRef]
  14. Dai, S.; Wei, X.; Pei, L.; Thompson, R.L.; Liu, Y.; Heard, J.E.; Ruff, T.G.; Beachy, R.N. Brother of lux arrhythmo is a component of the Arabidopsis circadian clock. Plant Cell 2011, 23, 961–972. [Google Scholar] [CrossRef] [Green Version]
  15. Sun, Y.; Luo, W.; Jain, A.; Liu, L.; Ai, H.; Liu, X.; Feng, B.; Zhang, L.; Zhang, Z.; Guohua, X.; et al. OsPHR3 affects the traits governing nitrogen homeostasis in rice. BMC Plant Biol. 2018, 18, 241. [Google Scholar] [CrossRef] [Green Version]
  16. Rehman, O.U.; Uzair, M.; Chao, H.; Fiaz, S.; Khan, M.R.; Chen, M. Role of the type-B authentic response regulator gene family in fragrant rice under alkaline salt stress. Physiol. Plant. 2022, 174, e13696. [Google Scholar] [CrossRef]
  17. Obertello, M.; Shrivastava, S.; Katari, M.; Coruzzi, G.M. Cross-Species Network Analysis Uncovers Conserved Nitrogen-Regulated Network Modules in Rice. Plant Physiol. 2015, 168, 1830–1843. [Google Scholar] [CrossRef] [Green Version]
  18. Zhao, Z.L.; Shuang, J.R.; Li, Z.G.; Xiao, H.; Liu, Y.; Wang, T.; Wei, Y.; Hu, S.; Wan, S.; Peng, R. Gossypium hirsutumIdentification of the Golden-2-like transcription factors gene family in Gossypium hirsutum. PeerJ 2021, 9, e12484. [Google Scholar] [CrossRef]
  19. Frans, J.M. Physiological functions of mineral macronutrients. Curr. Opin. Plant Biol. 2009, 12, 250–258. [Google Scholar]
  20. Wykoff, D.D.; Grossman, A.R.; Weeks, D.P.; Usuda, H.; Shimogawara, K. Psr1, a nuclear localized protein that regulates phosphorus metabolism in Chlamydomonas. Proc. Natl. Acad. Sci. USA 1999, 96, 15336–15341. [Google Scholar] [CrossRef] [Green Version]
  21. Krouk, G.; Mirowski, P.; LeCun, Y.; Shasha, D.E.; Coruzzi, G.M. Predictive network modeling of the high-resolution dynamic plant transcriptome in response to nitrate. Genome Biol. 2010, 11, R123. [Google Scholar] [CrossRef] [PubMed]
  22. Wang, F.; Deng, M.; Xu, J.; Zhu, X.; Mao, C. Molecular mechanisms of phosphate transport and signaling in higher plants. Semin. Cell Dev. Biol. 2018, 74, 114–122. [Google Scholar] [CrossRef] [PubMed]
  23. O’Brien, J.A.; Vega, A.; Bouguyon, E.; Krouk, G.; Gojon, A.; Coruzzi, G.; Gutiérrez, R.A. Nitrate Transport, Sensing, and Responses in Plants. Mol. Plant 2016, 9, 837–856. [Google Scholar] [CrossRef] [PubMed] [Green Version]
  24. Hua, Y.-P.; Zhou, T.; Song, H.-X.; Guan, C.-Y.; Zhang, Z.-H. Integrated genomic and transcriptomic insights into the two-component high-affinity nitrate transporters in allotetraploid rapeseed. Plant Soil 2018, 427, 245–268. [Google Scholar] [CrossRef]
  25. Verma, P.; Sanyal, S.K.; Pandey, G.K. Ca-CBL-CIPK: A modulator system for efficient nutrient acquisition. Plant Cell Rep. 2021, 40, 2111–2122. [Google Scholar] [CrossRef] [PubMed]
  26. Jagadhesan, B.; Sathee, L.; Meena, H.S.; Jha, S.K.; Chinnusamy, V.; Kumar, A.; Kumar, S. Genome wide analysis of NLP transcription factors reveals their role in nitrogen stress tolerance of rice. Sci. Rep. 2020, 10, 9368. [Google Scholar] [CrossRef]
  27. Li, Q.; Zhou, L.; Li, Y.; Zhang, D.; Gao, Y. Plant NIGT1/HRS1/HHO Transcription Factors: Key Regulators with Multiple Roles in Plant Growth, Development, and Stress Responses. Int. J. Mol. Sci. 2021, 22, 8685. [Google Scholar] [CrossRef]
  28. Ueda, Y.; Kiba, T.; Yanagisawa, S. Nitrate-inducible NIGT1 proteins modulate phosphate uptake and starvation signalling via transcriptional regulation of SPX genes. Plant J. 2020, 102, 448–466. [Google Scholar] [CrossRef]
  29. Puga, M.I.; Mateos, I.; Charukesi, R.; Wang, Z.; Franco-Zorrilla, J.M.; de Lorenzo, L.; Irigoyen, M.L.; Masiero, S.; Bustos, R.; Rodríguez, J.; et al. SPX1 is a phosphate-dependent inhibitor of Phosphate Starvation Response 1 in Arabidopsis. Proc. Natl. Acad. Sci. USA 2014, 111, 14947–14952. [Google Scholar] [CrossRef] [Green Version]
  30. Raza, A.; Razzaq, A.; Mehmood, S.S.; Hussain, M.A.; Wei, S.; He, H.; Zaman, Q.U.; Xuekun, Z.; Hasanuzzaman, M. Omics: The way forward to enhance abiotic stress tolerance in Brassica napus L. GM Crop. Food 2021, 12, 251–281. [Google Scholar] [CrossRef]
  31. Ayyaz, A.; Miao, Y.; Hannan, F.; Islam, F.; Zhang, K.; Xu, J.; Farooq, M.A.; Zhou, W. Drought tolerance in Brassica napus is accompanied with enhanced antioxidative protection, photosynthetic and hormonal regulation at seedling stage. Physiol. Plant. 2021, 172, 1133–1148. [Google Scholar] [CrossRef]
  32. Wassan, G.M.; Khanzada, H.; Zhou, Q.; Mason, A.S.; Keerio, A.A.; Khanzada, S.; Solangi, A.M.; Faheem, M.; Fu, D.; He, H. Identification of genetic variation for salt tolerance in Brassica napus using genome-wide association mapping. Mol. Genet. Genom. 2021, 296, 391–408. [Google Scholar] [CrossRef]
  33. Lei, Y.; He, H.; Raza, A.; Liu, Z.; Xiaoyu, D.; Guijuan, W.; Yan, L.; Yong, C.; Xiling, Z. Brassica napus Exogenous melatonin confers cold tolerance in rapeseed (Brassica napus L.) seedlings by improving antioxidants and genes expression. Plant Signal. Behav. 2022, 17, 2129289. [Google Scholar] [CrossRef]
  34. Shen, X.; Yang, L.; Han, P.; Gu, C.; Li, Y.; Liao, X.; Qin, L. Metabolic Profiles Reveal Changes in the Leaves and Roots of Rapeseed (Brassica napus L.) Seedlings under Nitrogen Deficiency. Int. J. Mol. Sci. 2022, 23, 5784. [Google Scholar] [CrossRef]
  35. Li, Q.; Ding, G.D.; Ningmei Yang, N.; White, P.J.; Ye, X.; Cai, H.; Lu, J.; Shi, L.; Xu, F. Comparative genome and transcriptome analysis unravels key factors of nitrogen use effi-ciency in Brassica napus L. Plant Cell Environ. 2020, 43, 712–731. [Google Scholar] [CrossRef]
  36. Li, Y.; Yang, X.; Liu, H.; Wang, W.; Wang, C.; Ding, G.; Xu, F.; Wang, S.; Cai, H.; Hammond, J.P.; et al. Local and systemic responses conferring acclimation of Brassica napus roots to low phosphorus conditions. J. Exp. Bot. 2022, 73, 4753–4777. [Google Scholar] [CrossRef]
  37. Su, W.; Raza, A.; Gao, A.; Jia, Z.; Zhang, Y.; Hussain, M.A.; Mehmood, S.S.; Cheng, Y.; Lv, Y.; Zou, X. Genome-Wide Analysis and Expression Profile of Superoxide Dismutase (SOD) Gene Family in Rapeseed (Brassica napus L.) under Different Hormones and Abiotic Stress Conditions. Antioxidants 2021, 10, 1182. [Google Scholar] [CrossRef]
  38. Su, W.; Raza, A.; Zeng, L.; Gao, A.; Lv, Y.; Ding, X.; Cheng, Y.; Zou, X. Genome-wide analysis and expression patterns of lipid phospholipid phospholipase gene family in Brassica napus L. BMC Genom. 2021, 22, 548. [Google Scholar] [CrossRef]
  39. Singh, S.; Chhapekar, S.S.; Ma, Y.; Rameneni, J.J.; Oh, S.H.; Kim, J.; Lim, Y.P.; Choi, S.R. Genome-Wide Identification, Evolution, and Comparative Analysis of B-Box Genes in Brassica rapa, B. oleracea, and B. napus and Their Expression Profiling in B. rapa in Response to Multiple Hormones and Abiotic Stresses. Int. J. Mol. Sci. 2021, 22, 10367. [Google Scholar] [CrossRef]
  40. Zhang, Z.; Li, J.; Zhao, X.-Q.; Wang, J.; Wong, G.K.-S.; Yu, J. KaKs_Calculator: Calculating Ka and Ks through Model Selection and Model Averaging. Genom. Proteom. Bioinform. 2006, 4, 259–263. [Google Scholar] [CrossRef] [Green Version]
  41. Begum, Y. Regulatory role of microRNAs (miRNAs) in the recent development of abiotic stress tolerance of plants. Gene 2022, 821, 146283. [Google Scholar] [CrossRef] [PubMed]
  42. McAllister, C.H.; Beatty, P.; Good, A.G. Engineering nitrogen use efficient crop plants: The current status. Plant Biotechnol. J. 2012, 10, 1011–1025. [Google Scholar] [CrossRef] [PubMed]
  43. Ren, F.; Zhao, C.-Z.; Liu, C.-S.; Huang, K.-L.; Guo, Q.-Q.; Chang, L.-L.; Xiong, H.; Li, X.-B. A Brassica napus PHT1 phosphate transporter, BnPht1;4, promotes phosphate uptake and affects roots architecture of transgenic Arabidopsis. Plant Mol. Biol. 2014, 86, 595–607. [Google Scholar] [CrossRef] [PubMed]
  44. Dinh, A.Q.; Naeem, A.; Sagervanshi, A.; Wimmer, M.A.; Mühling, K.H. Boron uptake and distribution by oilseed rape (Brassica napus L.) as affected by different nitrogen forms under low and high boron supply. Plant Physiol. Biochem. 2021, 161, 156–165. [Google Scholar] [CrossRef] [PubMed]
  45. Zhou, T.; Yue, C.P.; Zhang, T.Y.; Liu, Y.; Huang, J.; Hua, Y. Integrated ionomic and transcriptomic dissection reveals the core transporter genes responsive to varying cadmium abundances in allotetraploid rapeseed. BMC Plant Biol. 2021, 21, 372. [Google Scholar] [CrossRef]
  46. Raza, A.; Tabassum, J.; Fakhar, A.Z.; Sharif, R.; Chen, H.; Zhang, C.; Ju, L.; Fotopoulos, V.; Siddique, K.H.M.; Singh, R.K.; et al. Smart reprograming of plants against salinity stress using modern biotechnological tools. Crit. Rev. Biotechnol. 2022, 1–28. [Google Scholar] [CrossRef]
  47. Wu, C.; Feng, J.; Wang, R.; Liu, H.; Yang, H.; Rodriguez, P.L.; Qin, H.; Liu, X.; Wang, D. HRS1 Acts as a Negative Regulator of Abscisic Acid Signaling to Promote Timely Germination of Arabidopsis Seeds. PLoS ONE 2012, 7, e35764. [Google Scholar] [CrossRef] [Green Version]
  48. Krouk, G.; Tranchina, D.; Lejay, L.; Cruikshank, A.A.; Shasha, D.; Coruzzi, G.M.; Gutiérrez, R.A. A systems approach uncovers restrictions for signal interactions regulating genome-wide responses to nutritional cues in Arabidopsis. PLoS Comput. Biol. 2009, 5, e1000326. [Google Scholar] [CrossRef]
  49. Canales, J.; Moyano, T.C.; Villarroel, E.; Gutiérrez, R.A. Systems analysis of transcriptome data provides new hypotheses about Arabidopsis root response to nitrate treatments. Front. Plant Sci. 2014, 5, 22. [Google Scholar] [CrossRef] [Green Version]
  50. Zhao, X.; Yang, J.; Li, X.; Li, G.; Sun, Z.; Chen, Y.; Chen, Y.; Xia, M.; Li, Y.; Yao, L.; et al. Identification and expression analysis of GARP superfamily genes in response to nitrogen and phosphorus stress in Spirodela polyrhiza. BMC Plant Biol. 2022, 22, 308. [Google Scholar] [CrossRef]
  51. Perumal, S.; Waminal, N.; Lee, J.; Lee, J.; Choi, B.-S.; Kim, H.H.; Grandbastien, M.-A.; Yang, T.-J. Elucidating the major hidden genomic components of the A, C, and AC genomes and their influence on Brassica evolution. Sci. Rep. 2017, 7, 17986. [Google Scholar] [CrossRef]
  52. Kesawat, M.S.; Kherawat, B.S.; Singh, A.; Dey, P.; Routray, S.; Mohapatra, C.; Saha, D.; Ram, C.; Siddique, K.H.M.; Kumar, A.; et al. Genome-Wide Analysis and Characterization of the Proline-Rich Extensin-like Receptor Kinases (PERKs) Gene Family Reveals Their Role in Different Developmental Stages and Stress Conditions in Wheat (Triticum aestivum L.). Plants 2022, 11, 496. [Google Scholar] [CrossRef]
  53. Kumar, M.; Kherawat, B.S.; Dey, P.; Saha, D.; Singh, A.; Bhatia, S.K.; Ghodake, G.S.; Kadam, A.A.; Kim, H.-U.; Manorama; et al. Genome-Wide Identification and Characterization of PIN-FORMED (PIN) Gene Family Reveals Role in Developmental and Various Stress Conditions in Triticum aestivum L. Int. J. Mol. Sci. 2021, 22, 7396. [Google Scholar] [CrossRef]
  54. Wang, W.; Wang, X.T.; Wang, Y.T.; Zhou, G.; Wang, C.; Hussain, S.; Adnan; Lin, R.; Wang, T.; Wang, S. SlEAD1, an EAR motif-containing ABA down-regulated novel transcription re-pressor regulates ABA response in tomato. GM Crop. Food 2020, 11, 275–289. [Google Scholar] [CrossRef]
  55. Jiao, Y.; Wickett, N.J.; Saravanaraj, A.; Chanderbali, A.S.; Landherr, L.; Ralph, P.E.; Tomsho, L.P.; Hu, Y.; Liang, H.; Sotis, P.S.; et al. Data from: Ancestral polyploidy in seed plants and angiosperms. Nature 2011, 473, 97–100. [Google Scholar] [CrossRef]
  56. Cannon, S.B.; Mitra, A.; Baumgarten, A.; Young, N.D.; May, G. The roles of segmental and tandem gene duplication in the evolution of large gene families in Arabidopsis thaliana. BMC Plant Biol. 2004, 4, 10. [Google Scholar] [CrossRef] [Green Version]
  57. Soylev, A.; Le, T.M.; Amini, H.; Alkan, C.; Hormozdiari, F. Discovery of tandem and interspersed segmental duplications using high-throughput sequencing. Bioinformatics 2019, 35, 3923–3930. [Google Scholar] [CrossRef] [Green Version]
  58. Das Laha, S.; Dutta, S.; Schäffner, A.R.; Das, M. Gene duplication and stress genomics in Brassicas: Current understanding and future prospects. J. Plant Physiol. 2020, 255, 153293. [Google Scholar] [CrossRef]
  59. Chalhoub, B.; Denoeud, F.; Liu, S.; Parkin, I.A.P.; Tang, H.; Wang, X.; Chiquet, J.; Belcram, H.; Tong, C.; Samans, B.; et al. Early allopolyploid evolution in the post-Neolithic Brassica napus oilseed genome. Science 2014, 345, 950–953. [Google Scholar] [CrossRef] [Green Version]
  60. Xu, J.; Zhao, X.; Bao, J.; Shan, Y.; Zhang, M.; Shen, Y.; Abubakar, Y.S.; Lu, G.; Wang, Z.; Wang, A. Genome-Wide Identification and Expression Analysis of SNARE Genes in Brassica napus. Plants 2022, 11, 711. [Google Scholar] [CrossRef]
  61. Hernandez-Garcia, C.M.; Finer, J.J. Identification and validation of promoters and cis-acting regulatory elements. Plant Sci. 2014, 217, 109–119. [Google Scholar] [CrossRef] [PubMed]
  62. Yan, Y.; Shen, L.; Chen, Y.; Bao, S.; Thong, Z.; Yu, H. A MYB-Domain Protein EFM Mediates Flowering Responses to Environmental Cues in Arabidopsis. Dev. Cell 2014, 30, 437–448. [Google Scholar] [CrossRef] [PubMed] [Green Version]
  63. Li, M.; Yu, B. Recent advances in the regulation of plant miRNA biogenesis. RNA Biol. 2021, 18, 2087–2096. [Google Scholar] [CrossRef] [PubMed]
  64. Song, X.; Li, Y.; Cao, X.; Qi, Y. MicroRNAs and Their Regulatory Roles in Plant–Environment Interactions. Annu. Rev. Plant Biol. 2019, 70, 489–525. [Google Scholar] [CrossRef] [PubMed]
  65. Raza, A.; Su, W.; Gao, A.; Mehmood, S.; Hussain, M.; Nie, W.; Lv, Y.; Zou, X.; Zhang, X. Catalase (CAT) Gene Family in Rapeseed (Brassica napus L.): Genome-Wide Analysis, Identification, and Expression Pattern in Response to Multiple Hormones and Abiotic Stress Conditions. Int. J. Mol. Sci. 2021, 22, 4281. [Google Scholar] [CrossRef]
  66. Li, J.; Guo, G.; Guo, W.; Guo, G.; Tong, D.; Ni, Z.; Sun, Q.; Yao, Y. miRNA164-directed cleavage of ZmNAC1 confers lateral root development in maize (Zea mays L.). BMC Plant Biol. 2012, 12, 220. [Google Scholar] [CrossRef] [Green Version]
  67. González-Villagra, J.; Kurepin, L.V.; Reyes-Díaz, M.M. Evaluating the involvement and interaction of abscisic acid and miRNA156 in the induction of anthocyanin biosynthesis in drought-stressed plants. Planta 2017, 246, 299–312. [Google Scholar] [CrossRef]
  68. Han, Y.; Zhang, X.; Wang, Y.; Ming, F. The Suppression of WRKY44 by GIGANTEA-miR172 Pathway Is Involved in Drought Response of Arabidopsis thaliana. PLoS ONE 2013, 8, e73541. [Google Scholar] [CrossRef]
  69. Yuan, S.; Zhao, J.; Li, Z.; Hu, Q.; Yuan, N.; Zhou, M.; Xia, X.; Noorai, R.; Saski, C.; Li, S.; et al. MicroRNA396-mediated alteration in plant development and salinity stress response in creeping bentgrass. Hortic. Res. 2019, 6, 1–13. [Google Scholar] [CrossRef] [Green Version]
  70. Hua, Y.-P.; Zhou, T.; Huang, J.-Y.; Yue, C.-P.; Song, H.-X.; Guan, C.-Y.; Zhang, Z.-H. Genome-Wide Differential DNA Methylation and miRNA Expression Profiling Reveals Epigenetic Regulatory Mechanisms Underlying Nitrogen-Limitation-Triggered Adaptation and Use Efficiency Enhancement in Allotetraploid Rapeseed. Int. J. Mol. Sci. 2020, 21, 8453. [Google Scholar] [CrossRef]
  71. Liu, Y.; Hua, Y.-P.; Chen, H.; Zhou, T.; Yue, C.-P.; Huang, J.-Y. Genome-scale identification of plant defensin (PDF) family genes and molecular characterization of their responses to diverse nutrient stresses in allotetraploid rapeseed. PeerJ 2021, 9, e12007. [Google Scholar] [CrossRef]
  72. Franco-Zorrilla, J.M.; López-Vidriero, I.; Carrasco, J.L.; Godoy, M.; Vera, P.; Solano, R. DNA-binding specificities of plant transcription factors and their potential to define target genes. Proc. Natl. Acad. Sci. USA 2014, 111, 2367–2372. [Google Scholar] [CrossRef] [Green Version]
  73. Xiao, G.; He, P.; Zhao, P.; Liu, H.; Zhang, L.; Pang, C.; Yu, J. Genome-wide identification of the GhARF gene family reveals that GhARF2 and GhARF18 are involved in cotton fibre cell initiation. J. Exp. Bot. 2018, 69, 4323–4337. [Google Scholar] [CrossRef]
  74. Li, S.; Liu, Z.; Guo, L.; Li, H.; Nie, X.; Chai, S.; Zheng, W. Genome-Wide Identification of Wheat ZIP Gene Family and Functional Characterization of the TaZIP13-B in Plants. Front. Plant Sci. 2021, 12, 748146. [Google Scholar] [CrossRef]
  75. Shimogawara, K.; Wykoff, D.D.; Usuda, H.; Grossman, A.R. Chlamydomonas reinhardtii Mutants Abnormal in Their Responses to Phosphorus Deprivation. Plant Physiol. 1999, 120, 685–694. [Google Scholar] [CrossRef] [Green Version]
  76. Guan, Z.; Zhang, Q.; Zhang, Z.; Zuo, J.; Chen, J.; Liu, R.; Savarin, J.; Broger, L.; Cheng, P.; Wang, Q.; et al. Mechanistic insights into the regulation of plant phosphate homeostasis by the rice SPX2–PHR2 complex. Nat. Commun. 2022, 13, 1581. [Google Scholar] [CrossRef]
  77. Kiba, T.; Inaba, J.; Kudo, T.; Ueda, N.; Konishi, M.; Mitsuda, N.; Takiguchi, Y.; Kondou, Y.; Yoshizumi, T.; Ohme-Takagi, M.; et al. Repression of Nitrogen Starvation Responses by Members of the Arabidopsis GARP-Type Transcription Factor NIGT1/HRS1 Subfamily. Plant Cell 2018, 30, 925–945. [Google Scholar] [CrossRef] [Green Version]
  78. Safi, A.; Medici, A.; Szponarski, W.; Martin, F.; Clément-Vidal, A.; Marshall-Colon, A.; Ruffel, S.; Gaymard, F.; Rouached, H.; Leclercq, J.; et al. GARP transcription factors repress Arabidopsis nitrogen starvation response via ROS-dependent and -independent pathways. J. Exp. Bot. 2021, 72, 3881–3901. [Google Scholar] [CrossRef]
  79. Osorio, M.B.; Ng, S.; Berkowitz, O.; De Clercq, I.; Mao, C.; Shou, H.; Whelan, J.; Jost, R. SPX4 Acts on PHR1-Dependent and -Independent Regulation of Shoot Phosphorus Status in Arabidopsis. Plant Physiol. 2019, 181, 332–352. [Google Scholar] [CrossRef] [Green Version]
  80. Zhou, T.; Hua, Y.; Yue, C.; Huang, J.; Zhang, Z. Physiologic, metabolomic, and genomic investigations reveal distinct glutamine and mannose metabolism responses to ammonium toxicity in allotetraploid rapeseed genotypes. Plant Sci. 2021, 310, 110963. [Google Scholar] [CrossRef]
  81. Liu, H.; Yang, H.; Wu, C.; Feng, J.; Liu, X.; Qin, H.; Wang, D. OverexpressingHRS1Confers Hypersensitivity to Low Phosphate-Elicited Inhibition of Primary Root Growth in Arabidopsis thaliana. J. Integr. Plant Biol. 2009, 51, 382–392. [Google Scholar] [CrossRef]
  82. Bustos, R.; Castrillo, G.; Linhares, F.; Puga, M.I.; Rubio, V.; Pérez-Pérez, J.; Solano, R.; Leyva, A.; Paz-Ares, J. A central regulatory system largely controls transcriptional activation and re-pression responses to phosphate starvation in Arabidopsis. PLoS Genet. 2010, 6, e1001102. [Google Scholar] [CrossRef] [PubMed] [Green Version]
  83. Mito, T.; Seki, M.; Shinozaki, K.; Ohme-Takagi, M.; Matsui, K. Generation of chimeric repressors that confer salt tolerance in Arabidopsis and rice. Plant Biotechnol. J. 2011, 9, 736–746. [Google Scholar] [CrossRef] [PubMed]
  84. Liu, F.; Xu, Y.; Han, G.; Zhou, L.; Ali, A.; Zhu, S.; Li, X. Molecular Evolution and Genetic Variation of G2-Like Transcription Factor Genes in Maize. PLoS ONE 2016, 11, e0161763. [Google Scholar] [CrossRef] [PubMed] [Green Version]
  85. Sawaki, N.; Tsujimoto, R.; Shigyo, M.; Konishi, M.; Toki, S.; Fujiwara, T.; Yanagisawa, S. A Nitrate-Inducible GARP Family Gene Encodes an Auto-Repressible Transcriptional Repressor in Rice. Plant Cell Physiol. 2013, 54, 506–517. [Google Scholar] [CrossRef]
  86. Rhee, S.Y.; Beavis, W.; Berardini, T.Z.; Chen, G.; Dixon, D.; Doyle, A.; Garcia-Hernandez, M.; Huala, E.; Lander, G.; Montoya, M. The Arabidopsis Information Resource (TAIR): A model organism database providing a centralized, curated gateway to Arabidopsis biology, research materials and community. Nucleic Acids Res. 2003, 31, 224–228. [Google Scholar] [CrossRef] [Green Version]
  87. Chen, H.; Wang, T.; He, X.; Cai, X.; Lin, R.; Liang, J.; Wu, J.; King, G.; Wang, X. BRAD V3.0: An upgraded Brassicaceae database. Nucleic Acids Res. 2022, 50, D1432–D1441. [Google Scholar] [CrossRef]
  88. Altschul, S.F.; Madden, T.L.; Schäffer, A.A.; Zhang, J.; Zhang, Z.; Miller, W.; Lipman, D.J. Gapped BLAST and PSI-BLAST: A new generation of protein database search programs. Nucleic Acids Res. 1997, 25, 3389–3402. [Google Scholar] [CrossRef] [Green Version]
  89. El-Gebali, S.; Mistry, J.; Bateman, A.; Eddy, S.R.; Luciani, A.; Potter, S.C.; Qureshi, M.; Richardson, L.J.; Salazar, G.A.; Smart, A.; et al. The Pfam protein families database in 2019. Nucleic Acids Res. 2019, 47, D427–D432. [Google Scholar] [CrossRef]
  90. Lu, S.; Wang, J.; Chitsaz, F.; Derbyshire, M.K.; Geer, R.C.; Gonzales, N.R.; Gwadz, M.; I Hurwitz, D.; Marchler, G.H.; Song, J.S.; et al. CDD/SPARCLE: The conserved domain database in 2020. Nucleic Acids Res. 2020, 48, D265–D268. [Google Scholar] [CrossRef] [Green Version]
  91. Artimo, P.; Jonnalagedda, M.; Arnold, K.; Baratin, D.; Csardi, G.; de Castro, E.; Duvaud, S.; Flegel, V.; Fortier, A.; Gasteiger, E.; et al. ExPASy: SIB bioinformatics resource portal. Nucleic Acids Res. 2012, 40, W597–W603. [Google Scholar] [CrossRef]
  92. Larkin, M.A.; Blackshields, G.; Brown, N.P.; Chenna, R.; McGettigan, P.A.; McWilliam, H.; Valentin, F.; Wallace, I.M.; Wilm, A.; Lopez, R.; et al. Clustal W and Clustal X version 2.0. Bioinformatics 2007, 23, 2947–2948. [Google Scholar] [CrossRef] [Green Version]
  93. Kumar, S.; Stecher, G.; Li, M.; Knyaz, C.; Tamura, K. MEGA X: Molecular Evolutionary Genetics Analysis across Computing Platforms. Mol. Biol. Evol. 2018, 35, 1547–1549. [Google Scholar] [CrossRef]
  94. Letunic, I.; Bork, P. Interactive Tree Of Life (iTOL) v5: An online tool for phylogenetic tree display and annotation. Nucleic Acids Res. 2021, 49, W293–W296. [Google Scholar] [CrossRef]
  95. Wang, D.; Zhang, Y.; Zhang, Z.; Zhu, J.; Yu, J. KaKs_Calculator 2.0: A Toolkit Incorporating Gamma-Series Methods and Sliding Window Strategies. Genom. Proteom. Bioinform. 2010, 8, 77–80. [Google Scholar] [CrossRef] [Green Version]
  96. Koch, M.A.; Haubold, B.; Mitchell-Olds, T. Comparative evolutionary analysis of chalcone synthase and alcohol dehydro-genase loci in Arabidopsis, Arabis, and related genera (Brassicaceae). Mol. Biol. Evol. 2000, 17, 1483–1498. [Google Scholar] [CrossRef] [Green Version]
  97. Bailey, T.L.; Boden, M.; Buske, F.A.; Frith, M.; Grant, C.E.; Clementi, L.; Ren, J.; Li, W.W.; Noble, W.S. MEME SUITE: Tools for motif discovery and searching. Nucleic Acids Res. 2009, 37, w202–w208. [Google Scholar] [CrossRef]
  98. Hu, B.; Jin, J.; Guo, A.-Y.; Zhang, H.; Luo, J.; Gao, G. GSDS 2.0: An upgraded gene feature visualization server. Bioinformatics 2015, 31, 1296–1297. [Google Scholar] [CrossRef] [Green Version]
  99. Jiangtao, C.; Yingzhen, K.; Qian, W.; Yuhe, S.; Daping, G.; Jing, L.; Guanshan, L. MapGene2Chrom, a tool to draw gene physical map based on Perl and SVG languages. Hereditas 2015, 37, 91–97. [Google Scholar] [CrossRef]
  100. Chen, C.J.; Chen, H.; Zhang, Y.; Thomas, H.R.; Frank, M.H.; He, Y.H.; Xia, R. TBtools: An Integrative Toolkit Developed for Interactive Analyses of Big Biological Data. Mol. Plant 2020, 13, 1194–1202. [Google Scholar] [CrossRef]
  101. Buchfink, B.; Xie, C.; Huson, D.H. Fast and sensitive protein alignment using DIAMOND. Nat. Methods 2015, 12, 59–60. [Google Scholar] [CrossRef] [PubMed]
  102. Sánchez, J.-P.; Duque, P.; Chua, N.-H. ABA activates ADPR cyclase and cADPR induces a subset of ABA-responsive genes in Arabidopsis. Plant J. 2004, 38, 381–395. [Google Scholar] [CrossRef] [PubMed]
  103. Dai, X.; Zhuang, Z.; Zhao, P.X. psRNATarget: A plant small RNA target analysis server (2017 release). Nucleic Acids Res. 2018, 46, W49–W54. [Google Scholar] [CrossRef] [PubMed] [Green Version]
  104. Shannon, P.; Markiel, A.; Ozier, O.; Baliga, N.S.; Wang, J.T.; Ramage, D.; Amin, N.; Schwikowski, B.; Ideker, T. Cytoscape: A software environment for integrated models of Biomolecular Interaction Networks. Genome Res. 2003, 13, 2498–2504. [Google Scholar] [CrossRef]
  105. Zhou, T.; Yue, C.P.; Huang, J.Y.; Cui, J.; Liu, Y.; Wang, W.; Tian, C.; Hua, Y. Genome-wide identification of the amino acid permease genes and molecular characterization of their transcriptional responses to various nutrient stresses in allotetraploid rapeseed. BMC Plant Biol. 2020, 20, 151. [Google Scholar] [CrossRef]
  106. Han, Y.-L.; Song, H.-X.; Liao, Q.; Yu, Y.; Jian, S.-F.; Lepo, J.E.; Liu, Q.; Rong, X.-M.; Tian, C.; Zeng, J.; et al. Nitrogen Use Efficiency Is Mediated by Vacuolar Nitrate Sequestration Capacity in Roots of Brassica napus. Plant Physiol. 2016, 170, 1684–1698. [Google Scholar] [CrossRef] [Green Version]
  107. Li, B.; Dewey, C.N. RSEM: Accurate transcript quantification from RNA-Seq data with or without a reference genome. BMC Bioinform. 2011, 12, 323. [Google Scholar] [CrossRef] [Green Version]
  108. Love, M.I.; Huber, W.; Anders, S. Moderated estimation of fold change and dispersion for RNA-seq data with DESeq2. Genome Biol. 2014, 15, 550. [Google Scholar] [CrossRef] [Green Version]
  109. Voelker, C.; Schmidt, D.; Mueller-Roeber, B.; Parkin, I.A.P.; Tang, H.; Wang, X.; Chiquet, J.; Belcram, H.; Tong, C.; Samans, B. Members of the Arabidopsis AtTPK/KCO family form homomeric vacuolar channels in planta. Plant J. 2006, 48, 296–306. [Google Scholar] [CrossRef]
  110. Li, L.; He, Y.; Zhang, Z.; Shi, Y.; Zhang, X.; Xu, X.; Wu, J.-L.; Tang, S. OsNAC109 regulates senescence, growth and development by altering the expression of senescence- and phytohormone-associated genes in rice. Plant Mol. Biol. 2021, 105, 637–654. [Google Scholar] [CrossRef]
Figure 1. Phylogenetic tree of the GARPs retrieved from B. napus and A. thaliana. The phylogenetic tree was constructed according to the neighbor-joining method. The tree was generated using MEGA7.0 based on the GARP amino acid sequences retrieved from B. napus and A. thaliana. The genes from each group are indicated by different colors. The rectangle sizes at the nodes represent the bootstrap values.
Ijms 23 14484 g001
Figure 2. Identification and characterization of the conserved motifs in the GARP proteins in B. napus. (A) Molecular identification of BnaARR-Bs. (B) The sequence characterization of BnaARR-Bs. (C) Molecular identification of BnaNIGT1/HRS1/HHOs. (D) The sequence characterization of BnaNIGT1/HRS1/HHOs. In A and C, the boxes with different colors indicate different conserved motifs (motifs 1–10), and black lines represent the GARP protein regions without detected motifs. In C and D, the larger the fonts, the more conserved the motifs. Among them, the tagged motifs were identified as the B-motifs.
Ijms 23 14484 g002
Figure 3. Exon-intron organizations of BnaNIGT1/HRS1/HHOs (A) and BnaARR-Bs (B). The green boxes represent untranslated regions, the yellow boxes represent exons, and the black lines represent the introns. The lengths of the exons and introns can be determined by the scale at the bottom.
Ijms 23 14484 g003
Figure 4. Chromosomal location of the 146 genes in GARP family genes in B. napus. The distribution of the 146 genes on the 20 chromosomes is presented. The Ann and Cnn chromosomes refer to the chromosome that is anchored to the A and C subgenomes, while they have been not the specific chromosome.
Ijms 23 14484 g004
Figure 5. Synteny analysis of the GARP family genes between B. napus and A. thaliana, G. max, and M. truncatula. Gray lines indicate all collinear blocks within B. napus and A. thaliana, G. max, and M. truncatula. While the red lines depict the orthologous relationships.
Ijms 23 14484 g005
Figure 6. Predicted cis-regulatory elements (CREs) in the promoter regions of BnaGARPs. (A) Distribution of the CREs on chrA1 to chrA4. (B) Distribution of the CREs on chrA05 to chrAnn. (C) Distribution of the CREs on chrC1 to chrC6. (D) Distribution of the CREs on chrC7 to chrCnn. The CREs identified by PlantCARE are based on the sequence of 2000 bp upstream of the start codon of BnaGARPs. Different colored rectangles represent different CREs that are potentially involved in the regulation of stress resistance or phytohormone response.
Ijms 23 14484 g006
Figure 7. Network diagrams of predicted miRNAs targeting BnaGARPs. Different diamond colors represent BnaGARPs, and gray ellipse shapes represent potential regulatory miRNAs.
Ijms 23 14484 g007
Figure 8. Expression profiles and co-expression network analysis of BnaNIGT1/HRS1/HHOs (A), BnaARRs (B), BnaGLKs (C), and BnaPHLs (D) in the shoots/S (E) and roots/R (F) under nitrate (NO3) limitation conditions. HN, high N (6.0 mM NO3); LN, low N (0.30 mM NO3). In the heat maps, the expression levels are normalized by log2 (TPM). TPM, transcripts per million (reads). The color scales represent relative expression levels from high (red color) to low (blue color). In the gene co-expression networks, the cycle nodes represent genes, and the size of the nodes represents the power of the interrelation among the nodes by log2FC value. FC, fold change. The edges between two nodes represent interactions between genes.
Ijms 23 14484 g008
Figure 9. Expression profiles (A) and co-expression network analysis of BnaGARPs in the shoots/S (B) and roots/R (C) under different nitrogen (N) form conditions, including 6.0 mM nitrate (NO3) and 6.0 mM ammonium (NH4+) conditions. The expression levels are normalized by log2(TPM). TPM, transcripts per million (reads). In the heat maps, the color scales represent relative expression levels from high (red color) to low (blue color). In the gene co-expression networks, the cycle nodes represent genes, and the size of the nodes represents the power of the interrelation among the nodes by log2FC value. FC, fold change. The edges between two nodes represent interactions between genes.
Ijms 23 14484 g009
Figure 10. Characterization of the rapeseed genotypes H12 and L73 growing under nitrate (NO3) limitation conditions and subcellular localization analysis of BnaA9.HHO1. (A) Growth performance of the high-NUE genotype H12 and the low-NUE genotype L73 growing under low (0.3 mM) NO3 condition. (B) Expression profiles of the BnaGARP DEGs between H12 and L73 under NO3 limitation conditions. (C) Subcellular localization analysis of BnaA9.HHO1. OsGhd7 was used as a nuclear marker and fused with a red fluorescent protein sequence.
Ijms 23 14484 g010
Figure 11. Expression profiles of BnaNIGT1/HRS1/HHOs (A), BnaARRs (B), BnaGLKs (C), and BnaPHLs (D) in the shoots/S and roots/R under different phosphate (Pi) levels. conditions. +Pi, high Pi (250 μM); -Pi, low Pi (5 μM), The expression levels are normalized by log2 (TPM). TPM, transcripts per million (reads). The color scales represent relative expression levels from high (red color) to low (blue color).
Ijms 23 14484 g011
Figure 12. Expression profiles of BnaNIGT1/HRS1/HHOs (A), BnaARRs (B), BnaGLKs (C), BnaKANs (D), and BnaPHLs (E) in the shoots/S and roots/R under different boron (B) and cadmium (Cd) toxicity (F) conditions. -B, low B (0.25 μM); CK, high B (25 μM); Ctrl, Cd-free; +Cd, high Cd (10 μM). In the heat maps, the expression levels are normalized by log2 (TPM). TPM, transcripts per million (reads). The color scales represent relative expression levels from high (red color) to low (blue color).
Ijms 23 14484 g012
Figure 13. Expression profiles of BnaNIGT1/HRS1/HHOs (A), BnaARRs (B), BnaGLKs (C), and BnaPHLs (D) in the shoots/S and roots/R under salt stress conditions. Ctrl, control, NaCl-free; NaCl, +NaCl, 200 mM. In the heat maps, the expression levels are normalized by log2 (TPM). TPM, transcripts per million (reads). The color scales represent relative expression levels from high (red color) to low (blue color).
Ijms 23 14484 g013
Figure 14. Venn diagram showing the common and specific differentially expressed genes of BnaGARPs under diverse nutrient stresses.
Ijms 23 14484 g014
Publisher’s Note: MDPI stays neutral with regard to jurisdictional claims in published maps and institutional affiliations.

