Communication

Transforming Growth Factorβ1 Overexpression Is Associated with Insulin Resistance and Rapidly Progressive Kidney Fibrosis under Diabetic Conditions

by
Valeria Fridman D’Alessandro
1,†,
Atsuro Takeshita
1,2,†,
Taro Yasuma
1,2,
Masaaki Toda
1,
Corina N. D’Alessandro-Gabazza
1,
Yuko Okano
1,2,
Suphachai Tharavecharak
1,
Chisa Inoue
2,
Kota Nishihama
2,
Hajime Fujimoto
3,
Tetsu Kobayashi
3,
Yutaka Yano
2 and
Esteban C. Gabazza
1,*
1
Department of Immunology, Mie University Faculty and Graduate School of Medicine, Edobashi 2-174, Tsu 514-8507, Japan
2
Department of Diabetes and Endocrinology, Mie University Faculty and Graduate School of Medicine, Edobashi 2-174, Tsu 514-8507, Japan
3
Department of Pulmonary and Critical care Medicine, Mie University Faculty and Graduate School of Medicine, Edobashi 2-174, Tsu 514-8507, Japan
*
Author to whom correspondence should be addressed.
These authors equally contributed to this work.
Int. J. Mol. Sci. 2022, 23(22), 14265; https://doi.org/10.3390/ijms232214265
Submission received: 2 September 2022 / Revised: 8 November 2022 / Accepted: 15 November 2022 / Published: 17 November 2022
(This article belongs to the Special Issue Cell Death in Acute Organ Injury and Fibrosis)

Abstract

:
Diabetes mellitus is a global health problem. Diabetic nephropathy is a common complication of diabetes mellitus and the leading cause of end-stage renal disease. The clinical course, response to therapy, and prognosis of nephropathy are worse in diabetic than in non-diabetic patients. The role of transforming growth factorβ1 in kidney fibrosis is undebatable. This study assessed whether the overexpression of transforming growth factorβ1 is associated with insulin resistance and the rapid progression of transforming growth factorβ1-mediated nephropathy under diabetic conditions. Diabetes mellitus was induced with streptozotocin in wild-type mice and transgenic mice with the kidney-specific overexpression of human transforming growth factorβ1. Mice treated with saline were the controls. Glucose tolerance and kidney fibrosis were evaluated. The blood glucose levels, the values of the homeostasis model assessment for insulin resistance, and the area of kidney fibrosis were significantly increased, and the renal function was significantly impaired in the diabetic transforming growth factorβ1 transgenic mice compared to the non-diabetic transgenic mice, diabetic wild-type mice, and non-diabetic mice. Transforming growth factorβ1 impaired the regulatory effect of insulin on glucose in the hepatocyte and skeletal muscle cell lines. This study shows that transforming growth factorβ1 overexpression is associated with insulin resistance and rapidly progressive kidney fibrosis under diabetic conditions in mice.

1. Introduction

The increased number of diabetes mellitus (DM) patients is a serious health problem and a great economic burden worldwide [1]. According to recent epidemiological data, the global population of DM patients is almost 500 million [2]. DM is associated with high morbidity and mortality rates. The deaths globally attributable to DM were about 1.5 million in 2019 [3]. Microangiopathy (retinopathy, nephropathy, neuropathy) and macroangiopathy (stroke, coronary ischemic diseases, lower extremity arterial disease) are the main causes of high morbidity and death rates [4,5,6]. Of these, diabetic nephropathy is one of the most common complications and the most frequent cause of chronic kidney disease and end-stage renal disease [7]. The clinical course, response to therapy, and prognosis of nephropathy are worse in patients with DM than in non-diabetic patients [8,9,10]. The incidence of diabetic nephropathy is 20 to 40% in the American diabetic population [7,11]. In Japan, 43.2% of all-cause end-stage renal disease is associated with diabetic nephropathy [12]. The functional and histopathological characteristics of diabetic nephropathy include proteinuria, enhanced cell proliferation and matrix deposition in the mesangium, glomerulosclerosis, and interstitial fibrosis with a decreased glomerular filtration rate [13].
Transforming growth factor (TGF)β1 is a multifunctional cytokine that can promote fibrogenesis by increasing the production of extracellular matrix components (e.g., collagen, fibronectin, periostin, elastin) by fibroblasts or myofibroblasts, stimulating the platelet-derived growth-factor-mediated proliferation and recruitment of fibroblasts, accelerating the epithelial–mesenchymal transition, or suppressing the expression of collagen-degrading matrix metalloproteinases [11,14,15,16,17]. Several cases of evidence have proved the critical role that TGFβ1 plays in the pathogenesis of diabetic nephropathy [11,18,19]. The circulating levels of TGFβ1 are significantly increased in diabetic nephropathy and are significantly correlated with the severity of renal dysfunction [11,20,21]. Patients with diabetic nephropathy also show high urinary levels of TGFβ1, and mice with the glomerulus-specific overexpression of human TGFβ1 develop chronic kidney disease and renal failure [11,18,21]. TGFβ1 exerts its effects by binding to the cell surface receptors and activating the SMAD transcription factors [14]. In addition to stimulating the fibrosis process, recent studies suggest that the TGFβ1/SMAD signal pathway is also implicated in the pathogenesis of metabolic disorders, including obesity and DM [22]. Patients with morbid obesity and diabetic nephropathy showed a high expression level of TGFβ1, and an enhanced level of TGFβ1 was reported as a risk factor for type-2 DM [23,24,25]. Evidence also shows that the inhibition of the TGFβ1/SMAD pathway protects the body against diet-induced obesity and DM and that the TGFβ1 level is significantly correlated with adipose deposition in experimental animals and human subjects [26].
In the present study, we hypothesized that the overexpression of TGFβ1 is associated with insulin resistance and the rapid progression of TGFβ1-mediated nephropathy under diabetic conditions. To demonstrate this hypothesis, we compared the development of insulin resistance, DM, and the progression of diabetic nephropathy between diabetic and non-diabetic transgenic (TG) mice overexpressing human TGFβ1 in the kidneys and wild-type (WT) mice.

2. Results

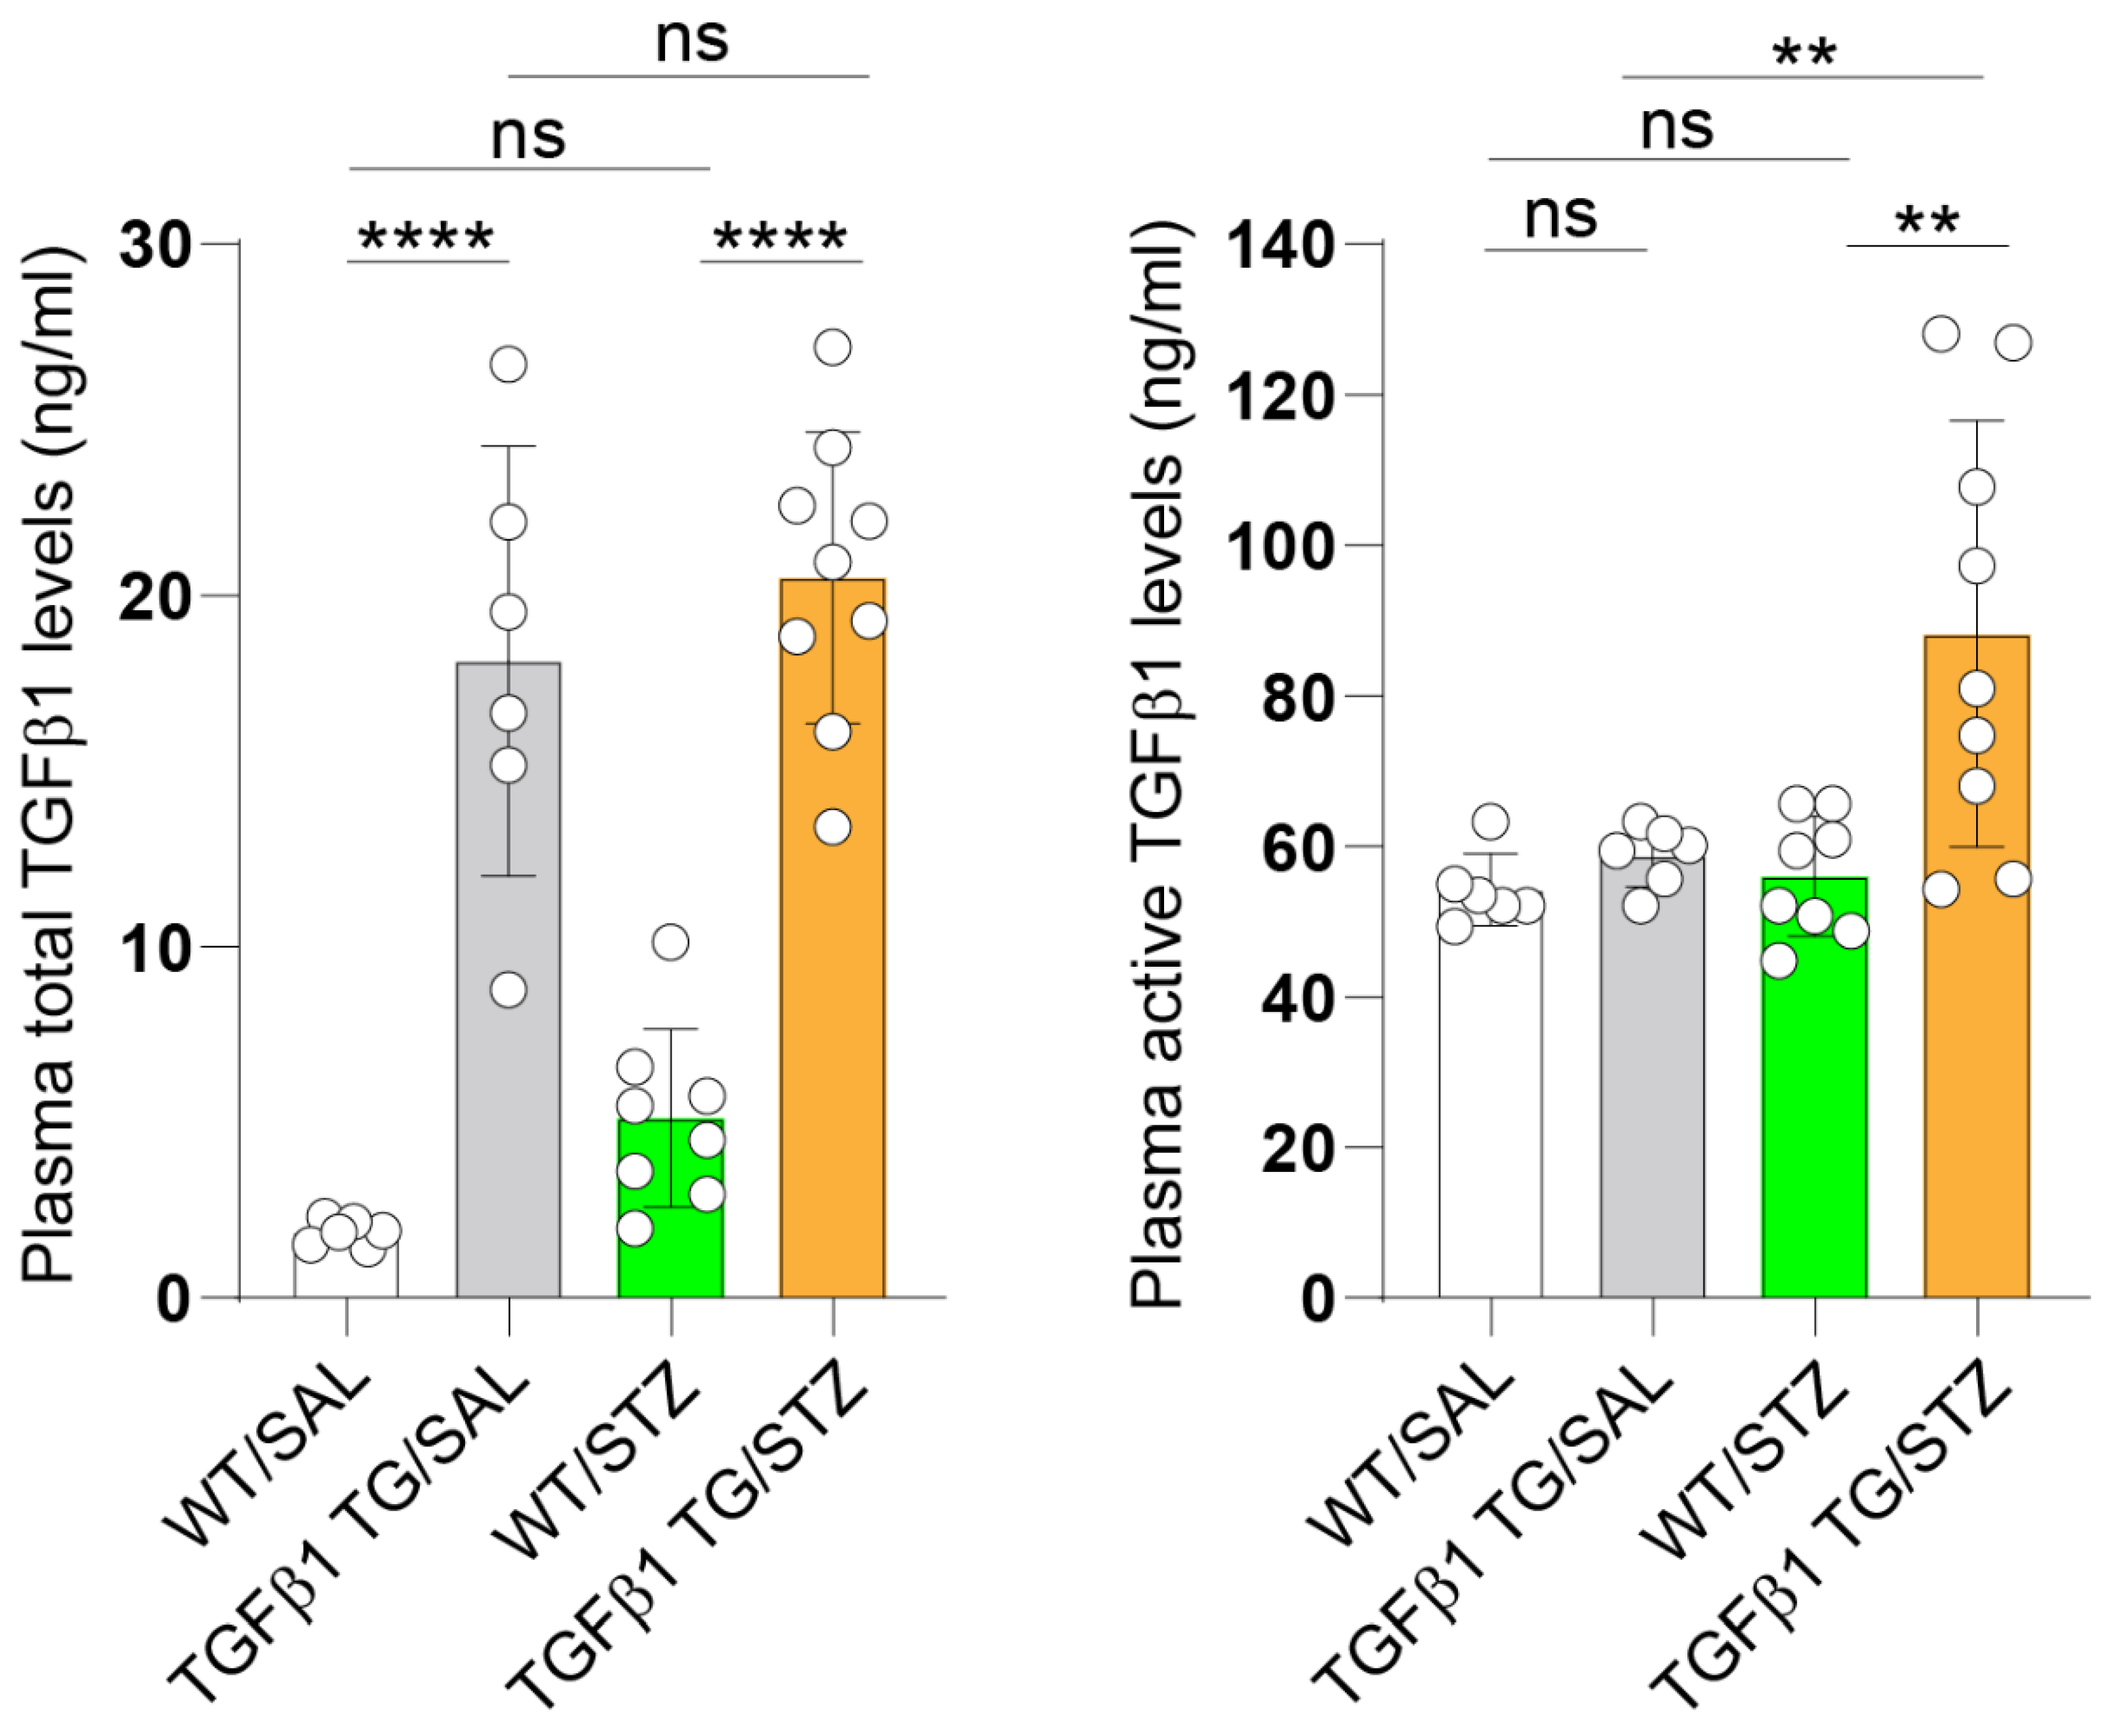
2.1. Increased Circulating Levels of Active TGFβ1 in Diabetic TGFβ1 TG Mice

As expected, the plasma levels of total TGFβ1 were significantly increased in the diabetic (TGFβ1 TG/STZ) and non-diabetic (TGFβ1 TG/SAL) TGFβ1 TG mice compared to their non-diabetic (WT/SAL) and diabetic (WT/STZ) WT counterparts. On the other hand, the plasma levels of the active form of TGFβ1 were significantly increased in the diabetic TGFβ1 TG mice compared to the non-diabetic TGFβ1 TG mice and non-diabetic and diabetic WT mice (Figure 1).

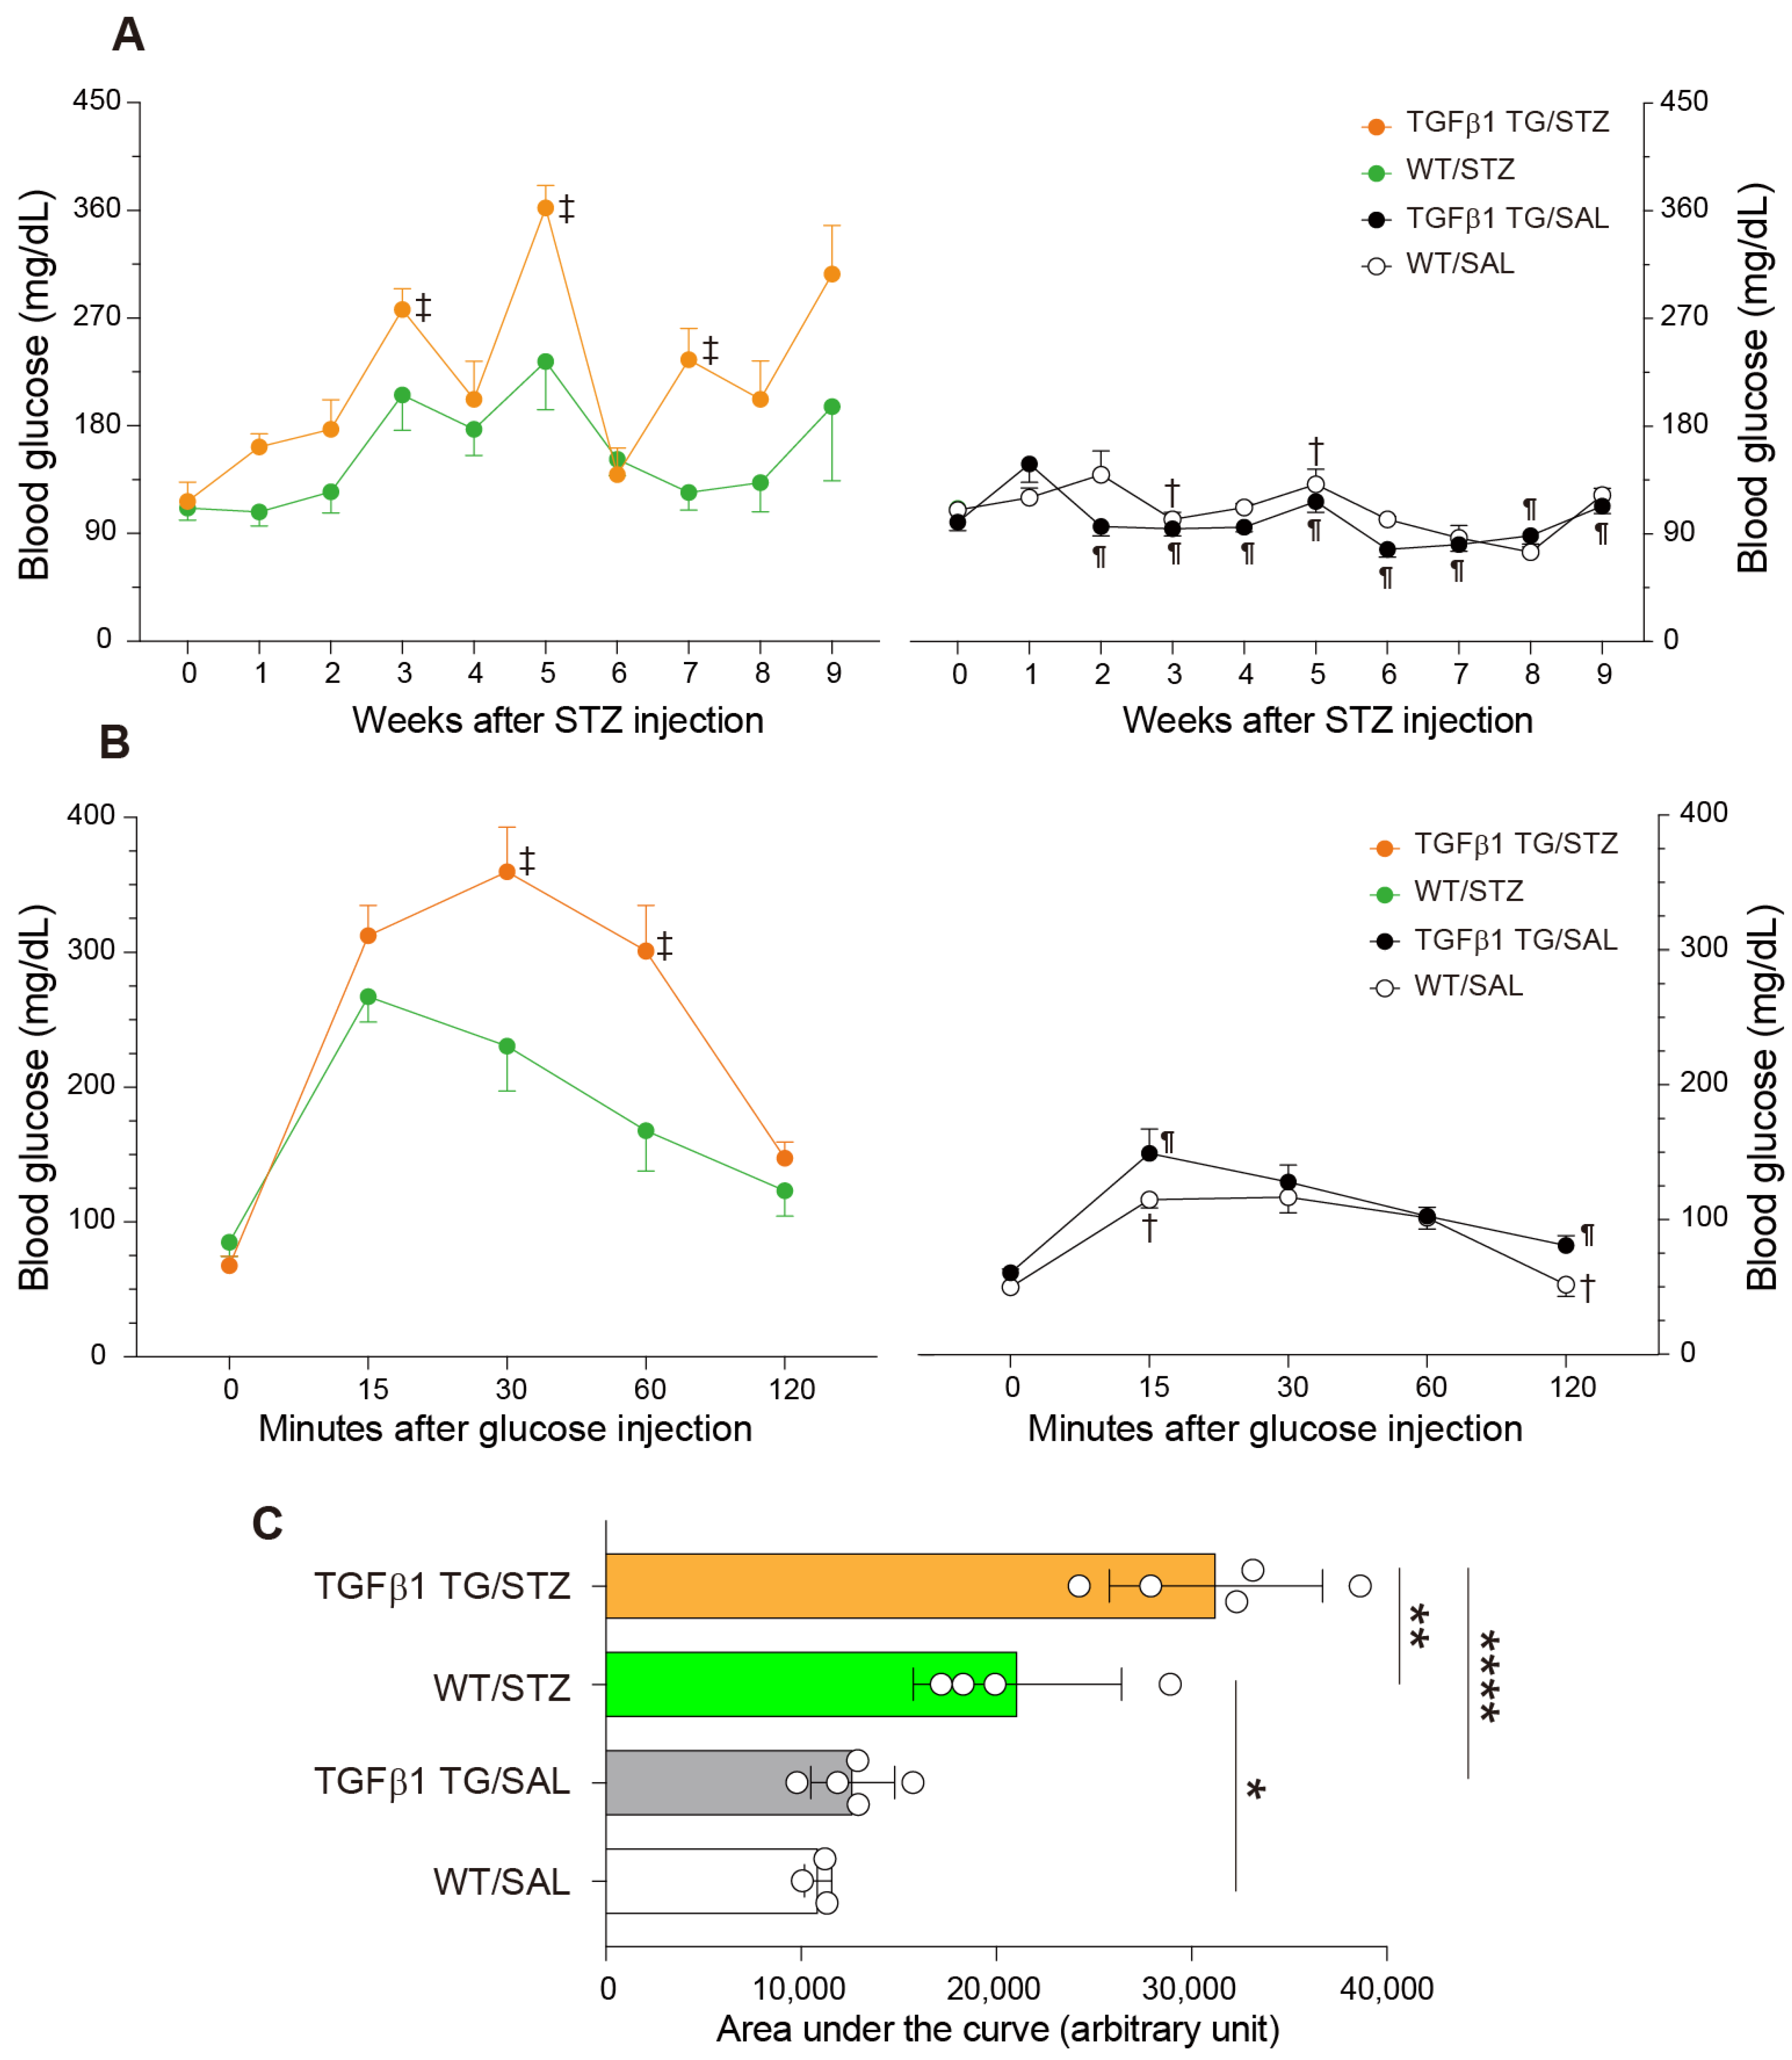
2.2. Increased Blood Glucose Levels and Abnormal Intraperitoneal Glucose Tolerance Test in Diabetic TGFβ1 TG Mice

The glucose levels in the blood were longitudinally measured every week for nine weeks after STZ intraperitoneal injection. The blood concentration of glucose was significantly enhanced in the TGFβ1 TG mice with DM at weeks 3, 5, and 7 after the STZ injection compared to their counterpart WT mice with DM and compared to the non-diabetic TGFβ1 TG mice at weeks 2, 3, 4, 5, 6, 7, 8, and 9. In addition, the blood glucose levels were significantly increased in the diabetic WT mice at weeks 3 and 5 compared to the non-diabetic WT mice (Figure 2A).
The intraperitoneal glucose tolerance test revealed a significant increase in the blood glucose levels of the diabetic TGFβ1 TG mice after 30 and 60 min of glucose injection compared to their counterpart diabetic WT mice and after 15 and 120 min of glucose injection compared to the non-diabetic TGFβ1 TG mice. In addition, the blood glucose levels were significantly increased in the diabetic WT mice after 15 and 120 min of glucose injection compared to the non-diabetic WT mice (Figure 2B). The blood glucose levels were similar at the starting point of the intraperitoneal glucose tolerance test. Similar levels of blood glucose at the starting point of the intraperitoneal glucose tolerance test in the STZ model have also been reported [27,28,29,30,31,32]. Our calculation of the area under the curve also disclosed a significant difference in the blood glucose levels between the mice treated with streptozotocin (STZ), the TGFβ1 TG/STZ and WT/STZ mice, and the TGFβ1 TG/STZ and TGFβ1 TG/SAL (saline) mice, and between the WT/STZ and WT/SAL mice (Figure 2C).

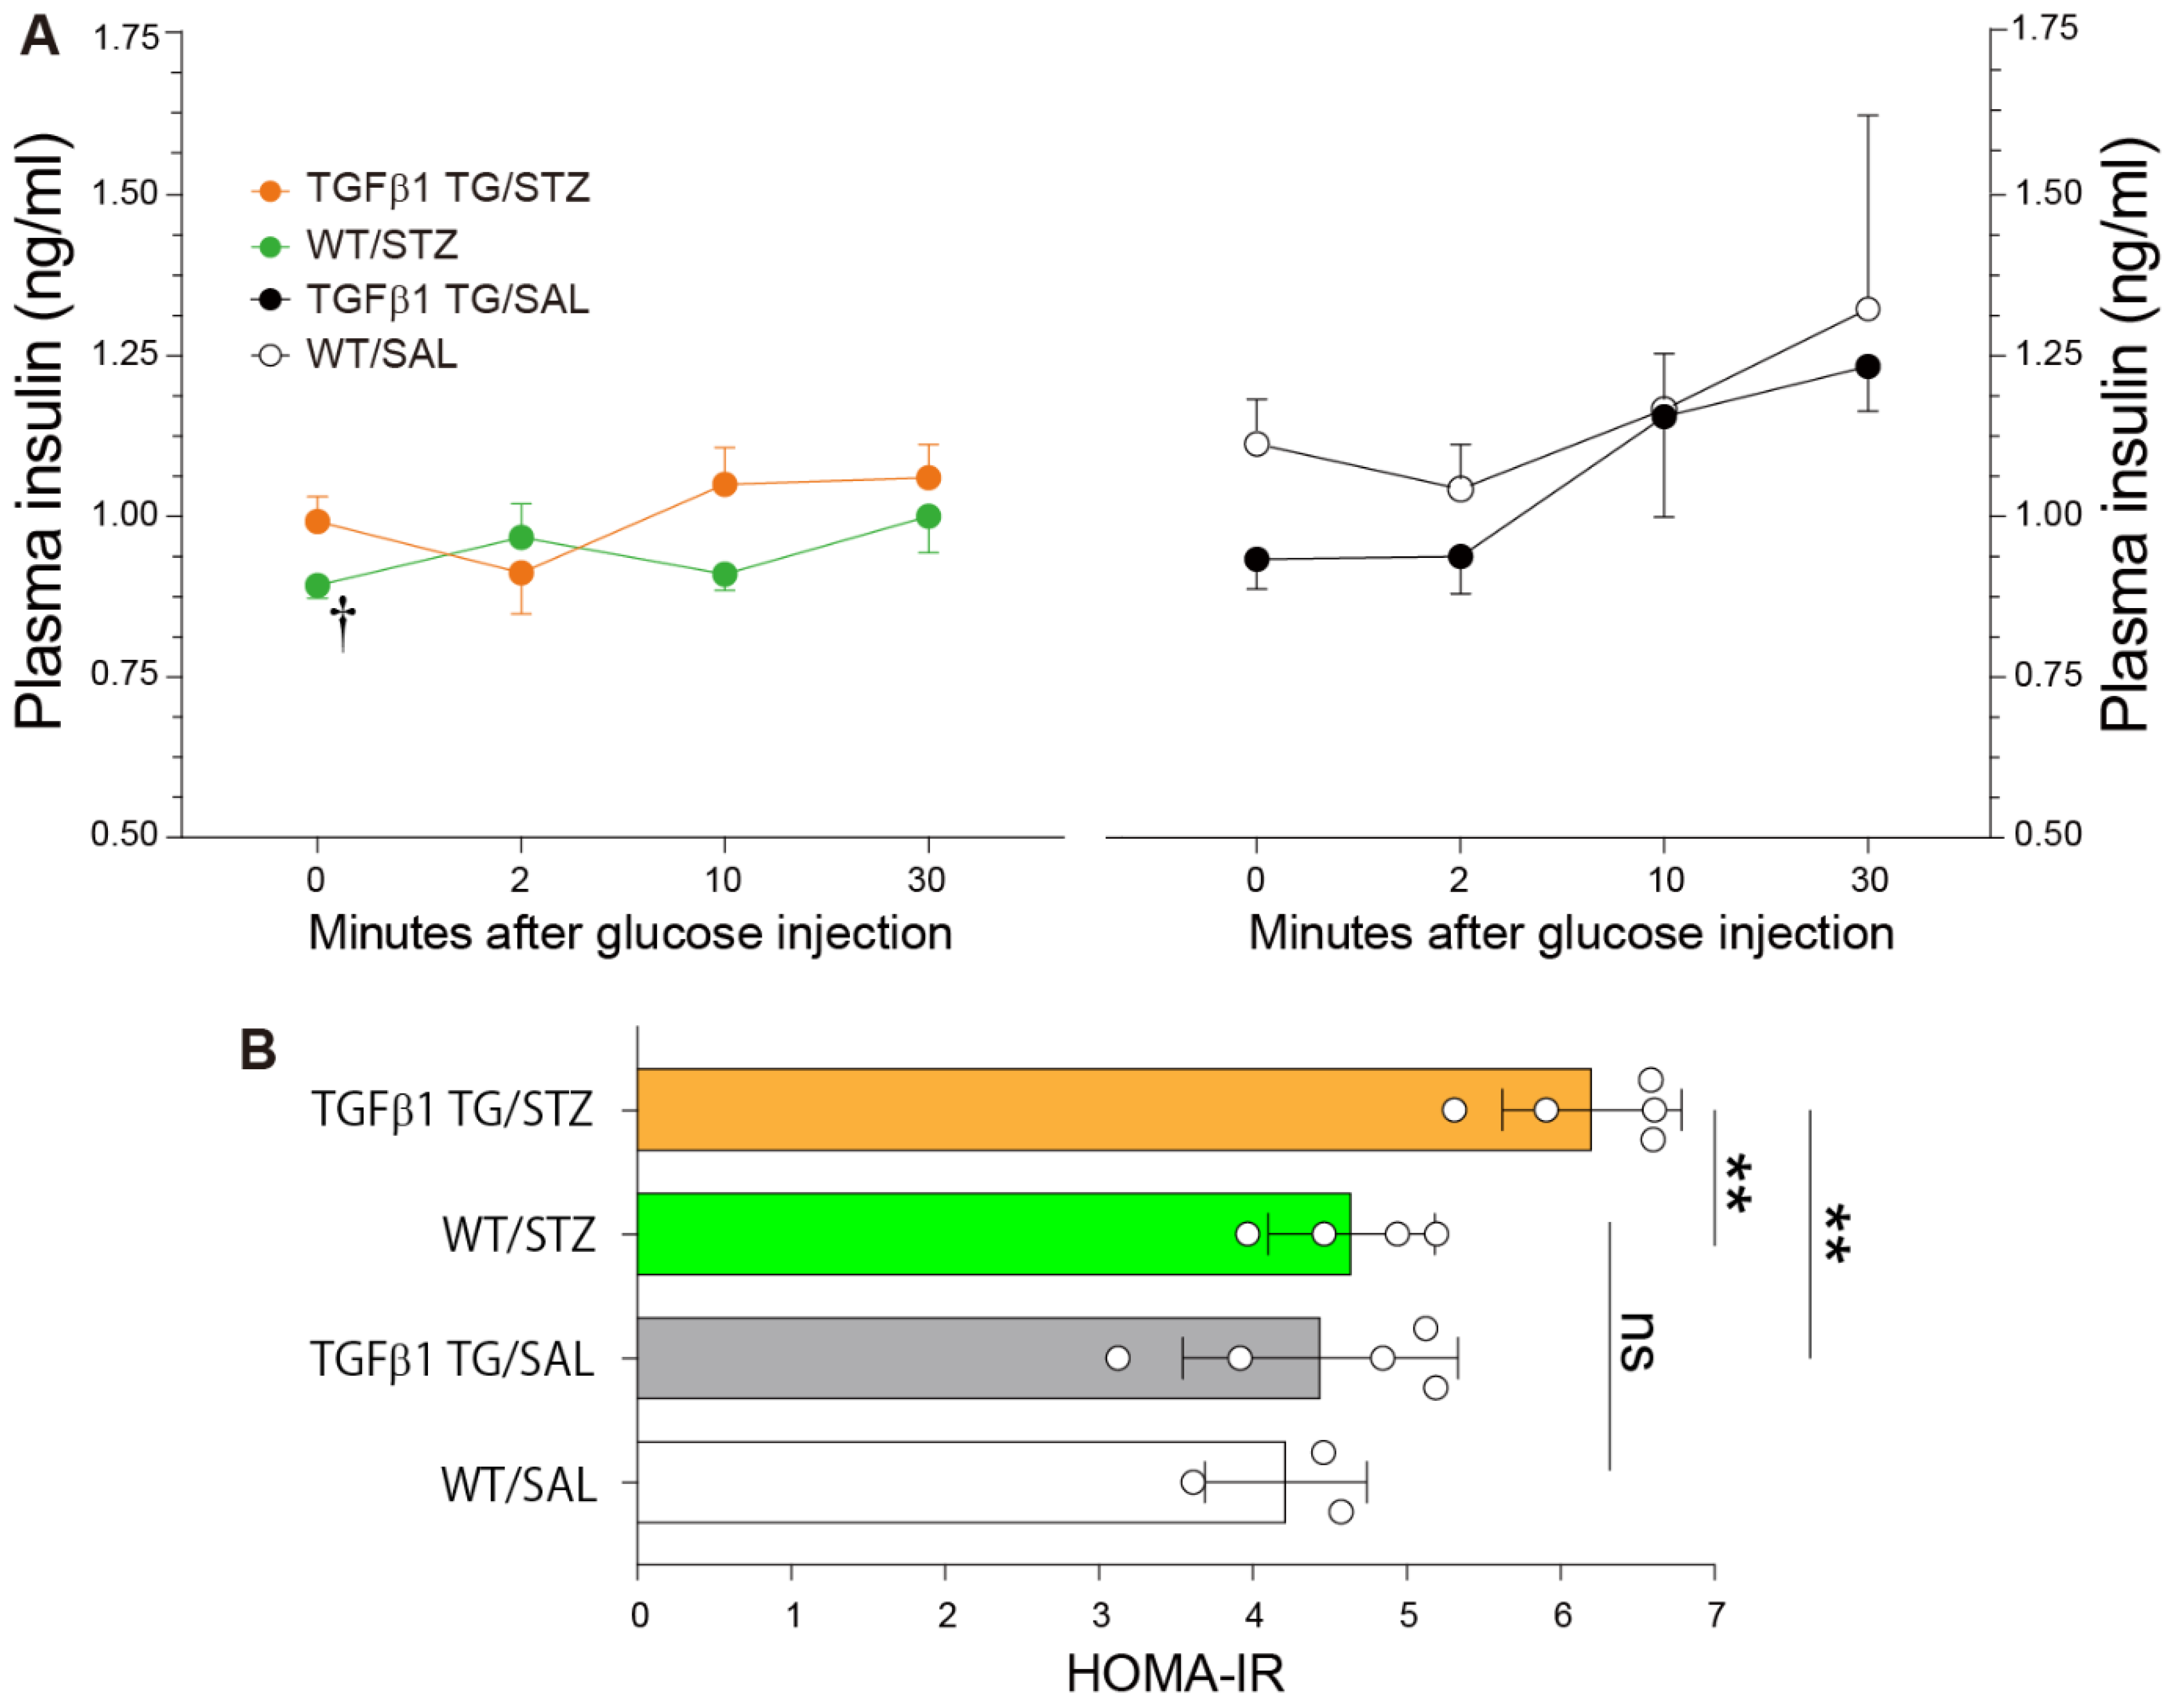
2.3. Reduced Plasma Insulin Levels after Glucose Injection and Insulin Resistance in Diabetic TGFβ1 TG Mice

The glucose-stimulated insulin secretion test was performed after fasting. The plasma insulin level was significantly reduced in the WT/STZ mice compared to the WT/SAL mice after 10 min of glucose injection. The plasma insulin level was also reduced in the WT/STZ group compared to the WT/SAL group after 30 min of glucose injection, although the reduction was not statistically significant (Figure 3A). The plasma insulin level was also significantly decreased in the TGFβ1 TG/STZ group compared to the TGFβ1 TG/SAL group after 10 and 30 min of glucose injection, although the decrease in the insulin levels was not statistically significant. However, the calculated values of the homeostasis model assessment for insulin resistance (HOMA-IR) were significantly increased in the diabetic TGFβ1 TG mice compared to the diabetic WT mice and non-diabetic TGFβ1 TG mice. No significant difference was observed between the WT/STZ and WT/SAL groups (Figure 3B).

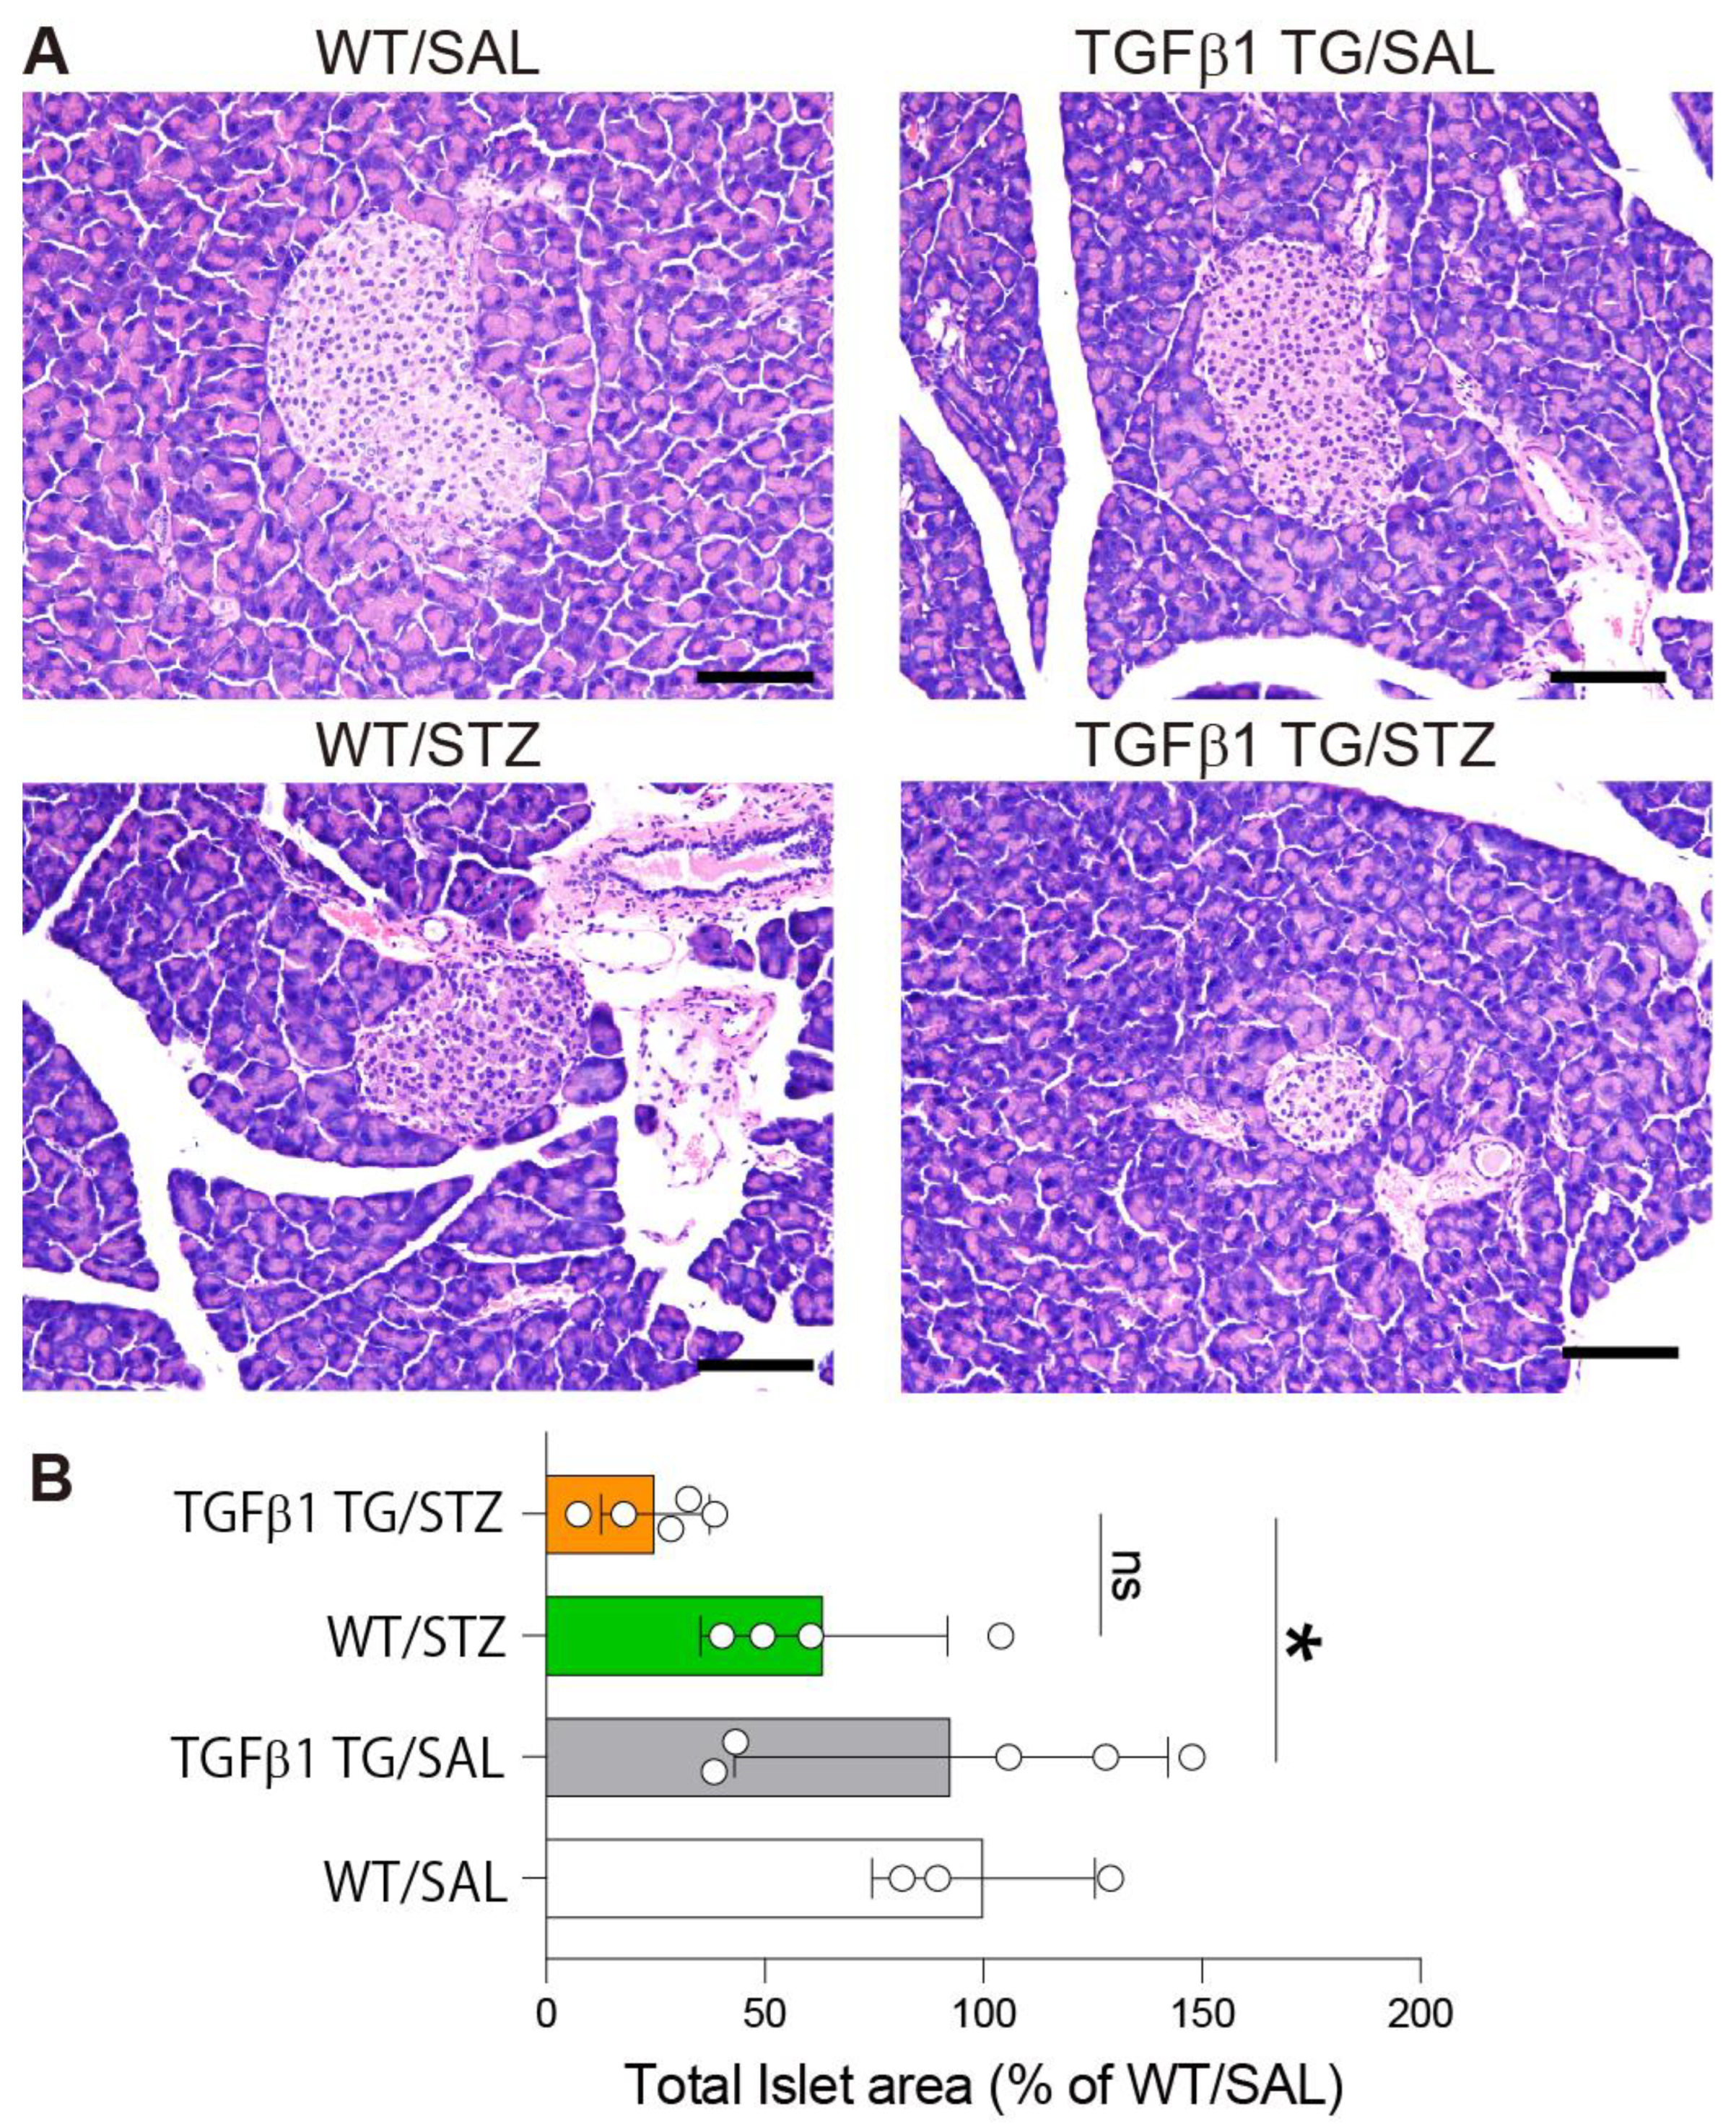
2.4. Reduced Area of Pancreatic Islets in Diabetic TGFβ1 TG Mice

The pancreas was resected and stained with hematoxylin and eosin to measure the islet areas using the WinROOF image software. The area of the islets was significantly reduced in the TGFβ1 TG/STZ mice compared to the TGFβ1 TG/SAL mice. However, no significant difference was observed between the TGFβ1 TG/STZ and WT/STZ mice (Figure 4A,B).

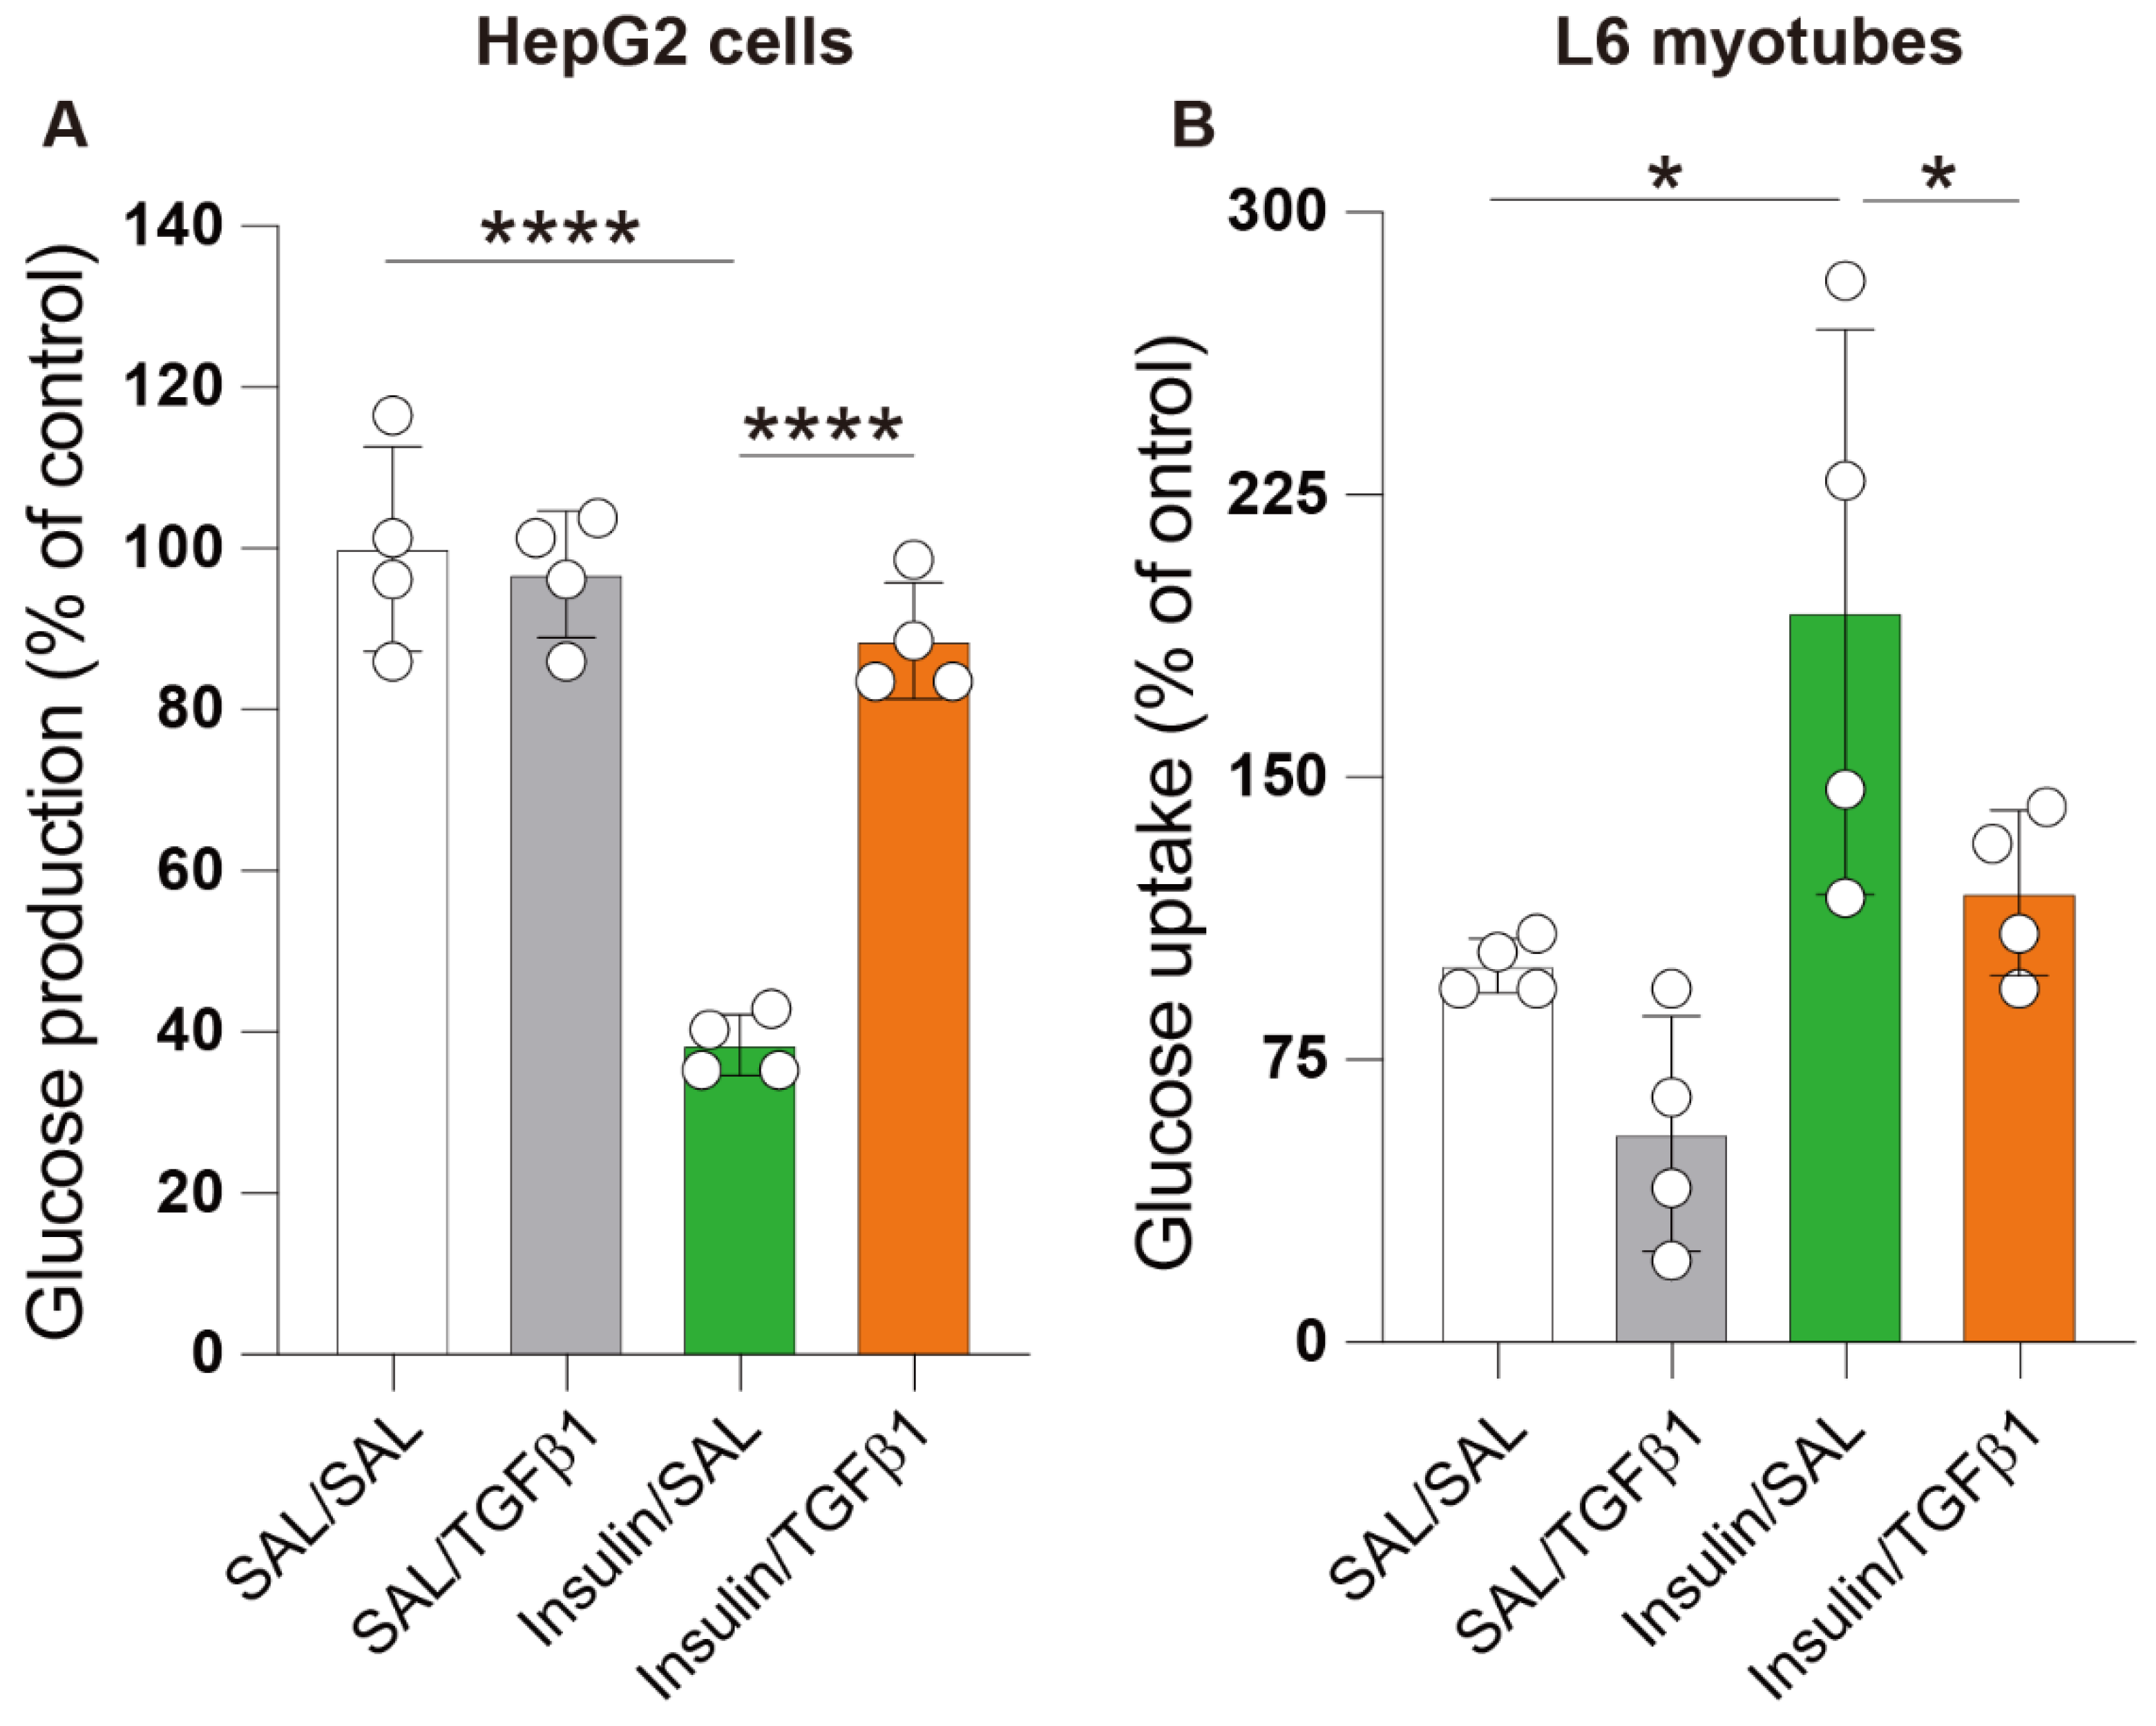
2.5. TGFβ1 Impaired Insulin Action in the Hepatocyte and Skeletal Muscle Cell Lines

Under insulin resistance conditions, the insulin-mediated suppression of glucose production by the hepatocytes and uptake of glucose by the skeletal muscles is impaired. In the present study, we used HepG2 cells and L6 myotubes to evaluate whether TGFβ1 induces insulin resistance in vitro [33]. HepG2 cells and L6 myotubes were cultured in the presence of insulin, and the effect of TGFβ1 on the glucose levels in the cell supernatants was evaluated. The presence of TGF-β1 markedly reversed the reduction in glucose release by the HepG2 cells with insulin (Figure 5A). On the other hand, the significantly increased glucose uptake induced by insulin in the L6 cells was significantly inhibited by TGFβ1 (Figure 5B).

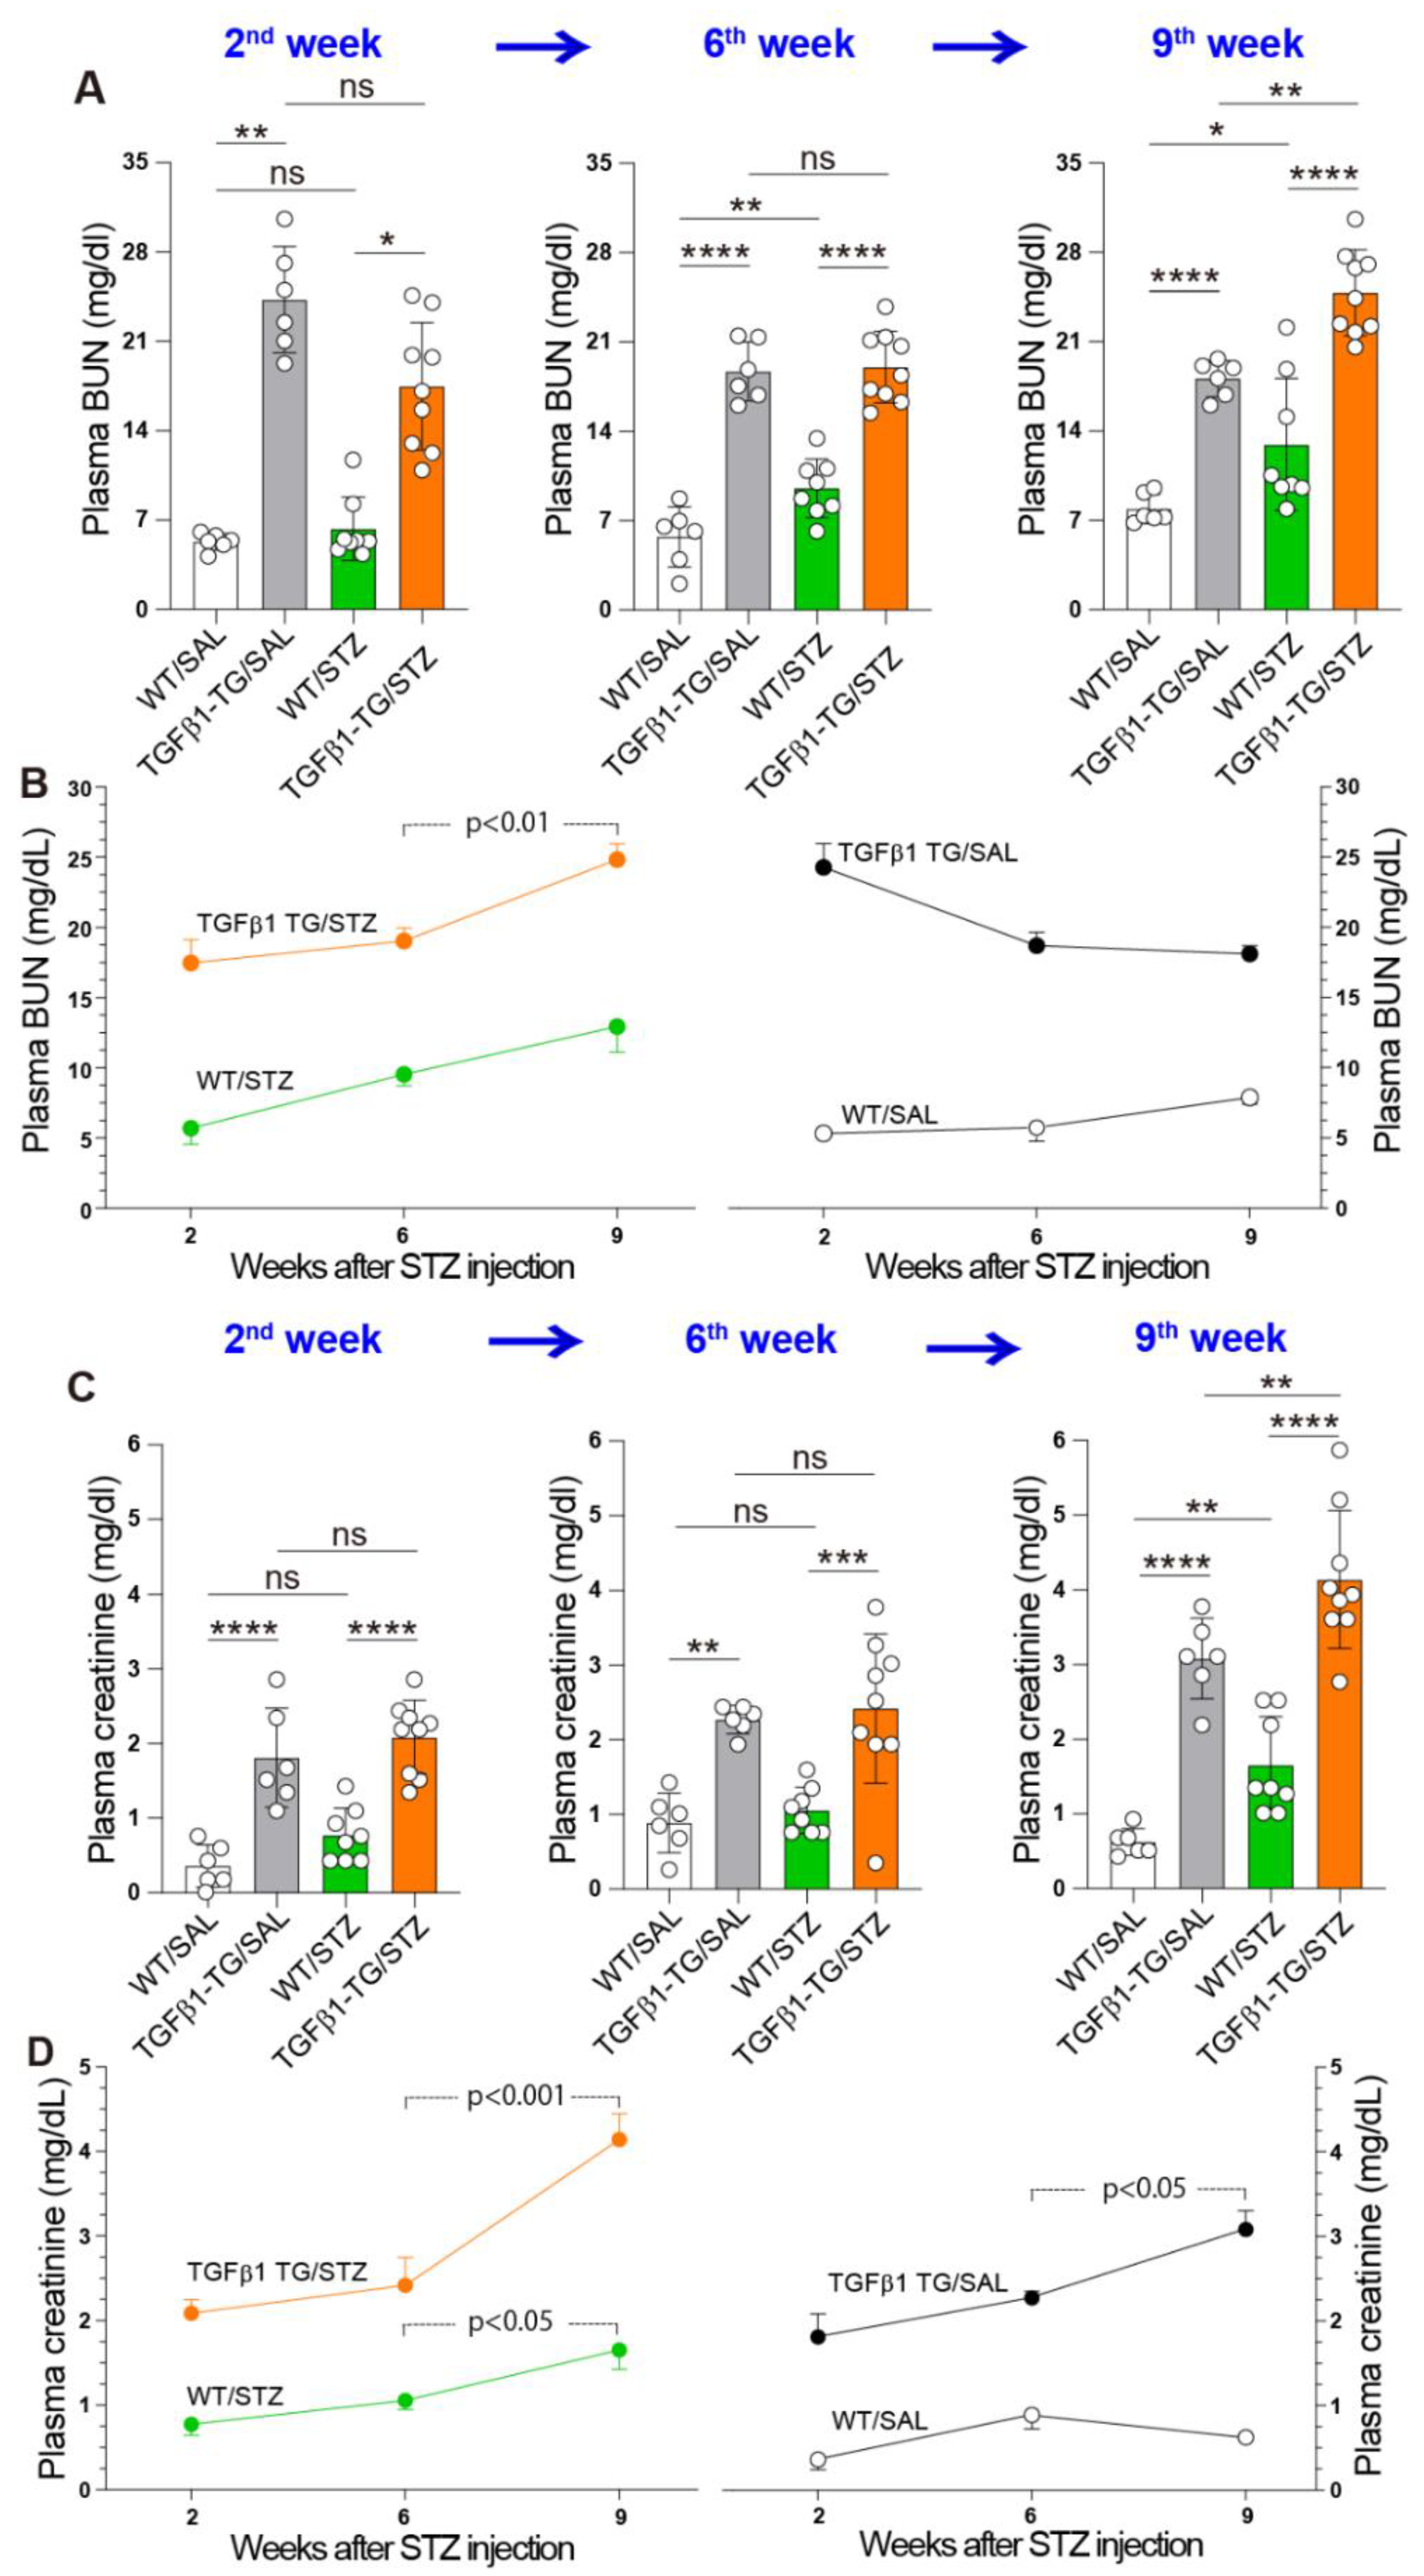
2.6. Progressive Renal Dysfunction in TGFβ1 TG Mice with DM

The blood urea nitrogen (BUN) and creatinine plasma levels were measured at weeks 2, 6, and 9 after the induction of DM with STZ. The non-diabetic TGFβ1 TG (TGFβ1 TG/SAL) mice showed significantly increased plasma levels of BUN compared to their non-diabetic WT (WT/SAL) counterparts at weeks 2, 6, and 9. The plasma levels of BUN were significantly increased in the diabetic TGFβ1 TG (TGFβ1 TG/STZ) mice compared to the diabetic WT (WT/STZ) mice at weeks 2, 6, and 9 after the induction of DM with STZ. The diabetic TGFβ1 TG mice showed no significant change in the plasma levels of BUN at weeks 2 and 6 after STZ injection, but the levels were significantly increased in the diabetic TGFβ1 TG mice compared to the non-diabetic TGFβ1 TG mice at week 9 after STZ injection. The plasma BUN levels were significantly increased at weeks 6 and 9 after STZ injection in the diabetic WT compared to the non-diabetic WT group (Figure 6A).
The comparative evaluation of the plasma levels of BUN over the weeks showed a significant increase in the plasma levels of BUN at week 9 compared to week 6 in the diabetic TGFβ1 TG mice. The plasma BUN levels were also increased at week 9 compared to week 6 in the diabetic WT mice, but the increase was not statistically significant. There were no significant changes in the plasma BUN levels between weeks 6 and 9 in the non-diabetic TGFβ1 TG and non-diabetic WT mice (Figure 6B).
The plasma concentrations of creatinine were significantly increased in the diabetic TGFβ1 TG mice at weeks 2, 6, and 9 after STZ injection compared to their diabetic WT counterparts. The plasma creatinine levels were not significantly different between the diabetic and non-diabetic TGFβ1 TG mice at weeks 2 and 6 after STZ injection but significantly increased in the diabetic TGFβ1 TG mice compared to the non-diabetic TGFβ1 TG mice at week 9 after the induction of DM with STZ. The non-diabetic TGFβ1 TG mice showed significantly elevated plasma levels of creatinine at weeks 2, 6, and 9 after STZ injection compared to the non-diabetic WT counterparts. The plasma creatinine levels were significantly increased in the diabetic WT mice compared to the non-diabetic WT mice 9 weeks after the induction of DM with STZ (Figure 6C).
The comparative evaluation of the plasma levels of creatinine over the weeks showed a significant and strong increase in the plasma levels of creatinine oat week 9 compared to week 6 in the diabetic TGFβ1 TG mice. The plasma creatinine levels in the diabetic WT mice were also increased at week 9 compared to week 6, but the increase was weak. The plasma creatinine levels in the non-diabetic TGFβ1 TG mice were also weakly increased at week 9 compared to week 6 (Figure 6D).

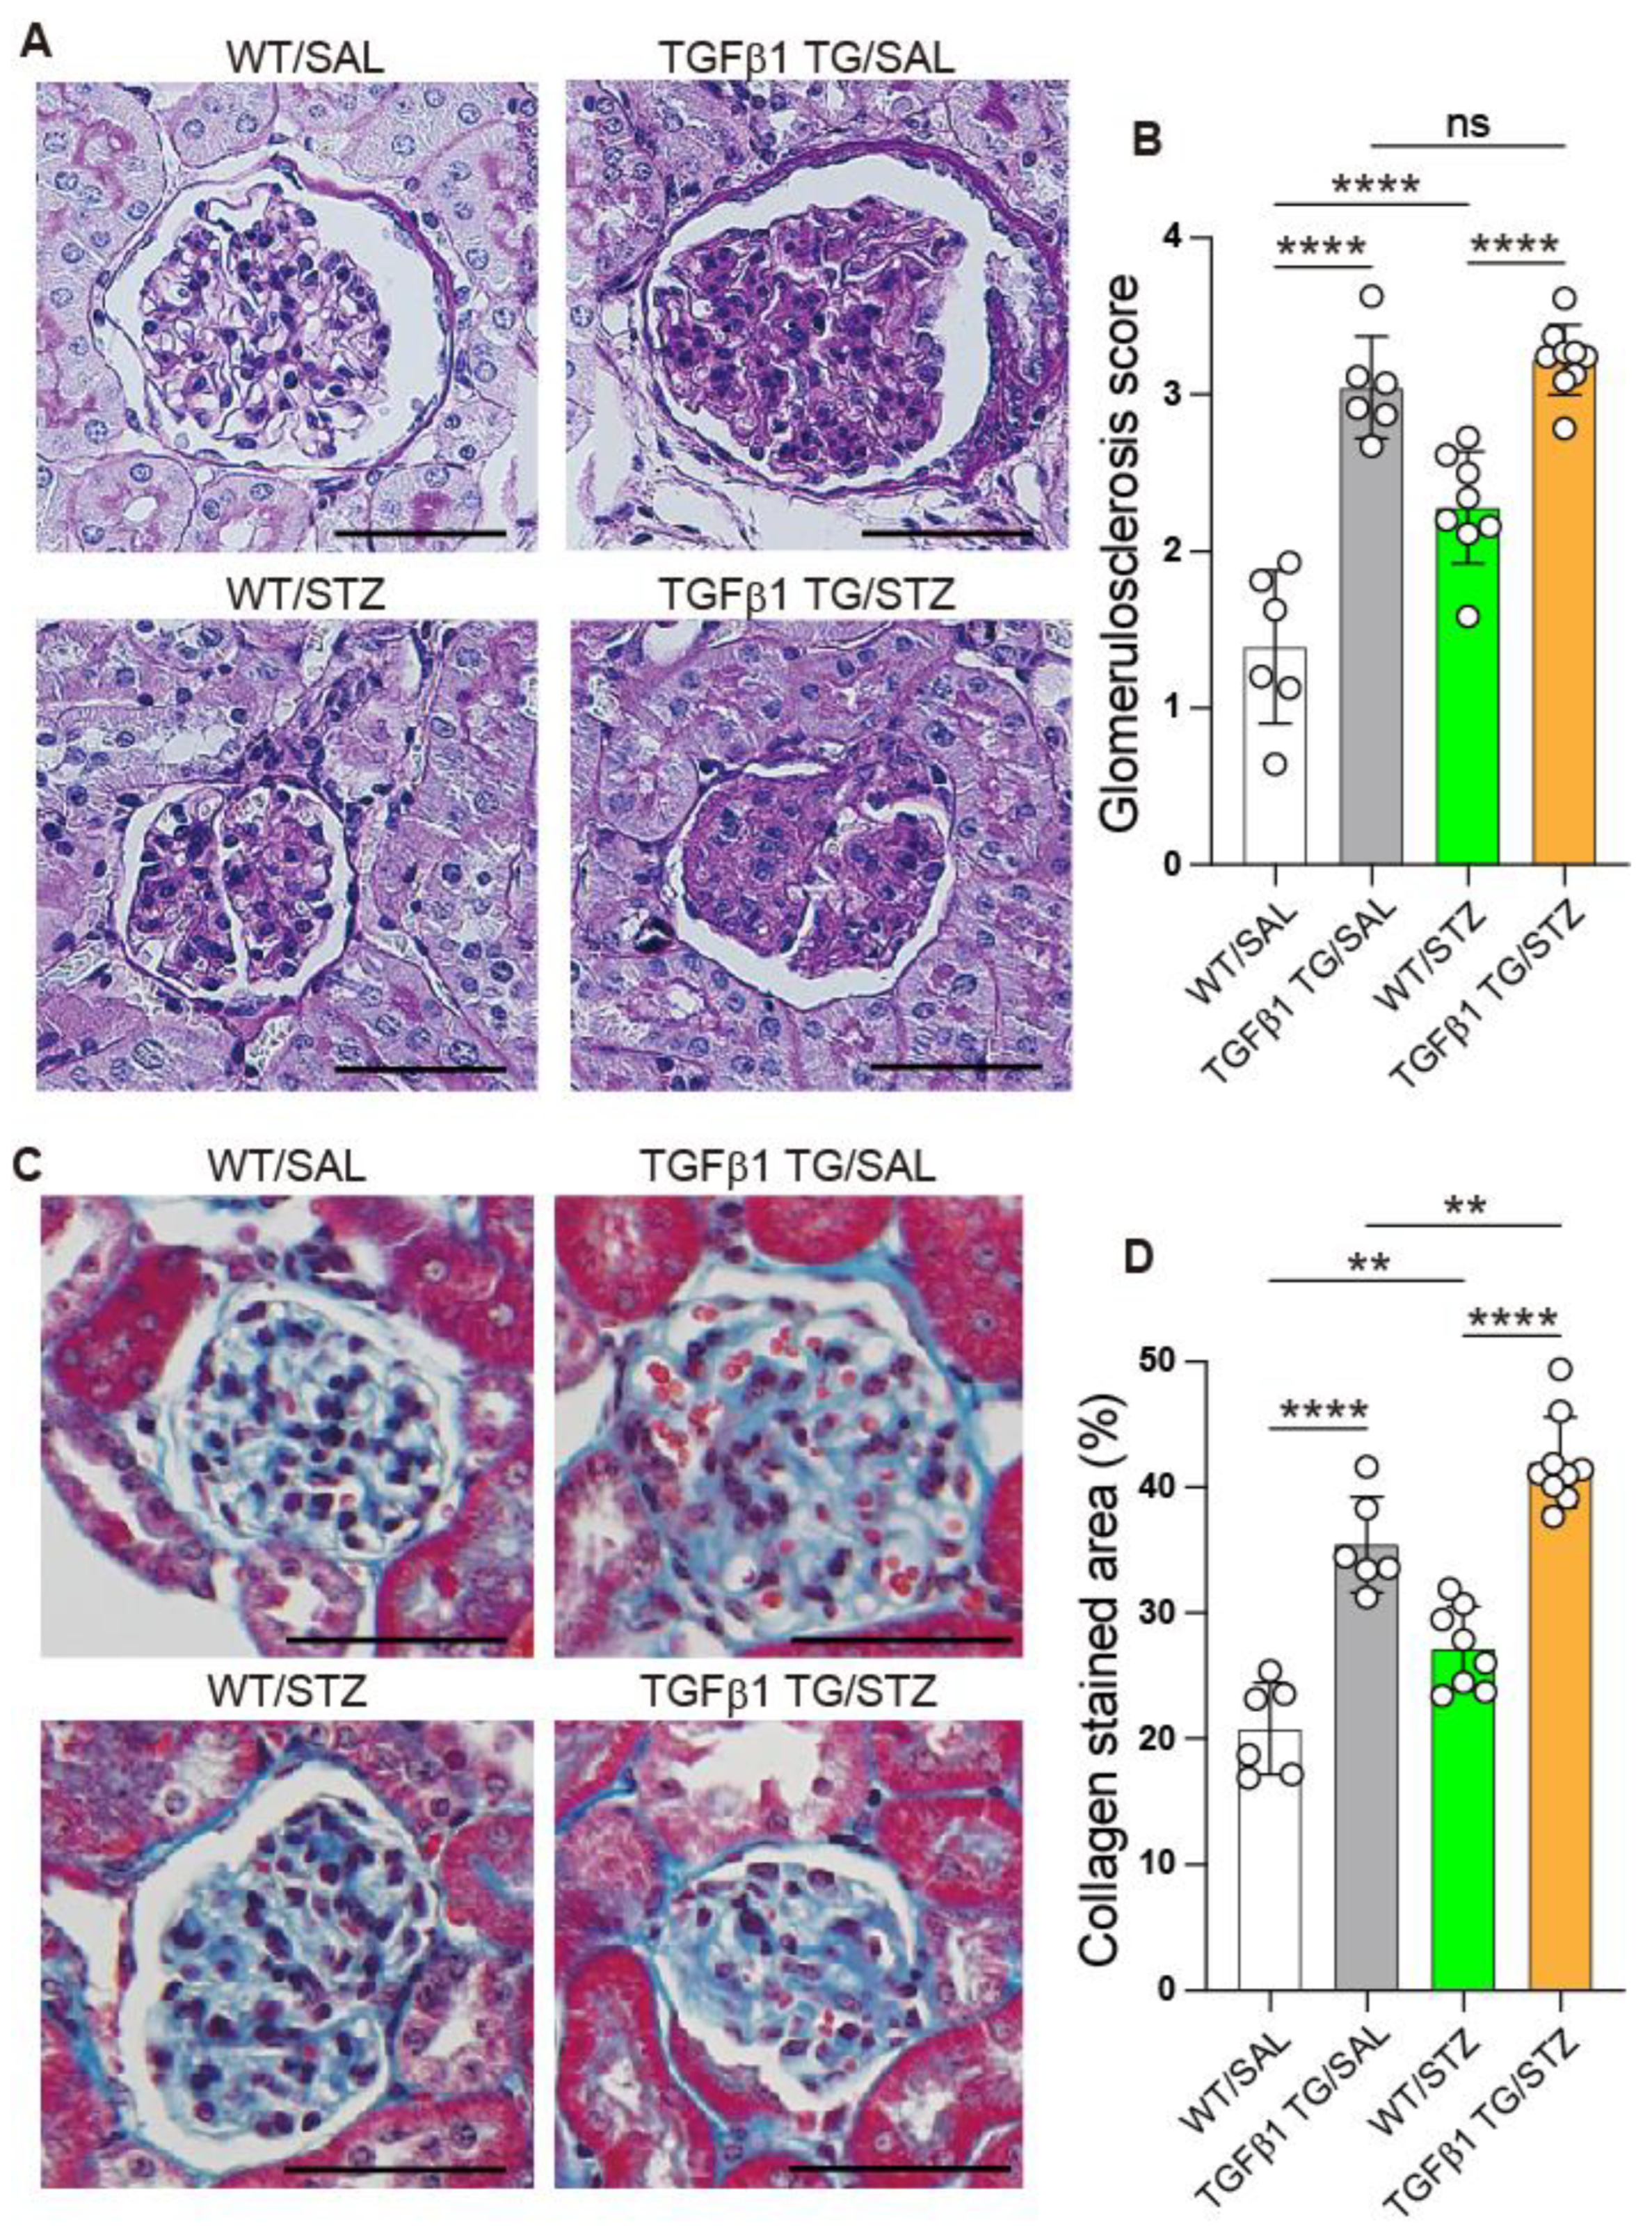
2.7. Progressive Glomerulosclerosis in Diabetic TGFβ1 TG Mice

Renal tissue specimens were cut and stained with periodic acid–Schiff and Masson’s trichrome to evaluate the fibrosis grade of each group. The tissue slides were used for the scoring of glomerulosclerosis. The glomerulosclerosis score was not significantly increased in the diabetic TGFβ1 TG mice compared to the non-diabetic TGFβ1 TG mice but significantly increased in the diabetic TGFβ1 TG mice compared to the diabetic WT mice. The non-diabetic TGFβ1 TG mice and diabetic WT mice showed significantly higher glomerulosclerosis scores than the non-diabetic WT mice (Figure 7A,B). The glomerular area stained with collagen (trichrome) was significantly increased in the diabetic TGFβ1 TG mice compared to the diabetic WT mice and non-diabetic TGFβ1 TG mice. The area stained with collagen was also significantly enhanced in the diabetic WT mice compared to the non-diabetic WT mice (Figure 7C,D).

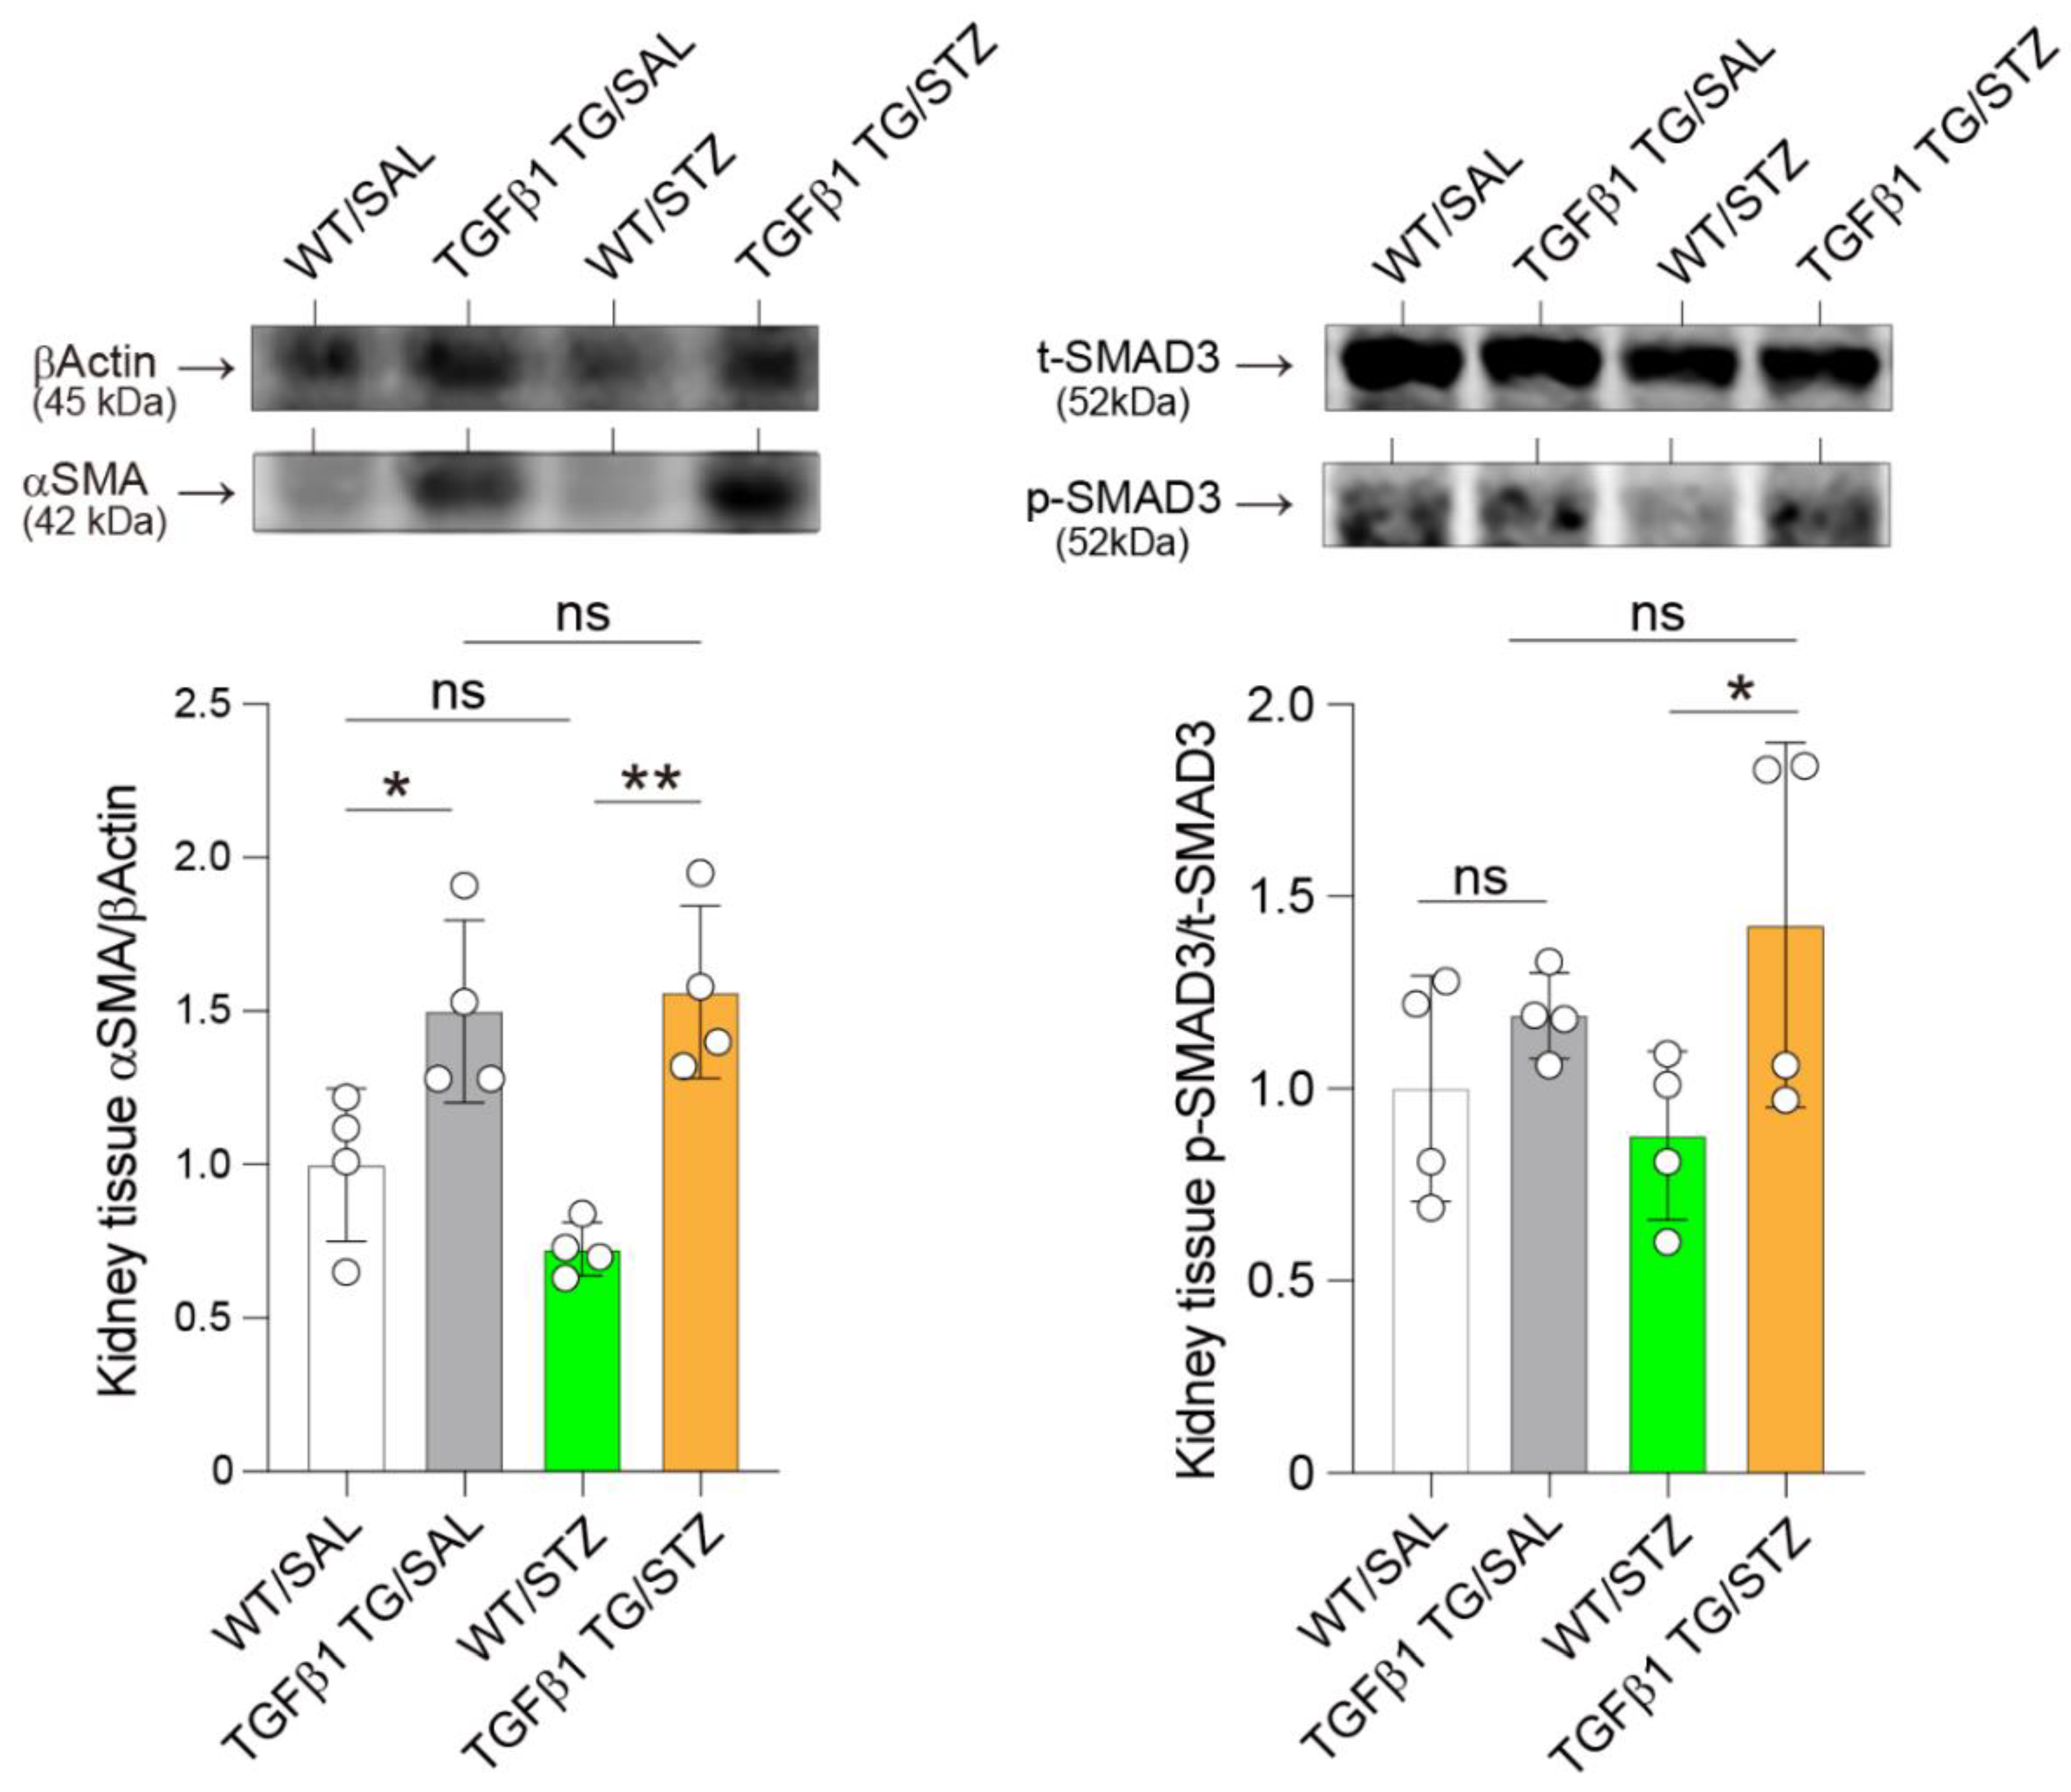
2.8. Elevated Renal Expression of Fibrosis Markers in Diabetic TGFβ1 TG Mice
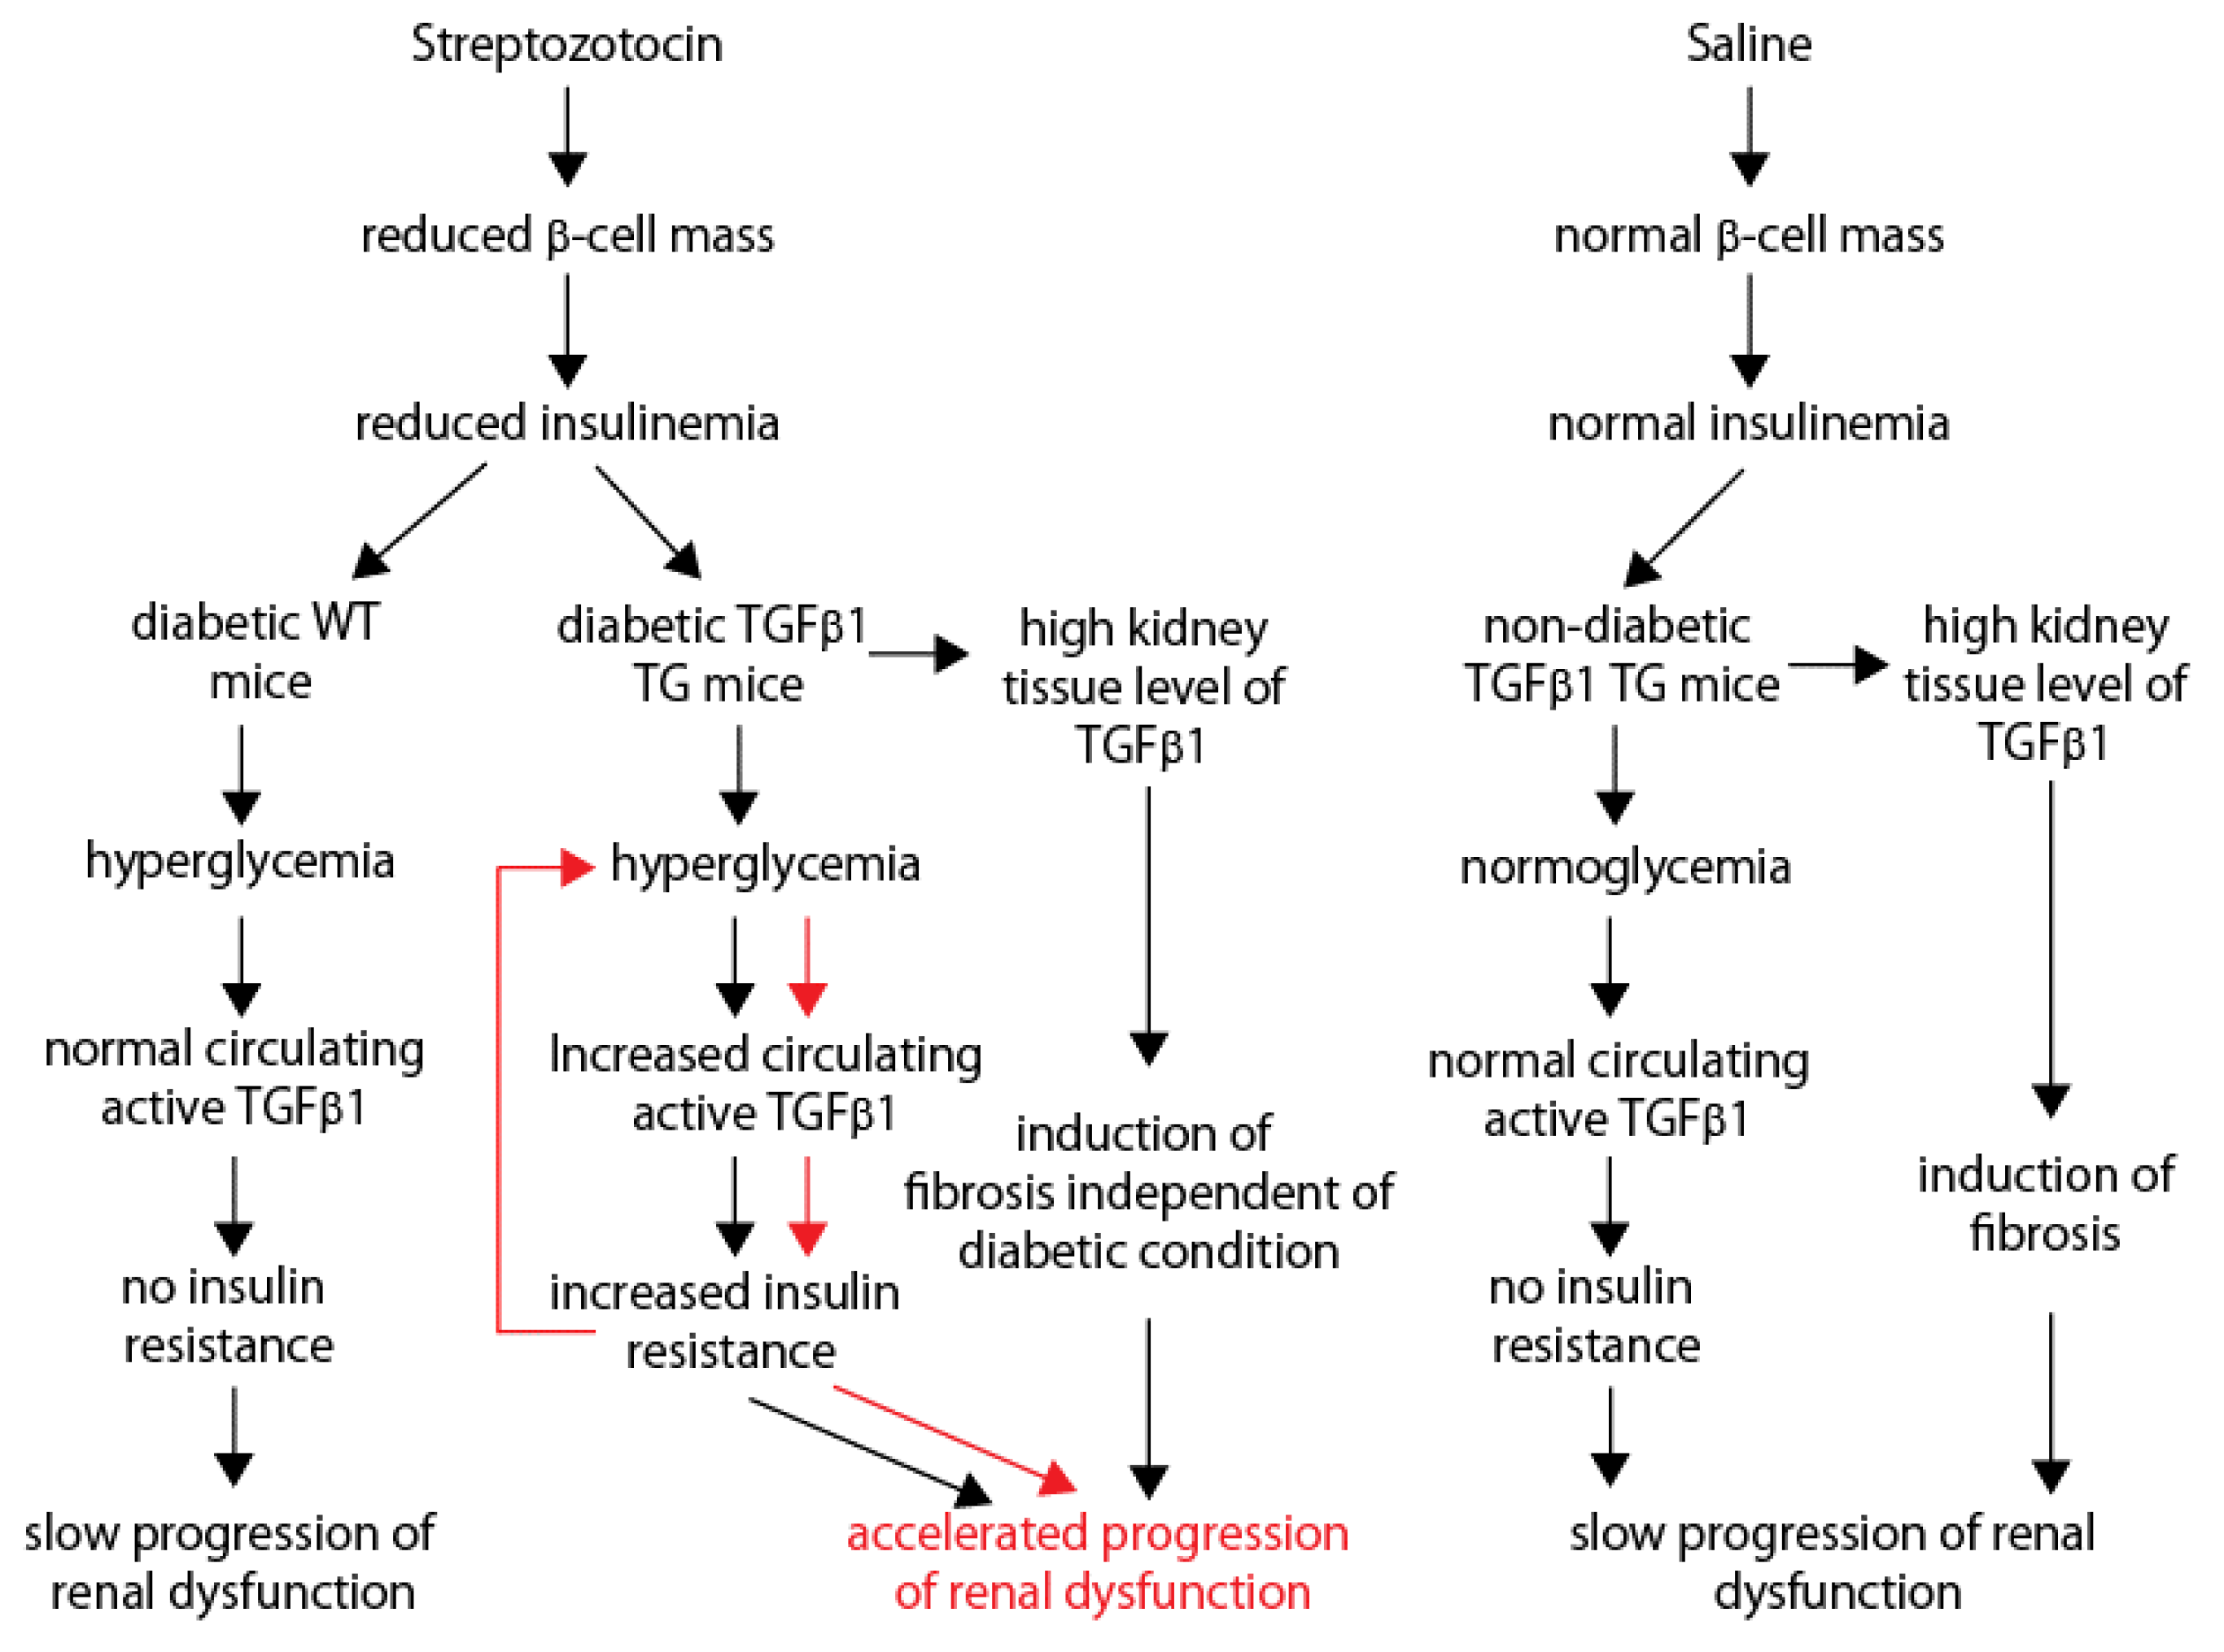
The protein expression of α-SMA and activation of SMAD3 were assessed by western blotting. The protein expression of αSMA was significantly increased in the diabetic TGFβ1 TG mice compared to the diabetic WT mice. The non-diabetic TGFβ1 TG mice also showed a significantly increased level of αSMA in the renal tissues compared to their non-diabetic WT counterparts. The phosphorylation of SMAD3 was significantly increased in the diabetic TGFβ1 TG mice compared to the diabetic WT mice. No significant difference was observed between the diabetic and non-diabetic WT mice (Figure 8).

3. Discussion

In the present study, we found that the overexpression of TGFβ1 in the kidneys is associated with insulin resistance and the rapid progression of glomerulosclerosis under diabetic conditions in mice.
A worse clinical course and poor prognosis have been reported in patients with diabetic nephropathy compared to non-diabetic nephropathy [8,9,10]. The abnormal circulating glucose levels and their metabolic consequences may contribute to this poor clinical outcome in patients with DM-associated chronic kidney disease [7]. However, the mediating factor is unclear. Previous human studies have shown systemic levels of TGFβ1 increase in type-1 and type-2 DM, obesity with insulin resistance, and diabetic nephropathy [11,21,34,35,36,37,38,39]. Evidence from experimental animal and in vitro studies also recapitulated the pathogenic role of TGFβ1 in diabetic nephropathy [40,41,42,43]. An important factor that triggers the enhanced expression of TGFβ1 in the kidneys is hyperglycemia [44,45,46,47,48]. Even a transient increase in the blood glucose levels has been shown to enhance the urinary levels of TGFβ1 in humans [49]. Hyperglycemia can stimulate TGFβ1 expression by inducing the activation of the human TGFβ1 promoter through the AP-1 transcription factor under the regulation of the protein kinase C and p38 mitogen-activated protein kinase pathways or by transcriptional activation induced by a putative glucose-responsive element present in the TGFβ1 promoter [45,47]. In addition to enhancing the production of TGFβ1, hyperglycemia can also promote the inflammatory response by activating the macrophages through the TGFβ1-activated kinase (TAK1) that induces the release of pro-inflammatory cytokines by NFκB activation [50]. In addition, insulin resistance combined with hyperinsulinemia and hyperglycemia has been reported to upregulate the expression of TGFβ1 in the kidneys in the pre-diabetes phase in humans [36,49,51]. All types of resident renal cells and infiltrating inflammatory cells can act as sources and exacerbate the release of TGFβ1 in the pre-diabetes phase [19,36,49,51]. In the present study, we induced a DM state in WT mice and TGFβ1 TG mice overexpressing the human TGFβ1 in the kidneys and evaluated whether hyperglycemia affected the circulating levels of TGFβ1. We found that the blood levels of active TGFβ1 were significantly increased in the diabetic TGFβ1 TG (TGFβ1 TG/STZ) compared to the non-diabetic TGFβ1 TG (TGFβ1 TG/SAL) mice and diabetic WT mice (WT/STZ), suggesting an enhanced TGFβ1 activation in the presence of hyperglycemia. Cells synthesize and secrete TGFβ1 as a latent protein [52]. The activation of the latent form of TGFβ1 may be facilitated by commonly hyperglycemia-associated conditions, including metabolic acidosis, oxidative stress, and the increased expression of thrombospondin-1, integrins, or plasmin [53,54,55,56,57,58].
Another important finding of the present study is the accelerated progression of renal dysfunction in the diabetic TGFβ1 TG (TGFβ1 TG/STZ) mice compared to the non-diabetic TGFβ1 TG (TGFβ1 TG/SAL) mice and diabetic WT (WT/STZ) mice. The plasma levels of the renal dysfunction markers BUN and creatinine were not significantly different between the diabetic and non-diabetic TGFβ1 TG mice at weeks 2 or 6, but they were significantly increased in the diabetic TGFβ1 TG mice at week 9 compared to the non-diabetic TGFβ1 TG mice. In addition, while the increase in the plasma levels of BUN and creatinine was remarkably high in the diabetic TGFβ1 TG mice at week 9 compared to week 6, the increase was weak in the non-diabetic TGFβ1 TG mice and diabetic WT mice. The only difference between the TGFβ1/SAL and TGFβ1 TG/STZ groups was the presence of hyperglycemia with high circulating levels of active TGFβ1. Therefore, we speculate that the explanation for the significant and rapid progression of renal dysfunction in the TGFβ1 TG/STZ group compared to the TGFβ1 TG/SAL group and diabetic WT mice is the presence of hyperglycemia with a high circulating level of active TGFβ1. In line with this finding, the collagen deposition area in the kidneys was significantly increased in the diabetic TGFβ1 TG mice compared to the non-diabetic TGFβ1 TG mice and diabetic WT mice. A potential explanation for this is the increased accumulation of collagen-producing αSMA-positive myofibroblasts induced by the activation of the TGFβ1/SMAD3 signal pathway [11]. The increased SMAD3 phosphorylation and αSMA expression in the kidneys, compared to the WT/STZ mice, supports this explanation. Overall, these results support, at least in part, the role of TGFβ1 as a mediator of accelerated and progressive nephropathy under diabetic conditions. However, it is worth noting that the expression of αSMA and SMAD3 phosphorylation in the kidneys was not affected by the difference in the circulating levels of active TGFβ1 between the diabetic and non-diabetic TGFβ1 TG mice. A probable explanation for this observation is the short-term follow-up. In our present study, all the mouse groups were followed-up for only 9 weeks. Therefore, an experimental protocol with a longer follow-up period would probably be required to detect significant changes in αSMA and phosphorylated SMAD3 in the kidneys between diabetic and non-diabetic TGFβ1 TG mice. Future studies should address this important question.
TGFβ1 may also worsen the diabetic state by decreasing the sensitivity to insulin. Several cases of evidence support this assumption. For example, TGFβ1 and its intracellular SMAD signaling pathway have been associated with insulin resistance in women with polycystic ovary syndrome [59,60,61]. Other researchers observed that SMAD knockout mice were protected from diet-induced obesity and DM, that elevated concentrations of TGFβ1 increases the risk of developing type-2 DM, that SMAD proteins are involved in obesity-induced glucose, and that lipid abnormalities support the role of TGFβ1 signaling in the pathogenesis of insulin resistance and DM [22,26,62,63,64]. In particular, the activation of SMAD3 appears to play a critical role in TGFβ1-mediated insulin resistance [65,66]. In addition, TGFβ1 may also contribute to insulin resistance through its modulatory activity on SMAD-independent pathways, including mitogen-activated protein kinases and Akt [67,68,69]. The remodeling of the extracellular matrix by TGFβ1 in the skeletal muscles may also contribute to insulin resistance. A physical barrier created by enhanced collagen deposition in the endomysium, epimysium, and basement membrane in the muscles may impair glucose uptake and the binding of insulin to its cell surface receptor, leading to insulin resistance [65,70,71,72,73,74]. The persistently high blood glucose levels, the abnormal glucose tolerance test, and the increased HOMA-IR values in the diabetic TGFβ1 TG mice compared to the non-diabetic TGFβ1 TG mice and diabetic WT mice and the inhibitory effect of TGFβ1 on insulin activity in the hepatocyte and myotubes observed in the present study reinforce the role of TGFβ1 in insulin resistance.
Another important observation that supports the role of TGFβ1 overexpression in insulin resistance in the present study is the significant difference in the glucose levels between the diabetic TGFβ1 TG mice and diabetic WT mice. In the present study, we induced diabetes following a universally accepted experimental protocol (one intraperitoneal injection per day of STZ for five consecutive days) [75,76,77]. The destructive effect of STZ on the pancreatic islets was moderate in both the WT/STZ and TGFβ1 TG/STZ groups, and there was no significant difference in the plasma insulin levels between the WT/STZ and TGFβ1 TG/STZ groups. However, despite this moderate destructive effect of STZ, mice from the WT/STZ group became significantly diabetic, as shown in Figure 2A (significantly increased glucose levels in WT/STZ versus WT/SAL at weeks 3 and 5 after STZ injection) and Figure 2B (significantly increased glucose levels in WT/STZ versus WT/SAL after 15 and 120 min during the glucose tolerance test). In addition, despite the lack of significant differences in the pancreatic islet area and plasma insulin levels between the WT/STZ and TGFβ1 TG/STZ mice, there was a dramatic and significant increase in the weekly glucose levels (weeks 3, 5, and 7 in Figure 2A) and in the glucose levels during the glucose tolerance test (30 and 60 min in Figure 2B) in the TGFβ1 TG/STZ group compared to the WT/STZ group. What is the explanation for the worse diabetic condition of the TGFβ1 TG/STZ mice compared to the WT/STZ mice? The only reasonable explanation for the significant difference in the glucose levels after the STZ injection and during the glucose tolerance test between the TGFβ1 TG/STZ and WT/STZ groups is the increased circulating TGFβ1-associated insulin resistance, as confirmed by the significantly increased HOMA-IR in the TGFβ1 TG/STZ mice compared to the WT/STZ mice, as described in Figure 2C. These findings further support the detrimental effect of TGFβ1 overexpression on insulin sensitivity under diabetic conditions.
A critical question that needs to be addressed is: to what extent can renal dysfunction be attributed to the direct effect of hyperglycemia on the diabetic TGFβ1 TG mice due to insulin resistance (and the related glucotoxicity) compared to the increased circulating active TGFβ1 levels? Based on the results of our present study, we speculate that the following sequential events may explain the rapidly progressive renal dysfunction in diabetic TGFβ1 TG mice: a reduction in the islet β-cell mass by STZ induces a vicious cycle, where hyperglycemia increases the circulating levels of active TGFβ1, which further worsens hyperglycemia by inducing insulin resistance (Figure 9). Consequently, the high level of TGFβ1 in the kidneys and the high circulating level of active TGFβ1 lead to accelerated renal dysfunction in diabetic TGFβ1 TG mice. Non-diabetic TGFβ1 TG mice and diabetic WT mice show no high levels of circulating active TGFβ1 and, thus, the course of renal dysfunction is slow.

4. Materials and Methods

4.1. Animals

A TGFβ1 transgenic (TG) mouse in a C57BL/6J background overexpresses, specifically in the glomeruli (podocytes), the full-length human TGFβ1 gene under the control of the mouse podocin promoter [18]. To generate the TG mouse, a chimeric podocin TGFβ1 bacterial artificial chromosome transgenic construct that harbors the full-length coding exons and an intervening intron of human TGFβ1 in place of the mouse podocin gene locus by bacterial artificial-chromosome-recombination-mediated genetic engineering was prepared. The transgenic mouse was then generated by the pronuclear injection of the chimeric construct into C57BL/6J mouse embryos. The transgenic founders were confirmed by southern blotting [18]. The TGFβ1 TG mice developed spontaneously progressive and fatal kidney fibrosis. The C57BL/6 mice were provided by Nihon SLC (Hamamatsu, Japan) [18]. Male 8- to 10-week-old WT and TGFβ1 mice were used in all the experiments. The breeding was performed in the animal laboratory of Mie University in a pathogen-free environment at 25 °C, with a humidity of about 50%. The mice were subjected to a light/dark cycle of 12 h each and provided with food and water ad libitum. The experimental protocols were approved by the Committee on Animal Investigation of Mie University (approval no. 27-4; date: 19 August 2015), and all the procedures were carried out according to the institutional guidelines.

4.2. Induction of Experimental Diabetes

The WT and TGFβ1 TG mice were intraperitoneally injected with STZ (Sigma, St. Louis, MO, USA) to develop diabetes. STZ was administered at a dose of 40 mg/kg body weight for five consecutive days [76]. In addition, a group of mice that received an intraperitoneal injection of saline (SAL) were used as the controls. The mice were allocated to four experimental groups: WT mice that received intraperitoneal STZ (WT/STZ) or SAL (WT/SAL), and TGFβ1 TG mice that received intraperitoneal STZ (TGFβ1 TG/STZ) or SAL (TGFβ1 TG/SAL). All the mice that received an injection of STZ or SAL were included in the evaluation of hyperglycemia.

4.3. Evaluation of Glucose Parameters

The blood levels of glucose were measured weekly after the intraperitoneal administration of STZ. The glucose tolerance test was performed in the 4th week after STZ injection as follows: mice that fasted overnight received an intraperitoneal injection of glucose at a dose of 1 g/kg, and the blood glucose levels were measured after 0, 15, 30, 60, and 120 min, as previously described [78]. The glucose-stimulated insulin secretion test was performed after 16 h of fasting by an intraperitoneal injection of glucose at a dose of 3 g/kg of the mouse body weight. Blood was collected from the tail vein at 0, 2, 10, and 30 min after the glucose injection. The blood glucose level was measured by the glucose oxidase method, and the blood insulin concentration was measured using an ALPCO measuring instrument kit (Salem, NH, USA).

4.4. Histological Study

An overdose of isoflurane was used to euthanize the animals, followed by exsanguination nine weeks after the STZ injection. The pancreas and kidney tissues were incised, dehydrated, embedded in paraffin, and cut into 3 µm-thick sections for hematoxylin and eosin, periodic acid–Schiff, or Masson’s trichrome staining following standard methods. The slides were observed under an optical microscope BX53, and several microphotographs were taken using a DP73 digital camera with DP controller software (Olympus, Tokyo, Japan). The area of pancreatic islets stained with hematoxylin and eosin was measured, and the total area was calculated in relation to the control group [32,79]. Glomerular sclerosis was evaluated as previously described [18]. Briefly, 10 glomeruli per mouse were randomly taken and scored according to the PAS-positive area based on the following criteria: score 0: normal glomeruli, score 1: mild mesangial thickness (PAS positive area < 25%), score 2: moderate segmental sclerosis (PAS positive area 25–50%), score 3: severe segmental sclerosis (PAS positive area 50–75%), and score 4: global sclerosis (PAS positive area ≥ 75%). Each mouse’s average score of 10 glomeruli was considered as the glomerular sclerosis score. The scoring was performed by 8 investigators blinded to the treatment groups. The grade of kidney fibrosis was estimated using tissue samples stained with Masson’s trichrome. Five microphotographs of the glomeruli per mouse were randomly taken, and the percentage of fibrosis was evaluated. The Masson-trichrome-positive area/glomerulus area ratio was calculated using WinROOF image processing software (Mitani Corp., Fukui, Japan), and the fibrosis grade was compared between groups, as previously described [18]. An investigator blinded to the treatment group performed the test using a BX50 microscope with a plan objective, combined with an Olympus DP70 digital camera (Tokyo, Japan) and the WinROOF image processing software (Mitani Corp., Fukui, Japan).

4.5. Cell Culture

L6 rat skeletal myoblasts, provided by Hitoshi Ashida, Kobe University, and HepG2 cells (RIKEN Cell Bank, Ibaraki, Japan) were cultured in Dulbecco’s modified Eagle’s medium (DMEM; Sigma-Aldrich) containing 10% (v/v) heat-inactivated fetal calf serum (FCS) in a humidified atmosphere at 37 °C with 5% CO2. The L6 rat skeletal myoblasts were fused into myotubes by changing the media to DMEM supplemented with 2% FBS for 2–4 days after confluence. The L6 and HepG2 cells were incubated in DMEM + 1% BSA for 6 h and placed in DMEM + 1 g/L glucose immediately before the addition of TGFβ1. Then, 30 min after the TGFβ1 treatment, insulin (200 nM) was added, and the cells were cultured for 4 h. The Glucose Colorimetric Assay Kit (BioVision) was used to measure the glucose content of the culture supernatant.

4.6. Biochemical Analysis

The plasma creatinine levels were measured by an enzymatic method and blood urea nitrogen was measured by a colorimetric method (NCalTM NIST-Calibrated kit; Arbor Assays, Ann Arbor, MI, USA) according to the manufacturer’s instructions. The plasma concentrations of total and active TGFβ1 were measured using a commercially available immune assay kit (R&D Systems, Minneapolis, MN, USA) following the manufacturer’s instructions. The homeostasis model assessment for insulin resistance (HOMA-IR) was determined as follows: HOMA-IR = [fasting insulin (µU/mL) × fasting glucose (mmol/L)]/22.5 (17).

4.7. Western Blotting

Standard methods were used to perform western blotting using antibodies against phosphorylated SMAD3, total SMAD3, α-smooth muscle actin (α-SMA), and β-actin from Cell Signaling (Danvers, MA, USA).

4.8. Statistical Analysis

Data are expressed as the mean ± standard deviation (S.D.) unless otherwise specified. The distribution of all the parameters was evaluated using the Shapiro–Wilk test. Statistical differences between variables with a normal distribution were evaluated by one-way analysis of variance (ANOVA) with the Newman–Keuls’ test. Variables with a skewed distribution were evaluated by Kruskal–Wallis one-way ANOVA with Dunn’s test. For the statistical analysis, we used Graph-pad Prism version 9.0 (San Diego, CA, USA). A p < 0.05 was considered significant.

5. Conclusions

This study shows that increased circulating levels of TGFβ1 under diabetic conditions are associated with the increased activation of TGFβ1, insulin resistance, and accelerated progression of kidney fibrosis and renal dysfunction.

Author Contributions

Conceptualization, E.C.G.; methodology, Y.Y., T.K. and H.F.; validation, A.T., T.Y. and K.N.; formal analysis, V.F.D., C.N.D.-G. and M.T.; investigation, M.T., Y.O., C.I. and S.T.; resources, Y.Y. and T.K.; data curation, K.N., T.Y. and Y.Y.; writing—original draft preparation, V.F.D., C.N.D.-G. and E.C.G.; writing—review and editing, E.C.G.; visualization, A.T.; supervision, T.K. and C.N.D.-G.; project administration, C.N.D.-G.; funding acquisition, T.Y., E.C.G., K.N., A.T. and T.Y. All authors have read and agreed to the published version of the manuscript.

Funding

This research was supported in part by (Kakenhi) grants from the Japan Society for the Promotion of Science awarded to E.C.G. (grant No. 20K08564), A.T. (grant No. 21K1685), T.Y. (grant No. 19K17960 and 21K16116), K.N. (grant No. 19K17738 and 21K16160), and Y.Y. (grant No. 21K08256). However, the funders had no role in the study design, data analysis, publication decision, or manuscript preparation.

Institutional Review Board Statement

The experimental protocols were approved by the Committee on Animal Investigation of Mie University (approval No. 27-4; date: 19 August 2015), and all procedures were carried out according to the institutional guidelines.

Informed Consent Statement

Not applicable.

Data Availability Statement

All the data obtained during the current study are available from the corresponding author upon reasonable request.

Conflicts of Interest

E.C.G and T.K. have a patent on the TGFβ1 TG mice used in the present study. The other authors declare no conflict of interest regarding the data reported in this work.

References

  1. GBD 2013 Risk Factors Collaborators; Forouzanfar, M.H.; Alexander, L.; Anderson, H.R.; Bachman, V.F.; Biryukov, S.; Brauer, M.; Burnett, R.; Casey, D.; Coates, M.M.; et al. Global, regional, and national comparative risk assessment of 79 behavioural, environmental and occupational, and metabolic risks or clusters of risks, 1990–2015: A systematic analysis for the Global Burden of Disease Study 2015. Lancet 2016, 388, 1659–1724. [Google Scholar] [CrossRef] [Green Version]
  2. Saeedi, P.; Petersohn, I.; Salpea, P.; Malanda, B.; Karuranga, S.; Unwin, N.; Colagiuri, S.; Guariguata, L.; Motala, A.A.; Ogurtsova, K.; et al. Global and regional diabetes prevalence estimates for 2019 and projections for 2030 and 2045: Results from the International Diabetes Federation Diabetes Atlas, 9(th) edition. Diabetes Res. Clin. Pract. 2019, 157, 107843. [Google Scholar] [CrossRef] [PubMed] [Green Version]
  3. World Health Organization. Diabetes [Internet]. Available online: https://www.who.int/news-room/fact-sheets/detail/diabetes (accessed on 1 September 2022).
  4. Harding, J.L.; Pavkov, M.E.; Magliano, D.J.; Shaw, J.E.; Gregg, E.W. Global trends in diabetes complications: A review of current evidence. Diabetologia 2019, 62, 3–16. [Google Scholar] [CrossRef] [PubMed] [Green Version]
  5. Shi, Y.; Vanhoutte, P.M. Macro- and microvascular endothelial dysfunction in diabetes. J Diabetes 2017, 9, 434–449. [Google Scholar] [CrossRef] [Green Version]
  6. Strain, W.D.; Paldanius, P.M. Diabetes, cardiovascular disease and the microcirculation. Cardiovasc. Diabetol. 2018, 17, 57. [Google Scholar] [CrossRef] [PubMed] [Green Version]
  7. Hung, P.H.; Hsu, Y.C.; Chen, T.H.; Lin, C.L. Recent Advances in Diabetic Kidney Diseases: From Kidney Injury to Kidney Fibrosis. Int. J. Mol. Sci. 2021, 22, 11857. [Google Scholar] [CrossRef]
  8. Chen, Q.; Zhu, A.; Wang, J.; Huan, X. Comparative analysis of diabetic nephropathy and non-diabetic nephropathy disease. Saudi J. Biol. Sci. 2017, 24, 1815–1817. [Google Scholar] [CrossRef]
  9. Lei, Y.; Xiong, Y.; Zhang, L.; Yan, H.; Li, Z.; Cao, L.; Huang, J.; Gu, A.; Ni, Z.; Qian, J.; et al. Comparison of Long-Term Outcomes between Peritoneal Dialysis Patients with Diabetes as a Primary Renal Disease or as a Comorbid Condition. PLoS ONE 2015, 10, e0126549. [Google Scholar] [CrossRef] [PubMed] [Green Version]
  10. Racki, S.; Zaputovic, L.; Vujicic, B.; Crncevic-Orlic, Z.; Dvornik, S.; Mavric, Z. Comparison of survival between diabetic and non-diabetic patients on maintenance hemodialysis: A single-centre experience. Diabetes Res. Clin. Pract. 2007, 75, 169–175. [Google Scholar] [CrossRef]
  11. Wang, L.; Wang, H.L.; Liu, T.T.; Lan, H.Y. TGF-Beta as a Master Regulator of Diabetic Nephropathy. Int. J. Mol. Sci. 2021, 22, 7881. [Google Scholar] [CrossRef]
  12. Sato, T.; Sakurai, H.; Okubo, K.; Kusuta, R.; Onogi, T.; Tsuboi, M. Current state of dialysis treatment and vascular access management in Japan. J. Vasc. Access 2019, 20, 10–14. [Google Scholar] [CrossRef] [PubMed]
  13. Bank, N. Mechanisms of diabetic hyperfiltration. Kidney Int. 1991, 40, 792–807. [Google Scholar] [CrossRef] [PubMed] [Green Version]
  14. Akhurst, R.J.; Hata, A. Targeting the TGFbeta signalling pathway in disease. Nat. Rev. Drug Discov. 2012, 11, 790–811. [Google Scholar] [CrossRef] [Green Version]
  15. D’Alessandro-Gabazza, C.N.; Kobayashi, T.; Boveda-Ruiz, D.; Takagi, T.; Toda, M.; Gil-Bernabe, P.; Miyake, Y.; Yasukawa, A.; Matsuda, Y.; Suzuki, N.; et al. Development and preclinical efficacy of novel transforming growth factor-beta1 short interfering RNAs for pulmonary fibrosis. Am. J. Respir. Cell Mol. Biol. 2012, 46, 397–406. [Google Scholar] [CrossRef] [PubMed]
  16. D’Alessandro-Gabazza, C.N.; Kobayashi, T.; Yasuma, T.; Toda, M.; Kim, H.; Fujimoto, H.; Hataji, O.; Takeshita, A.; Nishihama, K.; Okano, T.; et al. A Staphylococcus pro-apoptotic peptide induces acute exacerbation of pulmonary fibrosis. Nat. Commun. 2020, 11, 1539. [Google Scholar] [CrossRef] [Green Version]
  17. D’Alessandro-Gabazza, C.N.; Yasuma, T.; Kobayashi, T.; Toda, M.; Abdel-Hamid, A.M.; Fujimoto, H.; Hataji, O.; Nakahara, H.; Takeshita, A.; Nishihama, K.; et al. Inhibition of lung microbiota-derived proapoptotic peptides ameliorates acute exacerbation of pulmonary fibrosis. Nat. Commun. 2022, 13, 1558. [Google Scholar] [CrossRef]
  18. Takeshita, A.; Yasuma, T.; Nishihama, K.; D’Alessandro-Gabazza, C.N.; Toda, M.; Totoki, T.; Okano, Y.; Uchida, A.; Inoue, R.; Qin, L.; et al. Thrombomodulin ameliorates transforming growth factor-beta1-mediated chronic kidney disease via the G-protein coupled receptor 15/Akt signal pathway. Kidney Int. 2020, 98, 1179–1192. [Google Scholar] [CrossRef]
  19. Zhao, L.; Zou, Y.; Liu, F. Transforming Growth Factor-Beta1 in Diabetic Kidney Disease. Front. Cell Dev. Biol. 2020, 8, 187. [Google Scholar] [CrossRef] [Green Version]
  20. Jakus, V.; Sapak, M.; Kostolanska, J. Circulating TGF-beta1, glycation, and oxidation in children with diabetes mellitus type 1. Exp. Diabetes Res. 2012, 2012, 510902. [Google Scholar] [CrossRef] [Green Version]
  21. Qiao, Y.C.; Chen, Y.L.; Pan, Y.H.; Ling, W.; Tian, F.; Zhang, X.X.; Zhao, H.L. Changes of transforming growth factor beta 1 in patients with type 2 diabetes and diabetic nephropathy: A PRISMA-compliant systematic review and meta-analysis. Medicine 2017, 96, e6583. [Google Scholar] [CrossRef]
  22. Pervin, S.; Reddy, S.T.; Singh, R. Novel Roles of Follistatin/Myostatin in Transforming Growth Factor-beta Signaling and Adipose Browning: Potential for Therapeutic Intervention in Obesity Related Metabolic Disorders. Front. Endocrinol. 2021, 12, 653179. [Google Scholar] [CrossRef] [PubMed]
  23. Alessi, M.C.; Bastelica, D.; Morange, P.; Berthet, B.; Leduc, I.; Verdier, M.; Geel, O.; Juhan-Vague, I. Plasminogen activator inhibitor 1, transforming growth factor-beta1, and BMI are closely associated in human adipose tissue during morbid obesity. Diabetes 2000, 49, 1374–1380. [Google Scholar] [CrossRef] [PubMed] [Green Version]
  24. Fain, J.N.; Tichansky, D.S.; Madan, A.K. Transforming growth factor beta1 release by human adipose tissue is enhanced in obesity. Metabolism 2005, 54, 1546–1551. [Google Scholar] [CrossRef] [PubMed]
  25. Gordon, K.J.; Blobe, G.C. Role of transforming growth factor-beta superfamily signaling pathways in human disease. Biochim. Biophys. Acta 2008, 1782, 197–228. [Google Scholar] [CrossRef] [Green Version]
  26. Yadav, H.; Quijano, C.; Kamaraju, A.K.; Gavrilova, O.; Malek, R.; Chen, W.; Zerfas, P.; Zhigang, D.; Wright, E.C.; Stuelten, C.; et al. Protection from obesity and diabetes by blockade of TGF-beta/Smad3 signaling. Cell Metab. 2011, 14, 67–79. [Google Scholar] [CrossRef] [Green Version]
  27. Belosludtseva, N.V.; Starinets, V.S.; Pavlik, L.L.; Mikheeva, I.B.; Dubinin, M.V.; Belosludtsev, K.N. The Effect of S-15176 Difumarate Salt on Ultrastructure and Functions of Liver Mitochondria of C57BL/6 Mice with Streptozotocin/High-Fat Diet-Induced Type 2 Diabetes. Biology 2020, 9, 309. [Google Scholar] [CrossRef]
  28. Fernandez-Cabezudo, M.J.; George, J.A.; Bashir, G.; Mohamed, Y.A.; Al-Mansori, A.; Qureshi, M.M.; Lorke, D.E.; Petroianu, G.; Al-Ramadi, B.K. Involvement of Acetylcholine Receptors in Cholinergic Pathway-Mediated Protection Against Autoimmune Diabetes. Front. Immunol. 2019, 10, 1038. [Google Scholar] [CrossRef]
  29. Lopez-Soldado, I.; Fuentes-Romero, R.; Duran, J.; Guinovart, J.J. Effects of hepatic glycogen on food intake and glucose homeostasis are mediated by the vagus nerve in mice. Diabetologia 2017, 60, 1076–1083. [Google Scholar] [CrossRef] [Green Version]
  30. MacDonald, T.L.; Pattamaprapanont, P.; Cooney, E.M.; Nava, R.C.; Mitri, J.; Hafida, S.; Lessard, S.J. Canagliflozin Prevents Hyperglycemia-Associated Muscle Extracellular Matrix Accumulation and Improves the Adaptive Response to Aerobic Exercise. Diabetes 2022, 71, 881–893. [Google Scholar] [CrossRef]
  31. MacDonald, T.L.; Pattamaprapanont, P.; Pathak, P.; Fernandez, N.; Freitas, E.C.; Hafida, S.; Mitri, J.; Britton, S.L.; Koch, L.G.; Lessard, S.J. Hyperglycaemia is associated with impaired muscle signalling and aerobic adaptation to exercise. Nat. Metab. 2020, 2, 902–917. [Google Scholar] [CrossRef]
  32. Yasuma, T.; Yano, Y.; D’Alessandro-Gabazza, C.N.; Toda, M.; Gil-Bernabe, P.; Kobayashi, T.; Nishihama, K.; Hinneh, J.A.; Mifuji-Moroka, R.; Roeen, Z.; et al. Amelioration of Diabetes by Protein S. Diabetes 2016, 65, 1940–1951. [Google Scholar] [CrossRef] [PubMed] [Green Version]
  33. Leclercq, I.A.; Da Silva Morais, A.; Schroyen, B.; Van Hul, N.; Geerts, A. Insulin resistance in hepatocytes and sinusoidal liver cells: Mechanisms and consequences. J. Hepatol. 2007, 47, 142–156. [Google Scholar] [CrossRef]
  34. Chen, H.Y.; Ho, Y.J.; Chou, H.C.; Liao, E.C.; Tsai, Y.T.; Wei, Y.S.; Lin, L.H.; Lin, M.W.; Wang, Y.S.; Ko, M.L.; et al. The Role of Transforming Growth Factor-Beta in Retinal Ganglion Cells with Hyperglycemia and Oxidative Stress. Int. J. Mol. Sci. 2020, 21, 6482. [Google Scholar] [CrossRef] [PubMed]
  35. Esmatjes, E.; Flores, L.; Lario, S.; Claria, J.; Cases, A.; Inigo, P.; Campistol, J.M. Smoking increases serum levels of transforming growth factor-beta in diabetic patients. Diabetes Care 1999, 22, 1915–1916. [Google Scholar] [CrossRef] [PubMed]
  36. Huan, Y.; DeLoach, S.; Daskalakis, C.; Dunn, S.R.; Sharma, K.; Falkner, B. Regulation of transforming growth factor-beta1 by insulin in prediabetic African Americans. Kidney Int. 2010, 78, 318–324. [Google Scholar] [CrossRef] [Green Version]
  37. Pfeiffer, A.; Middelberg-Bisping, K.; Drewes, C.; Schatz, H. Elevated plasma levels of transforming growth factor-beta 1 in NIDDM. Diabetes Care 1996, 19, 1113–1117. [Google Scholar] [CrossRef] [PubMed]
  38. Romano, M.; Guagnano, M.T.; Pacini, G.; Vigneri, S.; Falco, A.; Marinopiccoli, M.; Manigrasso, M.R.; Basili, S.; Davi, G. Association of inflammation markers with impaired insulin sensitivity and coagulative activation in obese healthy women. J. Clin. Endocrinol. Metab. 2003, 88, 5321–5326. [Google Scholar] [CrossRef] [PubMed]
  39. Shankland, S.J.; Scholey, J.W.; Ly, H.; Thai, K. Expression of transforming growth factor-beta 1 during diabetic renal hypertrophy. Kidney Int. 1994, 46, 430–442. [Google Scholar] [CrossRef] [Green Version]
  40. Iwano, M.; Kubo, A.; Nishino, T.; Sato, H.; Nishioka, H.; Akai, Y.; Kurioka, H.; Fujii, Y.; Kanauchi, M.; Shiiki, H.; et al. Quantification of glomerular TGF-beta 1 mRNA in patients with diabetes mellitus. Kidney Int. 1996, 49, 1120–1126. [Google Scholar] [CrossRef] [Green Version]
  41. Sharma, K.; Ziyadeh, F.N. Hyperglycemia and diabetic kidney disease. The case for transforming growth factor-beta as a key mediator. Diabetes 1995, 44, 1139–1146. [Google Scholar] [CrossRef]
  42. Yamamoto, T.; Nakamura, T.; Noble, N.A.; Ruoslahti, E.; Border, W.A. Expression of transforming growth factor beta is elevated in human and experimental diabetic nephropathy. Proc. Natl. Acad. Sci. USA 1993, 90, 1814–1818. [Google Scholar] [CrossRef] [Green Version]
  43. Ziyadeh, F.N.; Sharma, K.; Ericksen, M.; Wolf, G. Stimulation of collagen gene expression and protein synthesis in murine mesangial cells by high glucose is mediated by autocrine activation of transforming growth factor-beta. J. Clin. Investig. 1994, 93, 536–542. [Google Scholar] [CrossRef] [PubMed]
  44. Han, D.C.; Isono, M.; Hoffman, B.B.; Ziyadeh, F.N. High glucose stimulates proliferation and collagen type I synthesis in renal cortical fibroblasts: Mediation by autocrine activation of TGF-beta. J. Am. Soc. Nephrol. 1999, 10, 1891–1899. [Google Scholar] [CrossRef] [PubMed]
  45. Hoffman, B.B.; Sharma, K.; Zhu, Y.; Ziyadeh, F.N. Transcriptional activation of transforming growth factor-beta1 in mesangial cell culture by high glucose concentration. Kidney Int. 1998, 54, 1107–1116. [Google Scholar] [CrossRef] [PubMed] [Green Version]
  46. Rocco, M.V.; Chen, Y.; Goldfarb, S.; Ziyadeh, F.N. Elevated glucose stimulates TGF-beta gene expression and bioactivity in proximal tubule. Kidney Int. 1992, 41, 107–114. [Google Scholar] [CrossRef] [PubMed] [Green Version]
  47. Weigert, C.; Sauer, U.; Brodbeck, K.; Pfeiffer, A.; Haring, H.U.; Schleicher, E.D. AP-1 proteins mediate hyperglycemia-induced activation of the human TGF-beta1 promoter in mesangial cells. J. Am. Soc. Nephrol. 2000, 11, 2007–2016. [Google Scholar] [CrossRef]
  48. Wolf, G.; Sharma, K.; Chen, Y.; Ericksen, M.; Ziyadeh, F.N. High glucose-induced proliferation in mesangial cells is reversed by autocrine TGF-beta. Kidney Int. 1992, 42, 647–656. [Google Scholar] [CrossRef] [Green Version]
  49. McGowan, T.A.; Dunn, S.R.; Falkner, B.; Sharma, K. Stimulation of urinary TGF-beta and isoprostanes in response to hyperglycemia in humans. Clin. J. Am. Soc. Nephrol. 2006, 1, 263–268. [Google Scholar] [CrossRef] [Green Version]
  50. Xu, X.; Qi, X.; Shao, Y.; Li, Y.; Fu, X.; Feng, S.; Wu, Y. High glucose induced-macrophage activation through TGF-beta-activated kinase 1 signaling pathway. Inflamm. Res. 2016, 65, 655–664. [Google Scholar] [CrossRef]
  51. Sharma, K.; Ziyadeh, F.N.; Alzahabi, B.; McGowan, T.A.; Kapoor, S.; Kurnik, B.R.; Kurnik, P.B.; Weisberg, L.S. Increased renal production of transforming growth factor-beta1 in patients with type II diabetes. Diabetes 1997, 46, 854–859. [Google Scholar] [CrossRef]
  52. Munger, J.S.; Harpel, J.G.; Gleizes, P.E.; Mazzieri, R.; Nunes, I.; Rifkin, D.B. Latent transforming growth factor-beta: Structural features and mechanisms of activation. Kidney Int. 1997, 51, 1376–1382. [Google Scholar] [CrossRef] [PubMed] [Green Version]
  53. Andersen, H.; Friis, U.G.; Hansen, P.B.; Svenningsen, P.; Henriksen, J.E.; Jensen, B.L. Diabetic nephropathy is associated with increased urine excretion of proteases plasmin, prostasin and urokinase and activation of amiloride-sensitive current in collecting duct cells. Nephrol. Dial. Transplant. 2015, 30, 781–789. [Google Scholar] [CrossRef] [PubMed] [Green Version]
  54. Bellasi, A.; Di Micco, L.; Santoro, D.; Marzocco, S.; De Simone, E.; Cozzolino, M.; Di Lullo, L.; Guastaferro, P.; Di Iorio, B.; UBI study investigators. Correction of metabolic acidosis improves insulin resistance in chronic kidney disease. BMC Nephrol. 2016, 17, 158. [Google Scholar] [CrossRef] [PubMed]
  55. Crawford, S.E.; Stellmach, V.; Murphy-Ullrich, J.E.; Ribeiro, S.M.; Lawler, J.; Hynes, R.O.; Boivin, G.P.; Bouck, N. Thrombospondin-1 is a major activator of TGF-beta1 in vivo. Cell 1998, 93, 1159–1170. [Google Scholar] [CrossRef] [Green Version]
  56. Fakhruddin, S.; Alanazi, W.; Jackson, K.E. Diabetes-Induced Reactive Oxygen Species: Mechanism of Their Generation and Role in Renal Injury. J. Diabetes Res. 2017, 2017, 8379327. [Google Scholar] [CrossRef] [Green Version]
  57. Khalil, N. TGF-beta: From latent to active. Microbes Infect. 1999, 1, 1255–1263. [Google Scholar] [CrossRef]
  58. Sawada, K.; Toyoda, M.; Kaneyama, N.; Shiraiwa, S.; Moriya, H.; Miyatake, H.; Tanaka, E.; Yamamoto, N.; Miyauchi, M.; Kimura, M.; et al. Upregulation of alpha3beta1-Integrin in Podocytes in Early-Stage Diabetic Nephropathy. J. Diabetes Res. 2016, 2016, 9265074. [Google Scholar] [CrossRef] [Green Version]
  59. McIlvenna, L.C.; Patten, R.K.; McAinch, A.J.; Rodgers, R.J.; Stepto, N.K.; Moreno-Asso, A. Transforming Growth Factor Beta 1 Alters Glucose Uptake but Not Insulin Signalling in Human Primary Myotubes From Women With and Without Polycystic Ovary Syndrome. Front. Endocrinol. 2021, 12, 732338. [Google Scholar] [CrossRef]
  60. Stepto, N.K.; Hiam, D.; Gibson-Helm, M.; Cassar, S.; Harrison, C.L.; Hutchison, S.K.; Joham, A.E.; Canny, B.J.; Moreno-Asso, A.; Strauss, B.J.; et al. Exercise and insulin resistance in PCOS: Muscle insulin signalling and fibrosis. Endocr. Connect. 2020, 9, 346–359. [Google Scholar] [CrossRef] [Green Version]
  61. Stepto, N.K.; Moreno-Asso, A.; McIlvenna, L.C.; Walters, K.A.; Rodgers, R.J. Molecular Mechanisms of Insulin Resistance in Polycystic Ovary Syndrome: Unraveling the Conundrum in Skeletal Muscle? J. Clin. Endocrinol. Metab. 2019, 104, 5372–5381. [Google Scholar] [CrossRef]
  62. Herder, C.; Zierer, A.; Koenig, W.; Roden, M.; Meisinger, C.; Thorand, B. Transforming growth factor-beta1 and incident type 2 diabetes: Results from the MONICA/KORA case-cohort study, 1984–2002. Diabetes Care 2009, 32, 1921–1923. [Google Scholar] [CrossRef] [PubMed] [Green Version]
  63. Seong, H.A.; Manoharan, R.; Ha, H. Smad proteins differentially regulate obesity-induced glucose and lipid abnormalities and inflammation via class-specific control of AMPK-related kinase MPK38/MELK activity. Cell Death Dis. 2018, 9, 471. [Google Scholar] [CrossRef] [PubMed] [Green Version]
  64. Tan, C.K.; Leuenberger, N.; Tan, M.J.; Yan, Y.W.; Chen, Y.; Kambadur, R.; Wahli, W.; Tan, N.S. Smad3 deficiency in mice protects against insulin resistance and obesity induced by a high-fat diet. Diabetes 2011, 60, 464–476. [Google Scholar] [CrossRef] [PubMed] [Green Version]
  65. Dantas, W.S.; Roschel, H.; Murai, I.H.; Gil, S.; Davuluri, G.; Axelrod, C.L.; Ghosh, S.; Newman, S.S.; Zhang, H.; Shinjo, S.K.; et al. Exercise-Induced Increases in Insulin Sensitivity After Bariatric Surgery Are Mediated By Muscle Extracellular Matrix Remodeling. Diabetes 2020, 69, 1675–1691. [Google Scholar] [CrossRef] [PubMed]
  66. Guo, Q.; Wei, X.; Hu, H.; Yang, D.; Zhang, B.; Fan, X.; Liu, J.; He, H.; Oh, Y.; Wu, Q.; et al. The saturated fatty acid palmitate induces insulin resistance through Smad3-mediated down-regulation of FNDC5 in myotubes. Biochem. Biophys. Res. Commun. 2019, 520, 619–626. [Google Scholar] [CrossRef]
  67. Alshehade, S.; Alshawsh, M.A.; Murugaiyah, V.; Asif, M.; Alshehade, O.; Almoustafa, H.; Al Zarzour, R.H. The role of protein kinases as key drivers of metabolic dysfunction-associated fatty liver disease progression: New insights and future directions. Life Sci. 2022, 305, 120732. [Google Scholar] [CrossRef]
  68. Demir, S.; Wolff, G.; Wieder, A.; Maida, A.; Buhler, L.; Brune, M.; Hautzinger, O.; Feuchtinger, A.; Poth, T.; Szendroedi, J.; et al. TSC22D4 interacts with Akt1 to regulate glucose metabolism. Sci. Adv. 2022, 8, eabo5555. [Google Scholar] [CrossRef]
  69. Wang, L.; Ma, R.; Flavell, R.A.; Choi, M.E. Requirement of mitogen-activated protein kinase kinase 3 (MKK3) for activation of p38alpha and p38delta MAPK isoforms by TGF-beta 1 in murine mesangial cells. J. Biol. Chem. 2002, 277, 47257–47262. [Google Scholar] [CrossRef] [Green Version]
  70. Berria, R.; Wang, L.; Richardson, D.K.; Finlayson, J.; Belfort, R.; Pratipanawatr, T.; De Filippis, E.A.; Kashyap, S.; Mandarino, L.J. Increased collagen content in insulin-resistant skeletal muscle. Am. J. Physiol. Endocrinol. Metab. 2006, 290, E560–E565. [Google Scholar] [CrossRef]
  71. Richardson, D.K.; Kashyap, S.; Bajaj, M.; Cusi, K.; Mandarino, S.J.; Finlayson, J.; DeFronzo, R.A.; Jenkinson, C.P.; Mandarino, L.J. Lipid infusion decreases the expression of nuclear encoded mitochondrial genes and increases the expression of extracellular matrix genes in human skeletal muscle. J. Biol. Chem. 2005, 280, 10290–10297. [Google Scholar] [CrossRef]
  72. Tam, C.S.; Chaudhuri, R.; Hutchison, A.T.; Samocha-Bonet, D.; Heilbronn, L.K. Skeletal muscle extracellular matrix remodeling after short-term overfeeding in healthy humans. Metabolism 2017, 67, 26–30. [Google Scholar] [CrossRef] [PubMed]
  73. Watts, R.; McAinch, A.J.; Dixon, J.B.; O’Brien, P.E.; Cameron-Smith, D. Increased Smad signaling and reduced MRF expression in skeletal muscle from obese subjects. Obesity 2013, 21, 525–528. [Google Scholar] [CrossRef] [PubMed]
  74. Williams, A.S.; Kang, L.; Wasserman, D.H. The extracellular matrix and insulin resistance. Trends Endocrinol. Metab. 2015, 26, 357–366. [Google Scholar] [CrossRef] [Green Version]
  75. Bonnevie-Nielsen, V.; Steffes, M.W.; Lernmark, A. A major loss in islet mass and B-cell function precedes hyperglycemia in mice given multiple low doses of streptozotocin. Diabetes 1981, 30, 424–429. [Google Scholar] [CrossRef] [PubMed]
  76. King, A.J. The use of animal models in diabetes research. Br. J. Pharmacol. 2012, 166, 877–894. [Google Scholar] [CrossRef] [Green Version]
  77. Like, A.A.; Rossini, A.A. Streptozotocin-induced pancreatic insulitis: New model of diabetes mellitus. Science 1976, 193, 415–417. [Google Scholar] [CrossRef]
  78. Okano, Y.; Takeshita, A.; Yasuma, T.; Toda, M.; Nishihama, K.; Fridman D’Alessandro, V.; Inoue, C.; D’Alessandro-Gabazza, C.N.; Kobayashi, T.; Yano, Y.; et al. Protective Role of Recombinant Human Thrombomodulin in Diabetes Mellitus. Cells 2021, 10, 2237. [Google Scholar] [CrossRef]
  79. Nishihama, K.; Yasuma, T.; Yano, Y.; CN, D.A.-G.; Toda, M.; Hinneh, J.A.; Baffour Tonto, P.; Takeshita, A.; Totoki, T.; Mifuji-Moroka, R.; et al. Anti-apoptotic activity of human matrix metalloproteinase-2 attenuates diabetes mellitus. Metabolism 2018, 82, 88–99. [Google Scholar] [CrossRef]
Figure 1. Increased circulating levels of total and active TGFβ1 in TGFβ1 TG mice with diabetes mellitus. The plasma levels of total and active TGFβ1 were measured by immunoassay using a commercial kit. The number of mice were as follows: WT/SAL n = 6, TGFβ1 TG/SAL n = 6, WT/STZ n = 8, TGFβ1 TG/STZ n = 9. Data are expressed as mean ± S.D. Statistical analysis by one-way analysis of variance (ANOVA) with Newman–Keuls’ test. ** p < 0.01; **** p < 0.0001; ns, not significant.
Ijms 23 14265 g001
Figure 2. Mice overexpressing transforming growth factorβ1 show insulin resistance. Mice received intraperitoneal injections of streptozotocin (STZ) for five days and were then sacrificed after 9 weeks. The control mice received intraperitoneal injections of saline for the same interval and schedule. (A) Blood glucose levels were measured every week for 9 weeks, as described in the Materials and Methods. (B) An intraperitoneal glucose tolerance test was performed, as described in the Materials and Methods. (C) The area under the curve during the intraperitoneal glucose tolerance test was calculated. Number of mice: n = 3 in WT/SAL, n = 5 in TGFβ1 TG/SAL, n = 4 in WT/STZ, n = 5 in TGFβ1 TG/STZ. Data are the mean ± S.D. Statistical analysis by ANOVA with Newman–Keuls’ test or Kruskal–Wallis ANOVA with Dunn’s test. ¶ p < 0.05 vs. TGFβ1 TG/STZ; ‡ p < 0.05 vs. WT/STZ; † p < 0.05 vs. WT/STZ; * p < 0.05; ** p < 0.01; **** p < 0.0001.
Ijms 23 14265 g002
Figure 3. Reduced plasma insulin levels after glucose injection and insulin resistance in diabetic TGFβ1 TG mice. (A) The glucose-stimulated insulin secretion test was performed after 16 h of fasting by the intraperitoneal injection of glucose. Insulin was measured using blood samples taken after 0, 2, 10, and 30 min of glucose injection. (B) Homeostasis model assessment for insulin resistance (HOMA-IR) was determined before glucose administration, as described in the Materials and Methods. Number of mice: n = 3 in WT/SAL, n = 5 in TGFβ1 TG/SAL, n = 4 in WT/STZ, n = 5 in TGFβ1 TG/STZ. Data are the mean ± S.D. Statistical analysis by Kruskal–Wallis ANOVA with Dunn’s test. † p < 0.05 vs. WT/SAL; ** p < 0.01; ns, not significant.
Ijms 23 14265 g003
Figure 4. Diabetic transforming growth factorβ1 mice have a decreased area of pancreatic islets. (A) Mice were sacrificed in week 9 after streptozotocin or saline intraperitoneal injection. The pancreas was incised, removed, and prepared for hematoxylin and eosin staining. (B) Area of pancreatic islets measured in each group using the WinROOF image processing software. Number of mice: WT/SAL n = 3, TGFβ1 TG/SAL n = 5, WT/STZ n = 4, TGFβ1 TG/STZ n = 5. Scale bars indicate 200 µm. Data are the mean ± S.D. Statistical analysis by ANOVA with Newman–Keuls’ test. * p < 0.05; ns, not significant.
Ijms 23 14265 g004
Figure 5. Transforming growth factorβ1 worsens insulin sensitivity in target cells. HepG2 (A) and L6 myoblasts (B) were cultured in the presence of insulin alone (200 nM) or in the presence of both insulin and transforming growth factorβ1 alone (20 ng/mL) for 4 h before measuring the medium glucose levels. Data are expressed as mean ± S.D. n = 4 per group. Statistical analysis by ANOVA with Newman–Keuls’ test. * p < 0.05; **** p < 0.0001.
Ijms 23 14265 g005
Figure 6. Progressive renal dysfunction in diabetic transforming growth factorβ1 transgenic mice. (A) Blood urea nitrogen (BUN) was measured by colorimetric methods, and creatinine was measured by an enzymatic method. (B) Weekly changes in plasma BUN. (C) Plasma creatinine was measured by an enzymatic method. (D) Weekly changes in plasma creatinine. The number of mice for the plasma evaluation: WT/SAL n = 6, TGFβ1 TG/SAL n = 6, WT/STZ n = 8, TGFβ1 TG/STZ n = 9. Data are expressed as the mean ± S.D. Statistical analysis by ANOVA with Newman–Keuls’ test or Kruskal–Wallis ANOVA with Dunn’s test. * p < 0.05; ** p < 0.01; *** p < 0.001; **** p < 0.0001. WT, wild-type mice, TGFβ1 TG, transforming growth factor-β1 transgenic mice.
Ijms 23 14265 g006
Figure 7. Progressive glomerulosclerosis in transforming growth factorβ1 transgenic mice with diabetes mellitus. Renal tissues were cut and stained with periodic acid–Schiff (A,B) or Masson’s trichrome (C,D) and then quantified using a scoring system or the WinROOF imaging software. Scale bars indicate 50 µm. Number of mice: WT/SAL n = 6, TGFβ1 TG/SAL n = 6, WT/STZ n = 8, TGFβ1 TG/STZ n = 9. Statistical analysis by ANOVA with Newman–Keuls’ test. ** p < 0.01; **** p < 0.0001. WT, wild-type mice, TGFβ1 TG, transforming growth factorβ1 transgenic mice.
Ijms 23 14265 g007
Figure 8. Increased expression of αsmooth muscle actin and phosphorylation of SMAD3 in diabetic transforming growth factorβ1 mice. The protein expression of αsmooth muscle actin (αSMA) and the activation of SMAD3 were assessed by western blotting. n = 4 in each group. Data are the mean ± S.D. Statistical analysis by ANOVA with Newman–Keuls’ test. * p < 0.05; ** p < 0.01.
Ijms 23 14265 g008
Figure 9. The vicious cycle of hyperglycemia, in which increased circulating active TGFβ1 and insulin resistance may explain the accelerated progression of renal dysfunction in diabetic TGFβ1 TG mice. Red arrows indicate the vicious cycle.
Ijms 23 14265 g009
Publisher’s Note: MDPI stays neutral with regard to jurisdictional claims in published maps and institutional affiliations.

