
Complementary Experimental Methods to Obtain Thermodynamic Parameters of Protein Ligand Systems


Abstract
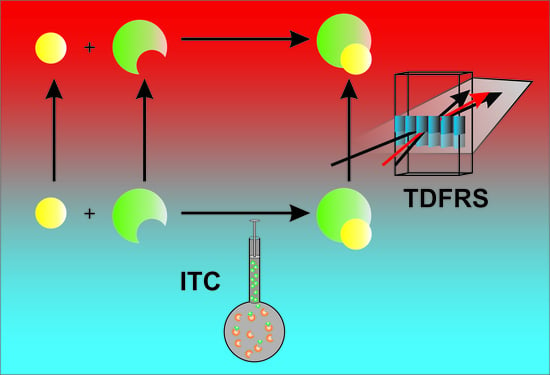
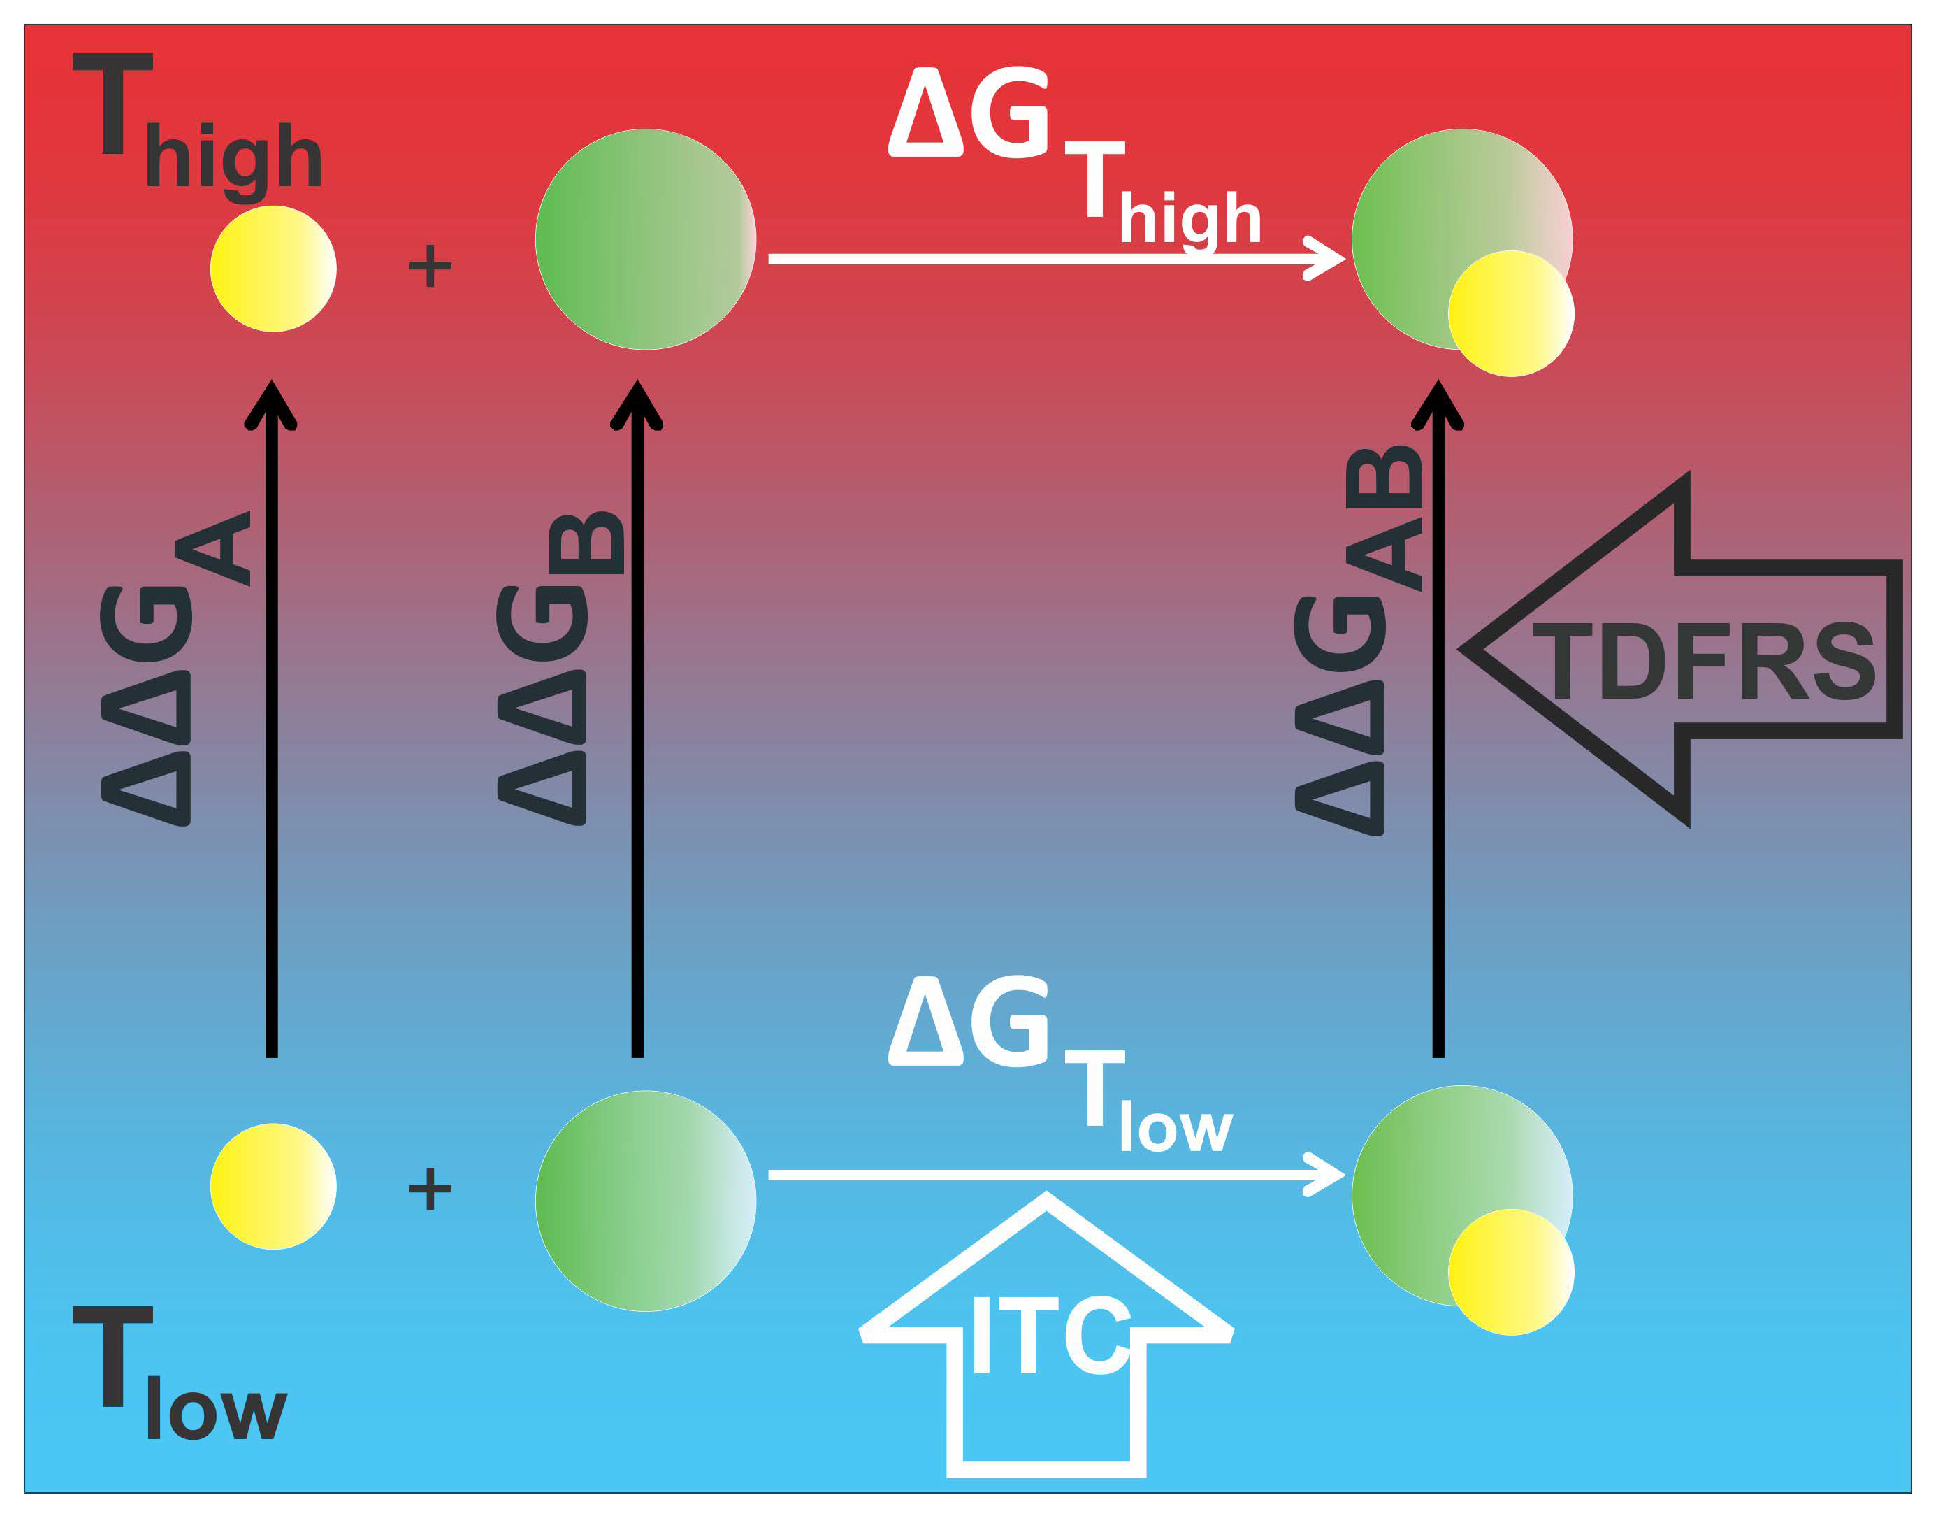
1. Introduction
2. Results and Discussion
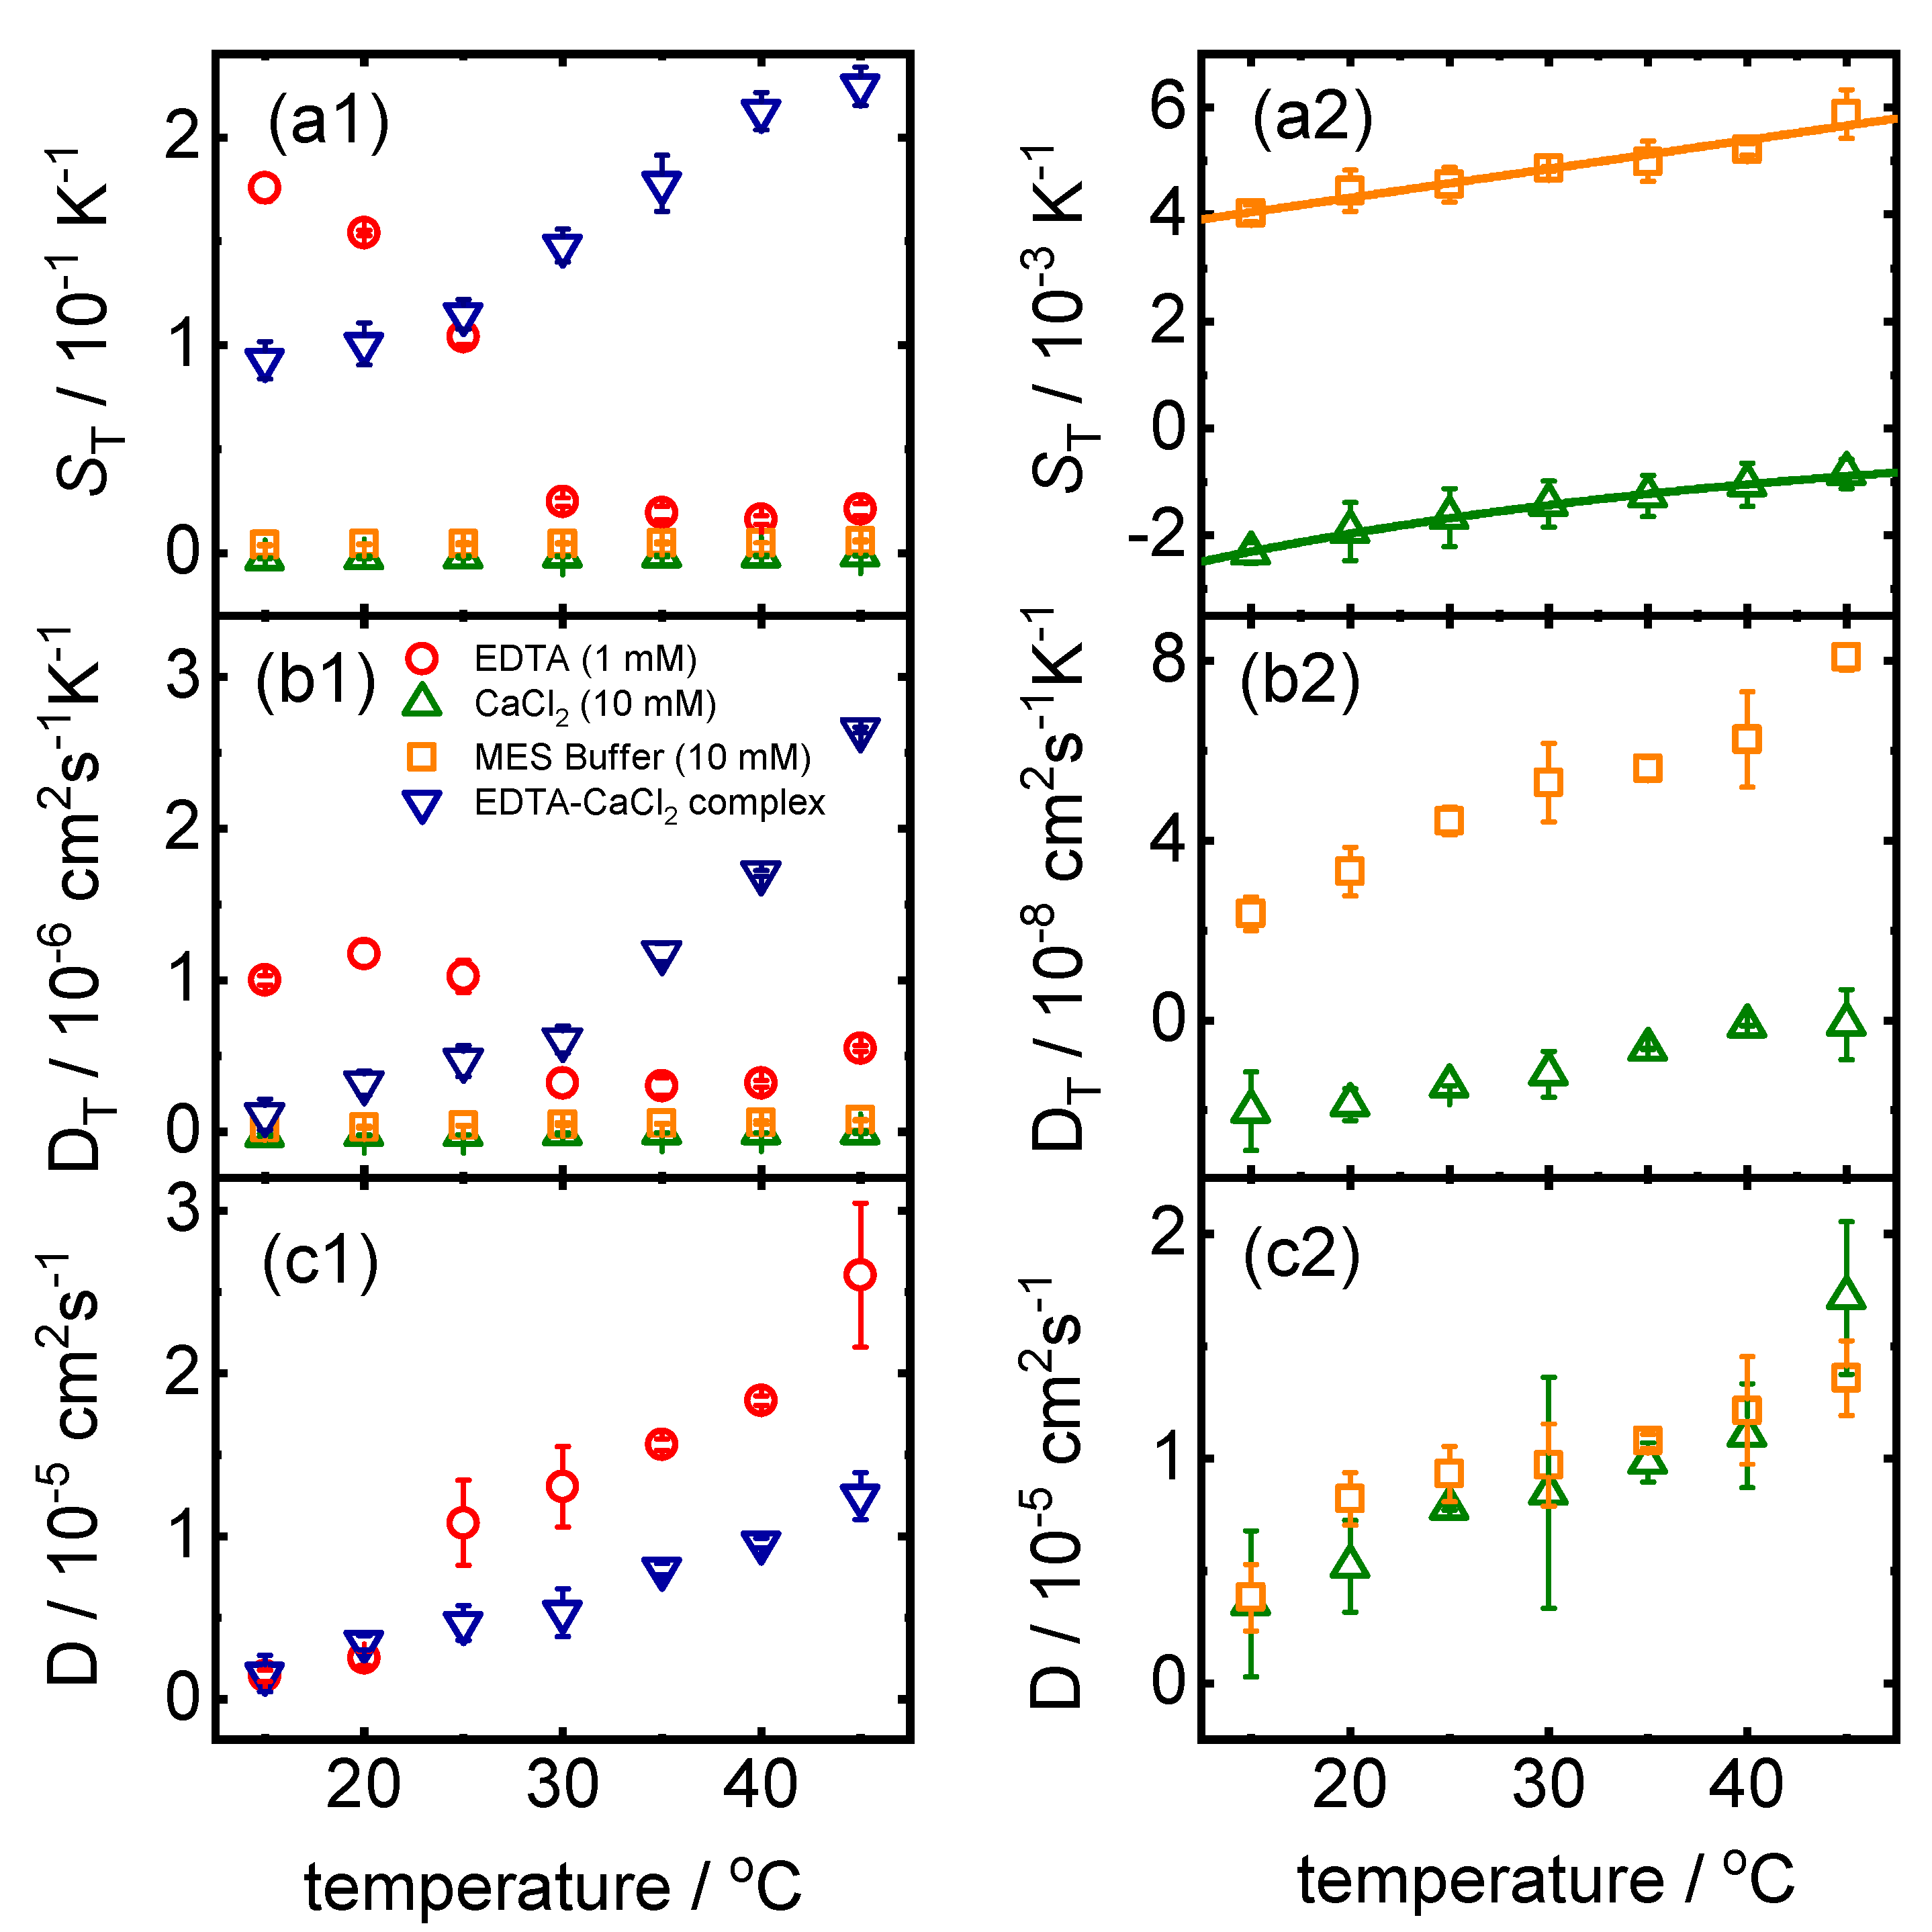
2.1. EDTA–CaCl System
2.1.1. TDFRS Measurements
2.1.2. ITC Measurements
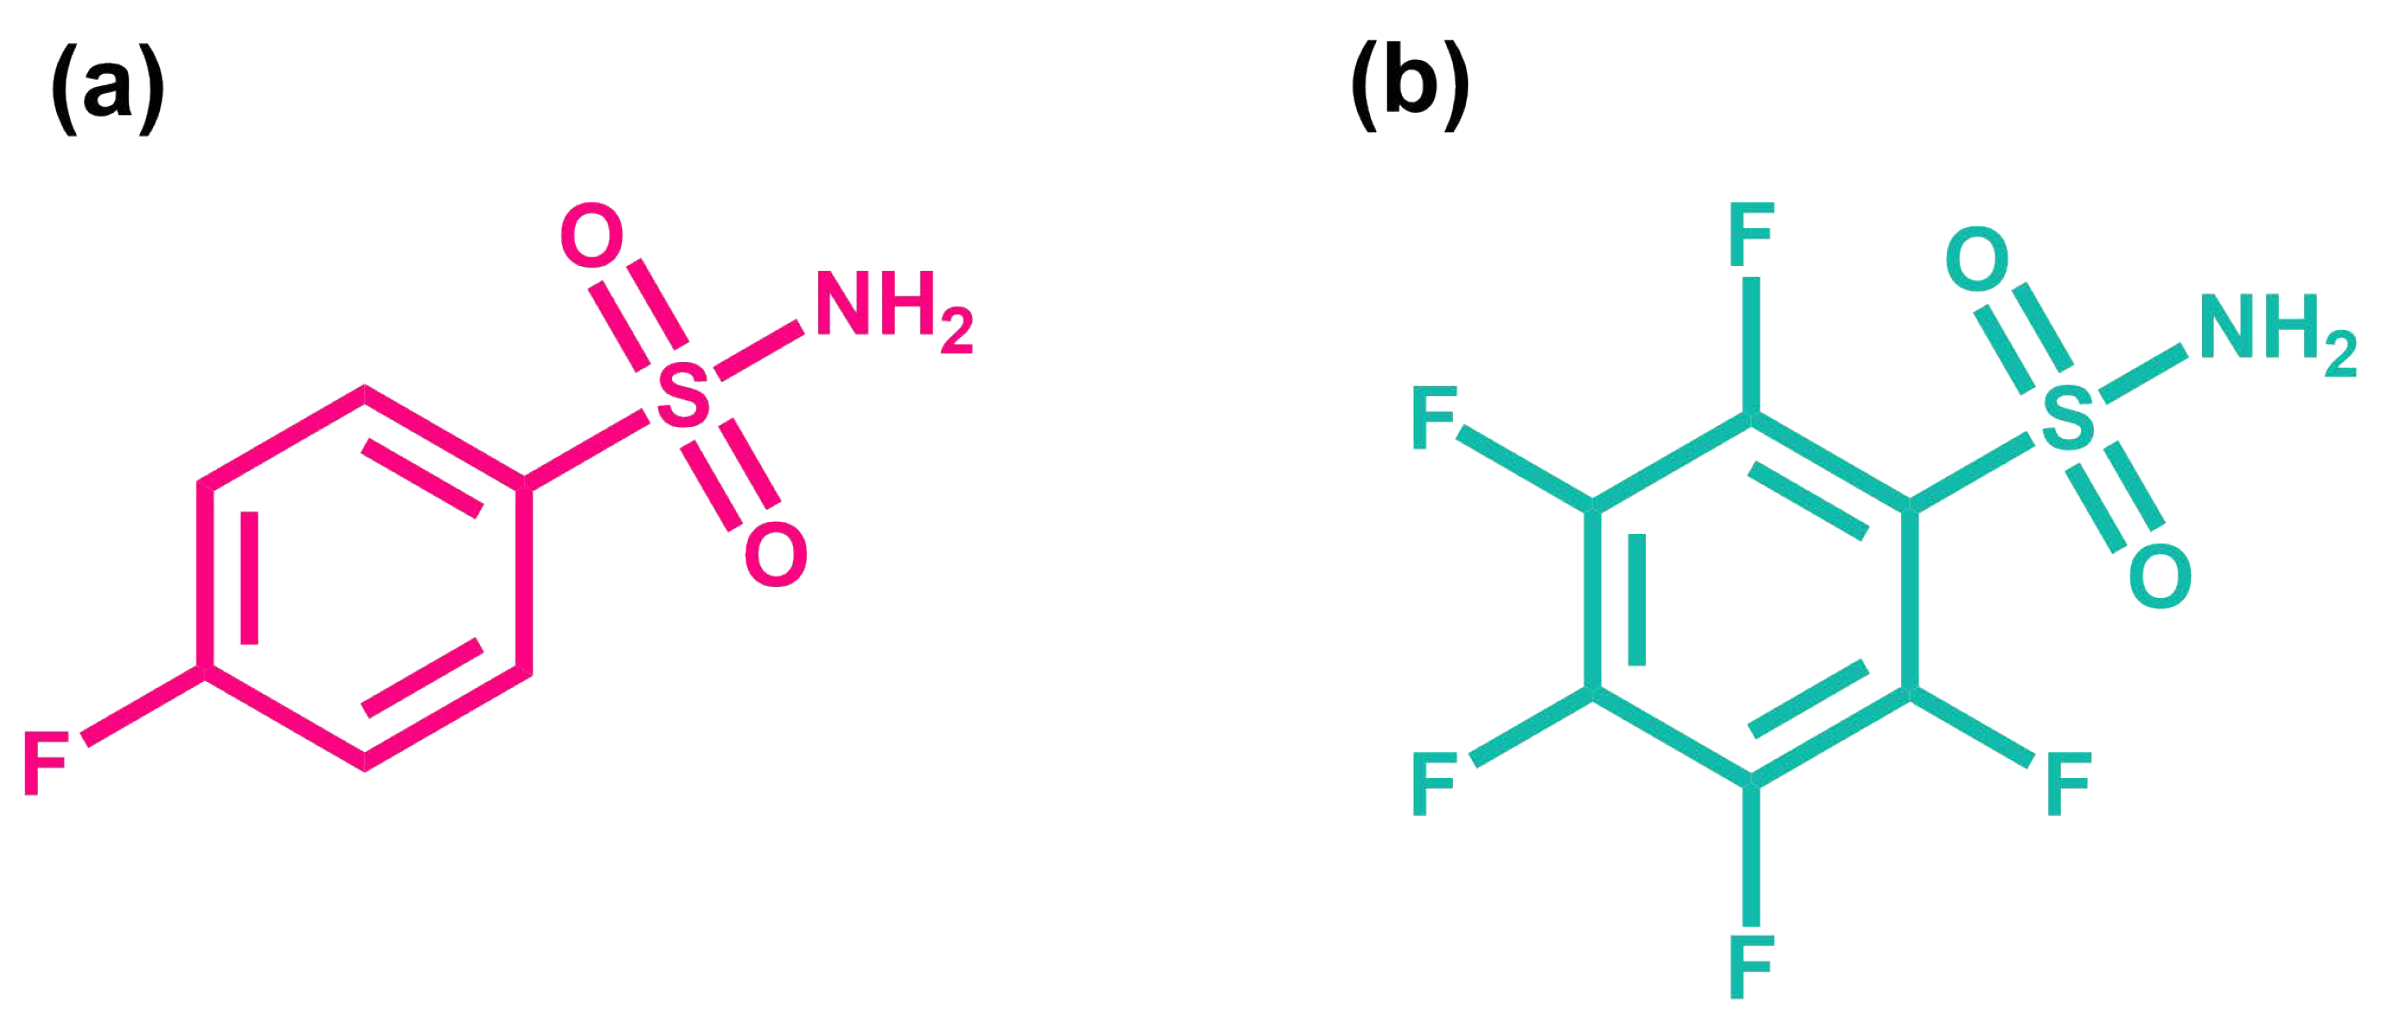
2.2. Protein–Ligand System
2.2.1. TDFRS Measurements
2.2.2. Isothermal Titration Calorimetry Measurements
2.2.3. Measurements with a Thermophoretic Microfluidic Cell
2.3. Validation of the Relation between Soret Coefficient and Gibb’s Free Energy
2.3.1. EDTA–CaCl System
2.3.2. Protein–Ligand System
3. Materials and Methods
3.1. Sample Preparation
3.1.1. EDTA–CaCl System
3.1.2. BCA-Ligand System
3.2. Methods
3.2.1. Thermal Diffusion Forced Rayleigh Scattering
3.2.2. Contrast Factor Measurement
3.2.3. Isothermal Titration Calorimetry
3.2.4. Thermophoretic Microfluidic Cells
4. Conclusions
Supplementary Materials
Author Contributions
Funding
Data Availability Statement
Acknowledgments
Conflicts of Interest
Abbreviations
| 4FBS | 4-fluorobenzenesulfonamide |
| BCA | Bovine Carbonic Anhydrase |
| EDTA | ethylenediaminetetraacetic acide |
| ITC | isothermal titration calorimetry |
| MES | 2-(N-morpholino)ethanesulfonic acid |
| PFBS | Pentafluorobenzenesulfonamide |
| TDFRS | Thermal diffusion forced Rayleigh scattering |
References
- Verweij, E.W.E.; Bosma, R.; Gao, M.; van den Bor, J.; Al Araaj, B.; de Munnik, S.M.; Ma, X.; Leurs, R.; Vischer, H.F. BRET-Based Biosensors to Measure Agonist Efficacies in Histamine H1 Receptor-Mediated G Protein Activation, Signaling and Interactions with GRKs and β-Arrestins. Int. J. Mol. Sci. 2022, 23, 3184. [Google Scholar] [CrossRef]
- Marcuello, C.; de Miguel, R.; Martínez-Júlvez, M.; Gómez-Moreno, C.; Lostao, A. Mechanostability of the Single-Electron-Transfer Complexes of Anabaena Ferredoxin-NADP(+) Reductase. ChemPhysChem. 2015, 16, 3161–3169. [Google Scholar] [CrossRef] [PubMed]
- Jakobowska, I.; Becker, F.; Minguzzi, S.; Hansen, K.; Henke, B.; Epalle, N.H.; Beitz, E.; Hannus, S. Fluorescence Cross-Correlation Spectroscopy Yields True Affinity and Binding Kinetics of Plasmodium Lactate Transport Inhibitors. Pharmaceuticals 2021, 14, 757. [Google Scholar] [CrossRef]
- Plach, M.; Schubert, T. Biophysical Characterization of Aptamer-Target Interactions. Adv. Biochem. Engin. Biotechnol. 2020, 174, 1–15. [Google Scholar]
- Jerabek-Willemsen, M.; Andre, T.; Wanner, R.; Roth, H.M.; Duhr, S.; Baaske, P.; Breitsprecher, D. MicroScale Thermophoresis: Interaction analysis and beyond. J. Mol. Struct. 2014, 1077, 101–113. [Google Scholar] [CrossRef]
- Duhr, S.; Braun, D. Why molecules move along a temperature gradient. Proc. Natl. Acad. Sci. USA 2006, 103, 19678–19682. [Google Scholar] [CrossRef]
- Reichl, M.; Herzog, M.; Götz, A.; Braun, D. Why Charged Molecules Move Across a Temperature Gradient: The Role of Electric Fields. Phys. Rev. Lett. 2014, 112, 198101. [Google Scholar] [CrossRef]
- Baaske, P.; Wienken, C.J.; Reineck, P.; Duhr, S.; Braun, D. Optical Thermophoresis for Quantifying the Buffer Dependence of Aptamer Binding. Angew. Chem. Int. Edit. 2010, 49, 2238–2241. [Google Scholar] [CrossRef] [PubMed]
- Seidel, S.A.I.; Wienken, C.J.; Geissler, S.; Jerabek-Willemsen, M.; Duhr, S.; Reiter, A.; Trauner, D.; Braun, D.; Baaske, P. Label-Free Microscale Thermophoresis Discriminates Sites and Affinity of Protein-Ligand Binding. Angew. Chem. Int. Ed. 2012, 51, 10656–10659. [Google Scholar] [CrossRef]
- Stein, J.A.C.; Ianeselli, A.; Braun, D. Kinetic Microscale Thermophoresis for Simultaneous Measurement of Binding Affinity and Kinetics. Angew. Chem. Int. Ed. Engl. 2021, 60, 13988–13995. [Google Scholar] [CrossRef]
- Köhler, W.; Morozov, K.I. The Soret Effect in Liquid Mixtures—A Review. J. Non-Equil. Thermody. 2016, 41, 151–197. [Google Scholar] [CrossRef]
- Niether, D.; Wiegand, S. Thermophoresis of biological and biocompatible compounds in aqueous solution. J. Phys. Condens. Matter 2019, 31, 503003. [Google Scholar] [CrossRef]
- Niether, D.; Afanasenkau, D.; Dhont, J.K.G.; Wiegand, S. Accumulation of formamide in hydrothermal pores to form prebiotic nucleobases. Proc. Natl. Acad. Sci. USA 2016, 113, 4272–4277. [Google Scholar] [CrossRef]
- Niether, D.; Kriegs, H.; Dhont, J.K.G.; Wiegand, S. Peptide model systems: Correlation between thermophilicity and hydrophilicity. J. Chem. Phys. 2018, 149, 044506. [Google Scholar] [CrossRef]
- Niether, D.; Di Lecce, S.; Bresme, F.; Wiegand, S. Unravelling the hydrophobicity of urea in water using thermodiffusion: Implications for protein denaturation. Phys. Chem. Chem. Phys. 2018, 20, 1012–1020. [Google Scholar] [CrossRef]
- Kishikawa, Y.; Wiegand, S.; Kita, R. Temperature Dependence of Soret Coefficient in Aqueous and Nonaqueous Solutions of Pullulan. Biomacromolecules 2010, 11, 740–747. [Google Scholar] [CrossRef]
- Iacopini, S.; Rusconi, R.; Piazza, R. The “macromolecular tourist”: Universal temperature dependence of thermal diffusion in aqueous colloidal suspensions. Eur. Phys. J. E 2006, 19, 59–67. [Google Scholar] [CrossRef]
- Niether, D.; Sarter, M.; König, B.; Zamponi, M.; Fitter, J.; Stadler, A.; Wiegand, S. Thermodiffusion as a probe of protein hydration for streptavidin and the streptavidin-biotin complex. AIP Conf. Proc. 2018, 1929, 020001. [Google Scholar]
- Niether, D.; Kawaguchi, T.; Hovancova, J.; Eguchi, K.; Dhont, J.K.G.; Kita, R.; Wiegand, S. Role of Hydrogen Bonding of Cyclodextrin-Drug Complexes Probed by Thermodiffusion. Langmuir 2017, 33, 8483–8492. [Google Scholar] [CrossRef]
- Schimpf, M.E.; Giddings, J.C. Characterization of Thermal-Diffusion in Polymer-Solutions by Thermal Field-Flow Fractionation—Dependence on Polymer and Solvent Parameters. J. Polym. Sci. Pol. Phys. 1989, 27, 1317–1332. [Google Scholar] [CrossRef]
- Piazza, R.; Iacopini, S.; Triulzia, B. Thermophoresis as a probe of particle-solvent interactions: The case of protein solutions. Phys. Chem. Chem. Phys. 2004, 6, 1616–1622. [Google Scholar] [CrossRef]
- Naumann, P.; Becker, N.; Datta, S.; Sottmann, T.; Wiegand, S. Soret Coefficient in Nonionic Microemulsions: Concentration and Structure Dependence. J. Phys. Chem. B 2013, 117, 5614–5622. [Google Scholar] [CrossRef] [PubMed]
- Niether, D.; Sarter, M.; Koenig, B.W.; Fitter, J.; Stadler, A.M.; Wiegand, S. Thermophoresis: The Case of Streptavidin and Biotin. Polymers 2020, 12, 376. [Google Scholar] [CrossRef]
- Sarter, M.; Niether, D.; Koenig, B.W.; Lohstroh, W.; Zamponi, M.; Jalarvo, N.H.; Wiegand, S.; Fitter, J.; Stadler, A.M. Strong Adverse Contribution of Conformational Dynamics to Streptavidin-Biotin Binding. J. Phys. Chem. B 2020, 124, 324–335. [Google Scholar] [CrossRef]
- Sarter, M.; Niether, D.; Wiegand, S.; Fitter, J.; Stadler, A.M. Complementary approaches to obtaining thermodynamic parameters from protein ligand systems-challenges and opportunities. In Proceedings of the EPJ Web of Conferences, Santiago de Compostela, Spain, 24–28 October 2022. [Google Scholar]
- Baranauskiene, L.; Petrikaite, V.; Matuliene, J.; Matulis, D. Titration calorimetry standards and the precision of isothermal titration calorimetry data. Int. J. Mol. Sci. 2009, 10, 2752–2762. [Google Scholar] [CrossRef]
- Lee, N.; Mohanakumar, S.; Wiegand, S. Thermophoretic microfluidic cells for evaluating Soret coefficient of colloidal particles. Int. J. Heat Mass Transf. 2022, 194, 123002. [Google Scholar] [CrossRef]
- Würger, A. Thermal non-equilibrium transport in colloids. Rep. Prog. Phys. 2010, 73, 126601. [Google Scholar] [CrossRef]
- Eastman, E.D. Theory of the Soret effect. J. Am. Chem. Soc. 1928, 50, 283–291. [Google Scholar] [CrossRef]
- Würger, A. Is Soret equilibrium a non-equilibrium effect? C. R.-Mec. 2013, 341, 438–448. [Google Scholar] [CrossRef]
- de Groot, S.R. Thermodynamics of Irreversible Processes; North Holland: Amsterdam, The Netherland, 1966. [Google Scholar]
- Ràfols, C.; Bosch, E.; Barbas, R.; Prohens, R. The Ca2+-EDTA chelation as standard reaction to validate Isothermal Titration Calorimeter measurements (ITC). Talanta 2016, 154, 354–359. [Google Scholar] [CrossRef]
- Reiter, J. CFD Analysis of EDTA–CaCl2 Reaction in a Microfluidic Channel to Aid in Design of Novel Calorimeter Device. Ph.D. Thesis, Northeastern University Boston, Boston, MA, USA, 2015. [Google Scholar]
- Kula, R.J.; Reed, G.H. Nuclear Magnetic Resonance Investigation of Ligand Exchange Kinetics in the Calcium(II)-EDTA System. Anal. Chem. 1966, 38, 697–701. [Google Scholar] [CrossRef]
- Carr, J.D.; Swartzfager, D.G. Kinetics of the ligand exchange and dissociation reactions of calcium-aminocarboxylate complexes. J. Am. Chem. Soc. 1973, 97, 315–321. [Google Scholar] [CrossRef]
- Maren, T.H. Carbonic anhydrase: General perspective and advances in glaucoma research. Drug Dev. Res. 1987, 10, 255–276. [Google Scholar] [CrossRef]
- Cecchi, A.; Taylor, S.D.; Liu, Y.; Hill, B.; Vullo, D.; Scozzafava, A.; Supuran, C.T. Carbonic anhydrase inhibitors: Inhibition of the human isozymes I, II, VA, and IX with a library of substituted difluoromethanesulfonamides. Bioorg. Med. Chem. Lett. 2005, 15, 5192–5196. [Google Scholar] [CrossRef]
- Innocenti, A.; Vullo, D.; Scozzafava, A.; Supuran, C.T. Carbonic anhydrase inhibitors: Interactions of phenols with the 12 catalytically active mammalian isoforms (CA I-XIV). Bioorg. Med. Chem. Lett. 2008, 18, 1583–1587. [Google Scholar] [CrossRef]
- Supuran, C.T.; Scozzafava, A. and Casini, A. Carbonic anhydrase inhibitors. Med. Res. Rev. 2003, 23, 146–189. [Google Scholar] [CrossRef]
- Krishnamurthy, V.M.; Bohall, B.R.; Kim, C.; Moustakas, D.T.; Christianson, D.W.; Whitesides, G.M. Thermodynamic parameters for the association of fluorinated benzenesulfonamides with bovine carbonic anhydrase II. Chem. Asian J. 2007, 2, 94–105. [Google Scholar] [CrossRef]
- Krishnamurthy, V.M.; Kaufman, G.K.; Urbach, A.R.; Gitlin, I.; Gudiksen, K.L.; Wiebel, D.B.; Whitesides, G.M. Carbonic Anhydrase as a Model for Biophysical and Physical-Organic Studies of Proteins and Protein-Ligand Binding. Chem. Rev. 2008, 108, 946–1051. [Google Scholar] [CrossRef]
- Sugiyama, T.; Dabwan, A.H.A.; Katsumata, H.; Suzuki, T.; Kaneco, S. Optimization of Conditions for the Photocatalytic Degradation of EDTA in Aqueous Solution with Fe-Doped Titanium Dioxide. Open J. Inorg. Non met. Mater. 2014, 4, 28–34. [Google Scholar] [CrossRef][Green Version]
- Minkevich, I.G.; Satroutdinov, A.D.; Dedyukhina, E.G.; Chistyakova, T.I.; Kaparullina, E.N.; Koshelev, A.V.; Okunev, O.N. The effect of temperature on bacterial degradation of EDTA in pH-auxostat. World J. Microbiol. Biotechnol. 2006, 22, 1205–1213. [Google Scholar] [CrossRef]
- Yılmaz, Z.; Aktemur, S.; Buzoglu, H.D.; Gümüsderelioglu, M. The Effect of Temperature and pH Variations on the Surface Tension of EDTA Solutions. J. Endod. 2011, 37, 825–827. [Google Scholar] [CrossRef]
- Pidard, D.; Didry, D.; Kunicki, T.; Nurden, A. Temperature-dependent effects of EDTA on the membrane glycoprotein IIb- IIIa complex and platelet aggregability. Blood 1986, 67, 604–611. [Google Scholar] [CrossRef]
- Kita, R.; Wiegand, S. Soret coefficient of poly(N-isopropylacrylamide)/water in the vicinity of coil-globule transition temperature. Macromolecules 2005, 38, 4554–4556. [Google Scholar] [CrossRef]
- Qiu, X.; Koga, T.; Tanaka, F.; Winnik, F.M. New insights into the effects of molecular weight and end group on the temperature-induced phase transition of poly(N-isopropylacrylamide) in water. Sci. China Chem. 2013, 56, 56–64. [Google Scholar] [CrossRef]
- Bischofberger, I.; Calzolari, D.C.E.; de Los Rios, P.; Jelezarov, I.; Trappe, V. Hydrophobic hydration of poly-N-isopropyl acrylamide: A matter of the mean energetic state of water: A matter of the mean energetic state of water. Sci. Rep. 2014, 4, 4377. [Google Scholar] [CrossRef]
- Griko, Y.V. Energetics of Ca2+-EDTA interactions:calorimetric study. Biophys. Chem. 1999, 79, 117–127. [Google Scholar] [CrossRef]
- Christensen, T.; Gooden, D.M.; Kung, J.E.; Toone, E.J. Additivity and the physical basis of multivalency effects: A thermodynamic investigation of the calcium EDTA interaction. J. Am. Chem. Soc. 2003, 125, 7357–7366. [Google Scholar] [CrossRef]
- Arena, G.; Musumeci, S.; Purrello, R.; Sammartano, S. Calcium- and Magnesium-EDTA complexes. Stability constants and their dependence on temperature and ionic strength. Thermochimica Acta 1983, 61, 129–138. [Google Scholar] [CrossRef]
- Dugad, L.B.; Gerig, J.T. NMR studies of carbonic anhydrase-4-fluorobenzenesulfonamide complexes. Biochemistry 1988, 27, 4310–4316. [Google Scholar] [CrossRef]
- Olander, J.; Bosen, S.F.; Kaiser, E.T. A study of the binding of two sulfonamides to carbonic anhydrase. J. Am. Chem. Soc. 1973, 95, 1616–1621. [Google Scholar] [CrossRef]
- Kernohan, J.C. A method for studying the kinetics of the inhibition of carbonic anhydrase by sulphonamides. Biochim. Biophy. Acta 1966, 118, 405–412. [Google Scholar] [CrossRef]
- Olander, J.; Kaiser, E.T. Binding of 4-hydroxy-3-nitrobenzenesulfonamide, a reporter group labeled inhibitor, to carbonic anhydrases. J. Am. Chem. Soc. 1970, 92, 5758. [Google Scholar] [CrossRef] [PubMed]
- Vedani, A.; Huhta, D.W.; Jacober, S.P. Metal Coordination, -Bond Network Formation, and Protein-Solvent Interactions in Native and Complexed Human Carbonic Anhydrase I: A Molecular Mechanics Study. J. Am. Chem. Soc 1989, 111, 4075–4081. [Google Scholar] [CrossRef]
- Saito, R.; Sato, T.; Ikai, A.; Tanaka, N. Structure of bovine carbonic anhydrase II at 1.95 A resolution. Acta Crystallogr. Sect. D Biol. Crystallogr. 2004, 60, 792–795. [Google Scholar] [CrossRef] [PubMed]
- Abbate, F.; Supuran, C.T.; Scozzafava, A.; Orioli, P.; Stubbs, M.T.; Klebe, G. Nonaromatic sulfonamide group as an ideal anchor for potent human carbonic anhydrase inhibitors: Role of hydrogen-bonding networks in ligand binding and drug design. J. Med. Chem 2002, 45, 3583–3587. [Google Scholar] [CrossRef]
- Lindskog, S.; Thorslund, A. On the Interaction of Bovine Cobalt Carbonic Anhydrase with Sulfonamides. Eur.J. Biochem. 1968, 3, 453–460. [Google Scholar] [CrossRef] [PubMed]
- Hansch, C.O.; McClarin, J.U.; Klein, T.E.; Langridge, R.O. A quantitative structure-activity relationship and molecular graphics study of carbonic anhydrase inhibitors. Mol. Pharmacol. 1985, 27, 493–498. [Google Scholar]
- Henry, R.J. The mode of action of sulfonamides. Bacteriol. Rev. 1943, 7, 175–262. [Google Scholar] [CrossRef]
- Henry, R.P. Techniques for Measuring Carbonic Anhydrase Activity in Vitro. In The Carbonic Anhydrases; Dodgson, S.J., Tashian, R.E., Gros, G., Carter, N.D., Eds.; Springer US and Imprint and Springer: Boston, MA, USA, 1991; pp. 119–125. [Google Scholar]
- Baronas, D.; Dudutienė, V.; Paketurytė, V.; Kairys, V.; Smirnov, A.; Juozapaitienė, V.; Vaškevičius, A.; Manakova, E.; Gražulis, S.; Zubrienė, A.; et al. Structure and mechanism of secondary sulfonamide binding to carbonic anhydrases. Eur. Biophys. J. 2021, 50, 993–1011. [Google Scholar] [CrossRef]
- Darby, S.J.; Platts, L.; Daniel, M.S.; Cowieson, A.J.; Falconer, R.J. An isothermal titration calorimetry study of phytate binding to lysozyme. J. Therm. Anal. Calorim. 2017, 127, 1201–1208. [Google Scholar] [CrossRef][Green Version]
- Osborne, W.R.A.; Tashian, R.E. Dissociation Constants for Carbonic Anhydrase-Sulfonamide Binding by High-Performance Liquid Chromatography. Anal. Biochem. 1984, 137, 302–306. [Google Scholar] [CrossRef]
- Wiegand, S.; Köhler, W. Measurement of Transport Coefficients by an Optical Grating Technique. In Thermal Nonequilibrium Phenomena in Fluid Mixtures; Springer: Berlin/Heidelberg, Germany, 2002; Volume 584, pp. 189–210. [Google Scholar]
- Blanco, P.; Kriegs, H.; Lettinga, M.P.; Holmqvist, P.; Wiegand, S. Thermal Diffusion of a Stiff Rod-Like Mutant Y21M fd-Virus. Biomacromolecules 2011, 12, 1602–1609. [Google Scholar] [CrossRef] [PubMed]
- Wiegand, S.; Ning, H.; Kriegs, H. Thermal diffusion forced Rayleigh scattering setup optimized for aqueous mixtures. J. Phys. Chem. B 2007, 111, 14169–14174. [Google Scholar] [CrossRef] [PubMed]
- Becker, A.; Köhler, W.; Müller, B. A Scanning Michelson Interferometer For the Measurement of the Concentration and Temperature Derivative of the Refractive- Index of Liquids. Ber. Bunsen-Ges. Phys. Chem. Chem. Phys. 1995, 99, 600–608. [Google Scholar] [CrossRef]
- Velazquez-Campoy, A.; Leavitt, S.A.; Freire, E. Characterization of protein-protein interactions by isothermal titration calorimetry. In Protein-Protein Interactions; Humana Press: New York, NY, USA, 2004; Volume 261, pp. 35–54. [Google Scholar]
- Thomson, J.A.; Ladbury, J.E. Isothermal Titration Calorimetry: A Tutorial. In Biocalorimetry 2; Ladbury, J.E., Doyle, M.L., Eds.; Wiley: Chichester, UK; Hoboken, NJ, USA, 2004; pp. 35–58. [Google Scholar]
- Zhang, Q.; Han, J.; Zhu, Y.; Tan, S.; Liu, H. Binding Thermodynamics and Dissociation Kinetics Analysis Uncover the Key Structural Motifs of Phenoxyphenol Derivatives as the Direct InhA Inhibitors and the Hotspot Residues of InhA. Int. J. Mol. Sci. 2022, 23, 10102. [Google Scholar] [CrossRef]
- Tapia-Rojo, R.; Marcuello, C.; Lostao, A.; Gómez-Moreno, C.; J Mazo, J.; Falo, F. A physical picture for mechanical dissociation of biological complexes: From forces to free energies. Phys. Chem. Chem. Phys. 2017, 19, 4567–4575. [Google Scholar] [CrossRef]
- Stadler, A.M.; Koza, M.M.; Fitter, J. Determination of Conformational Entropy of Fully and Partially Folded Conformations of Holo- and Apomyoglobin. J. Phys. Chem. B 2015, 137, 72–82. [Google Scholar] [CrossRef]
- Stadler, A.M.; Demmel, F.; Ollivier, J.; Seydel, T. Picosecond to nanosecond dynamics provide a source of conformational entropy for protein folding. Phy. Chem. Chem. Phys. 2015, 18, 21527–21538. [Google Scholar] [CrossRef]


| Temperature (°C) | K (nM) | H (kJ/mol) |
|---|---|---|
| 20 | 510.0 ± 49.0 | −17.0 ± 0.3 |
| 25 | 623.0 ± 70.3 | −17.2 ± 0.8 |
| 30 | 699.0 ± 55.5 | −17.3 ± 0.7 |
| 35 | 852.0 ± 78.9 | −17.6 ± 0.5 |
| 40 | 1210.0 ± 123.0 | −17.8 ± 0.5 |
| 45 | 1570.0 ± 134.0 | −18.0 ± 0.8 |
| System | K (nM) | H (kJ/mol) | G (kJ/mol) |
|---|---|---|---|
| BCA I–PFBS | 127.0 ± 47.2 | − 12.5 ± 0.8 | −37.4 ± 2.8 |
| BCA I–4FBS | 325.0 ± 58.7 | −32.7 ± 0.4 | −37.5 ± 1.3 |
| System | T (°C) | T (°C) | G (kJ/mol) | G (kJ/mol) |
|---|---|---|---|---|
| BCA I–PFBS | 30 | 20 | −40.5 ± 1.1 | −40.4 ± 1.3 |
| BCA I–4FBS | 30 | 20 | −39.9 ± 3.9 | −38.2 ± 1.5 |
Publisher’s Note: MDPI stays neutral with regard to jurisdictional claims in published maps and institutional affiliations. |
© 2022 by the authors. Licensee MDPI, Basel, Switzerland. This article is an open access article distributed under the terms and conditions of the Creative Commons Attribution (CC BY) license (https://creativecommons.org/licenses/by/4.0/).
Share and Cite
Mohanakumar, S.; Lee, N.; Wiegand, S. Complementary Experimental Methods to Obtain Thermodynamic Parameters of Protein Ligand Systems. Int. J. Mol. Sci. 2022, 23, 14198. https://doi.org/10.3390/ijms232214198
Mohanakumar S, Lee N, Wiegand S. Complementary Experimental Methods to Obtain Thermodynamic Parameters of Protein Ligand Systems. International Journal of Molecular Sciences. 2022; 23(22):14198. https://doi.org/10.3390/ijms232214198
Chicago/Turabian StyleMohanakumar, Shilpa, Namkyu Lee, and Simone Wiegand. 2022. "Complementary Experimental Methods to Obtain Thermodynamic Parameters of Protein Ligand Systems" International Journal of Molecular Sciences 23, no. 22: 14198. https://doi.org/10.3390/ijms232214198
APA StyleMohanakumar, S., Lee, N., & Wiegand, S. (2022). Complementary Experimental Methods to Obtain Thermodynamic Parameters of Protein Ligand Systems. International Journal of Molecular Sciences, 23(22), 14198. https://doi.org/10.3390/ijms232214198