Article

Identification and Analysis of Stress-Associated Proteins (SAPs) Protein Family and Drought Tolerance of ZmSAP8 in Transgenic Arabidopsis

National Engineering Laboratory of Crop Stress Resistance Breeding, School of Life Sciences, Anhui Agricultural University, Hefei 230036, China
*
Author to whom correspondence should be addressed.
Int. J. Mol. Sci. 2022, 23(22), 14109; https://doi.org/10.3390/ijms232214109
Submission received: 8 October 2022 / Revised: 11 November 2022 / Accepted: 14 November 2022 / Published: 15 November 2022
(This article belongs to the Section Molecular Plant Sciences)

Abstract

:
Stress-associated proteins (SAPs), a class of A20/AN1 zinc finger proteins, play vital roles in plant stress response. However, investigation of SAPs in maize has been very limited. Herein, to better trace the evolutionary history of SAPs in maize and plants, 415 SAPs were identified in 33 plant species and four species of other kingdoms. Moreover, gene duplication mode exploration showed whole genome duplication contributed largely to SAP gene expansion in angiosperms. Phylogeny reconstruction was performed with all identified SAPs by the maximum likelihood (ML) method and the SAPs were divided into five clades. SAPs within the same clades showed conserved domain composition. Focusing on maize, nine ZmSAPs were identified. Further promoter cis-elements and stress-induced expression pattern analysis of ZmSAPs indicated that ZmSAP8 was a promising candidate in response to drought stress, which was the only AN1-AN1-C2H2-C2H2 type SAP in maize and belonged to clade I. Additionally, ZmSAP8 was located in the nucleus and had no transactivation activity in yeast. Overexpressing ZmSAP8 enhanced the tolerance to drought stress in Arabidopsis thaliana, with higher seed germination and longer root length. Our results should benefit the further functional characterization of ZmSAPs.

1. Introduction

Recent years, with the deterioration of the global climate and the uneven distribution of water resources, drought has become one of the major factors affecting global food production. The most effective way to ensure food security and perform plant breeding for stress tolerance is to find the key genes regulating plant stress response and cultivate new germplasms resistant to stress, such as drought stress. With the progress of research, a family of proteins called stress response proteins (SAPs) has been discovered, which are widely involved in the immune response of animals and the response to diverse biotic and abiotic stress in plants [1,2,3]. SAPs are a kind of protein harbored AN1 (ZF-AN1) zinc finger domain [Cys-X2-Cys-X(9-12)-Cys-X(1-2)-Cys-X4-Cys-X2-His-X5-His-X-Cys] and/or A20(ZF-A20) zinc finger domain [Cys-X(2-4)-Cys-X11-Cys-X2-Cys]. The classical SAP proteins contain an A20 (ZF-A20) at the N-terminus and an AN1 (ZF-AN1) zinc finger domain at the C-terminus, whereas some SAPs have been found to only harbor AN1 or A20 domains. Meanwhile, some SAPs also contained one or more C2H2 domains [4,5].
Previous studies have shown that the SAP family exists widely in different kinds of organisms, as well as in plants. According to reports, 19 SAPs have been identified in Populus trichocarpa, 14 in Arabidopsis thaliana, 18 in Oryza sativa, and 17 in Medicago truncatula [5,6,7,8,9,10,11]. Most of these genes have been reported to be involved in plant response to stress. OsSAP1, the first SAP gene identified in O. sativa, was shown to improve the tolerance of rice to abiotic stresses, such as cold and osmotic stress [12]. OsSAP8 has also been reported to regulate rice drought response by interacting with rice lectin protein r40c1 (Osr40c1) [13,14]. Overexpression of OsSAP16 could enhance drought tolerance by reducing stomatal conductance and biomass [13] while OsSAP1/11 has been reported to improve salt resistance of rice by interacting with rice cytoplasmic kinase [15]. Similar reports have also been reported for the SAP family proteins in A. thaliana. AtSAP9 has been shown to act as an ubiquitinizing enzyme that positively regulates plant resistance to osmotic stress and is also involved in ABA signaling conduction through the proteasome pathway [16]. AtSAP10 could regulate the response of A.thaliana to heavy metal and high temperature stress. Overexpressing AtSAP10 in plants could improve the tolerance of plants to heavy metal and high temperature stress and significantly increase plant biomass [17]. AtSAP12 is involved in the regulation of plant response to salt and low temperature stress, and it has been proved to maintain the homeostasis of the REDOX state [18]. In addition, similar reports have been reported in other plants. In Prunus persica, PpSAP1 regulates the response to osmotic stress, and overexpression of PpSAP1 can improve the drought resistance of plants. In Tamarix hispida, ThSAP6 is strongly induced by salt stress and has positive regulatory ability in salt stress response. In T. hispida, ThSAP1 overexpressed plants showed increased salt tolerance compared with wild type plants. In M. truncatula, MtSAP1 was induced to be highly expressed when embryos were exposed to drought, thereby enhancing the drought tolerance of seeds [19,20,21]. The above reports indicate that SAP proteins play important roles in plant response to abiotic stress. Therefore, understanding the evolutionary patterns, the structural and functional characteristics of the SAP family will provide us with clues for further functional characterization and in understanding the mechanism of plant stress tolerance.
Maize is one of the main food crops in the world, directly affecting global food security. Under the background of global warming, maize production has been threatened by diverse abiotic stress, such as drought and osmotic stress. Considering the crucial roles of SAPs in stress resistance, investigation of SAPs in maize is of great significance, while very few reports about SAPs in maize are available. In the present study, SAPs were genome-widely identified in maize. Moreover, their chromosomal location, evolutionary history, conserved motifs, genetic structure, and cis-acting element composition were investigated. Tissue-specific and stress-induced expression patterns of all ZmSAPs were conducted. Finally, one stress responsive gene, ZmSAP8, was selected. Its molecular feature, as well as its biological function, were studied, which will be of great help for the development of maize tolerant lines.

2. Results

2.1. Identification of Genome-Wide SAP Genes in Maize and 37 Species

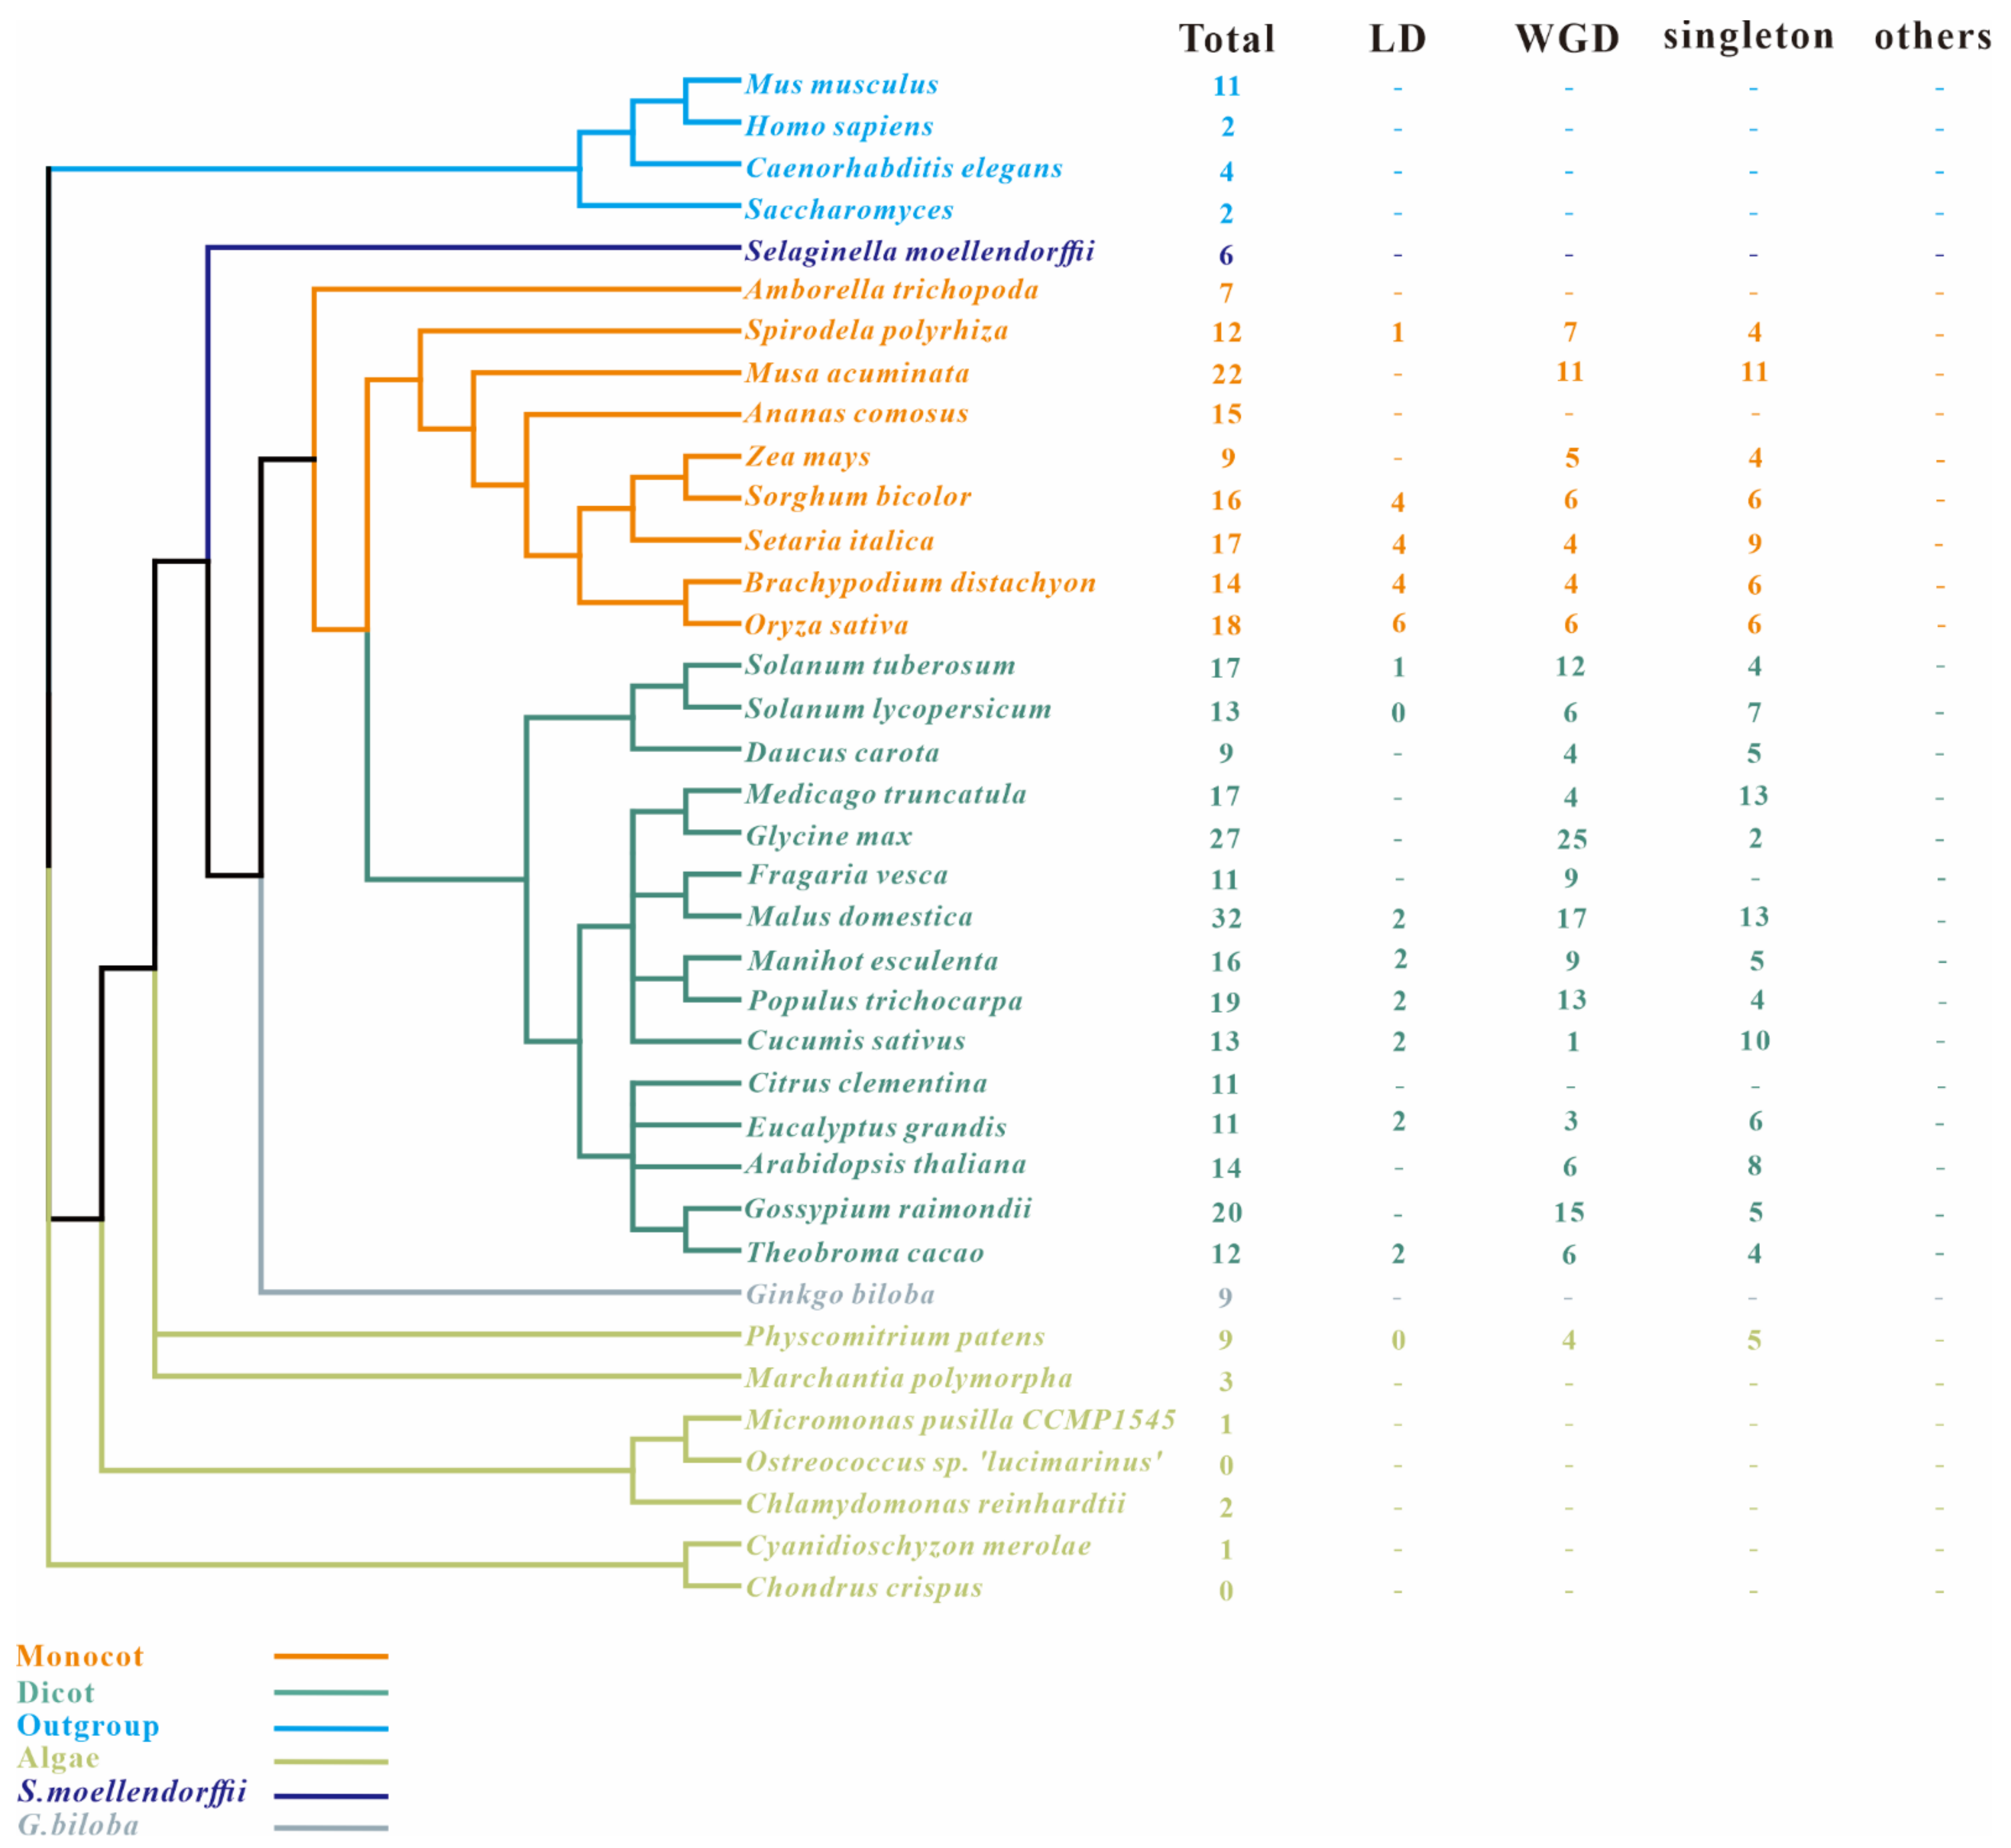
In the present study, nine SAP members were identified in maize by a genome-wide Pfam homology search (Table 1). These nine ZmSAPs were unevenly distributed on six out of ten chromosomes (Figure 1). There are two SAPs on chromosomes 1, 2, and 7. Chromosomes 4, 5, and 9 have one SAP, respectively. These ZmSAPs were further named as ZmSAP1 to 9, according to their order on the chromosomes. All of these SAP genes contain the AN1 zinc finger domain (PF01428), and five of them retain the A20 zinc finger domain (PF01754). According to the domain composition of ZmSAPs, ZmSAP1, ZmSAP4, ZmSAP6, ZmSAP7, and ZmSAP9 belong to the classical A20-AN1 type SAP genes, while ZmSAP5 and ZmSAP2 only contained AN1. Meanwhile, ZmSAP8 was the only AN1-AN1-C2H2-C2H2 type in maize, and ZmSAP3 was the only AN1-AN1 type. As can be seen in Table 1, the average length of ZmSAP proteins is 179.7. The length of ZmSAP8 was biggest and has 290 amino acids. Additionally, the isoelectric points, molecular weights, and the number of AN1 and A20 domains of each SAP are also presented in Table 1. To further trace the evolutionary history of SAPs, SAP homologs were chosen from other 33 plant species ranging from unicellular algae to higher angiosperms, as well as SAPs from four species of other kingdoms, including Homo sapiens (Animalia), Caenorhabditis elegans (Animalia), Saccharomyces cerevisiae (Chromista), and Mus musculus (Animalia). In the analysis of the results, we found that the SAP family was evolutionary conserved and only absent in two algae, including Chondrus crispus and Ostreococcus lucimarinus. A total of 415 SAPs were identified in these surveyed species (Figure 2), with the number of SAPs in each species ranging from 1 to 32. In Malus domestica, most SAPs (as many as 32) were found. We also found that gene expansion existed in the SAP gene family in surveyed angiosperm species in monocot and dicot species, the SAP family numbers ranged from 9 to 32.

2.2. Identification of Duplication Modes of SAP Members

SAPs showed gene family expansion especially in angiosperms in the above results, which were generally shown by gene duplication events. Whole genome duplication (WGD) and local duplication (LD, including tandem and proximal duplication) are two major gene duplication modes [22]. To better trace the origins of SAPs, we investigated the gene duplication events of SAPs in angiosperms (Figure 2). The result showed that 48% of the SAPs in the angiosperms that we investigated were involved in WGD and LD events that occurred during plant evolution. We found five of the nine (55%) ZmSAPs in maize were produced by WGD events (Figure 3). Moreover, in Malus domestica, which contains the most SAPs, about 53% (17 out of 32) SAPs were produced by WGD events, and two of these were also produced by LD events (Figure 2). These results suggest that WGD and LD events play an important role in angiosperms evolution and gene expansion.

2.3. Estimation of the Evolutionary Rate of SAPs in Angiosperms

The ratio of non-synonymous to synonymous substitution (Ka/Ks) is one of the most important indicators in exploring the molecular evolution rate. Generally speaking, when Ka/Ks is greater than 1, positive selection is indicated. If Ka/Ks is equal to 1, neutral selection is indicated. If the value is less than 1, purifying selection is indicated. Therefore, the evolutionary rates of the SAP family were estimated by calculating the Ka/Ks of paralogous gene pairs. First, Ka/Ks values of WGD and LD SAPs gene pairs were calculated (Figure 4). Results showed that Ka/Ks values of all surveyed gene pairs were less than 1, implying purifying selection. The mean Ka/Ks ratio of WGD pairs of SAPs is smaller than that of LD pairs, indicating that the evolutionary rate of LD relatives is faster than that of WGD relatives. Moreover, the Ka/Ks ratio of WGD related gene pairs and LD related gene pairs in monocots were higher than those in dicots, indicating that the evolutionary rate of SAP genes in monocots was higher than that in dicots.

2.4. Phylogenetic Analysis of SAPs in All Studied Species

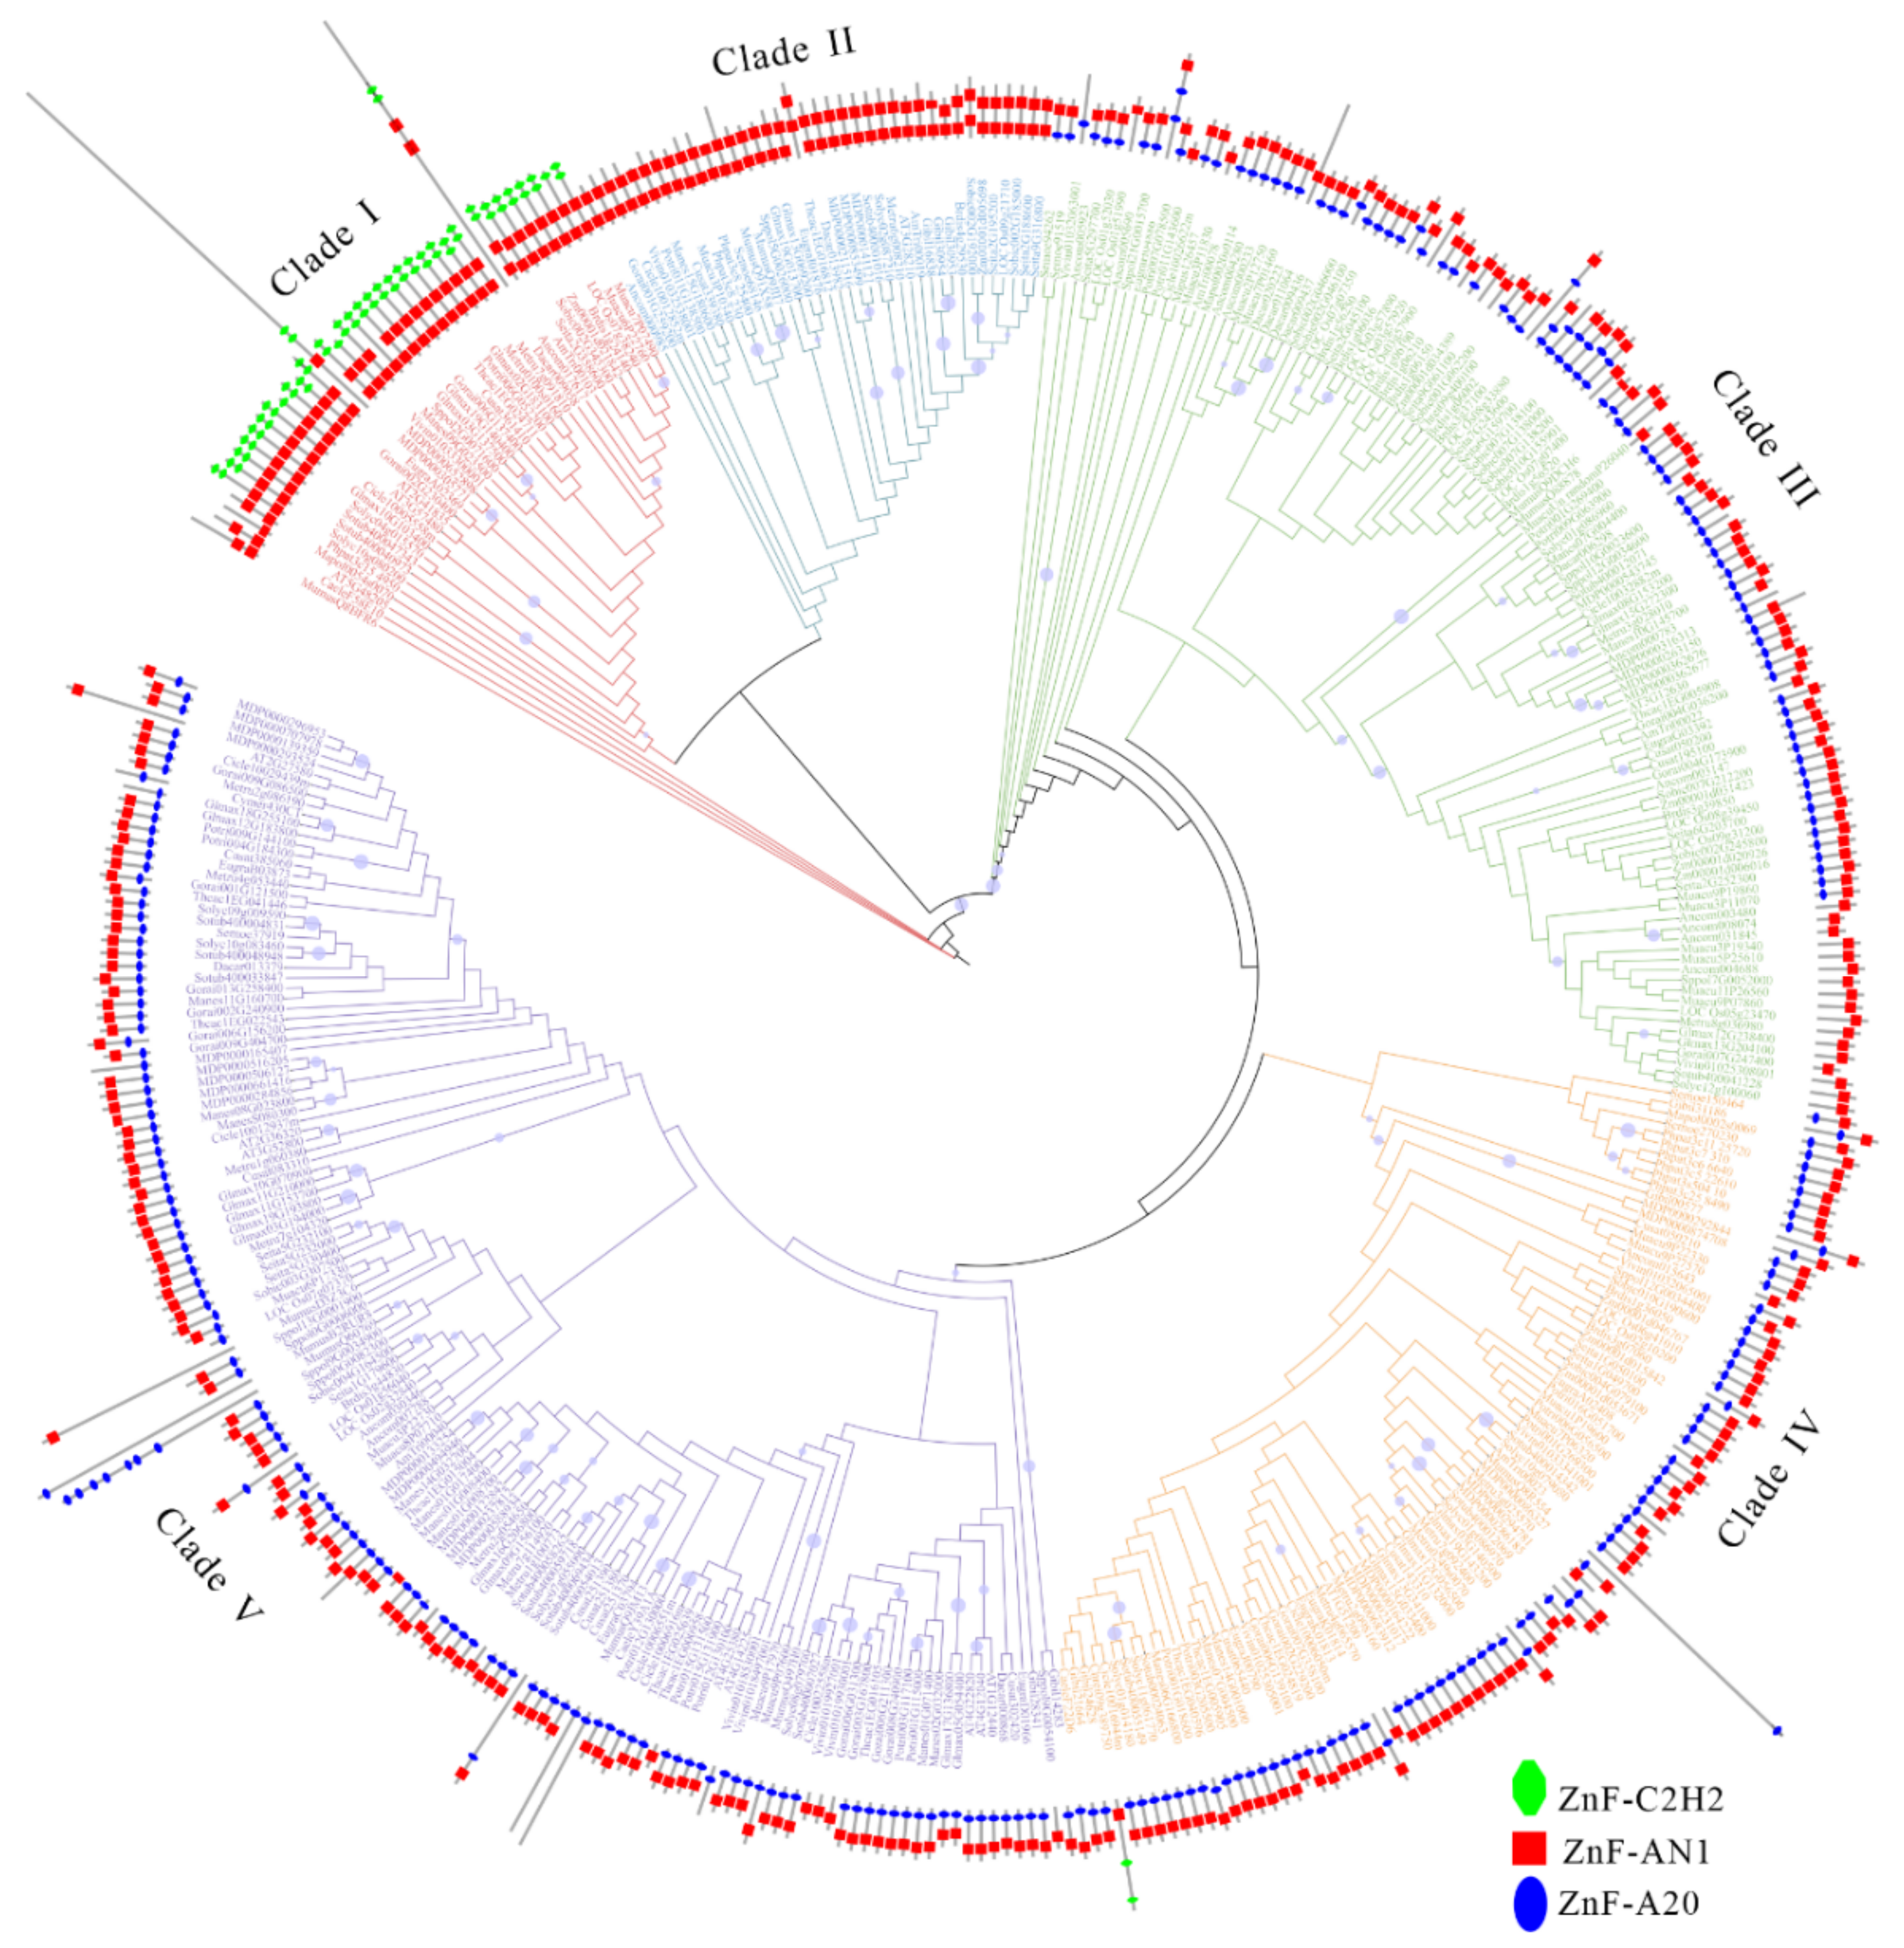
To further investigate the evolutionary history of SAPs in plant kingdoms, we constructed a maximum likelihood tree with all 415 SAPs from 33 surveyed plant species (Figure 5, File S1), as well as the SAPs of four species from other kingdoms, which were regarded as outgroups. According to the topology and bootstrap values of clade nodes, the tree could be classified into five clades, named as clade I to V. Within the five clades, 39, 38, 74, 88, and 138 SAPs were clustered, respectively. Moreover, SAPs from all surveyed species presented in each clade, indicating the ancient origination of SAPs. In clade I, we found that the vast majority of SAPs were composed of the AN1AN1-C2H2-C2H2 domain, which has been reported to be closely related to plant stress response. The AT5G48205 AT2G41835, AT3G57480 have been reported to be related to A. thaliana adversity stress resistance [18], LOC_Os07g38240 also proved to be related to rice drought stress response [13]. No members of this clade contain the A20 domain. All SAPs in clade II were AN1-AN1 domains. LOC_Os09g21710 [23] has been reported to be related to chloroplast development in rice. Most members of clade III contain classic A20-AN1 or A20-A20-AN1 domains, and some members of this clade have been reported to be related to plant response to stress. AT3G12630 has been reported to improve drought and heat tolerance of plants [24]. The domain characteristics and number of members of clade IV are similar to those of clade III. As the largest clade of all clades, clade V contains the most members, and only this clade has members with multiple A20 domains. At the same time, we also found that all the members of all branches with only one or more A20 domains are from the external population, which may reflect the unique evolutionary history of the SAP family [25].

2.5. Gene Structure and Coding Protein Analysis of Maize SAPs

Focusing on SAPs in maize, a neighbor-joining (NJ) phylogenetic tree containing only maize SAPs was also constructed. We found that the topology of the neighbor-joining phylogenetic tree was basically consistent with the SAP maximum likelihood phylogenetic tree (Figure 6), illustrating the accuracy of phylogeny reconstruction. By analyzing the gene structure of SAPs in maize, we found that most ZmSAPs are intron-free, only ZmSAP1, ZmSAP8, and ZmSAP9 contain introns. Further analysis of the conserved domain and motif composition of ZmSAPs showed that ZmSAPs with close phylogenetic relationship shared similar conserved domain and motif composition. We found that ZmSAP5, ZmSAP2, ZmSAP8, and ZmSAP1lost the A20 domain. Moreover, ZmSAP8 and ZmSAP3 have two AN1 domains, and ZmSAP8 is the only member of the family with two C2H2 domains, which have been reported to be the major regulator of plant responses to abiotic stresses such as drought [25,26].

2.6. Cis-Acting Element Analysis of ZmSAPs

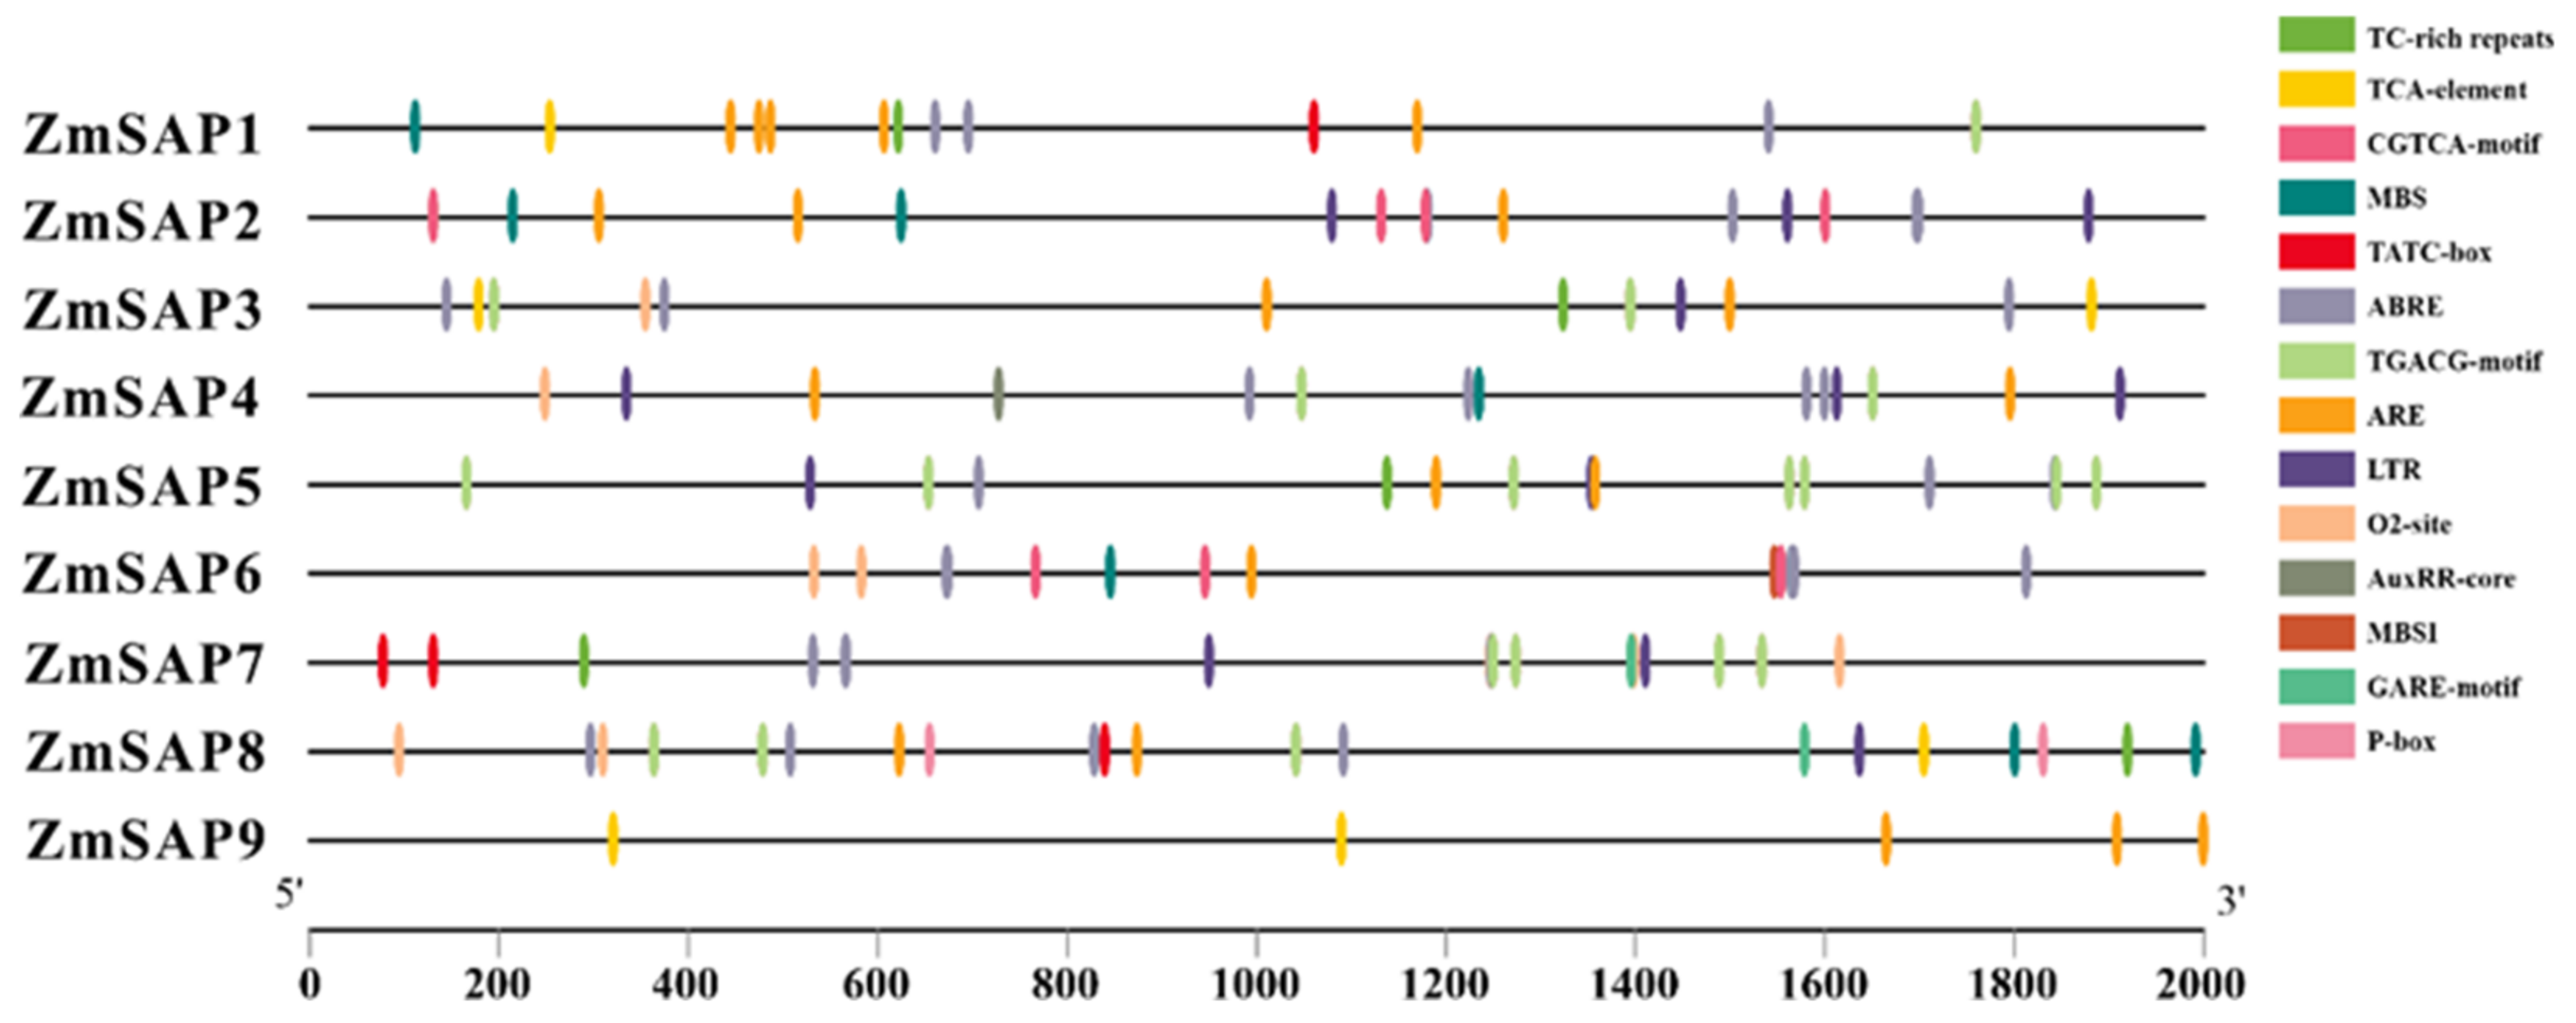
The cis-acting element plays an important role in gene transcription and translation. Therefore, for further study, we used plantCARE software to perform cis-acting element analysis among the promoter regions of all ZmSAPs [27]. The 2000 bp upstream sequence of the ZmSAPs was selected for analysis (Figure 7). We found that almost all ZmSAPs have cis-acting elements involved in abscisic acid response (ABRE) and cis-acting elements in methyl jasmonate (MeJa) response (TGACG-motif and CGTCA-Motif). Abscisic acid (ABA) and MeJA play important roles in plant stress response and seed development [28,29]. We also detected the presence of stress response elements (TC-rich repeats) [30] in ZmSAP2, ZmSAP3, ZmSAP6, ZmSAP8, and ZmSAP9. On ZmSAP1, ZmSAP3, ZmSAP4, ZmSAP7, and ZmSAP9, we found the presence of drought-induced response elements (MBS) [31]. Low temperature stress response elements (LTRS) [32] were also found on ZmSAP2, ZmSAP3, ZmSAP4, ZmSAP6, ZmSAP7, ZmSAP8, and ZmSAP9. These results further supported the importance of ZmSAPs in plant response to abiotic stress.

2.7. Expression Patterns of ZmSAPs in Different Tissues

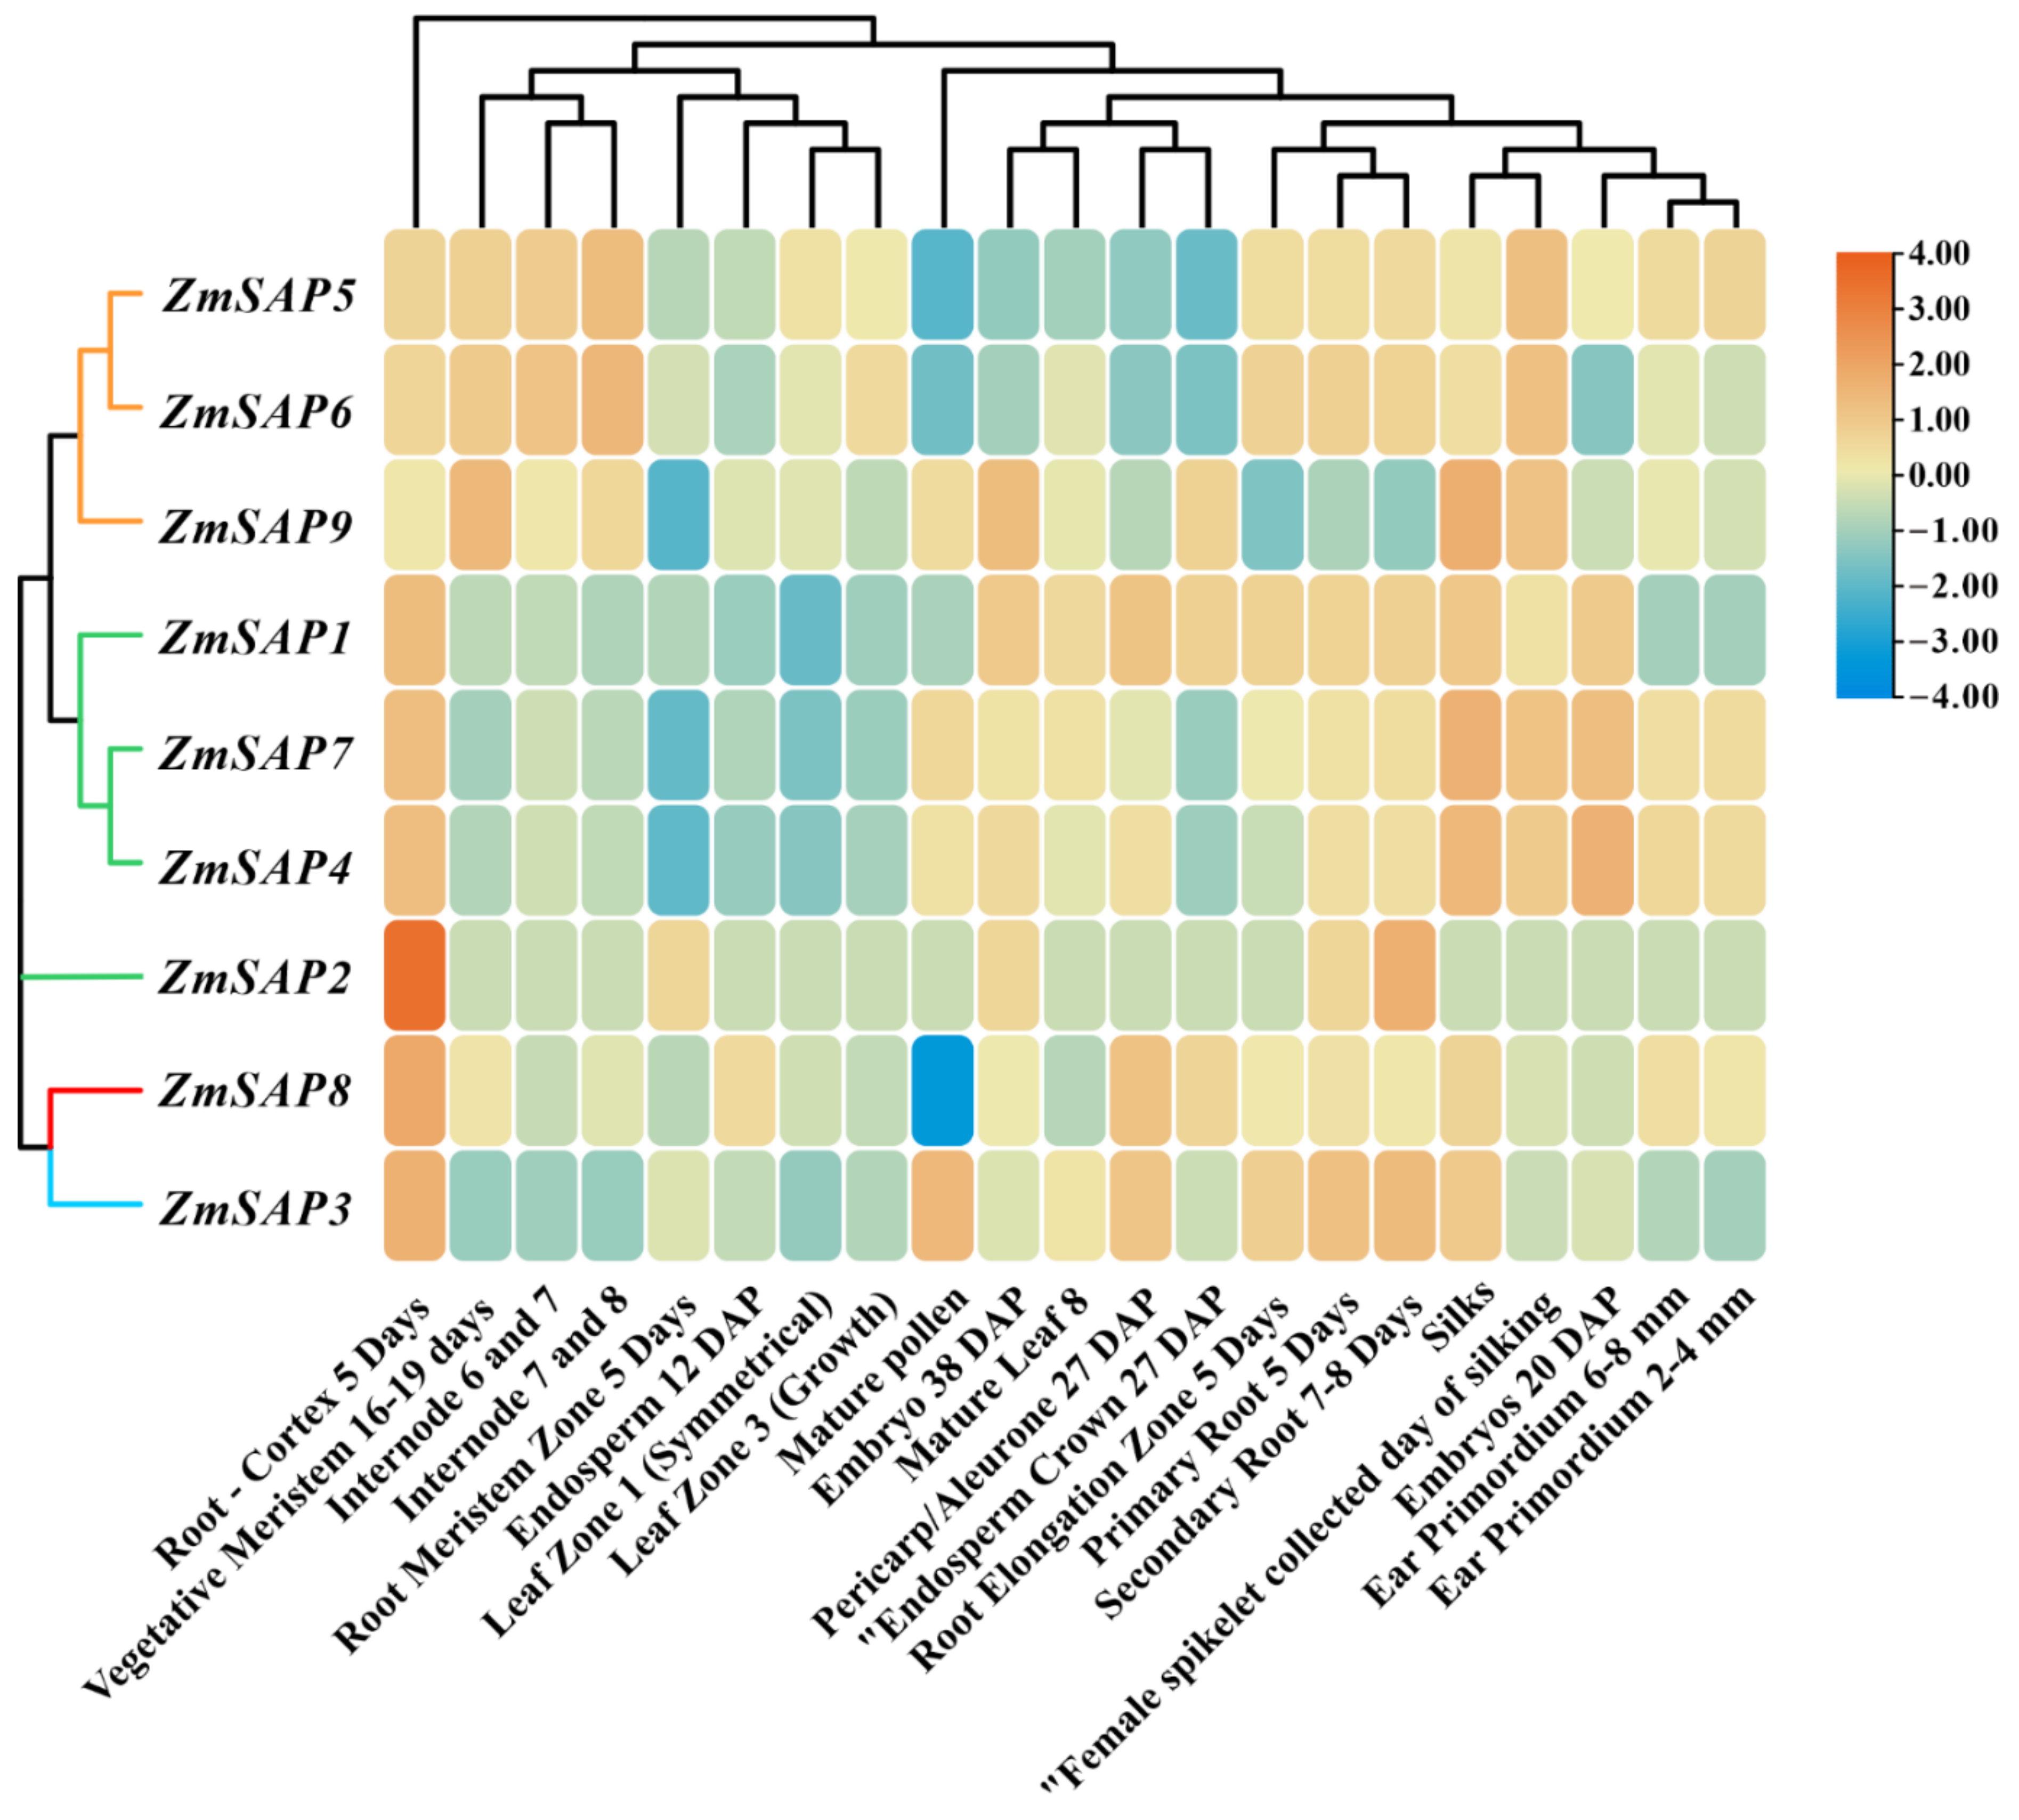
To gain a better understanding of the functions of the ZmSAP family, we investigated the tissue expression pattern characteristics of all ZmSAPs at different maize tissues or at different growth stages (Figure 8). As a result, we found that the tissue expression characteristics of ZmSAPs were distinct. As shown in the picture, we found that all ZmSAP family members were highly expressed in roots. In the phylogenetic tree, ZmSAP5, ZmSAP6, and ZmSAP9 belonging to clade IV were highly expressed in the meristem and internode, while members belonging to clade III had low expression levels in the internode. Family members within the same clade have similar expression patterns. We also found that gene pairs with WGD events had almost identical expression patterns, such as ZmSAP5 and ZmSAP6, ZmSAP4 and ZmSAP7.

2.8. Effect of Drought Stress Treatment on Relative Gene Expression Levels of ZmSAPs

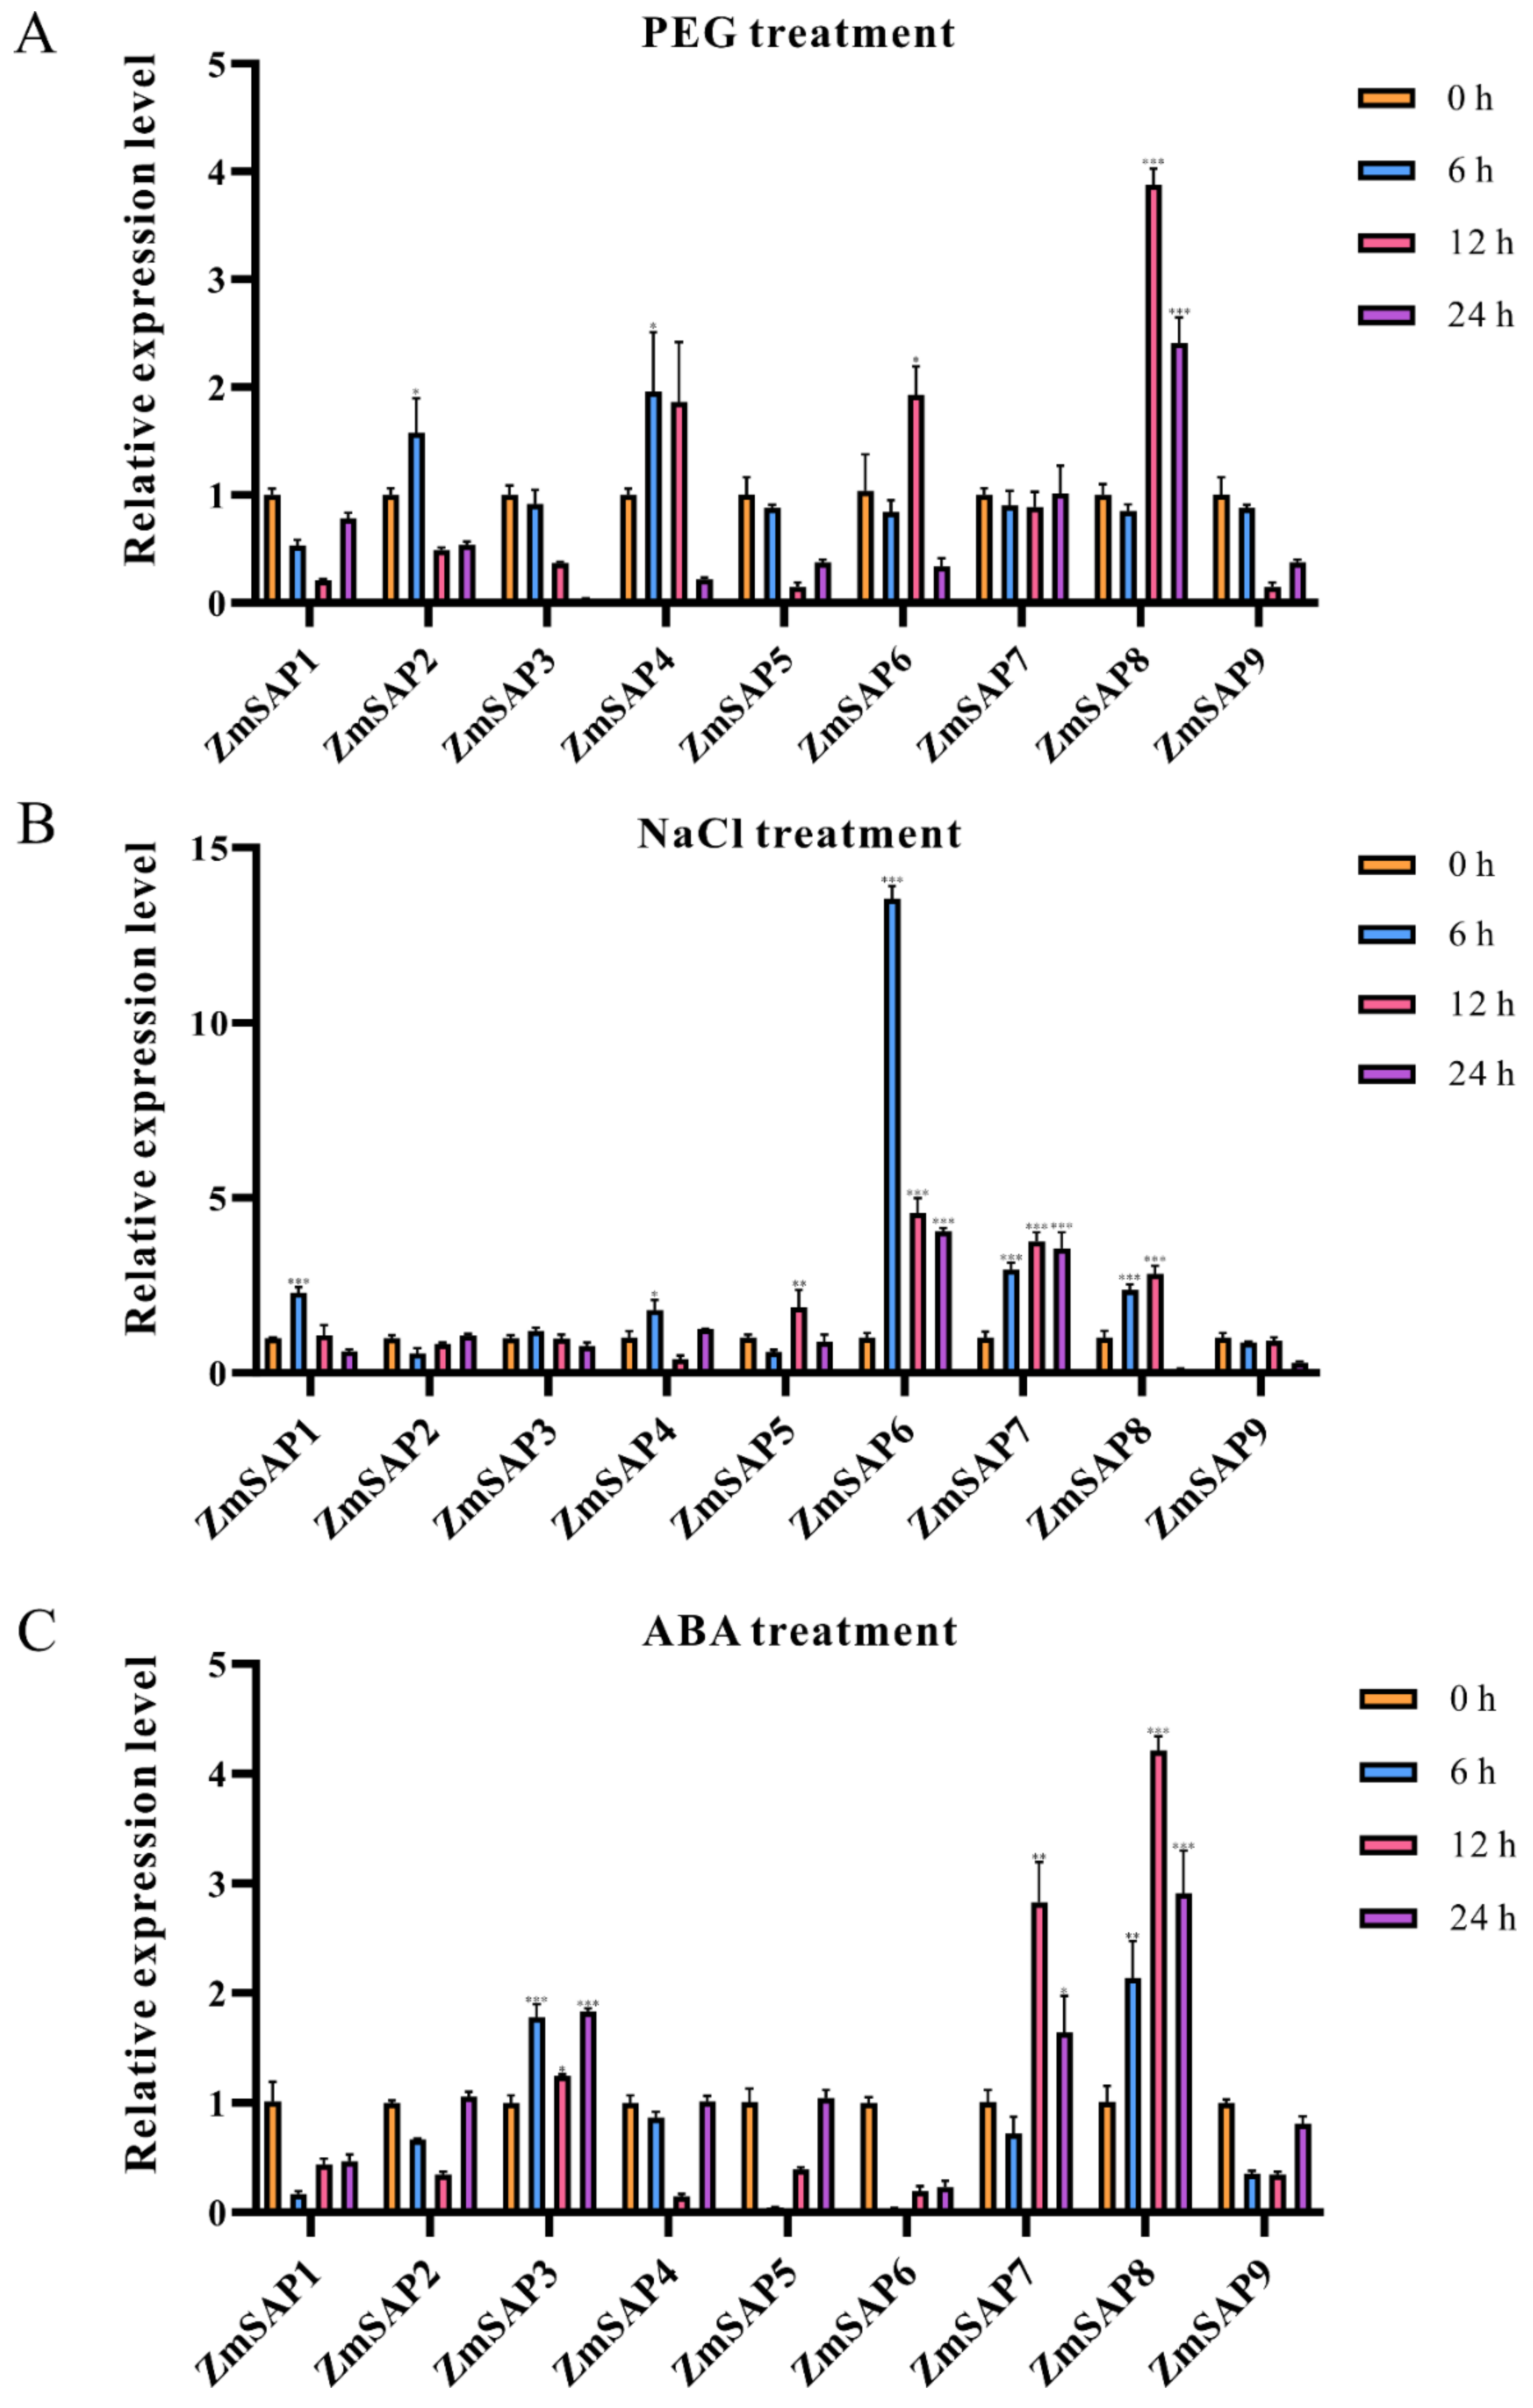
According to our results, there are multiple abiotic stress and hormone pathway response elements in the promoter region of ZmSAPs, such as ABA binding element (ABRE), anaerobic response element (ARE), and drought response element (MBS) [5,15]. We examined the expression levels of ZmSAP family genes under treatment conditions such as polyethylene glycol (PEG), NaCl, and ABA to investigate whether their functions are related to abiotic stress [33] (Figure 9). Under PEG-simulated drought treatment conditions, only ZmSAP8 was upregulated more than 2-fold after treatment for 12 h (Figure 9A). Under NaCl treatment, ZmSAP6, ZmSAP7, and ZmSAP8 were up-regulated after treatment, among which the expression of ZmSAP6 was up-regulated by more than ten-fold, and the expression of ZmSAP7 and ZmSAP8 was also up-regulated by more than 2-fold after 6–12 h treatments. (Figure 9B). Under ABA treatment for 6–12 h, ZmSAP3, ZmSAP7, and ZmSAP8 were observed to be up-regulated. Moreover, only ZmSAP7 and ZmSAP8 were up-regulated by more than 2-fold, and ZmSAP8 was the most up-regulated by nearly 5-fold. Based on the expression analysis results after these treatments, we concluded that the expression of ZmSAP8 was related to a variety of abiotic stresses and abscisic acid, having great research value. Therefore, we decided to select ZmSAP8 as a study subject to further explore its function.

2.9. Subcellular Localization Analysis of ZmSAP8

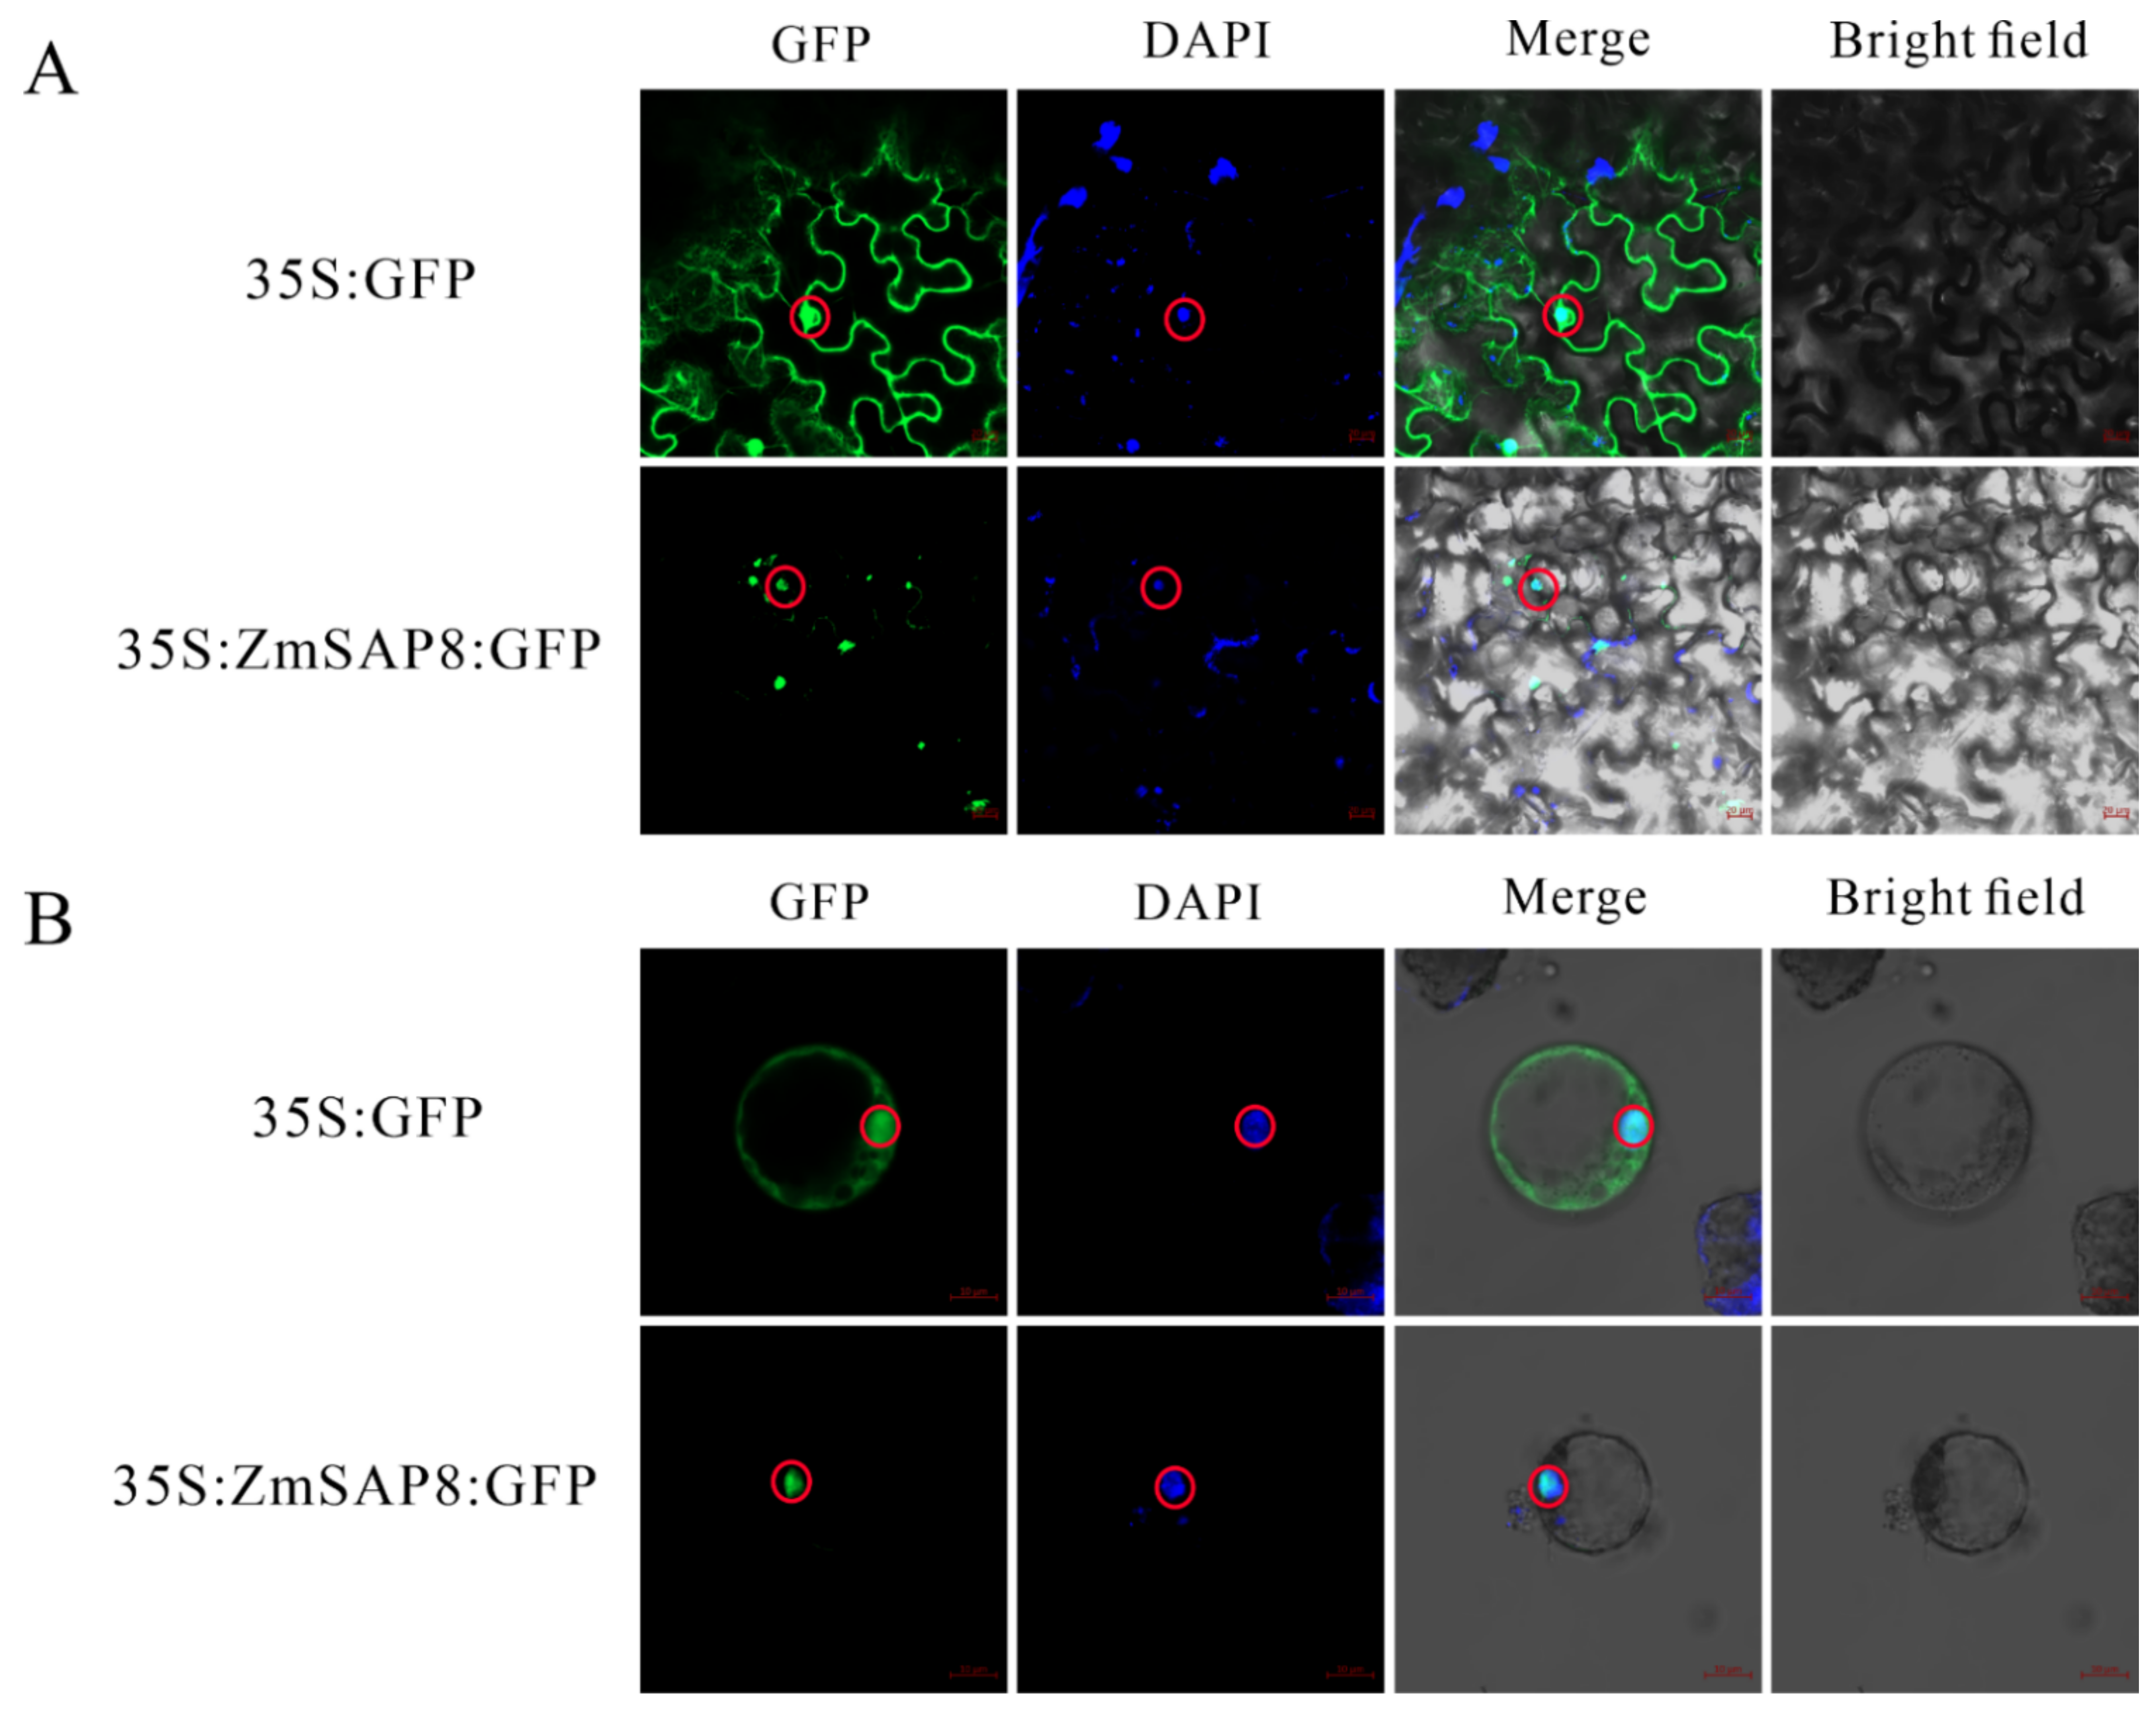
Studying the localization of SAPs in cells is of great significance for the study of SAP function. We first predicted the subcellular localization of ZmSAP8 using the cell-ploc 2.0 website [34], and the predicted result was localized in the nucleus. To further confirm whether ZmSAP8 is a nuclear protein, a GFP-tagged ZmSAP8 construct was made, which was under the control of CaMV35S promoter and fused with GFP at the C-terminus of the ZmSAP8 coding sequence (construct 35S:ZmSAP8-GFP). This construct was transiently expressed in Nicotiana benthamiana epidermal cells and observed by confocal laser scanning microscopy (Figure 10). The construct of 35S:GFP was applied as control and cell nuclei were stained with DAPI. As shown in Figure 10, the GFP signal of 35S:ZmSAP8-GFP construct was in the nuclei, which is overlapped with the DAPI signals, whereas the GFP signal of the control construct could be detected both in cytoplasm and nuclei. We also performed the same transformation in maize protoplasts and observed the same fluorescence signal results. The result proved that ZmSAP8 is a nuclear-localized protein.

2.10. Transcriptional Activity Analysis of ZmSAP8 in Yeast Cells

As seen in previous reports, SAP members may function as transcription factors [35]. Thus, the yeast GAL4 system was employed to test whether ZmSAP8 has autoactivating transcriptional activity, with pGBKT7 empty vector as a negative control. BD-p53 and AD-SV40 large T antigen were used as positive control (Figure 11). All the transformed yeast cells could grow normally on SD/Trp medium, while on SD/Trp -/His-/Ade-medium, only the positive control could grow normally. However, the negative control and the yeast cells transformed with pGBKT7-ZmSAP8 recombinant vector failed to grow normally, indicating that ZmSAP8 has no transcriptional activity in yeast cells.

2.11. ZmSAP8 Enhances Drought Resistance in A.thaliana

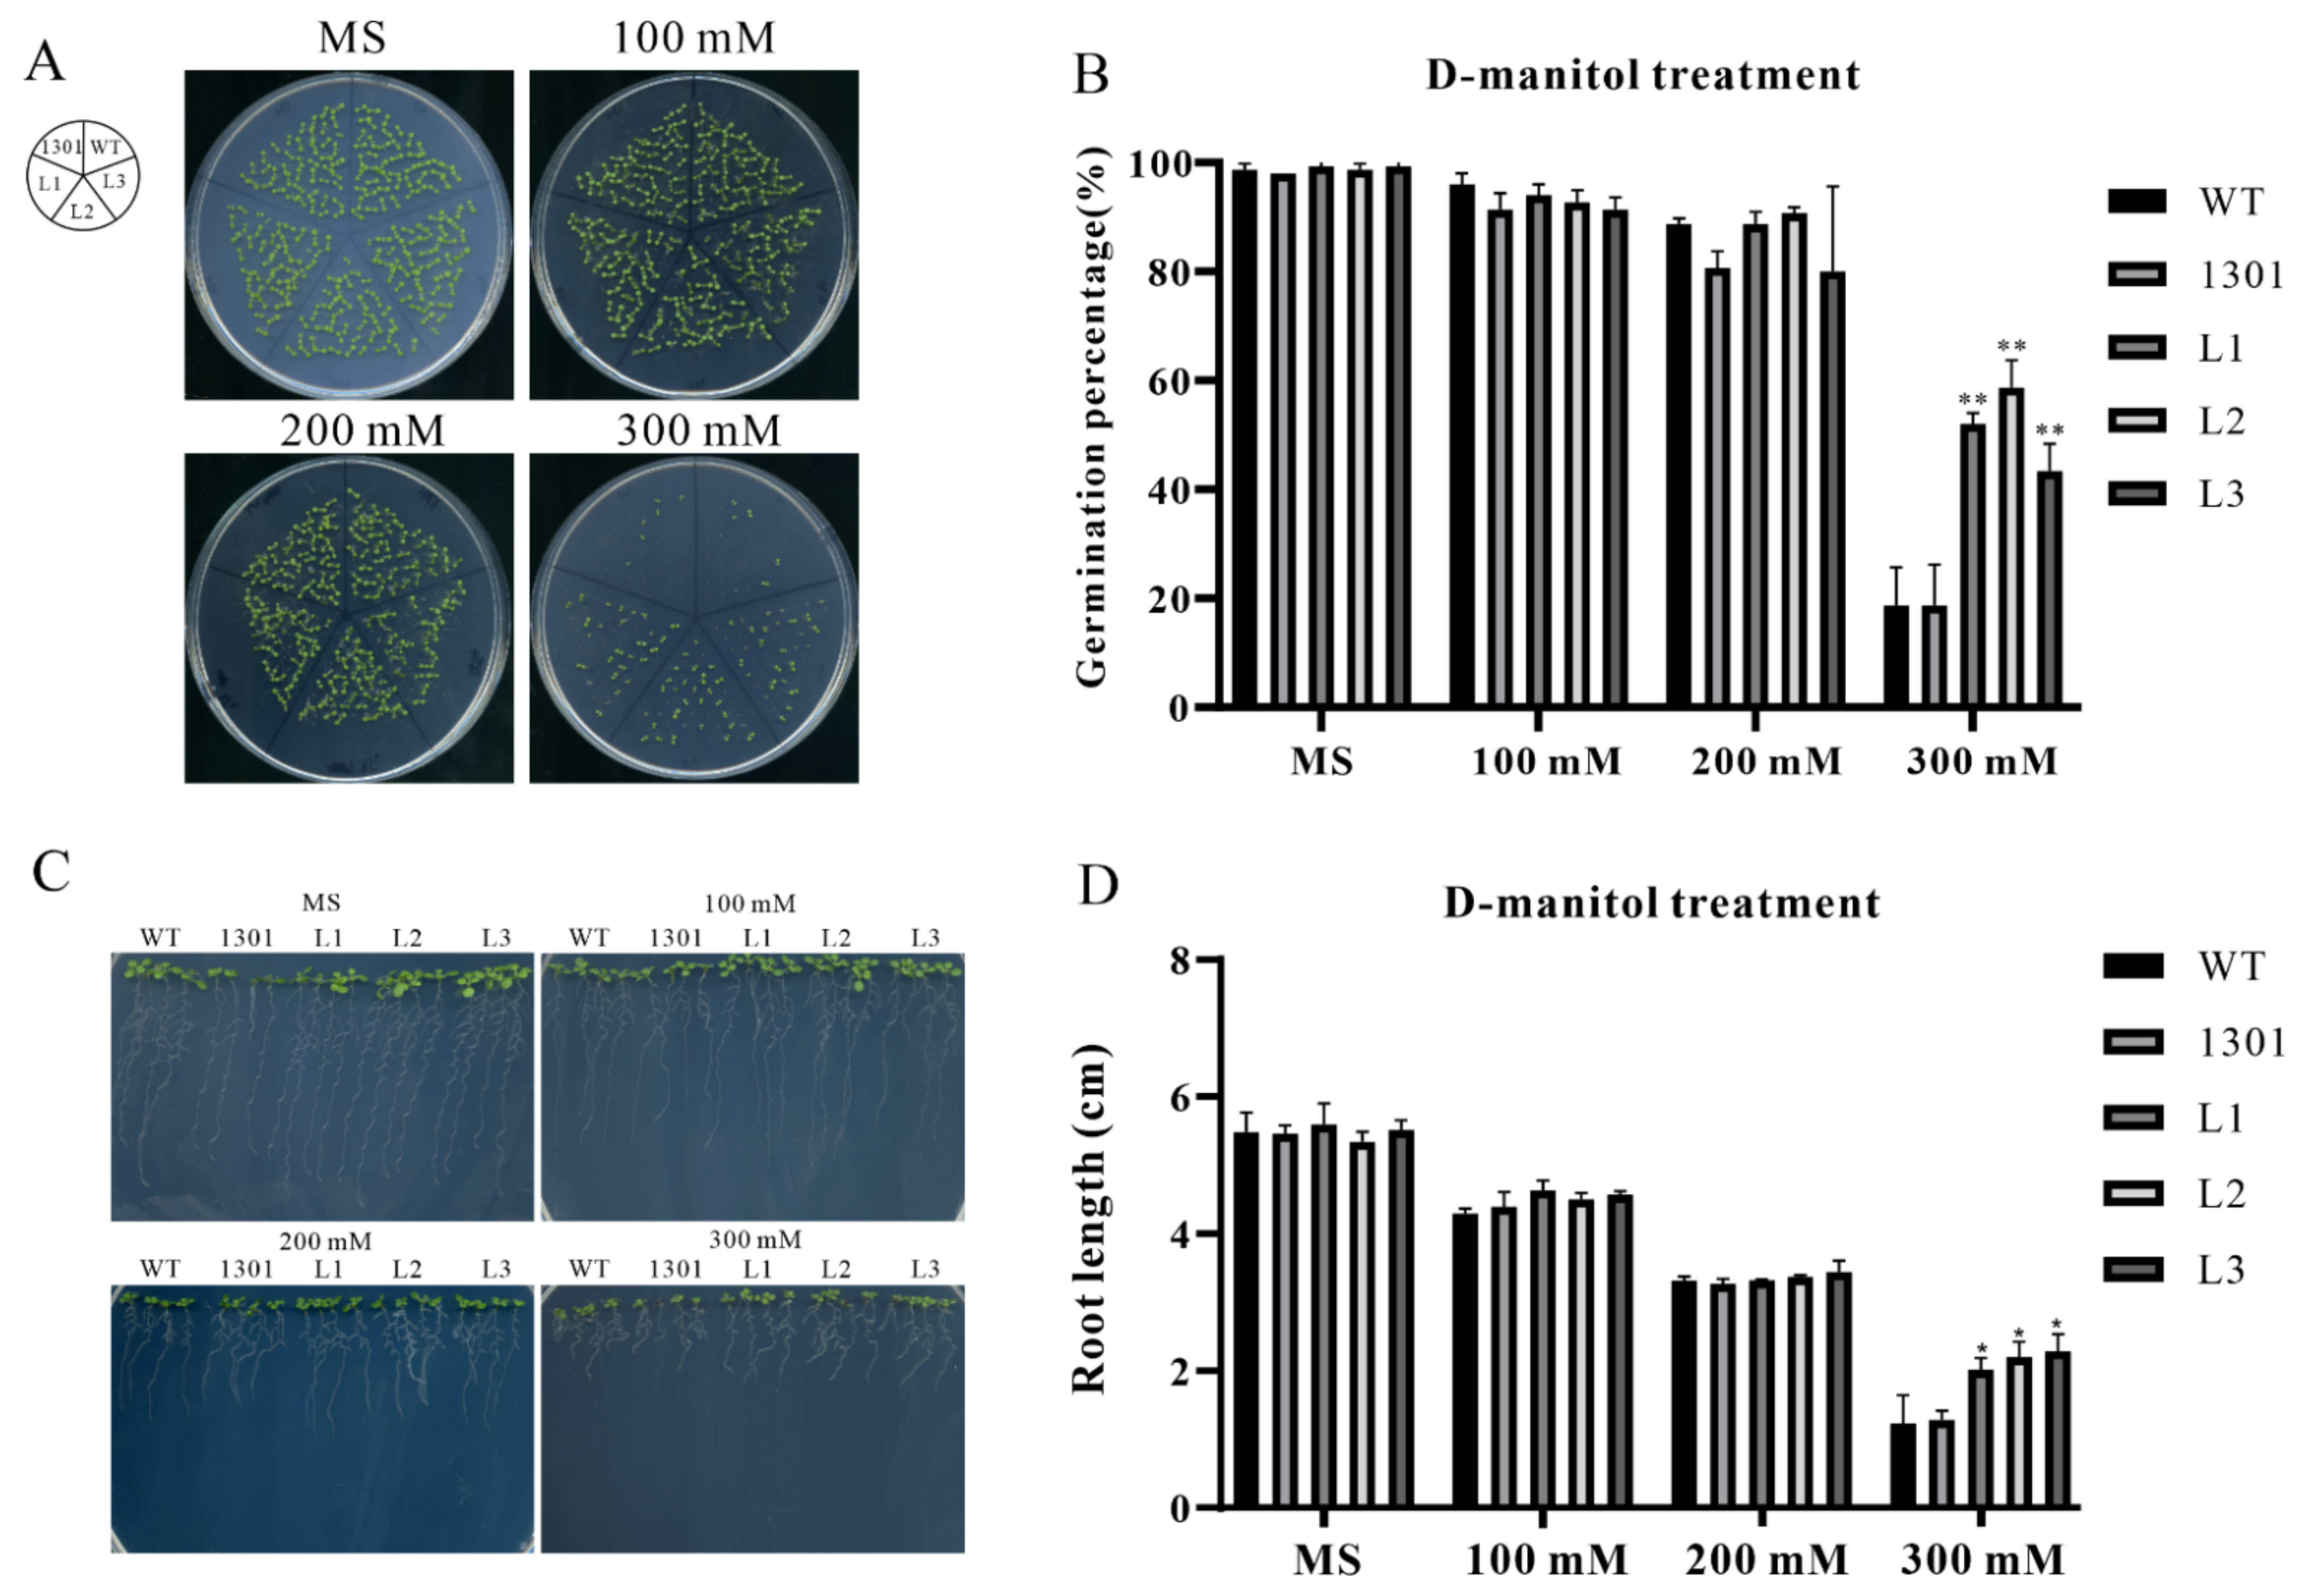
To further investigate the biological function of ZmSAP8, it was heterologously expressed in A.thaliana for functional studies. Three independent homozygous T3 generation transgenic lines overexpressing ZmSAP8 were screened. In our previous results, ZmSAP8 was strongly induced by PEG-simulated drought, implying that ZmSAP8 might be involved in plant response to drought or osmotic stress. We conducted experiments on the germination rate of transgenic Arabidopsis under D-mannitol simulated drought stress conditions. The results are shown in Figure 12. When the concentration of D-mannitol reaches 300 mM/L, the germination percentage of transgenic Arabidopsis plants (L1-L2-L3) was significantly higher than that of wild-type plants, indicating that transgenic Arabidopsis plants had better drought resistance than wild type plants. Because root growth under drought stress also reflects the resistance of plants to drought stress, we next determined the root length of transgenic Arabidopsis under D-mannitol simulated drought conditions [35]. The results are shown in Figure 12C,D. Consistent with the germination rate experiments, the root length of transgenic Arabidopsis was significantly longer than that of wild-type Arabidopsis when D-mannitol concentration reached 300 mM/L. These results indicated that ZmSAP8 enhanced resistance to drought stress in Arabidopsis.

3. Discussion

SAP proteins were first identified in humans, playing vital roles in human immune responses [36,37] and plant responses to abiotic stress. SAPs extensively exist in almost all eukaryotes. To date, they have been found in plants ranging from lower herbs to higher woody plants, including A. thaliana, O. sativa, P. trichocarpa, M. domestica, and M. truncatula, whereas no systematic study about the SAPs of maize has been published [6,7,16,38,39]. The present study identified SAPs from 37 species, emphasizing the evolutionary patterns of ZmSAPs. Results found that in these SAPs, evolutionary pattern is conserved and could be identified in nearly all the surveyed eukaryotes, including different kinds of representative plant species, mice, homo sapiens, and Caenorhabditis elegans. This suggests the ancient origin of SAPs. Additionally, gene expansion of SAPs was observed in angiosperms. In the long evolution, gene family expansion has been continuously occurring, generally resulting in duplication events, including WGD and LD. The duplicate events occurred and resulted in different consequences, such as dispersive repeat for genomic changes, bringing neofunctionalization or functional redundancy [40,41]. Moreover, gene family amplification also prompted gene functional change, thus adapting to the threats in the environment [42,43]. At the same time, because plants have no mobility, gene families in plants, especially those in response to stress, have more replication events [44,45]. According to the results of our gene duplication mode identification, the expansion of SAPs in maize is mainly due to WGD events. Five out of nine ZmSAPs were produced by WGD events. Moreover, there are four WGD ZmSAP gene pairs, whereas the ZmSAP8 gene for our function study is not produced by the WGD event, which may be due to its distant genetic relationship with other members. The collinearity results also show that ZmSAP8 has no collinearity with other SAP family members in maize (Figure 3).
Further phylogeny reconstruction of 415 SAPs from 37 surveyed species showed that all SAPs could be divided into five clades (Figure 5). In clade I, there were mainly SAPs from angiosperms which showed specific protein domain composition, indicating the recent origins of SAP members in clade I. Moreover, other four branches were relatively close on the evolutionary tree and only contained the AN1 domain. Thus, we hypothesized that the AN1 domain appeared first in the evolutionary history of SAPs. Meanwhile, we found that all the other members of clade I have the AN1-AN1-C2H2-C2H2 structure and do not contain the A20 domain. The C2H2 zinc finger domain has been shown to play an important role in plant response to abiotic stress [25]. LOC_Os07g38240 (OsSAP16) [14] in this clade has been reported to be involved in regulating the response of rice to drought stress. AT3G57480 (AtSAP12) and AT2G41835 (AtSAP10) have been reported to be involved in the response of Arabidopsis to cold and salt stress [18]. We speculated that members in this clade may have conserved roles in response to environmental stresses, but this does not mean that members of non-clade families are not involved in abiotic stress responses. In clade IV, MDP0000292844 (MtSAP15), which encoding a protein possesses the classical A20 and AN1 zinc finger domains of the SAP family, was also reported to be involved in plant response to drought stress and could enhance drought resistance in transgenic Arabidopsis [7]. We found that SAPs from surveyed outgroups appeared in every clade of the evolutionary tree. However, none of the SAPs from outgroups contain AN1 domain structure, and only SAPs from animals contain the multiple A20 domain structure, indicating different evolutionary events may have occurred in SAPs in animals compared with plants.
According to previous studies, cis-acting elements play an important role in plant response to abiotic stress and the regulation of growth and development [46,47]. According to our study of cis-transcription elements of ZmSAPs, we found that there were a variety of cis-elements involved in stress and hormone signal response in the promoter region of ZmSAPs (Figure 7); for example, ABRE, MBS, TCA-Element, TGACG-motif, TC-rich repeats, LTR, p-box [28,29,30,31,48,49], and other elements. First, Tc-rich repeats and MBS [30], which have been reported to be involved in plant response to stress and stress defense, are widely present in most members. This is consistent with previous reports that SAPs are extensively involved in stress responses. ABRE [28], as an ABA signaling responsive cis-acting element, is present in the promoter region of all family members except ZmSAP9. At the same time, we also found that CGTCA-motif, TATC-box [28,29], and other cis-elements related to jasmonic acid, salicylic acid, and other plant stress-related hormone pathways were present in the promoter region of all ZmSAPs. We hypothesized that the response of ZmSAPs to plant stress may be accomplished by regulating the plant hormone pathway [6,8,9]. Finally, ZmSAP8, a A20-AN1-C2H2 type SAP gene, was found to be responsive to PEG and salt treatment (Figure 9). Moreover, ZmSAP8 belonged to clade I and exhibited close phylogenetic relationship with OsSAP16 (Figure 5), AtSAP12 and AtSAP10, all of which provide tolerance to diverse abiotic stresses [13,17,18]. The molecular characteristics and expression patterns of ZmSAP8 were analyzed, and the effects of ZmSAP8 on drought stress tolerance in transgenic Arabidopsis were also enhanced (Figure 12). We believe that ZmSAP8 is a candidate gene with great application prospects and may provide major help in our subsequent development of maize lines with excellent stress resistance traits. In summary, our multi-species phylogenetic reconstruction of SAPs and phylogenetic analysis of ZmSAPs, together with the molecular characterization and functional study of ZmSAP8, provide valuable clues for revealing the functions of SAPs in plants [37] and for the development of high-quality maize strains resistant to abiotic stress in the future [50].

4. Method and Materials

4.1. Data Source and Identification of the SAP Gene Family

In this study, a total of 37 species genome data were downloaded for research, including 33 plant genomes, 4 animal genomes, and 1 microbial genome. Genome and gene annotation files of Amborella trichopoda, Ananas comosus, Arabidopsis thaliana, Brachypodium distachyon, Caenorhabditis elegans, Chlamydomonas reinhardtii, Citrus clementina, Cyanidioschyzon merolae, Daucus carota, Eucalyptus grandis, Ginkgo biloba, Glycine max, Gossypium raimondii, Zea mays, M. domestica, Manihot esculenta, Marchantia polymorpha, Medicago truncatula, Micromonas pusilla CCMP1545, Musa acuminata, Oryza sativa, Physcomitrella patens, Populus trichocarpa, Selaginella moellendorffii, Setaria italica, Solanum lycopersicum, Solanum tuberosum, Sorghum bicolor, Spirodela polyrhiza, Theobroma Cacao, and Vitis vinifera were all downloaded from Phytozome (https://phytozome-next.jgi.doe.gov/ accessed on 17 January 2022) [51]. Genome annotations for Zea Mays were downloaded from MazieGDB. (https://maizegdb.org/ accessed on 17 May 2022) [52], Genome annotations for G. biloba were downloaded from previous literature [53], and Genome annotations for C. merolae, Mus musculus, Caenorhabditis elegans, Saccharomyces cerevisiae and Homo sapien were downloaded from Ensembl Genome [54] (http://ensemblgenomes.org/ accessed on 17 May 2022). The local perl script “Pfam_scan pfam”, downloaded from HMMER3.1, was used to search the local pfam library (http://hmmer.org/ accessed on 30 May 2022) for the proteomes of these surveyed species [55]. The E-value was set as the default value. All candidate SAPs were selected with ZF-AN1 and ZF-A20 domains.
The Mw and pI of each of the ZmSAPs were estimated using the pI/Mw tool at the ExPASy website. The pI and GRAVY of the full length for ZmSAPs were calculated using ExPASy tools [56]. The ZmSAPs gene structures were displayed by comparing the coding and genomic sequences with TBtools [57].The chromosomal locations of ZmSAPs genes were mapped onto the maize linkage map with TBtools. The predicted subcellular localizations of ZmSAPs were analyzed using cell-ploc 2.0 website (http://www.csbio.sjtu.edu.cn/bioinf/Cell-PLoc-2/ accessed on 17 June 2022) [34]. The promoter sequence of ZmSAPs was obtained from the Phytozome database and the cis-elements were analyzed by using PlantCARE [27] (http://bioinformatics.psb.ugent.be/webtools/plantcare/html/ accessed on 27 June 2022). The phylogenetic species tree was constructed using the Taxonomy Browser online program (https://www.ncbi.nlm.nih.gov/Taxonomy/CommonTree/wwwcmt.cgi accessed on 3 June 2022).

4.2. Collinearity and Gene Replication Pattern Prediction

By using the MCSanX package to detect collinearity within and across species genomes [58], and by using MCSanX to explore repeat patterns of SAPs in angiosperms, MCScanX can effectively classify repeat genes in memory families based on their copy number and genome distribution. These include whole genome duplication (WGD)/local duplication (LD, including tandem and proximal duplication).

4.3. Calculation of the Ratio of Ka to Ks

Natural selection pressures received during evolution were predicted by calculating the synonymous to nonsynonymous ratio of SAP gene duplication pairs in angiosperm by selecting CDS sequences in genome files and translating them into amino acid sequences by Clustalw2. The aligned sequences and CDS sequences of each gene duplicated pair were submitted to PAL2NAL to estimate the Ka and Ks substitution rates with the PAML package [59].

4.4. Phylogenetic Analysis

SAP sequences from all surveyed species were selected and aligned using MAFFT with the auto-strategy [60]. Gaps in aligned sequences were deleted by TrimAL v1.2 using -automated 1 or -strictplus for ML and NJ trees, respectively [61]. Then, we used ProtTest3.4 to further assess the alignment sequence to select the most suitable amino acid substitution model for ML phylogenetic tree construction [62]. The best model according to AIC was JTT + G (−lnL = 111,863.18). Finally, the trimmed aligned protein sequences were submitted to phyML 4.0 to construct the ML phylogenetic tree [63]. The branch-supported measure based on fast approximate likelihood (Shimodaira–Hasegawa Approximate Likelihood Ratio Test, SH-aLRT) was used for branching. Other parameters were set according to the results of the ProtTest test (gamma shape = 1.254, amino acid frequency = observed value). The obtained tree was edited using MEGA-X and iTOL [64,65].

4.5. Conserved Motif Analysis

To detect conserved motifs in SAPs, the online MEME program (https://meme-suite.org/ accessed on 28 July 2022) was utilized with the command line as follows: meme all_protein_sequence. fas-o result-protein-evt 0.05-maxsize 10,000.0-nmotifs 40 [66]. The MEME program identified conserved motifs of the ZmSAPs with the default parameters, except that the number of motifs was 40.

4.6. Expression Analysis of ZmSAPs Genes in Different Tissues

The expression profiles for ZmSAPs genes were obtained from the MaizeGDB website (https://www.maizegdb.org/ accessed on 27 July 2022) [52], and a heat map was generated by TBtools software (https://github.com/CJ-Chen/TBtools accessed on 28 July 2022).

4.7. Plant Material Growth and Stress Treatment

Two-week-old seedlings of the maize (Zea mays L. Inbred line B73) plants were used to examine ZmSAPs gene expression patterns in response to PEG/NaCl/ABA stress treatments. The plants were grown in a greenhouse at 28 ± 2 ℃ and a 16 h light/8 h dark cycle at the School of Life Sciences, Anhui Agricultural University China. The treatments were 20% PEG6000 (w/v), 200 mM NaCl, and 100 mM ABA for 0 h, 6 h, 12 h, and 24 h, All treatments were formulated according to the concentration and then sprayed on the plant roots, respectively. For sampling, the third leaves of seedlings were harvested; immediately frozen in liquid nitrogen, and stored at −80 °C until further RNA extraction. Three seedlings were taken as three repeat samples. For Arabidopsis, the homozygous transgenic (L1-L2-L3), the transgenic vector-only control (1301) and wild-type (WT) plants were grown in a greenhouse under a 16 h day/8 h night photoperiod at 22 ℃. Each test was repeated a minimum of three times.

4.8. RNA Extraction and qRT-PCR Analysis

RNA was extracted by using RNAiso Plus (TaKaRa, NanJing, China, Code NO. 9108), the concentration and purity were checked with a nucleic acid concentration analyzer and agarose gel electrophoresis. The obtained RNA was reverse transcribed to complementary DNA (cDNA) using a reverse transcription kit (Vazyme, NanJing, China, R323). For RT-qPCR, each reaction had a total volume of 20 µL, consisting of 6 µL RNA-free water, 8 µL of AceQqPCR SYBR Green Master Mix (Vazyme, NanJing, China, Q111), 1 µL forward primers, 1 µL reverse primers, and 2 µL diluted cDNA. Three technical replications were performed per sample. The cycling of qPCR validation was 95 ℃ for 5 min, followed by 40 cycles of 95 ℃ for 10 s, 60 ℃ for 30 s, and 60 ℃ for 60 s. The qRT-PCR assay was conducted at least three times under identical conditions. ZmActin1 and ZmGAPDH were used as internal controls, and primers were designed with oligo 7.0 (http://www.oligo.net/downloads.html accessed on 27 May 2022). The primers used for qRT-PCR are listed in Supplementary Table S3. The products lengths for qRT-PCR are listed in Supplementary Table S4. The relative expression levels of these genes were calculated by the 2−ΔΔCt method and were displayed by GraphPrism [67].

4.9. Subcellular Localization Analysis

The coding region without terminator of ZmSAP8 was cloned and fused to the subcellular localization vector pCAMBIA1305 (Abcam, ShangHai, China, ab275766) with green fluorescent protein (GFP) tags driven by the CaMV35S promoter. The pCAMBIA1305-ZmSAP8 vector was obtained through the homologous recombination method by the ClonExpress MultiS One Step Cloning Kit (Vazyme, Najing, C113-01/02). Primers are listed in Table S2. For transient expression experiments, the recombinant plasmid pCAMBIA1305-ZmSAP8 was transformed into N. benthamiana epidermal cells by Agrobacterium tumefaciformis infection. The transformation was accomplished by injecting a syringe into the back of the N. benthamiana leaf [68]. Additionally, maize protoplasts were prepared and released from the leaf of 13-day-old maize B73 etiolated seedlings [69,70]. Then, by the PEG-mediated transformation method [70], the plasmid pCAMBIA1305 construct harboring 35S::ZmSAP8-GFP fusion proteins was transformed to maize protoplasts. While the pCAMBIA1305 vector was transformed as control, nuclei were stained using DAPI (1 µg/mL) staining solution [71]. The fluorescence signals were observed by a confocal laser scanning microscope (Zeiss LSM 800, Jena, Germany) after incubation in darkness at 22 °C for 16 h. Microscopy images were acquired with a confocal microscope with a ×20 objective and analyzed by using the ZEN 3.1 software (https://www.zeiss.com.cn/microscopy/products/microscope-software/zen.html accessed on 18 September 2022). The GFP and DAPI were detected at excitation of 488 nm and 461 nm.

4.10. Transcriptional Activation Assay

The corresponding vectors were transformed into yeast strains. Full-length ZmSAP8 was cloned and ligated into the pGBKT7 vector (TaKaRa, Nanjing, China, Cat. No. 630489). Synthetic plasmids expressing each protein were transformed. The interaction of pGBKT7-53 with pGADT7-T (TaKaRa, Cat. No. 630442) was used as a positive control. Transcriptional activation was analyzed according to methods described in the literature [72]. Transformed cells were cultured on SD/-Trp and SD/-Trp/-His/-Ade plates. After 3–5 days of incubation at 30 °C, recombinant colonies were visualized.

4.11. Creation of ZmSAP8 Transgenic Arabidopsis

The CDS sequence of ZmSAP8 was cloned. The product was cloned into the pMD18-T simple vector (TAKARA, Shanghai, China, Code No. 6011) and sequenced, and then subcloned into the pCAMBIA1301a (Abcam, Shanghai, China, ab275753) vector under the control of the CAMV35S promoter. The construct was introduced into A. tumefaciens strain LBA4404 by electroporation [73]. The shock voltage was chosen to be 1800 V and the experiments were repeated three times. Cauliflower Mosaic virus (CaMV) 35S promoter was used during Arabidopsis transformation. They were then transferred into Arabidopsis plants (Col-0) by floral immersion [74]. The T3 homozygous lines were chosen from independent T2 generations according to previous reports [75]. Briefly, T0 seeds with hygromycin resistance were planted by selfing to obtain independent T1 seeds. The T1 seeds with hygromycin resistance were grown for seeds. The seeds will be the T2 generation and hemizygous for the insert. After selfing, 100 seeds of at least six independent T2 generations were put on selection plates and the plates with a 3:1 ratio of resistant plants were selected. About 20 resistant plants of each line were grown to obtain seeds for T3 generation. Finally, 100 seeds for T3 generation were put on Murashige-Skoog (MS) (SIGMA, St Louis, LA, USA, M5519-50L) plates with hygromycin selection. If a plate was 100% resistant, this would be regarded as a homozygous plant. We obtained three homozygous transgenic lines (L1, L2, and L3). Using the same method, a homozygous T3 line (1301) transformed with an empty vector pCAMBIA1301a (Abcam, Shanghai, China, ab275753) was also generated as a transgenic control.

4.12. Statistical Analysis

Data analysis was conducted using GraphPrism software (graphpad-prism.cn). and significant differences were determined by Student’s t-test at significance levels of p < 0.01 (**), p < 0.05 (*), and p < 0.001 (***).

4.13. Germination Assay

For the germination test, plants of different transgenic lines and the WT were grown under the same conditions, and seeds were collected at the same time. Seeds were put on plates containing MS medium with gradient concentrations (0 mM/L, 100 mM/L, 200 mM/L, 300 mM/L) D-mannitol solution. Every plate contained 80 seeds of transgenic (L1-L2-L3), 1301, and WT plants, respectively. The plates were grown in a greenhouse with 22 ± 1 °C, 16 h light/8 h dark long day condition, a light intensity of 100 µmol (photons) · m−2· s−1, and 60% relative humidity at Anhui Agricultural University, China. After 7 days, the germination percentage was observed and calculated. If obvious emergence of the radicle through the seed coat, the seed was defined as germinated.

4.14. Root Length Assay

For the germination test, plants of different transgenic lines and the WT were grown under the same conditions, and seeds were collected at the same time. Seeds were put on plates containing MS medium with gradient concentrations (0 mM/L, 100 mM/L, 200 mM/L, 300 Mm/L) D-manitol solution. The plates were grown in a greenhouse with 22 ± 1 °C, 16 h light/8 h dark long day condition, a light intensity of 100 µmol (photons) · m−2· s−1, and 60% relative humidity at Anhui Agricultural University, China. After 10 days, the root length of each Arabidopsis line was photographed by a camera. Image J software (https://imagej.net/software/imagej accessed on 28 june 2022) was used to collect the root length data [73], and GraphPrism software (graphpad-prism.cn accessed on 14 September 2022) was used for data processing and presentation.

5. Conclusions

In total, 415 SAPs were identified from all the identified species, and nine SAPs were identified from the maize genome. Gene duplication mode analysis showed that WGD events were the main cause of SAP gene family expansion, while purification selection mainly affected SAPs. Based on phylogenetic analysis, domain analysis and sequence characteristics exploration, SAPs were divided into five clades (clades I to V). Moreover, most ZmSAPs were intron less and contained multiple stress-responsive cis-elements in their promoter region. The expression profile data showed that ZmSAPs had various expression patterns in different organs and different developmental tissues. The ZmSAP8 was transcriptionally induced under PEG, NaCl, and ABA treatments. Meanwhile, ZmSAP8 was the only AN1-AN1-C2H2-C2H2 type SAP in maize. The subcellular localization showed that ZmSAP8 was localized in the nucleus. Transcriptional activity analysis showed that ZmSAP8 had no transcriptional activity. The Arabidopsis transgenic plants overexpressing ZmSAP8 increased plant tolerance to drought stress. Our results provide insights into the evolutionary history of SAPs in maize and other plant species, provide preliminary insights into their functions in maize, and provide a basis for studying their molecular mechanisms.

Supplementary Materials

The following supporting information can be downloaded at: https://www.mdpi.com/article/10.3390/ijms232214109/s1.

Author Contributions

Investigation, A.S., J.Z., and Q.Q.; data curation, A.S., B.Y., Y.C., and C.L.; funding acquisition, W.S.; writing—original draft, A.S. and J.T.; writing—review and editing, A.S., S.W., and W.S. All authors have read and agreed to the published version of the manuscript.

Funding

This research was funded by the National Natural Science Foundation of China, grant number 32001499 and the Natural Science Foundation of Anhui Province, grant number 1908085QC106.

Institutional Review Board Statement

The study did not require ethical approval.

Informed Consent Statement

Not applicable.

Data Availability Statement

All data are displayed in the manuscript.

Conflicts of Interest

The authors declare no conflict of interest.

References

  1. Bai, L.W.D.; Liu, J.; Dai, L.F.; Deng, Q.W.; Chen, Y.L.; Xie, J.K.; Luo, X.D. Identification and characterisation of cold stress-related proteins in Oryza rufipogon at the seedling stage using label-free quantitative proteomic analysis. Funct. Plant Biol. 2021, 48, 542–555. [Google Scholar] [CrossRef] [PubMed]
  2. Priya, M.; Dhanker, O.P.; Siddique, K.H.M.; HanumanthaRao, B.; Nair, R.M.; Pandey, S.; Singh, S.; Varshney, R.K.; Prasad, P.V.V.; Nayyar, H. Drought and heat stress-related proteins: An update about their functional relevance in imparting stress tolerance in agricultural crops. Theor. Appl. Genet. 2019, 132, 1607–1638. [Google Scholar] [CrossRef] [PubMed]
  3. Dietz, K.J.; Zorb, C.; Geilfus, C.M. Drought and crop yield. Plant Biol. 2021, 23, 881–893. [Google Scholar] [CrossRef] [PubMed]
  4. Wang, K.; Ding, Y.F.; Cai, C.; Chen, Z.X.; Zhu, C. The role of C2H2 zinc finger proteins in plant responses to abiotic stresses. Physiol. Plant. 2019, 165, 690–700. [Google Scholar] [CrossRef] [PubMed]
  5. Gimeno-Gilles, C.; Gervais, M.L.; Planchet, E.; Satour, P.; Limami, A.M.; Lelievre, E. A stress-associated protein containing A20/AN1 zing-finger domains expressed in Medicago truncatula seeds. Plant Physiol. Biochem. 2011, 49, 303–310. [Google Scholar] [CrossRef] [PubMed]
  6. Li, J.B.; Sun, P.; Xia, Y.X.; Zheng, G.S.; Sun, J.S.; Jia, H.X. A Stress-Associated Protein, PtSAP13, From Populus trichocarpa Provides Tolerance to Salt Stress. Int. J. Mol. Sci. 2019, 20, 5782. [Google Scholar] [CrossRef] [Green Version]
  7. Dong, Q.L.; Duan, D.Y.; Zhao, S.; Xu, B.Y.; Luo, J.W.; Wang, Q.; Huang, D.; Liu, C.H.; Li, C.; Gong, X.Q.; et al. Genome-Wide Analysis and Cloning of the Apple Stress-Associated Protein Gene Family Reveals MdSAP15, Which Confers Tolerance to Drought and Osmotic Stresses in Transgenic Arabidopsis. Int. J. Mol. Sci. 2018, 19, 2478. [Google Scholar] [CrossRef] [Green Version]
  8. Wang, Z.; Kuang, J.; Han, B.; Chen, S.; Liu, A. Genomic characterization and expression profiles of stress-associated proteins (SAPs) in castor bean (Ricinus communis). Plant Divers. 2021, 43, 152–162. [Google Scholar] [CrossRef]
  9. Lai, W.; Zhou, Y.; Pan, R.; Liao, L.T.; He, J.C.; Liu, H.J.; Yang, Y.G.; Liu, S.Q. Identification and Expression Analysis of Stress-Associated Proteins (SAPs) Containing A20/AN1 Zinc Finger in Cucumber. Plants 2020, 9, 400. [Google Scholar] [CrossRef] [Green Version]
  10. Liu, S.X.; Yuan, X.; Wang, Y.Y.; Wang, H.; Wang, J.L.; Shen, Z.H.; Gao, Y.Z.; Cai, J.T.; Li, D.Y.; Song, F.M. Tomato Stress-Associated Protein 4 Contributes Positively to Immunity Against Necrotrophic Fungus Botrytis cinerea. Mol. Plant Microbe 2019, 32, 566–582. [Google Scholar] [CrossRef]
  11. Vij, S.; Tyagi, A.K. Genome-wide analysis of the stress associated protein (SAP) gene family containing A20/AN1 zinc-finger(s) in rice and their phylogenetic relationship with Arabidopsis. Mol. Genet. Genom. 2006, 276, 565–575. [Google Scholar] [CrossRef] [PubMed]
  12. Tyagi, H.; Jha, S.; Sharma, M.; Giri, P.; Tyagi, A.K. Rice SAPs are responsive to multiple biotic stresses and overexpression of OsSAP1, an A20/AN1 zinc-finger protein, enhances the basal resistance against pathogen infection in tobacco. Plant Sci. 2014, 225, 68–76. [Google Scholar] [CrossRef] [PubMed]
  13. Wang, F.; Coe, R.A.; Karki, S.; Wanchana, S.; Thakur, V.; Henry, A.; Lin, H.C.; Huang, J.L.; Peng, S.B.; Quick, W.P. Overexpression of OsSAP16 Regulates Photosynthesis and the Expression of a Broad Range of Stress Response Genes in Rice (Oryza sativa L.). PLoS ONE 2016, 11, e0157244. [Google Scholar] [CrossRef] [PubMed] [Green Version]
  14. Li, M.; Zhang, H.; He, D.L.; Damaris, R.N.; Yang, P.F. A stress-associated protein OsSAP8 modulates gibberellic acid biosynthesis by reducing the promotive effect of transcription factor OsbZIP58 on OsKO2. J. Exp. Bot. 2022, 73, 2420–2433. [Google Scholar] [CrossRef]
  15. Giri, J.; Vij, S.; Dansana, P.K.; Tyagi, A.K. Rice A20/AN1 zinc-finger containing stress-associated proteins (SAP1/11) and a receptor-like cytoplasmic kinase (OsRLCK253) interact via A20 zinc-finger and confer abiotic stress tolerance in transgenic Arabidopsis plants. New Phytol. 2011, 191, 721–732. [Google Scholar] [CrossRef]
  16. Kang, M.; Lee, S.; Abdelmageed, H.; Reichert, A.; Lee, H.K.; Fokar, M.; Mysore, K.S.; Allen, R.D. Arabidopsis stress associated protein 9 mediates biotic and abiotic stress responsive ABA signaling via the proteasome pathway. Plant Cell Environ. 2017, 40, 702–716. [Google Scholar] [CrossRef]
  17. Dixit, A.R.; Dhankher, O.P. A Novel Stress-Associated Protein ‘AtSAP10’ from Arabidopsis thaliana Confers Tolerance to Nickel, Manganese, Zinc, and High Temperature Stress. PLoS ONE 2011, 6, e20921. [Google Scholar] [CrossRef] [Green Version]
  18. Stroher, E.; Wang, X.J.; Roloff, N.; Klein, P.; Husemann, A.; Dietz, K.J. Redox-Dependent Regulation of the Stress-Induced Zinc-Finger Protein SAP12 in Arabidopsis thaliana. Mol. Plant 2009, 2, 357–367. [Google Scholar] [CrossRef]
  19. Lloret, A.; Conejero, A.; Leida, C.; Petri, C.; Gil-Munoz, F.; Burgos, L.; Badenes, M.L.; Rios, G. Dual regulation of water retention and cell growth by a stress-associated protein (SAP) gene in Prunus. Sci. Rep. 2017, 7, 332. [Google Scholar] [CrossRef] [Green Version]
  20. Zhao, X.; Wang, R.; Zhang, Y.; Li, Y.; Yue, Y.Z.; Zhou, T.C.; Wang, C. Comprehensive analysis of the stress associated protein (SAP) gene family in Tamarix hispida and the function of ThSAP6 in salt tolerance. Plant Physiol. Biochem. 2021, 165, 1–9. [Google Scholar] [CrossRef]
  21. Charrier, A.; Planchet, E.; Cerveau, D.; Gimeno-Gilles, C.; Verdu, I.; Limami, A.M.; Lelievre, E. Overexpression of a Medicago truncatula stress-associated protein gene (MtSAP1) leads to nitric oxide accumulation and confers osmotic and salt stress tolerance in transgenic tobacco. Planta 2012, 236, 567–577. [Google Scholar] [CrossRef] [PubMed] [Green Version]
  22. Wang, Y.P.; Li, J.P.; Paterson, A.H. MCScanX-transposed: Detecting transposed gene duplications based on multiple colinearity scans. Bioinformatics 2013, 29, 1458–1460. [Google Scholar] [CrossRef] [PubMed] [Green Version]
  23. Lin, D.Z.; Pan, Q.W.; Wang, X.M.; Chen, Y.; Pan, X.B.; Dong, Y.J. Mutation of the rice AN1-type zinc-finger protein gene ASL4 causes chloroplast development defects and seedling lethality. Plant Biol. 2022, 24, 95–103. [Google Scholar] [CrossRef] [PubMed]
  24. Hozain, M.; Abdelmageed, H.; Lee, J.; Kang, M.; Fokar, M.; Allen, R.D.; Holaday, A.S. Expression of AtSAP5 in cotton up-regulates putative stress-responsive genes and improves the tolerance to rapidly developing water deficit and moderate heat stress. J. Plant Physiol. 2012, 169, 1261–1270. [Google Scholar] [CrossRef] [PubMed]
  25. Han, G.L.; Lu, C.X.; Guo, J.R.; Qiao, Z.Q.; Sui, N.; Qiu, N.W.; Wang, B.S. C2H2 Zinc Finger Proteins: Master Regulators of Abiotic Stress Responses in Plants. Front. Plant Sci. 2020, 11, 115. [Google Scholar] [CrossRef] [Green Version]
  26. Liu, Y.H.; Khan, A.R.; Gan, Y.B. C2H2 Zinc Finger Proteins Response to Abiotic Stress in Plants. Int. J. Mol. Sci. 2022, 23, 2730. [Google Scholar] [CrossRef]
  27. Lescot, M.; Dehais, P.; Thijs, G.; Marchal, K.; Moreau, Y.; Van de Peer, Y.; Rouze, P.; Rombauts, S. PlantCARE, a database of plant cis-acting regulatory elements and a portal to tools for in silico analysis of promoter sequences. Nucleic Acids Res. 2002, 30, 325–327. [Google Scholar] [CrossRef]
  28. Nakashima, K.; Yamaguchi-Shinozaki, K. ABA signaling in stress-response and seed development. Plant Cell Rep. 2013, 32, 959–970. [Google Scholar] [CrossRef]
  29. Yu, X.X.; Zhang, W.; Zhang, Y.; Zhang, X.; Lang, D.; Zhang, X.H. The roles of methyl jasmonate to stress in plants. Funct. Plant Biol. 2019, 46, 197–212. [Google Scholar] [CrossRef]
  30. Li, Z.Q.; Zhang, J.L.; Li, J.X.; Li, H.J.; Zhang, G.F. The Functional and Regulatory Mechanisms of the Thellungiella salsuginea Ascorbate Peroxidase 6 (TsAPX6) in Response to Salinity and Water Deficit Stresses. PLoS ONE 2016, 11, e0154042. [Google Scholar] [CrossRef]
  31. Wu, C.H.; Zheng, C.Y.; Ji, G.S.; Jiang, P. Synergistic effects of HSE and LTR elements from hsp70 gene promoter of Ulva prolifera (Ulvophyceae, Chlorophyta) upon temperature induction. J. Phycol. 2019, 55, 738–743. [Google Scholar] [CrossRef] [PubMed]
  32. Wang, N.; Liu, Y.D.; Cai, Y.Y.; Tang, J.J.; Li, Y.; Gai, J.Y. The soybean U-box gene GmPUB6 regulates drought tolerance in Arabidopsis thaliana. Plant Physiol. Biochem. 2020, 155, 284–296. [Google Scholar] [CrossRef] [PubMed]
  33. Soboleva, A.; Frolova, N.; Bureiko, K.; Shumilina, J.; Balcke, G.U.; Zhukov, V.A.; Tikhonovich, I.A.; Frolov, A. Dynamics of Reactive Carbonyl Species in Pea Root Nodules in Response to Polyethylene Glycol (PEG)-Induced Osmotic Stress. Int. J. Mol. Sci. 2022, 23, 2726. [Google Scholar] [CrossRef] [PubMed]
  34. Chou, K.C.; Shen, H.B. Cell-PLoc: A package of Web servers for predicting subcellular localization of proteins in various organisms. Nat. Protoc. 2008, 3, 153–162. [Google Scholar] [CrossRef]
  35. Verma, H.; Sarma, R.N. Identification of Markers for Root Traits Related to Drought Tolerance Using Traditional Rice Germplasm. Mol. Biotechnol. 2021, 63, 1280–1292. [Google Scholar] [CrossRef]
  36. Evans, P.C.; Ovaa, H.; Hamon, M.; Kilshaw, P.J.; Hamm, S.; Bauer, S.; Ploegh, H.L.; Smith, T.S. Zinc-finger protein A20, a regulator of inflammation and cell survival, has de-ubiquitinating activity. Biochem. J. 2004, 378, 727–734. [Google Scholar] [CrossRef] [Green Version]
  37. Giri, J.; Dansana, P.K.; Kothari, K.S.; Sharma, G.; Vij, S.; Tyagi, A.K. SAPs as novel regulators of abiotic stress response in plants. Bioessays 2013, 35, 639–648. [Google Scholar] [CrossRef]
  38. Ben Saad, R.; Ben Hsouna, A.; Saibi, W.; Ben Hamed, K.; Brini, F.; Ghneim-Herrera, T. A stress-associated protein, LmSAP, from the halophyte Lobularia maritima provides tolerance to heavy metals in tobacco through increased ROS scavenging and metal detoxification processes. J. Plant Physiol. 2018, 231, 234–243. [Google Scholar] [CrossRef]
  39. Muthuramalingam, P.; Jeyasri, R.; Selvaraj, A.; Kalaiyarasi, D.; Aruni, W.; Pandian, S.T.K.; Ramesh, M. Global transcriptome analysis of novel stress associated protein (SAP) genes expression dynamism of combined abiotic stresses in Oryza sativa (L.). J. Biomol. Struct. Dyn. 2021, 39, 2106–2117. [Google Scholar] [CrossRef]
  40. Soltis, P.S.; Soltis, D.E. Ancient WGD events as drivers of key innovations in angiosperms. Curr. Opin. Plant Biol. 2016, 30, 159–165. [Google Scholar] [CrossRef]
  41. Schranz, M.E.; Mohammadin, S.; Edger, P.P. Ancient whole genome duplications, novelty and diversification: The WGD Radiation Lag-Time Model. Curr. Opin. Plant Biol. 2012, 15, 147–153. [Google Scholar] [CrossRef] [PubMed]
  42. Ezoe, A.; Shirai, K.; Hanada, K. Degree of Functional Divergence in Duplicates Is Associated with Distinct Roles in Plant Evolution. Mol. Biol. Evol. 2021, 38, 1447–1459. [Google Scholar] [CrossRef] [PubMed]
  43. Qiao, X.; Li, Q.H.; Yin, H.; Qi, K.J.; Li, L.T.; Wang, R.Z.; Zhang, S.L.; Paterson, A.H. Gene duplication and evolution in recurring polyploidization-diploidization cycles in plants. Genome Biol. 2019, 20, 38. [Google Scholar] [CrossRef] [PubMed] [Green Version]
  44. Zhao, Y.J.; Qin, Q.Q.; Chen, L.; Long, Y.; Song, N.N.; Jiang, H.Y.; Si, W.N. Characterization and phylogenetic analysis of multiple C2 domain and transmembrane region proteins in maize. Bmc Plant Biol. 2022, 22, 388. [Google Scholar] [CrossRef] [PubMed]
  45. Pophaly, S.D.; Tellier, A. Population Level Purifying Selection and Gene Expression Shape Subgenome Evolution in Maize. Mol. Biol. Evol. 2015, 32, 3226–3235. [Google Scholar] [CrossRef] [Green Version]
  46. Li, J.L.; Han, G.L.; Sun, C.F.; Sui, N. Research advances of MYB transcription factors in plant stress resistance and breeding. Plant Signal. Behav. 2019, 14, 1613131. [Google Scholar] [CrossRef]
  47. Sheshadri, S.A.; Nishanth, M.J.; Simon, B. Stress-Mediated cis-Element Transcription Factor Interactions Interconnecting Primary and Specialized Metabolism in planta. Front. Plant Sci. 2016, 7, 1725. [Google Scholar] [CrossRef] [Green Version]
  48. Wang, T.; Guo, J.; Peng, Y.Q.; Lyu, X.G.; Liu, B.; Sun, S.Y.; Wang, X.L. Light-induced mobile factors from shoots regulate rhizobium-triggered soybean root nodulation. Science 2021, 374, 65–71. [Google Scholar] [CrossRef]
  49. Lin, P.; Dong, T.; Chen, W.L.; Zou, N.X.; Chen, Y.L.; Li, Y.Q.; Chen, K.L.; Wang, M.Y.; Liu, J.F. Expression Analysis of MaTGA8 Transcription Factor in Banana and Its Defence Functional Analysis by Overexpression in Arabidopsis. Int. J. Mol. Sci. 2021, 22, 9344. [Google Scholar] [CrossRef]
  50. Kumar, K.; Gambhir, G.; Dass, A.; Tripathi, A.K.; Singh, A.; Jha, A.K.; Yadava, P.; Choudhary, M.; Rakshit, S. Genetically modified crops: Current status and future prospects. Planta 2020, 251, 91. [Google Scholar] [CrossRef]
  51. Goodstein, D.M.; Shu, S.Q.; Howson, R.; Neupane, R.; Hayes, R.D.; Fazo, J.; Mitros, T.; Dirks, W.; Hellsten, U.; Putnam, N.; et al. Phytozome: A comparative platform for green plant genomics. Nucleic Acids Res. 2012, 40, D1178–D1186. [Google Scholar] [CrossRef] [PubMed]
  52. Portwood, J.L.; Woodhouse, M.R.; Cannon, E.K.; Gardiner, J.M.; Harper, L.C.; Schaeffer, M.L.; Walsh, J.R.; Sen, T.Z.; Cho, K.T.; Schott, D.A.; et al. MaizeGDB 2018: The maize multi-genome genetics and genomics database. Nucleic Acids Res. 2019, 47, D1146–D1154. [Google Scholar] [CrossRef] [PubMed] [Green Version]
  53. Guan, R.; Zhao, Y.P.; Zhang, H.; Fan, G.Y.; Liu, X.; Zhou, W.B.; Shi, C.C.; Wang, J.H.; Liu, W.Q.; Liang, X.M.; et al. Draft genome of the living fossil Ginkgo biloba. Gigascience 2016, 5, 49. [Google Scholar] [CrossRef] [PubMed] [Green Version]
  54. Howe, K.L.; Achuthan, P.; Allen, J.; Allen, J.; Alvarez-Jarreta, J.; Amode, M.R.; Armean, I.M.; Azov, A.G.; Bennett, R.; Bhai, J.; et al. Ensembl 2021. Nucleic Acids Res. 2021, 49, D884–D891. [Google Scholar] [CrossRef]
  55. Potter, S.C.; Luciani, A.; Eddy, S.R.; Park, Y.; Lopez, R.; Finn, R.D. HMMER web server: 2018 update. Nucleic Acids Res. 2018, 46, W200–W204. [Google Scholar] [CrossRef] [Green Version]
  56. Yau, S.S.T.; Mao, W.G.; Benson, M.; He, R.L. Distinguishing Proteins From Arbitrary Amino Acid Sequences. Sci. Rep.-Uk 2015, 5, 7972. [Google Scholar] [CrossRef] [Green Version]
  57. Chen, C.J.; Chen, H.; Zhang, Y.; Thomas, H.R.; Frank, M.H.; He, Y.H.; Xia, R. TBtools: An Integrative Toolkit Developed for Interactive Analyses of Big Biological Data. Mol. Plant 2020, 13, 1194–1202. [Google Scholar] [CrossRef]
  58. Wang, Y.P.; Tang, H.B.; DeBarry, J.D.; Tan, X.; Li, J.P.; Wang, X.Y.; Lee, T.H.; Jin, H.Z.; Marler, B.; Guo, H.; et al. MCScanX: A toolkit for detection and evolutionary analysis of gene synteny and collinearity. Nucleic Acids Res. 2012, 40, e49. [Google Scholar] [CrossRef] [Green Version]
  59. Suyama, M.; Torrents, D.; Bork, P. PAL2NAL: Robust conversion of protein sequence alignments into the corresponding codon alignments. Nucleic Acids Res. 2006, 34, W609–W612. [Google Scholar] [CrossRef] [Green Version]
  60. Katoh, K.; Rozewicki, J.; Yamada, K.D. MAFFT online service: Multiple sequence alignment, interactive sequence choice and visualization. Brief. Bioinform. 2019, 20, 1160–1166. [Google Scholar] [CrossRef]
  61. Capella-Gutierrez, S.; Silla-Martinez, J.M.; Gabaldon, T. trimAl: A tool for automated alignment trimming in large-scale phylogenetic analyses. Bioinformatics 2009, 25, 1972–1973. [Google Scholar] [CrossRef] [PubMed] [Green Version]
  62. Darriba, D.; Taboada, G.L.; Doallo, R.; Posada, D. ProtTest 3: Fast selection of best-fit models of protein evolution. Bioinformatics 2011, 27, 1164–1165. [Google Scholar] [CrossRef] [PubMed] [Green Version]
  63. Yang, Z.H. PAML 4: Phylogenetic analysis by maximum likelihood. Mol. Biol. Evol. 2007, 24, 1586–1591. [Google Scholar] [CrossRef] [PubMed] [Green Version]
  64. Mello, B. Estimating TimeTrees with MEGA and the TimeTree Resource. Mol. Biol. Evol. 2018, 35, 2334–2342. [Google Scholar] [CrossRef] [PubMed] [Green Version]
  65. Letunic, I.; Bork, P. Interactive Tree Of Life (iTOL) v5: An online tool for phylogenetic tree display and annotation. Nucleic Acids Res. 2021, 49, W293–W296. [Google Scholar] [CrossRef] [PubMed]
  66. Bailey, T.L.; Boden, M.; Buske, F.A.; Frith, M.; Grant, C.E.; Clementi, L.; Ren, J.Y.; Li, W.W.; Noble, W.S. MEME SUITE: Tools for motif discovery and searching. Nucleic Acids Res. 2009, 37, W202–W208. [Google Scholar] [CrossRef]
  67. Mitteer, D.R.; Greer, B.D.; Fisher, W.W.; Cohrs, V.L. Teaching behavior technicians to create publication-quality, single-case design graphs in graphpad prism 7. J. Appl. Behav. Anal. 2018, 51, 998–1010. [Google Scholar] [CrossRef]
  68. Kumari, K.; Rai, M.P.; Bansal, N.; Prashat, G.R.; Kumari, S.; Srivathsa, R.; Dahuja, A.; Sachdev, A.; Praveen, S.; Vinutha, T. Study of subcellular localization of Glycine max γ-tocopherol methyl transferase isoforms in N. benthamiana. 3 Biotech 2020, 10, 110. [Google Scholar] [CrossRef]
  69. Yoo, S.D.; Cho, Y.H.; Sheen, J. Arabidopsis mesophyll protoplasts: A versatile cell system for transient gene expression analysis. Nat. Protoc. 2007, 2, 1565–1572. [Google Scholar] [CrossRef] [Green Version]
  70. Cao, J.; Yao, D.; Lin, F.; Jiang, M. PEG-mediated transient gene expression and silencing system in maize mesophyll protoplasts: A valuable tool for signal transduction study in maize. Acta Physiol. Plant. 2014, 36, 1271–1281. [Google Scholar] [CrossRef]
  71. Chazotte, B. Labeling nuclear DNA using DAPI. Cold Spring Harb. Protoc. 2011, 2011, pdb.prot5556. [Google Scholar] [CrossRef] [PubMed] [Green Version]
  72. Yang, L.A.; Ji, W.; Zhu, Y.M.; Gao, P.; Li, Y.; Cai, H.; Bai, X.; Guo, D.J. GsCBRLK, a calcium/calmodulin-binding receptor-like kinase, is a positive regulator of plant tolerance to salt and ABA stress. J. Exp. Bot. 2010, 61, 2519–2533. [Google Scholar] [CrossRef] [PubMed] [Green Version]
  73. Kumar, P.; Nagarajan, A.; Uchil, P.D. Electroporation. Cold Spring Harb. Protoc. 2019, 2019, pdb.top096271. [Google Scholar] [CrossRef] [PubMed] [Green Version]
  74. Clough, S.J.; Bent, A.F. Floral dip: A simplified method for Agrobacterium-mediated transformation of Arabidopsis thaliana. Plant J. 1998, 16, 735–743. [Google Scholar] [CrossRef] [PubMed] [Green Version]
  75. Harrison, S.J.; Mott, E.K.; Parsley, K.; Aspinall, S.; Gray, J.C.; Cottage, A. A rapid and robust method of identifying transformed Arabidopsis thaliana seedlings following floral dip transformation. Plant Methods 2006, 2, 19. [Google Scholar] [CrossRef]
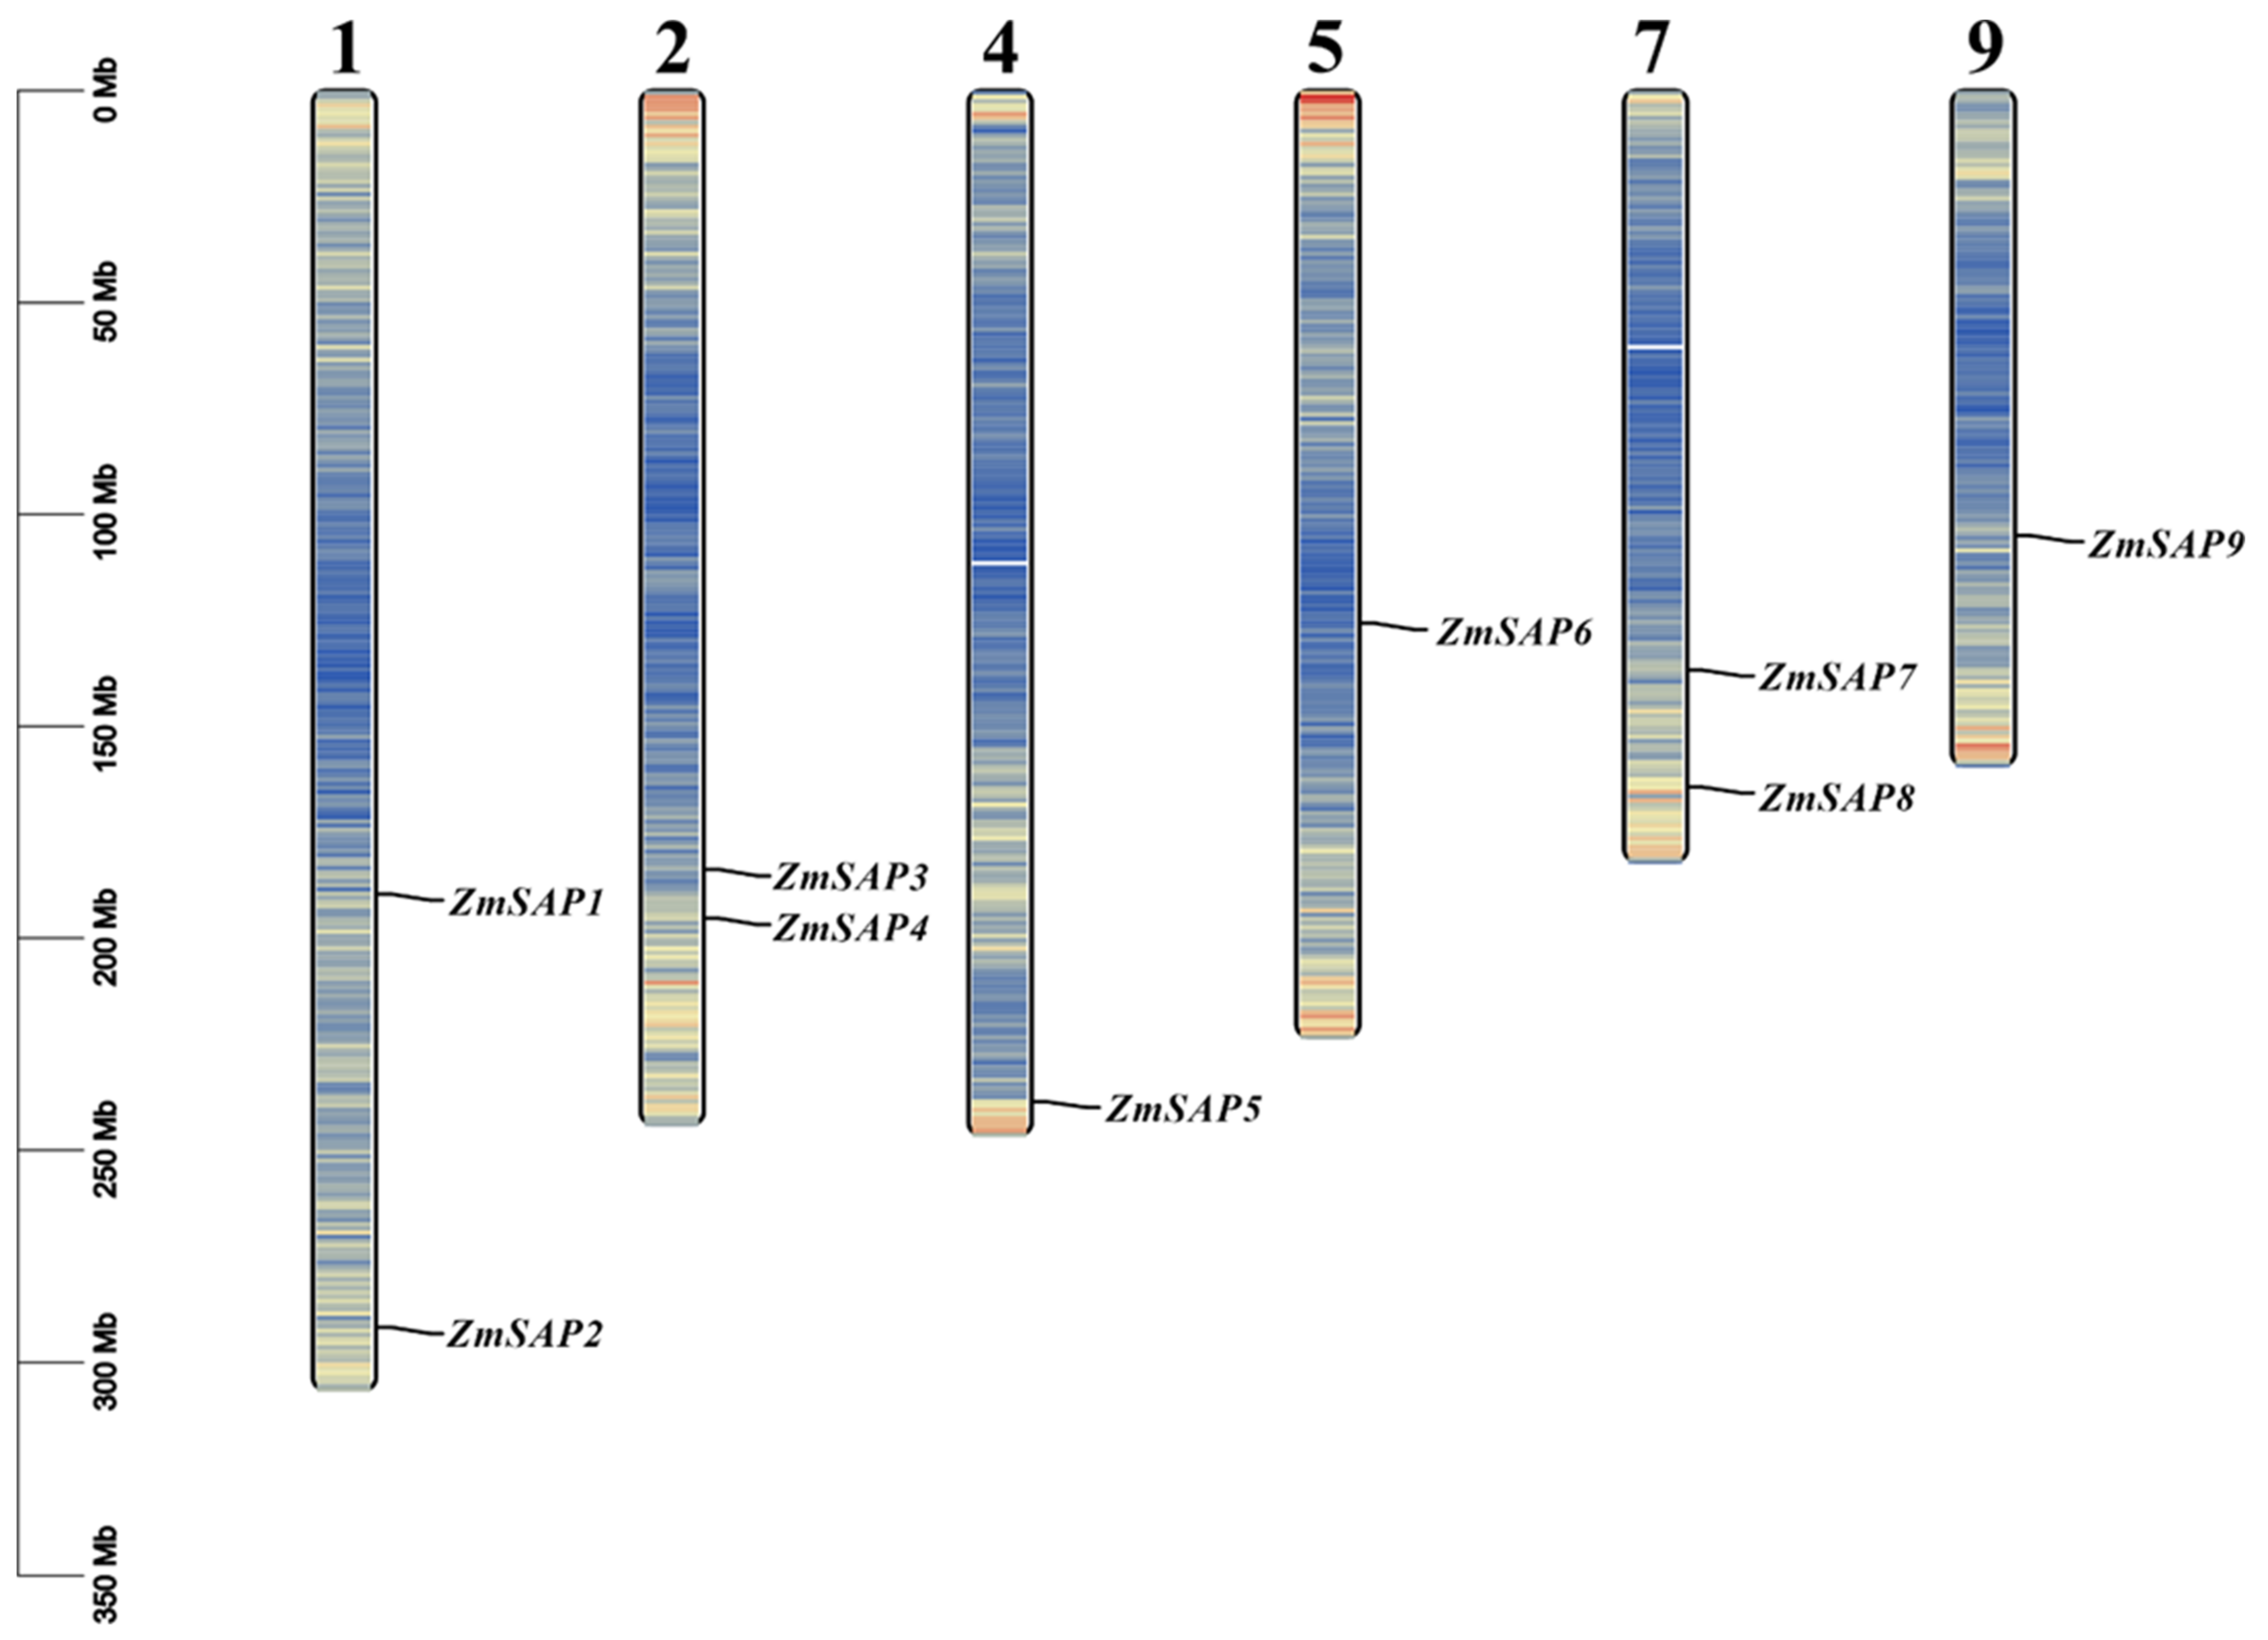
Figure 1. The number and location of SAP genes on maize chromosome, and the gene density on each chromosome, the number of genes from blue to red. Gene density was generated by TBtools. The parameter of bin size was set to 105 bp.
Ijms 23 14109 g001
Figure 2. Taxonomic tree of surveyed species. Total number of genome-widely identified SAPs in each species and the numbers of SAPs involved in different duplication-modes are also listed. Species from different taxonomy and/or species are marked with different colors. “Total” represents total SAP gene numbers in each species. “LD” represents local duplication, including tandem and proximal duplication; “WGD” represents whole-genome/segmental duplication; “singleton” represents genes without paralogous pairs in MCScanX; “others” represents genes other than LD, WGD, and singleton; “-” means duplication mode was not estimated.
Ijms 23 14109 g002
Figure 3. SAP collinearity analysis within the maize genome. Genome-wide collinearity genes are marked with gray lines and ZmSAP pairs of whole genome duplication are marked with red lines.
Ijms 23 14109 g003
Figure 4. Box plot of synonymous to nonsynonymous ratios for WGD and LD duplicated pairs, (A) Ka/Ks values of WGD and LD SAPs gene pairs in all angiosperm plants. (B) Ka/Ks values of LD SAP gene pairs in dicot and monocot plants. (C) Ka/Ks values of WGD SAP gene pairs in dicot and monocot plants.
Ijms 23 14109 g004
Figure 5. The maximum likelihood evolutionary tree was established for the selected SAPs, which contains 29 selected species and 4 outgroup species and their protein domains. Abbreviation of the species name can be found in Table S1. The Figure can be divided into five clades, and different clades are shown in different colors. Red, blue, green, orange, and purple represent clades I to V, respectively, while the topological structures on the domains are also marked, with blue ellipses representing the AN1 domain, red cuboids representing the A20 domain, and green ellipses representing the C2H2 domain.
Ijms 23 14109 g005
Figure 6. Phylogenetic and structural analysis of ZmSAPs members. Blue, red, green, and orange branches represent clade I to V, (A) motif structure of ZmSAPs, (B) protein domain of ZmSAPs, (C) gene structure of ZmSAPs.
Ijms 23 14109 g006
Figure 7. Prediction of cis-elements in the promoter regions of ZmSAPs genes.
Ijms 23 14109 g007
Figure 8. Tissue-specific expression profiles of ZmSAP genes. On the left, blue, red, green, and orange branch represent clade I to V, respectively. Cluster analysis of different tissues is shown at the top of Figure. The values of fragments per kilobase of exon per million fragments mapped (FPKM) were used to represent the expression levels of ZmSAPs in the different tissues. The heat maps were visualized by TBtools software.
Ijms 23 14109 g008
Figure 9. Expression patterns of nine ZmSAP genes with different treatment quantified by qRT-PCR. The relative transcript levels were determined from leaf tissues of maize subjected to (A) PEG: polyethylene glycol, (B) NaCl: salt, (C) ABA: abscisic acid treatment, respectively. The gene names and stress treatments are on the X-axis and relative expression levels on the Y-axis. Relative expression levels of ZmSAP genes were normalized to those of ZmGADPH and ZmActin1 by the 2−ΔΔCt method, and values at 0 h were set to 1.0. Values are presented as the mean ± standard error of values from three independent experiments. Asterisks indicate significant differences compared to the value at 0 h for each gene. (Student’s t-test; * p < 0.05; ** p < 0.01; *** p < 0.001).
Ijms 23 14109 g009
Figure 10. Subcellular localization of ZmSAP8. (A)The leaves of Nicotiana benthamiana were transformed with constructs harboring 35S:ZmSAP8-GFP fusion proteins via agrobacterium-mediated infiltration. The 35S::GFP empty vector was used as a positive control. Scale bar = 20 μm. (B) The protoplasts of maize were transformed with plasmid pCAMBIA1305 construct harboring 35S:ZmSAP8-GFP fusion proteins by PEG-mediated transformation. The 35S:GFP empty vector was used as a positive control. The nuclei in which the GFP signal and DAPI signals really overlapped are indicated with red circles. Scale bar = 10 μm. The nuclei in which the GFP signal and DAPI signals really overlapped are indicated with red circles.
Ijms 23 14109 g010
Figure 11. Transcriptional activity analysis of ZmSAP8, BD-p53 and Ad-SV40 large T-antigen were used as positive controls and pGBKT7 empty vector was used as negative controls.
Ijms 23 14109 g011
Figure 12. Germination assay and root length analysis of ZmSAP8 transgenic Arabidopsis after mannitol treatment. Values are presented as the mean ± standard error of values from three independent experiments. (A) Comparison of germination percentage between transgenic (L1-L2-L3), the transgenic vector-only control (1301), and wild-type (WT) plants. (B) Germination statistics of transgenic (L1-L2-L3), 1301, and WT plants (C) Comparison of root lengths between transgenic (L1-L2-L3), 1301 and WT plants. (D) Root length statistics of transgenic (L1-L2-L3), 1301, and WT plants. Asterisks indicate significant differences compared to the value for WT and 1301 (Student’s t-test; * p < 0.05; ** p < 0.01).
Ijms 23 14109 g012
Table 1. Information of SAP genes in maize.
Gene Namev4 Gene IDChromosomal
Location
Amino Acid LengthMw/Da apI bSAP DomainDuplication Type c
AN1A20
ZmSAP1Zm00001d031423Chr1:189593205-189593937 17618,749.019.1211WGD
ZmSAP2Zm00001d034389Chr1:291685815-29168630016116,678.859.5310/
ZmSAP3Zm00001d005698Chr2:183790605-183791147 18019,399.089.0820/
ZmSAP4Zm00001d006016Chr2:195298613-195299098 16116,782.859.1911WGD
ZmSAP5Zm00001d053671Chr4:238612589-238613017 14215,272.568.810WGD
ZmSAP6Zm00001d015842Chr5:125657037-125657552 17118,291.038.2811WGD
ZmSAP7Zm00001d020926Chr7:136725907-136726398 16317,195.359.4511WGD
ZmSAP8Zm00001d021842Chr7:164334705-16433753629032,038.188.5820/
ZmSAP9Zm00001d046767Chr9:104954887-10496019317418,409.128.4811/
a Molecular weight, b Isoelectronic point, c TD represents transposed duplication, WGD represents whole-genome/segmental duplication.
Publisher’s Note: MDPI stays neutral with regard to jurisdictional claims in published maps and institutional affiliations.