
GSK343, an Inhibitor of Enhancer of Zeste Homolog 2, Reduces Glioblastoma Progression through Inflammatory Process Modulation: Focus on Canonical and Non-Canonical NF-κB/IκBα Pathways

 ,
,  ,
,  , , ,
, , , 
 and
and 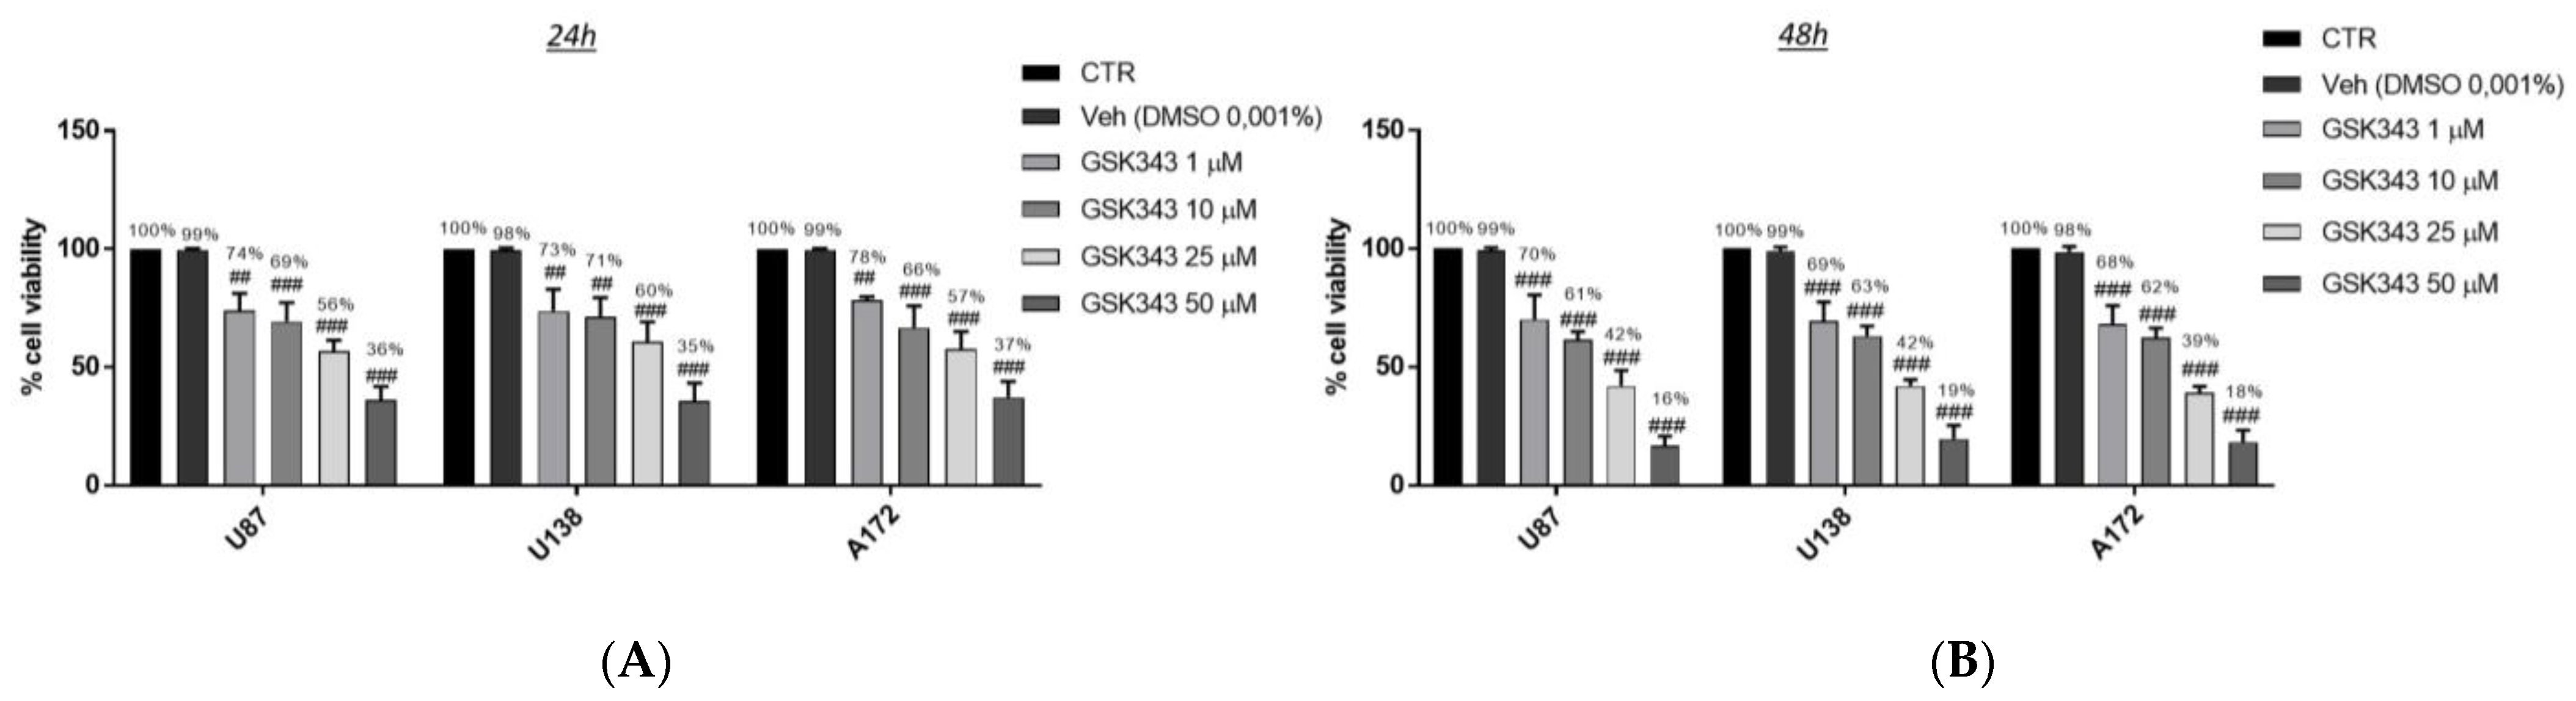
Abstract
1. Introduction
2. Results
2.1. In Vitro Studies
2.1.1. Effect of GSK343 Treatment on GB Cell Viability
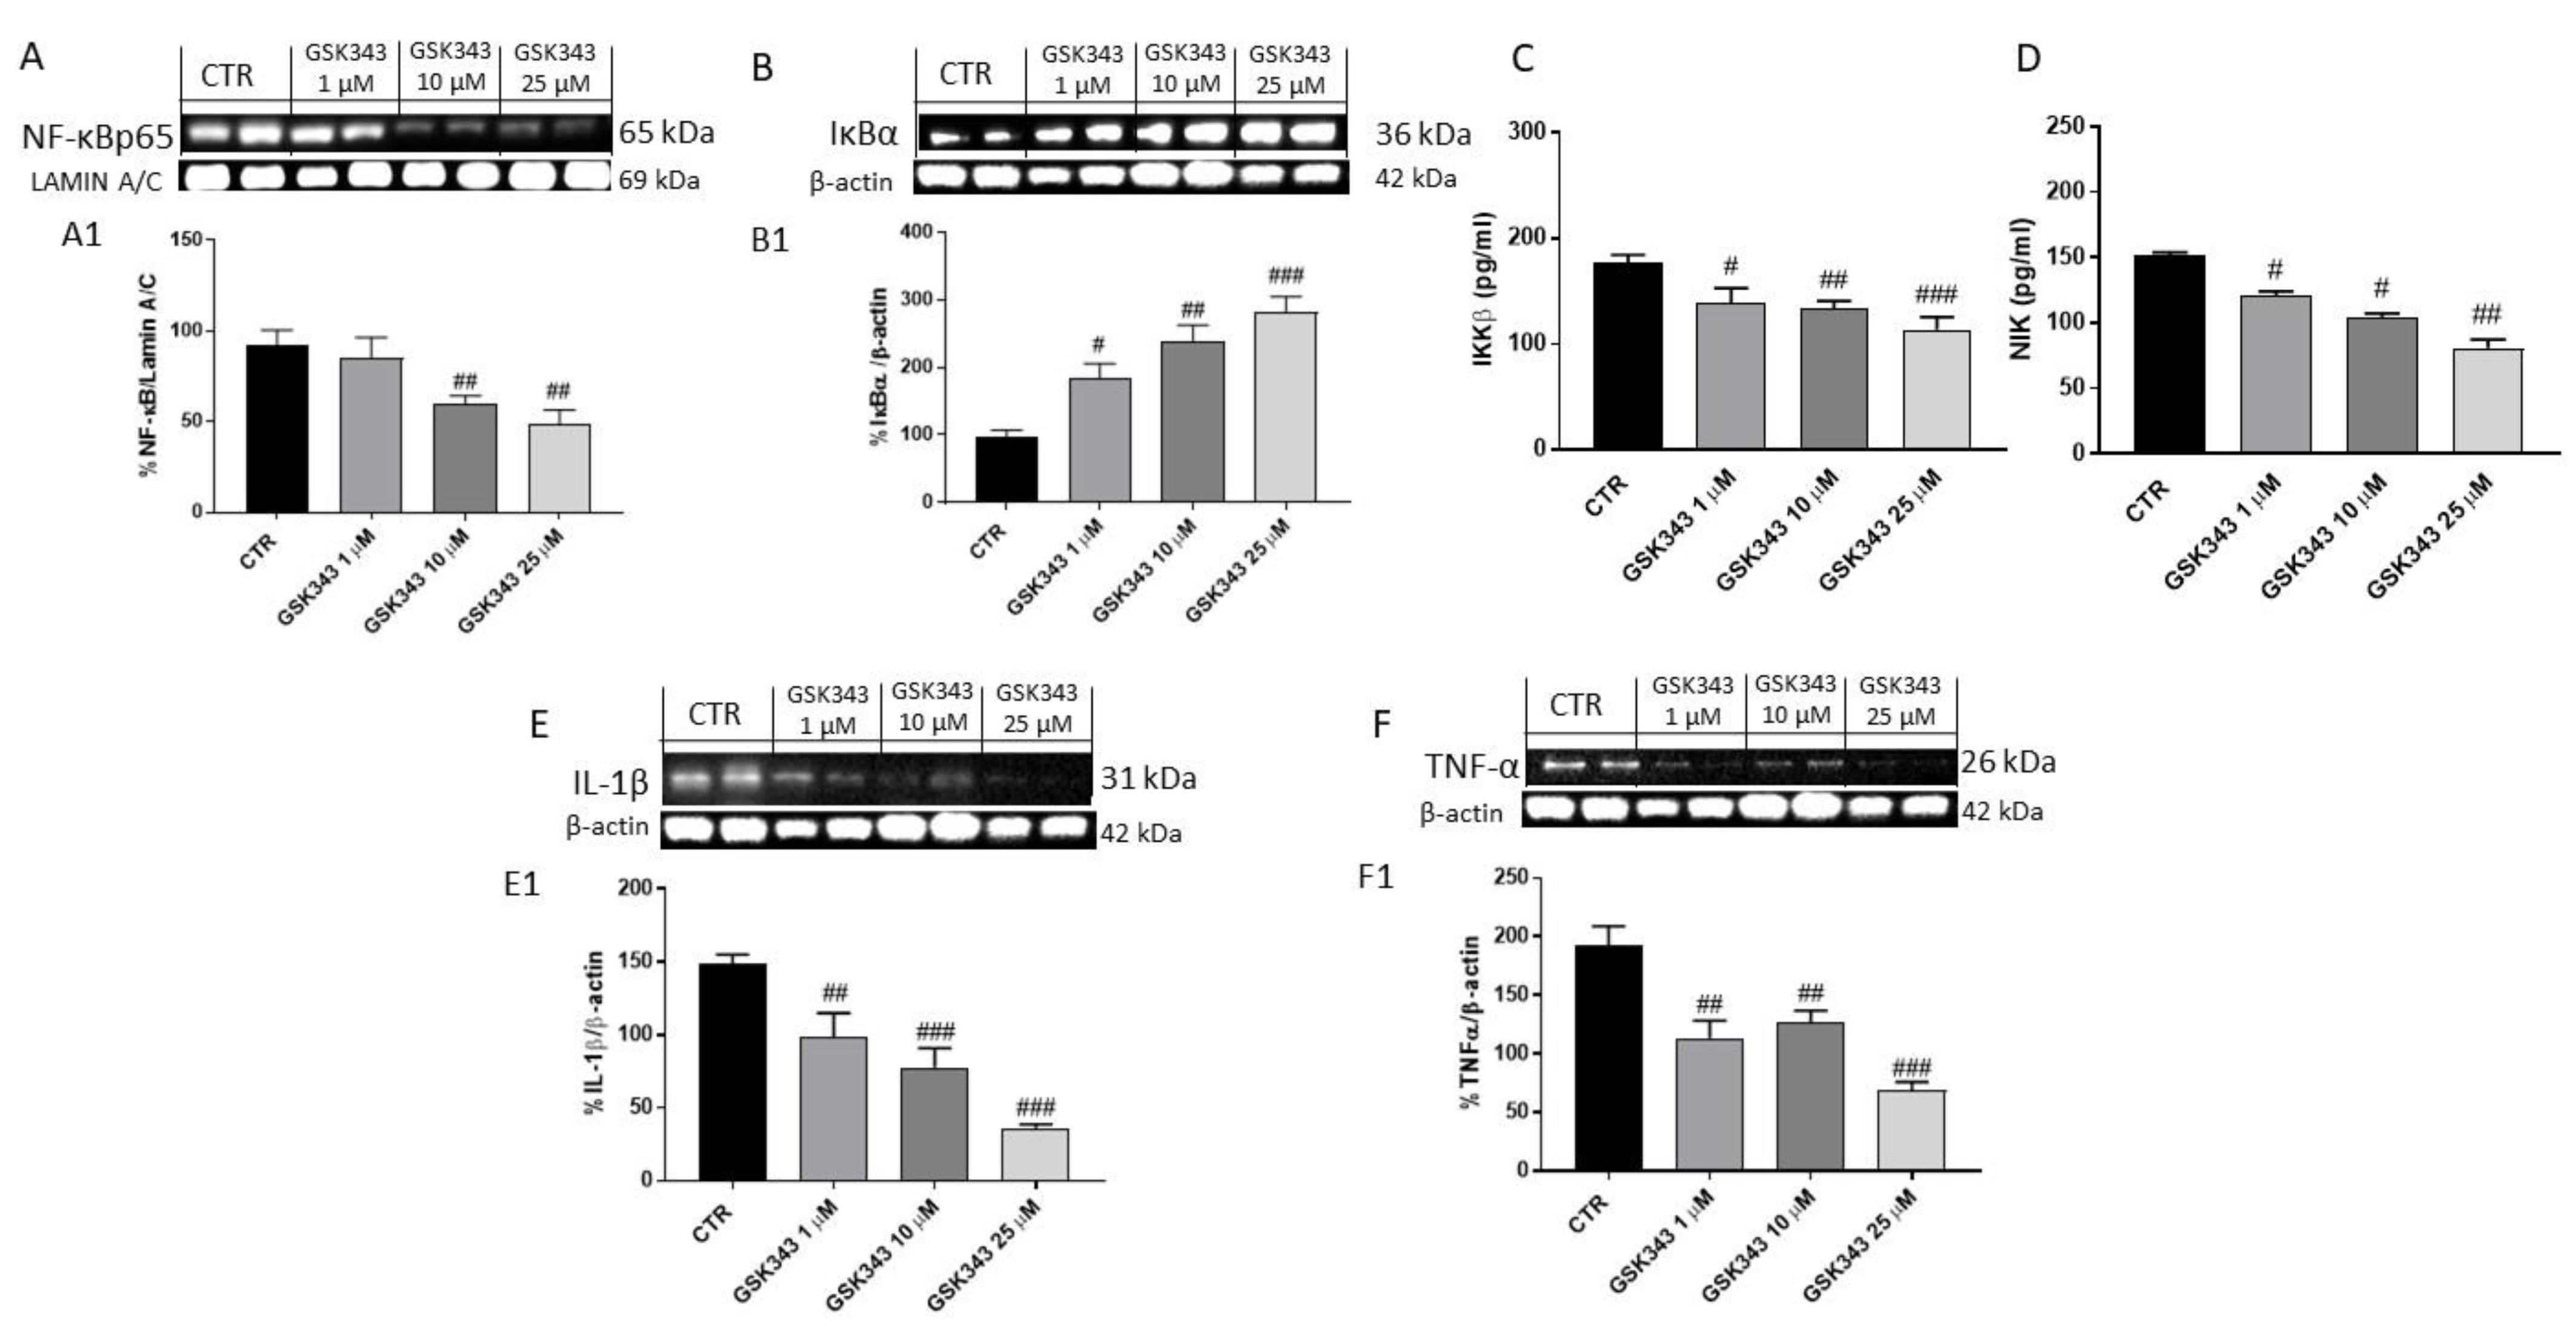
2.1.2. Effect of GSK343 Treatment on Canonical and Non-Canonical NF-κB/IκBα Pathways in U87 Cell Lysates
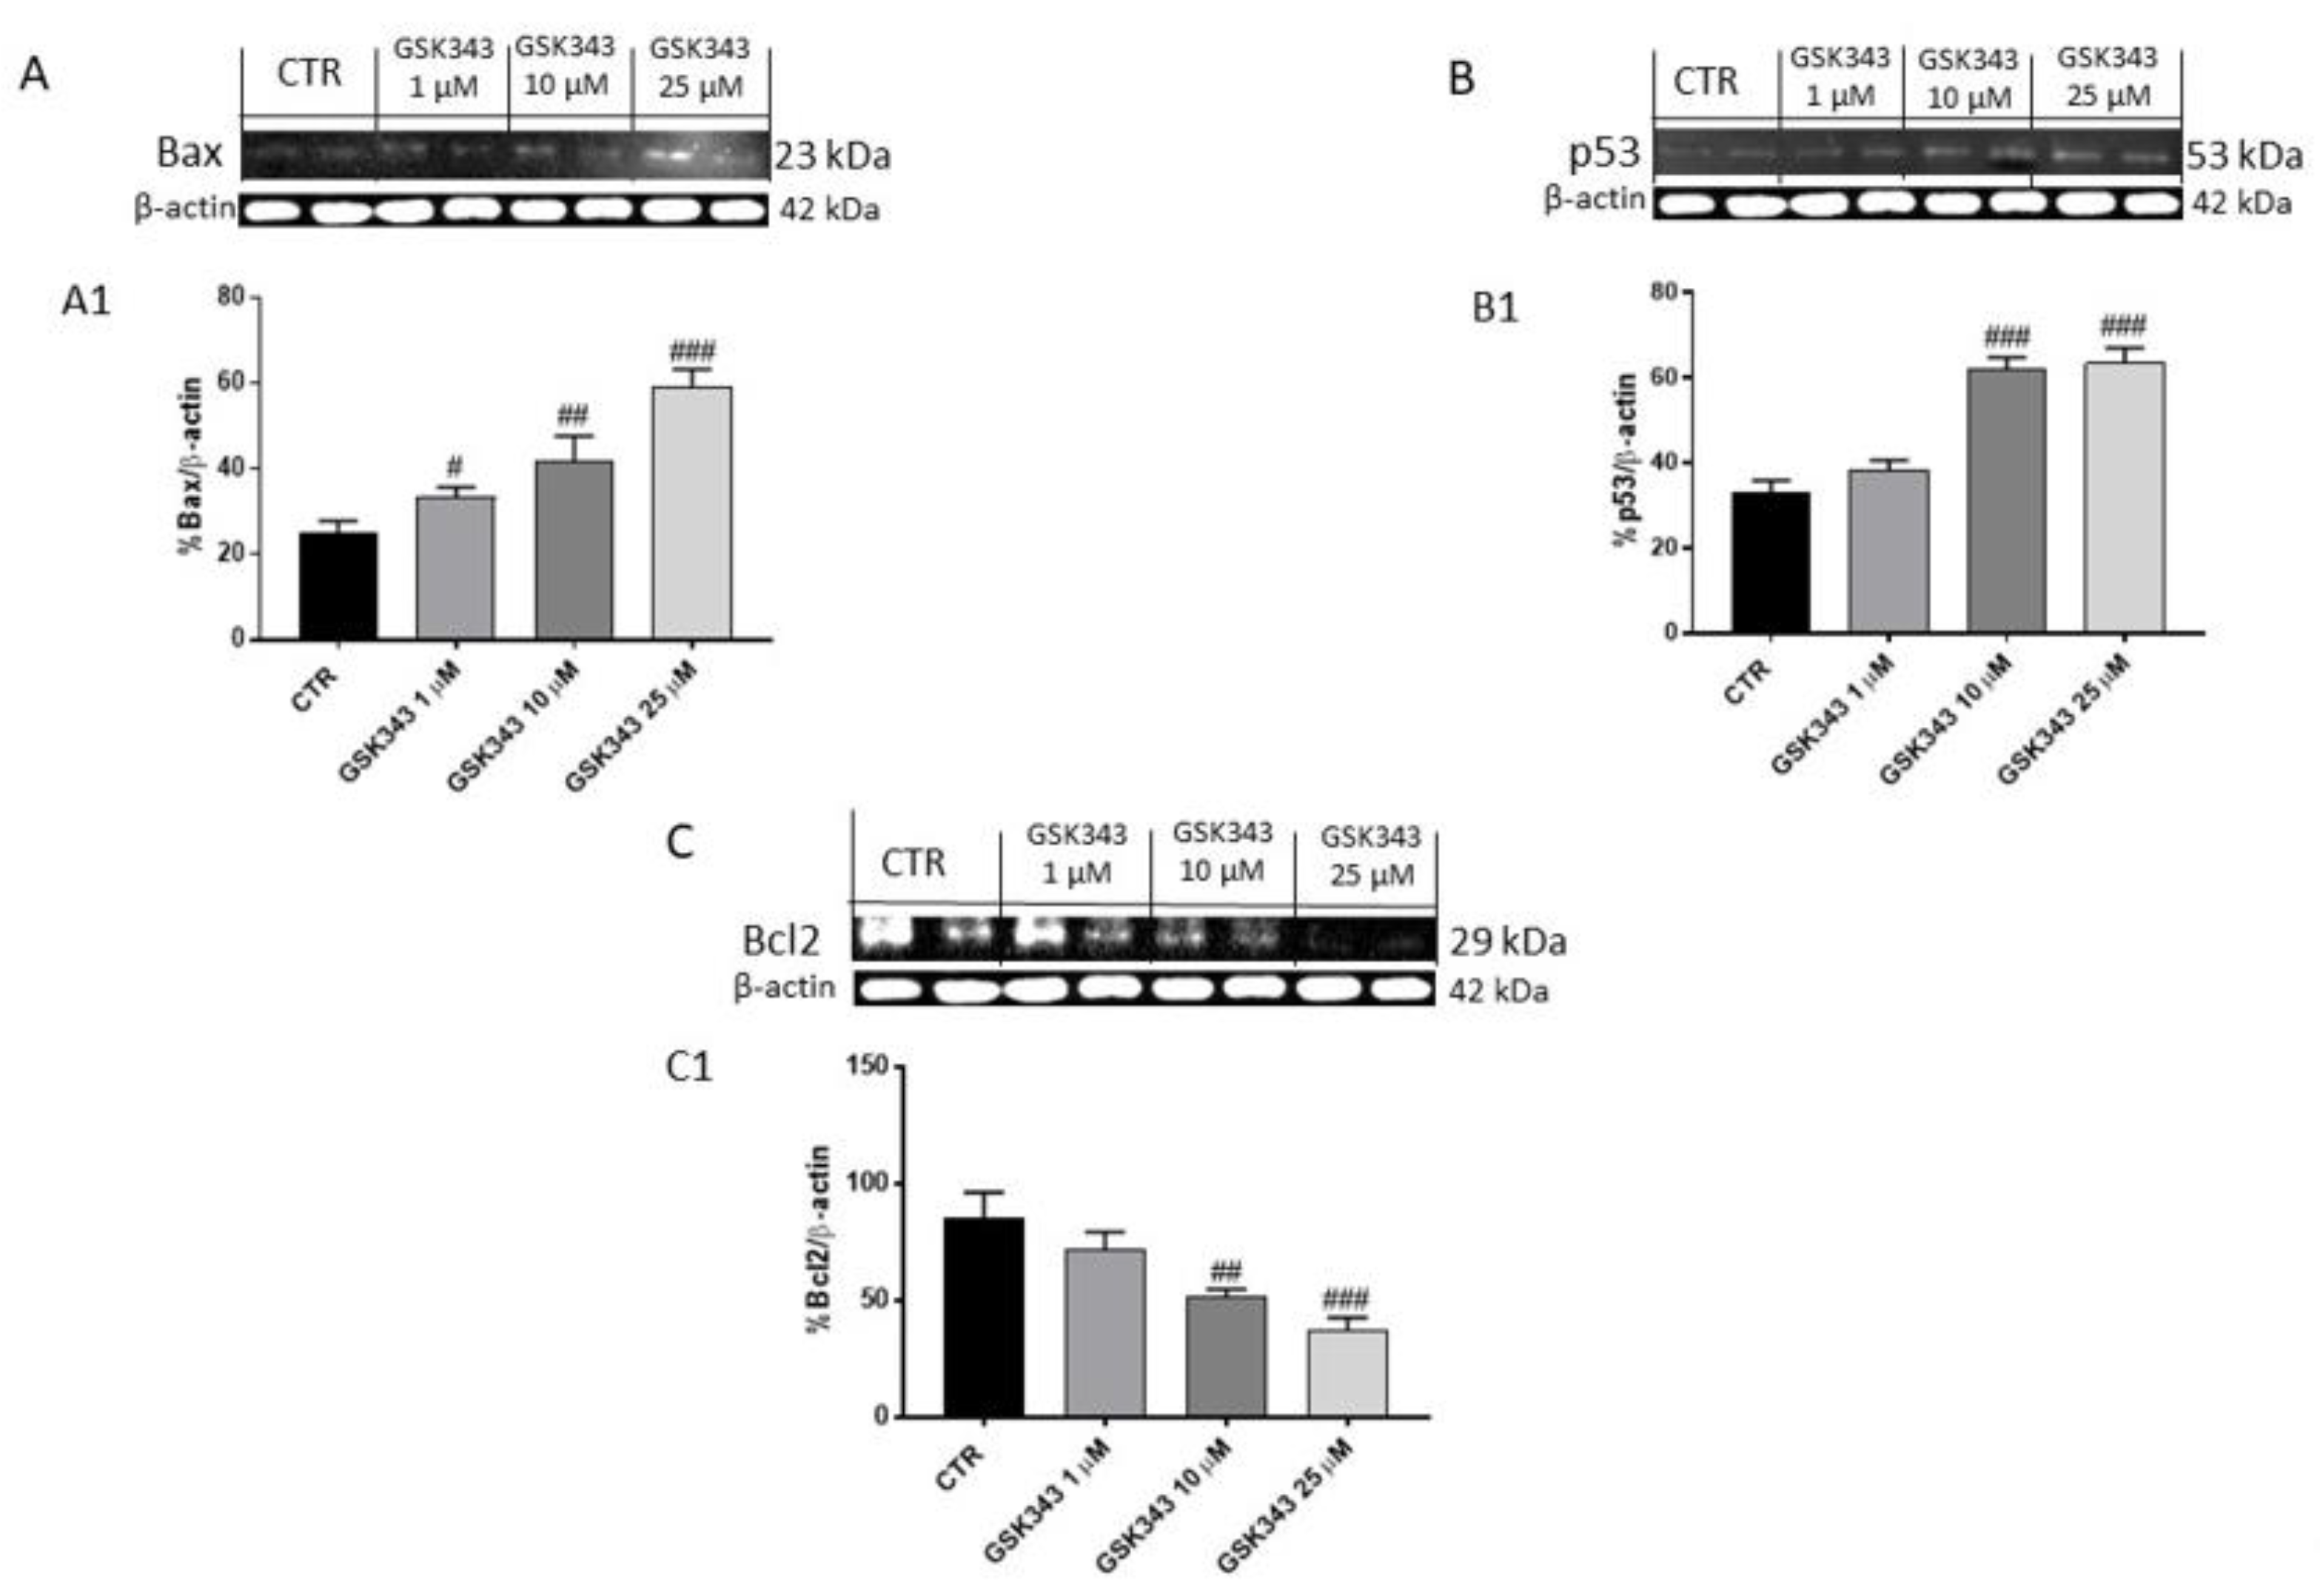
2.1.3. GSK343 Treatment Increased the Apoptotic Process in U87 Cell Lysates
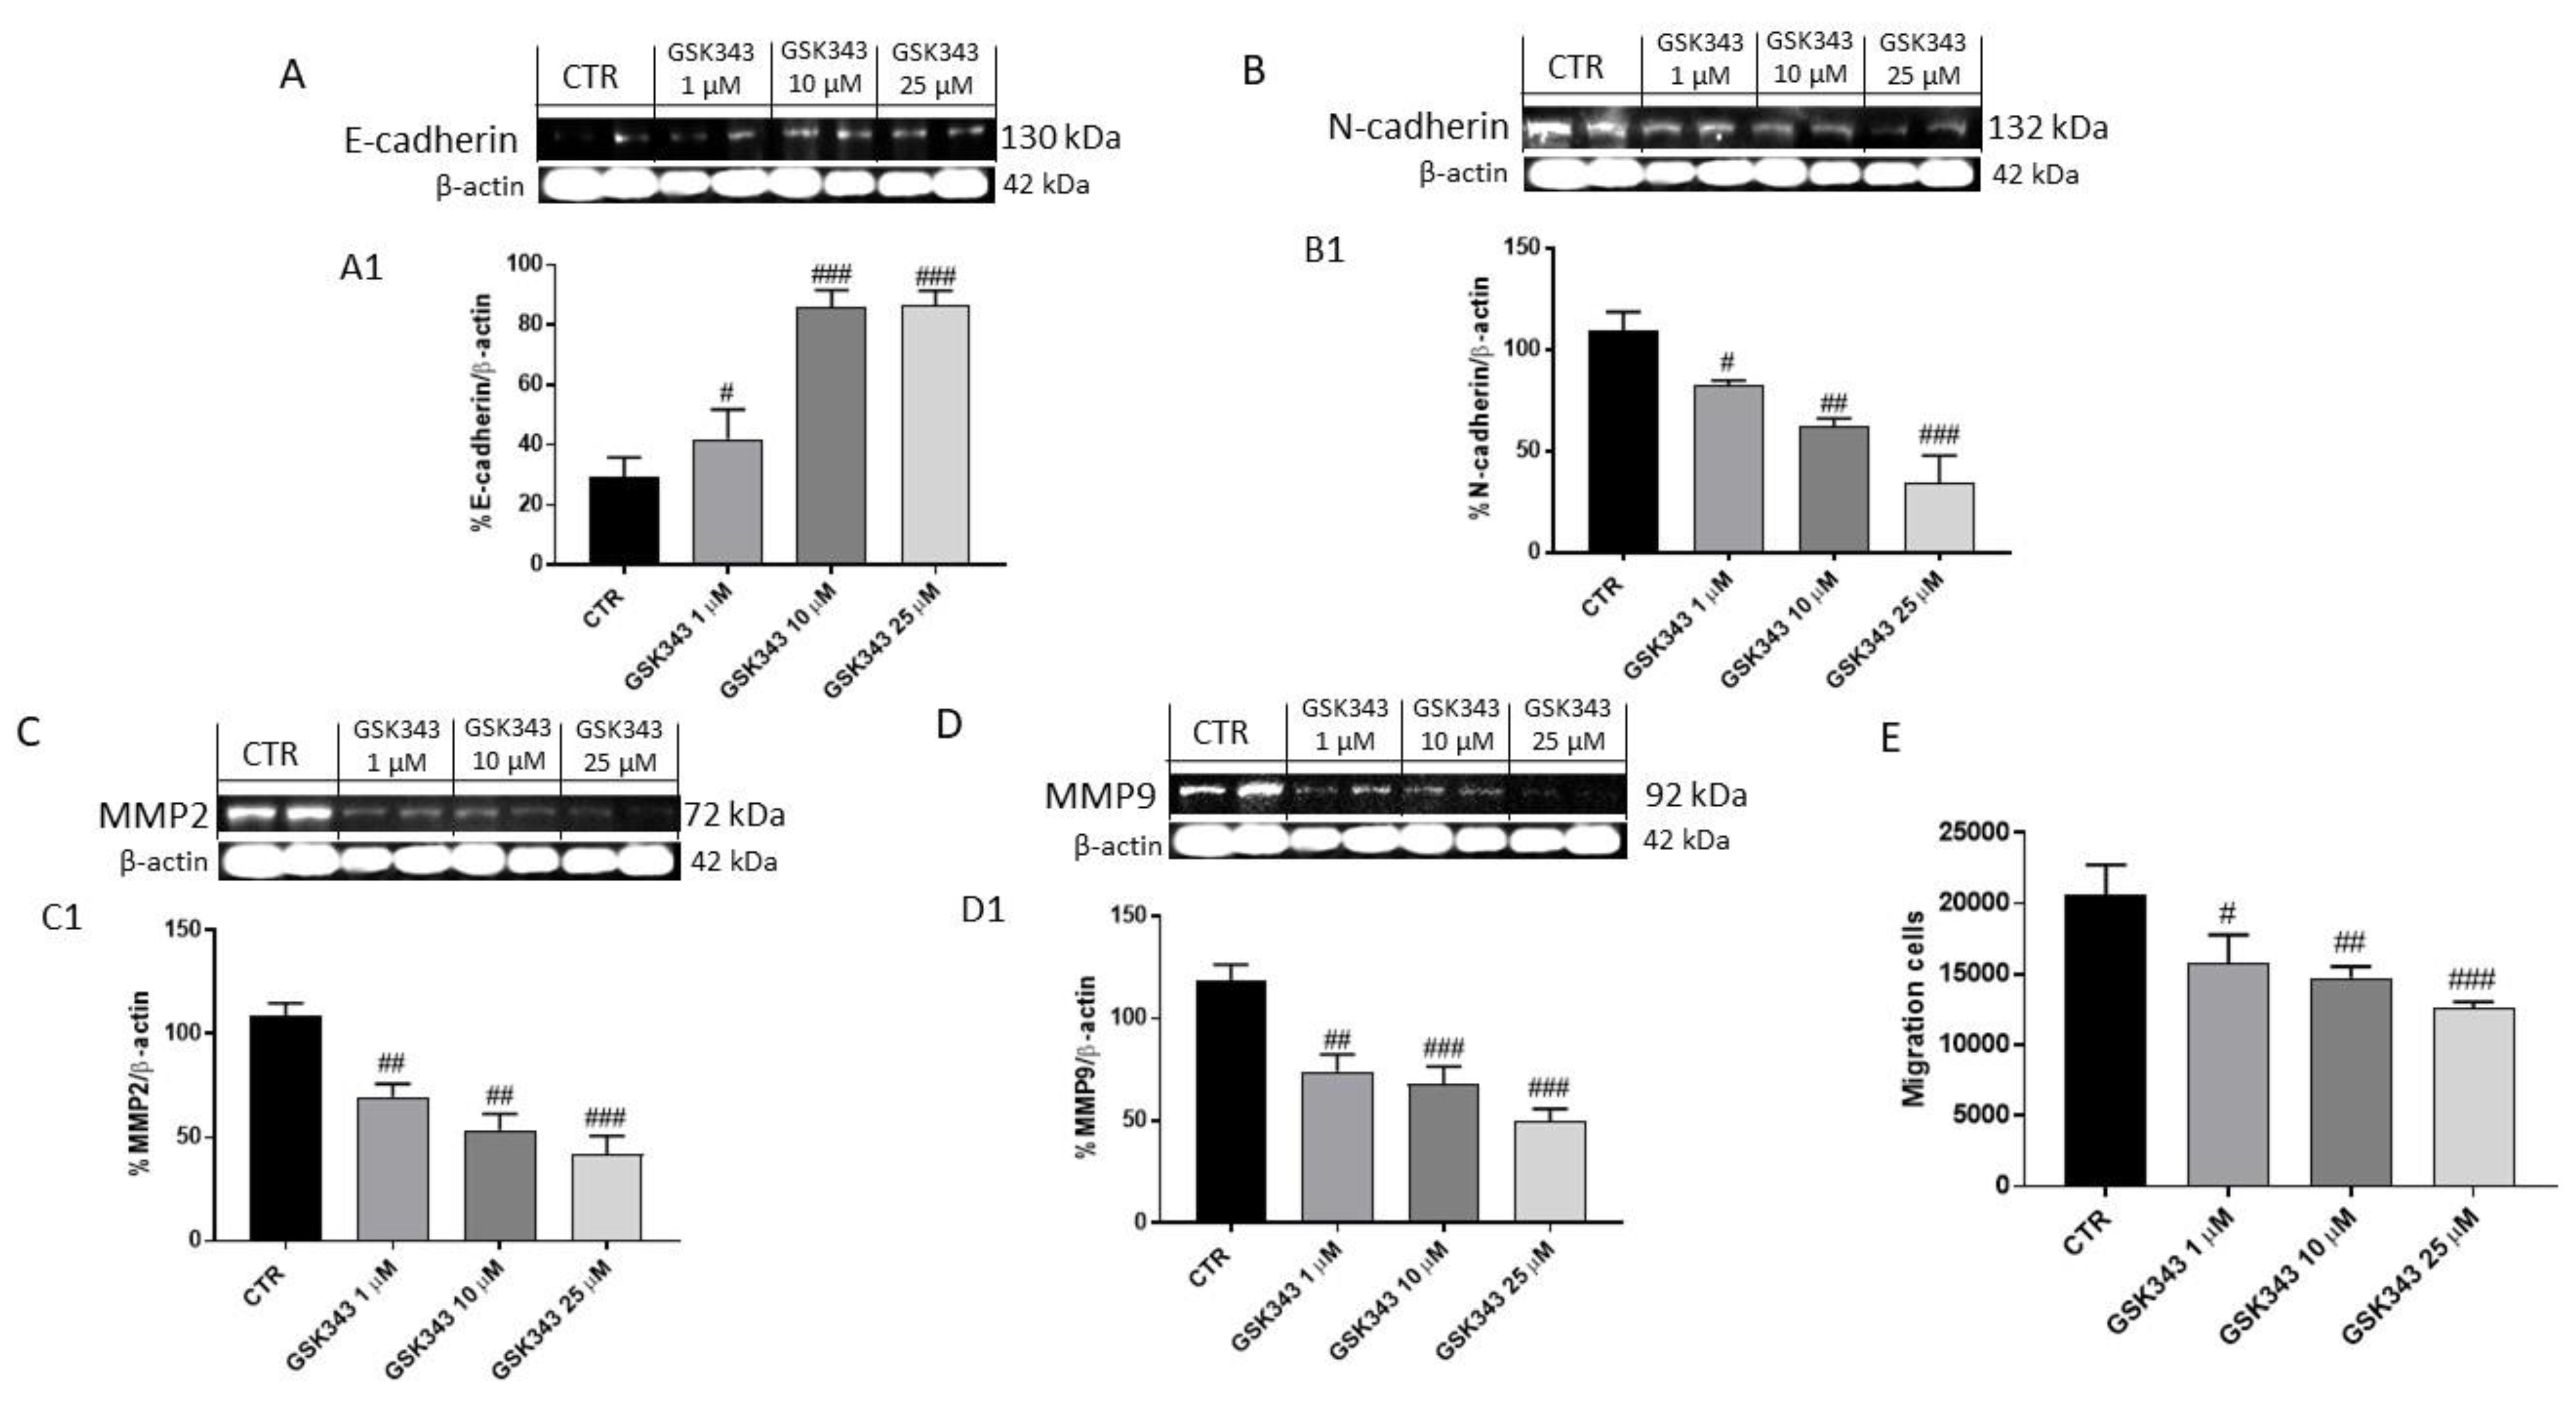
2.1.4. GSK343 Treatment Modulated Epithelial–Mesenchymal Transition and Metalloproteinases Expression in U87 Cell Lysates
2.2. In Vivo Studies
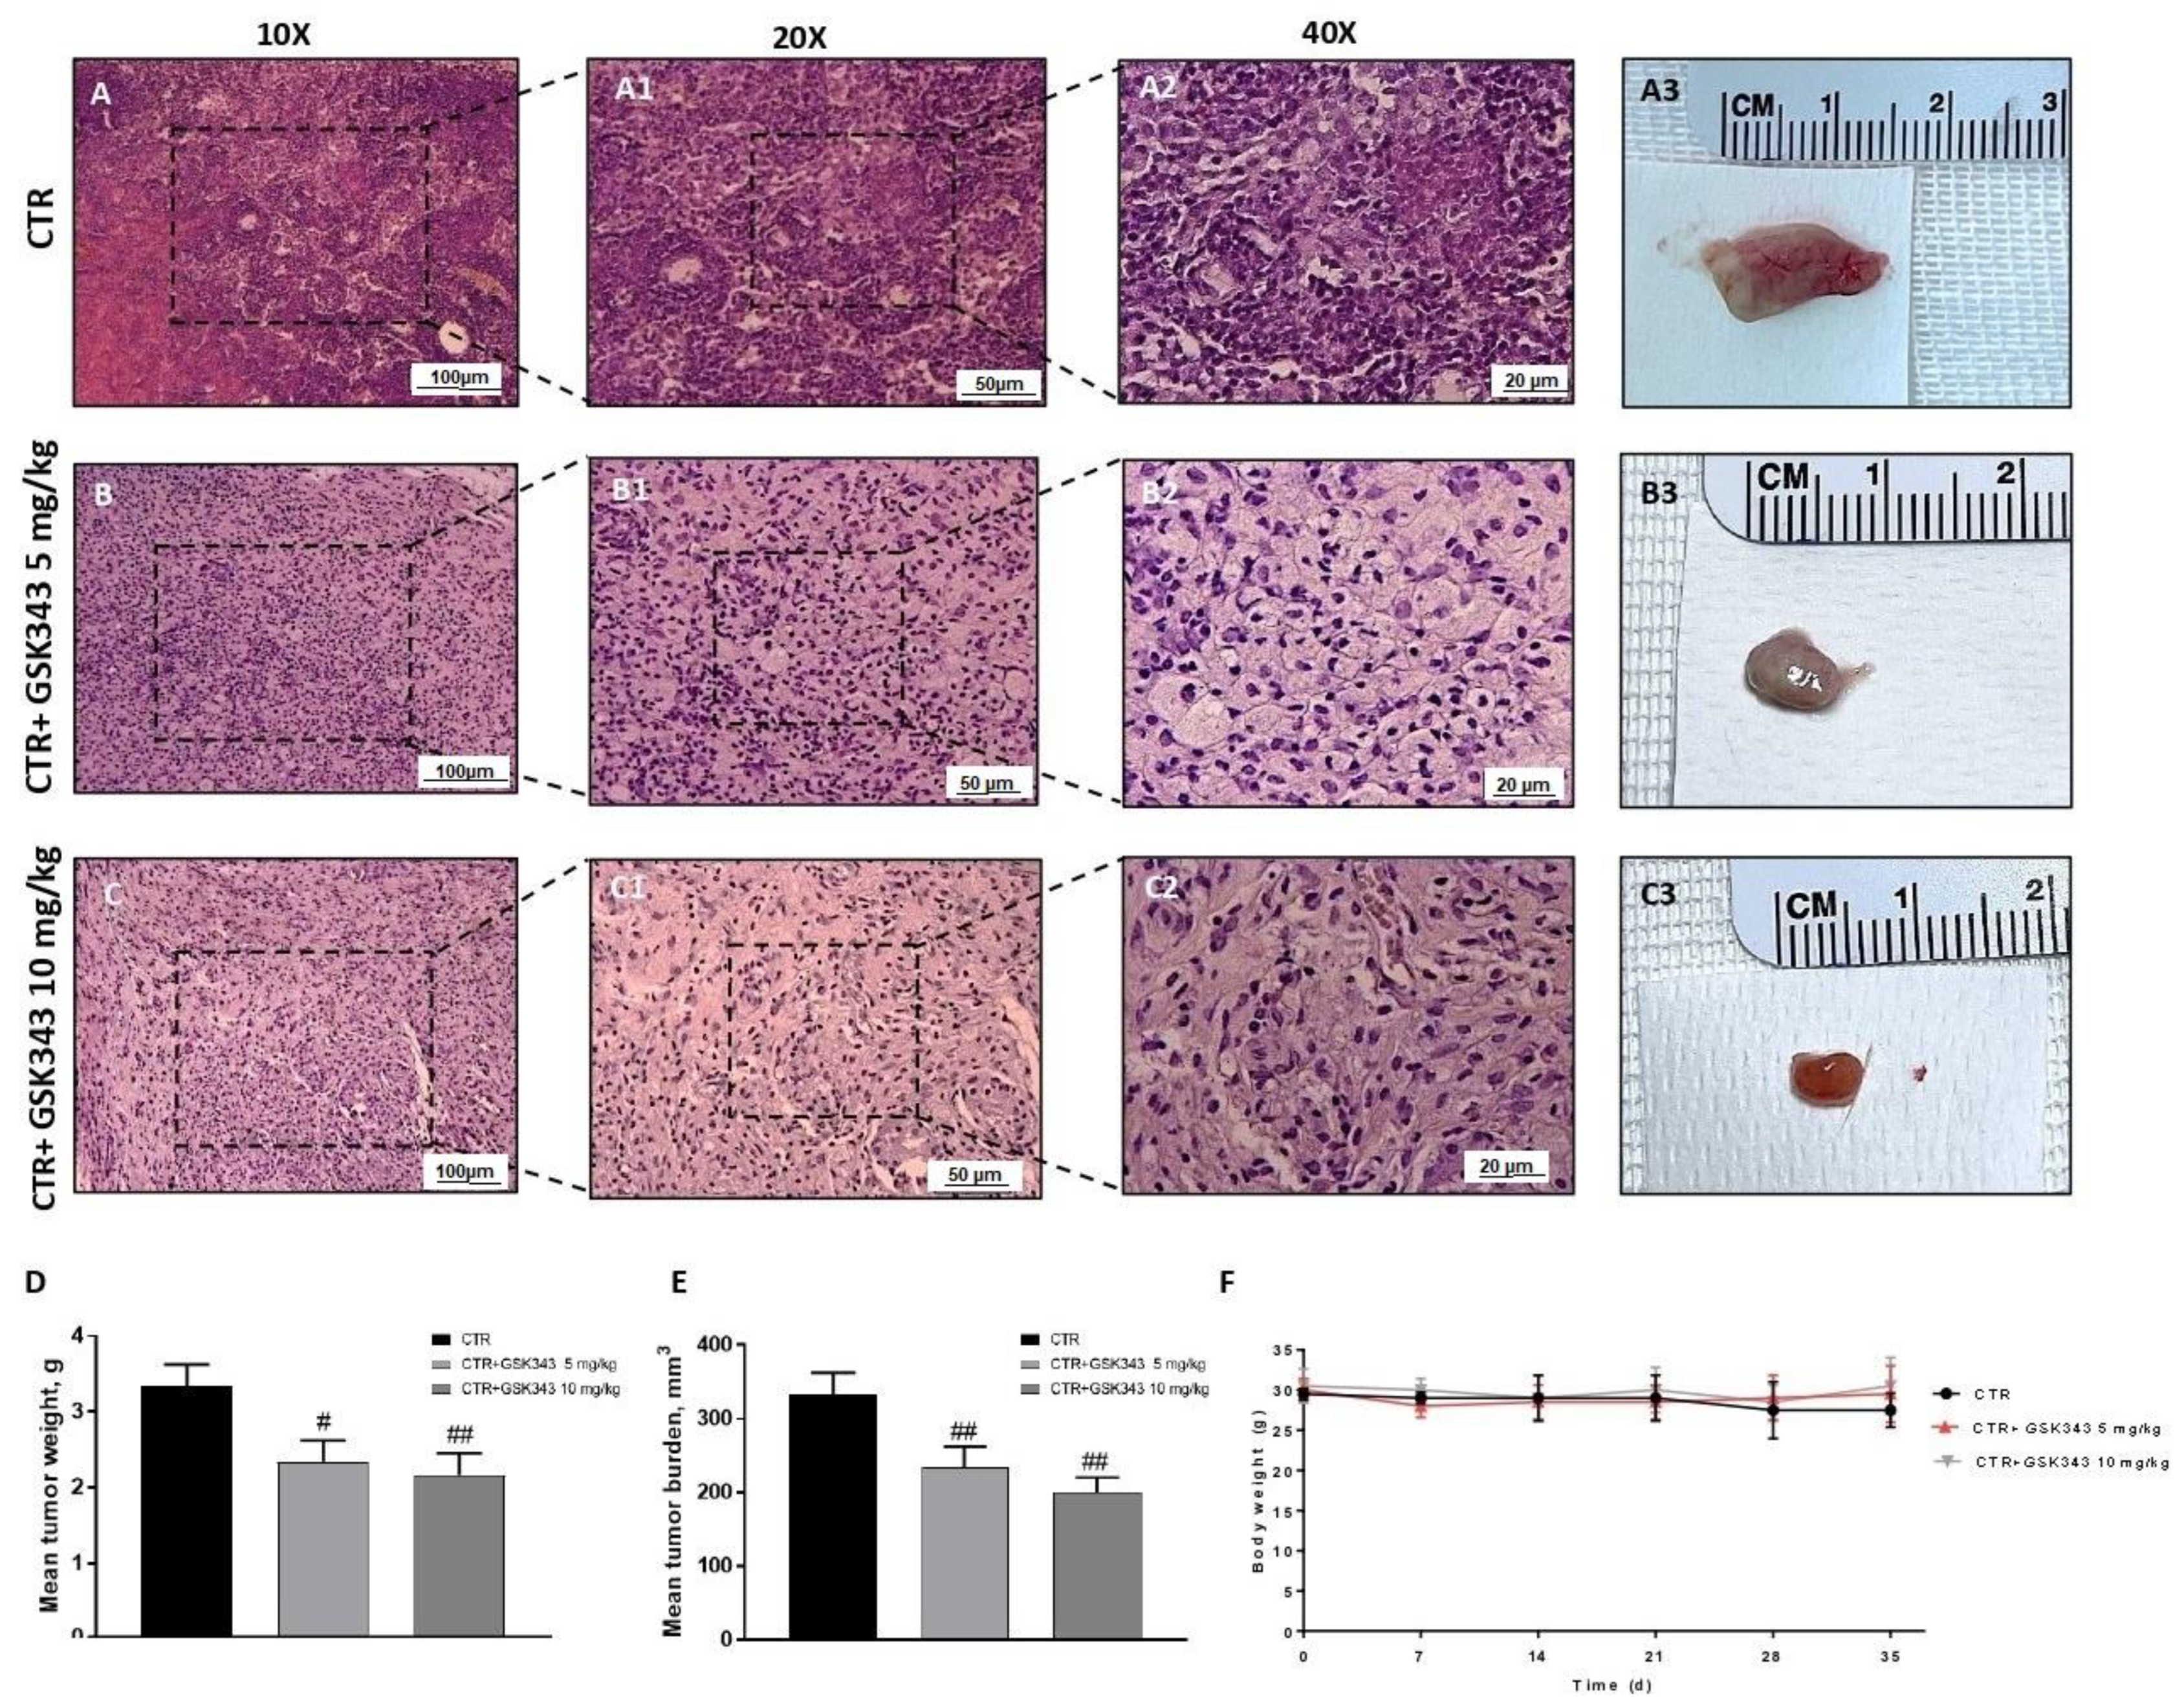
2.2.1. Effect of GSK343 Treatment on Tumor Growth
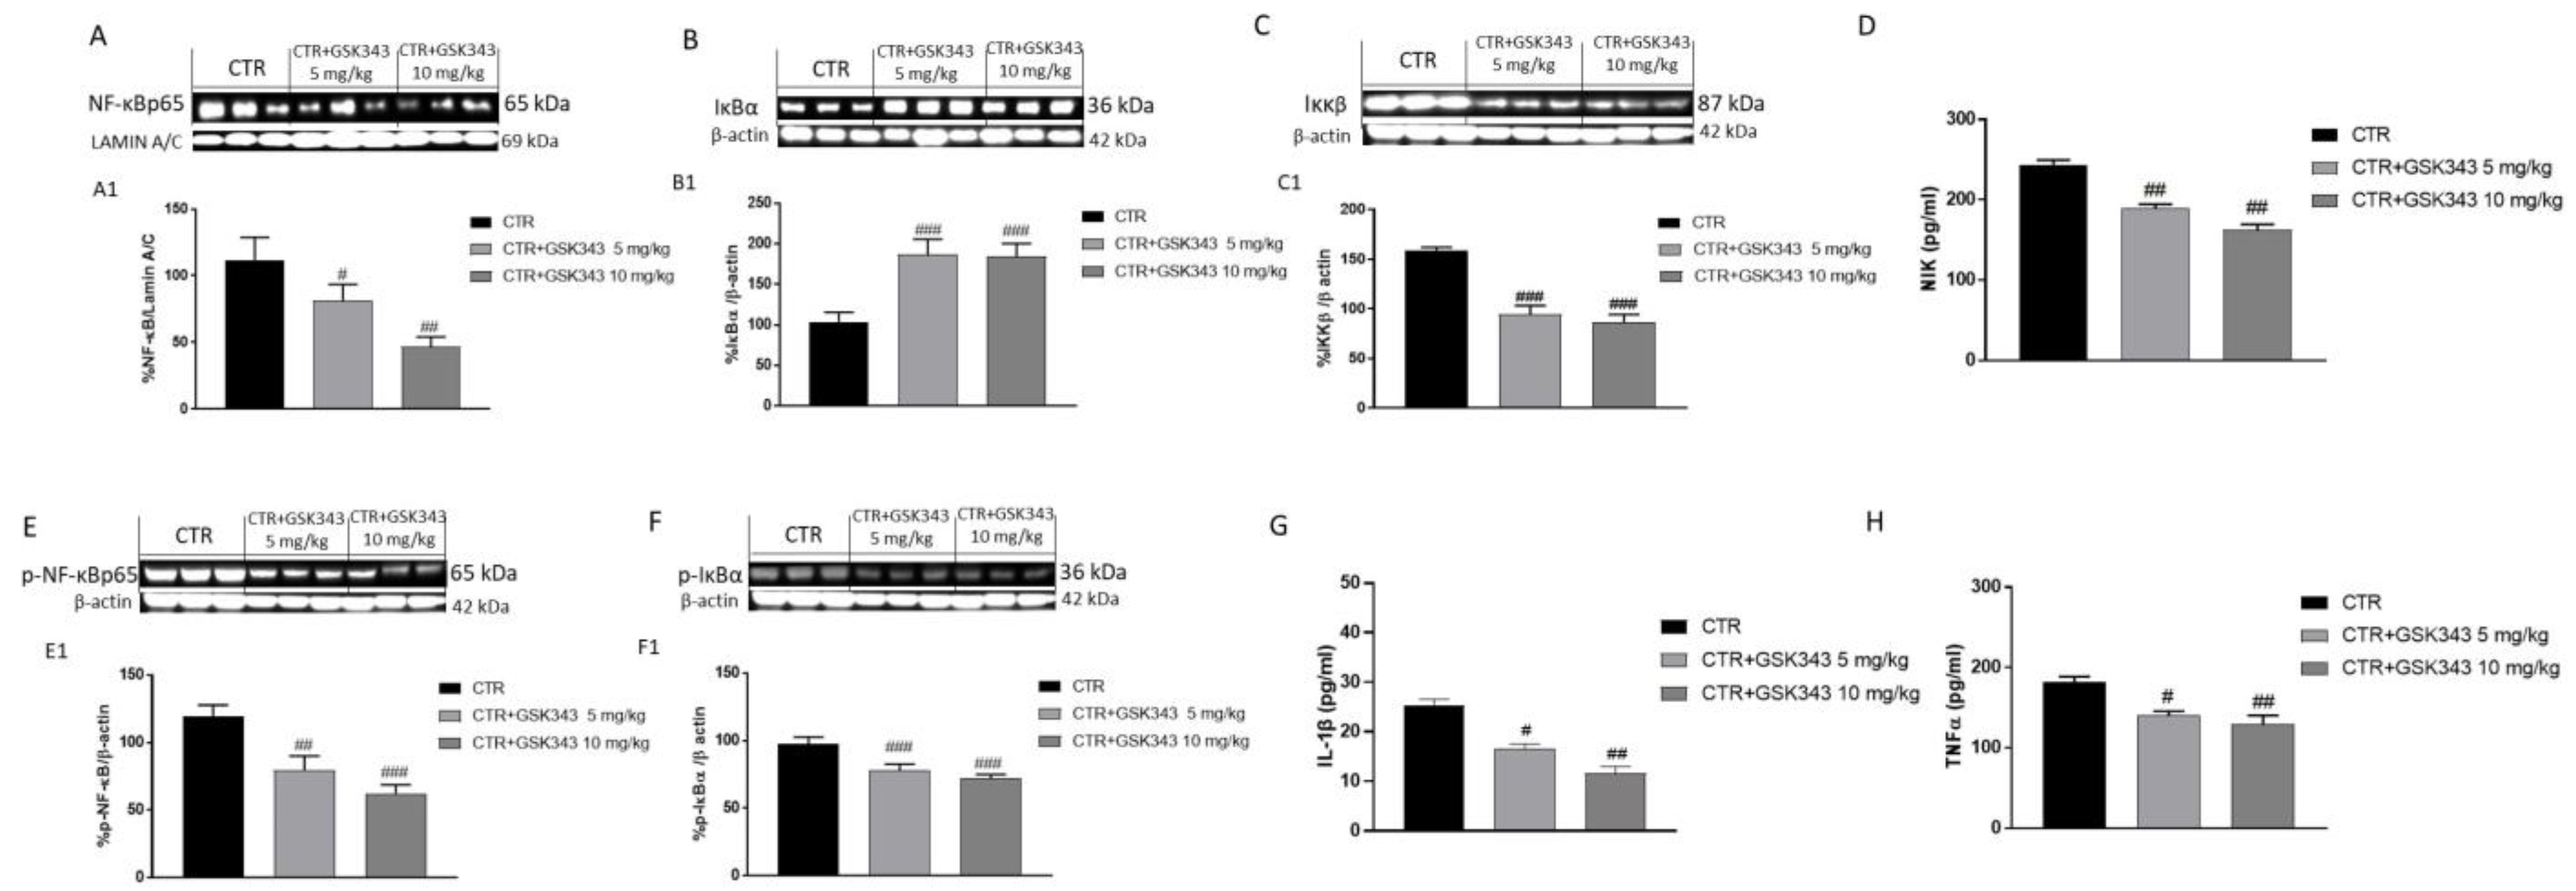
2.2.2. Effect of GSK343 Treatment on Canonical and Non-Canonical NF-κB/IκBα Pathways in U87-Xenograft Model
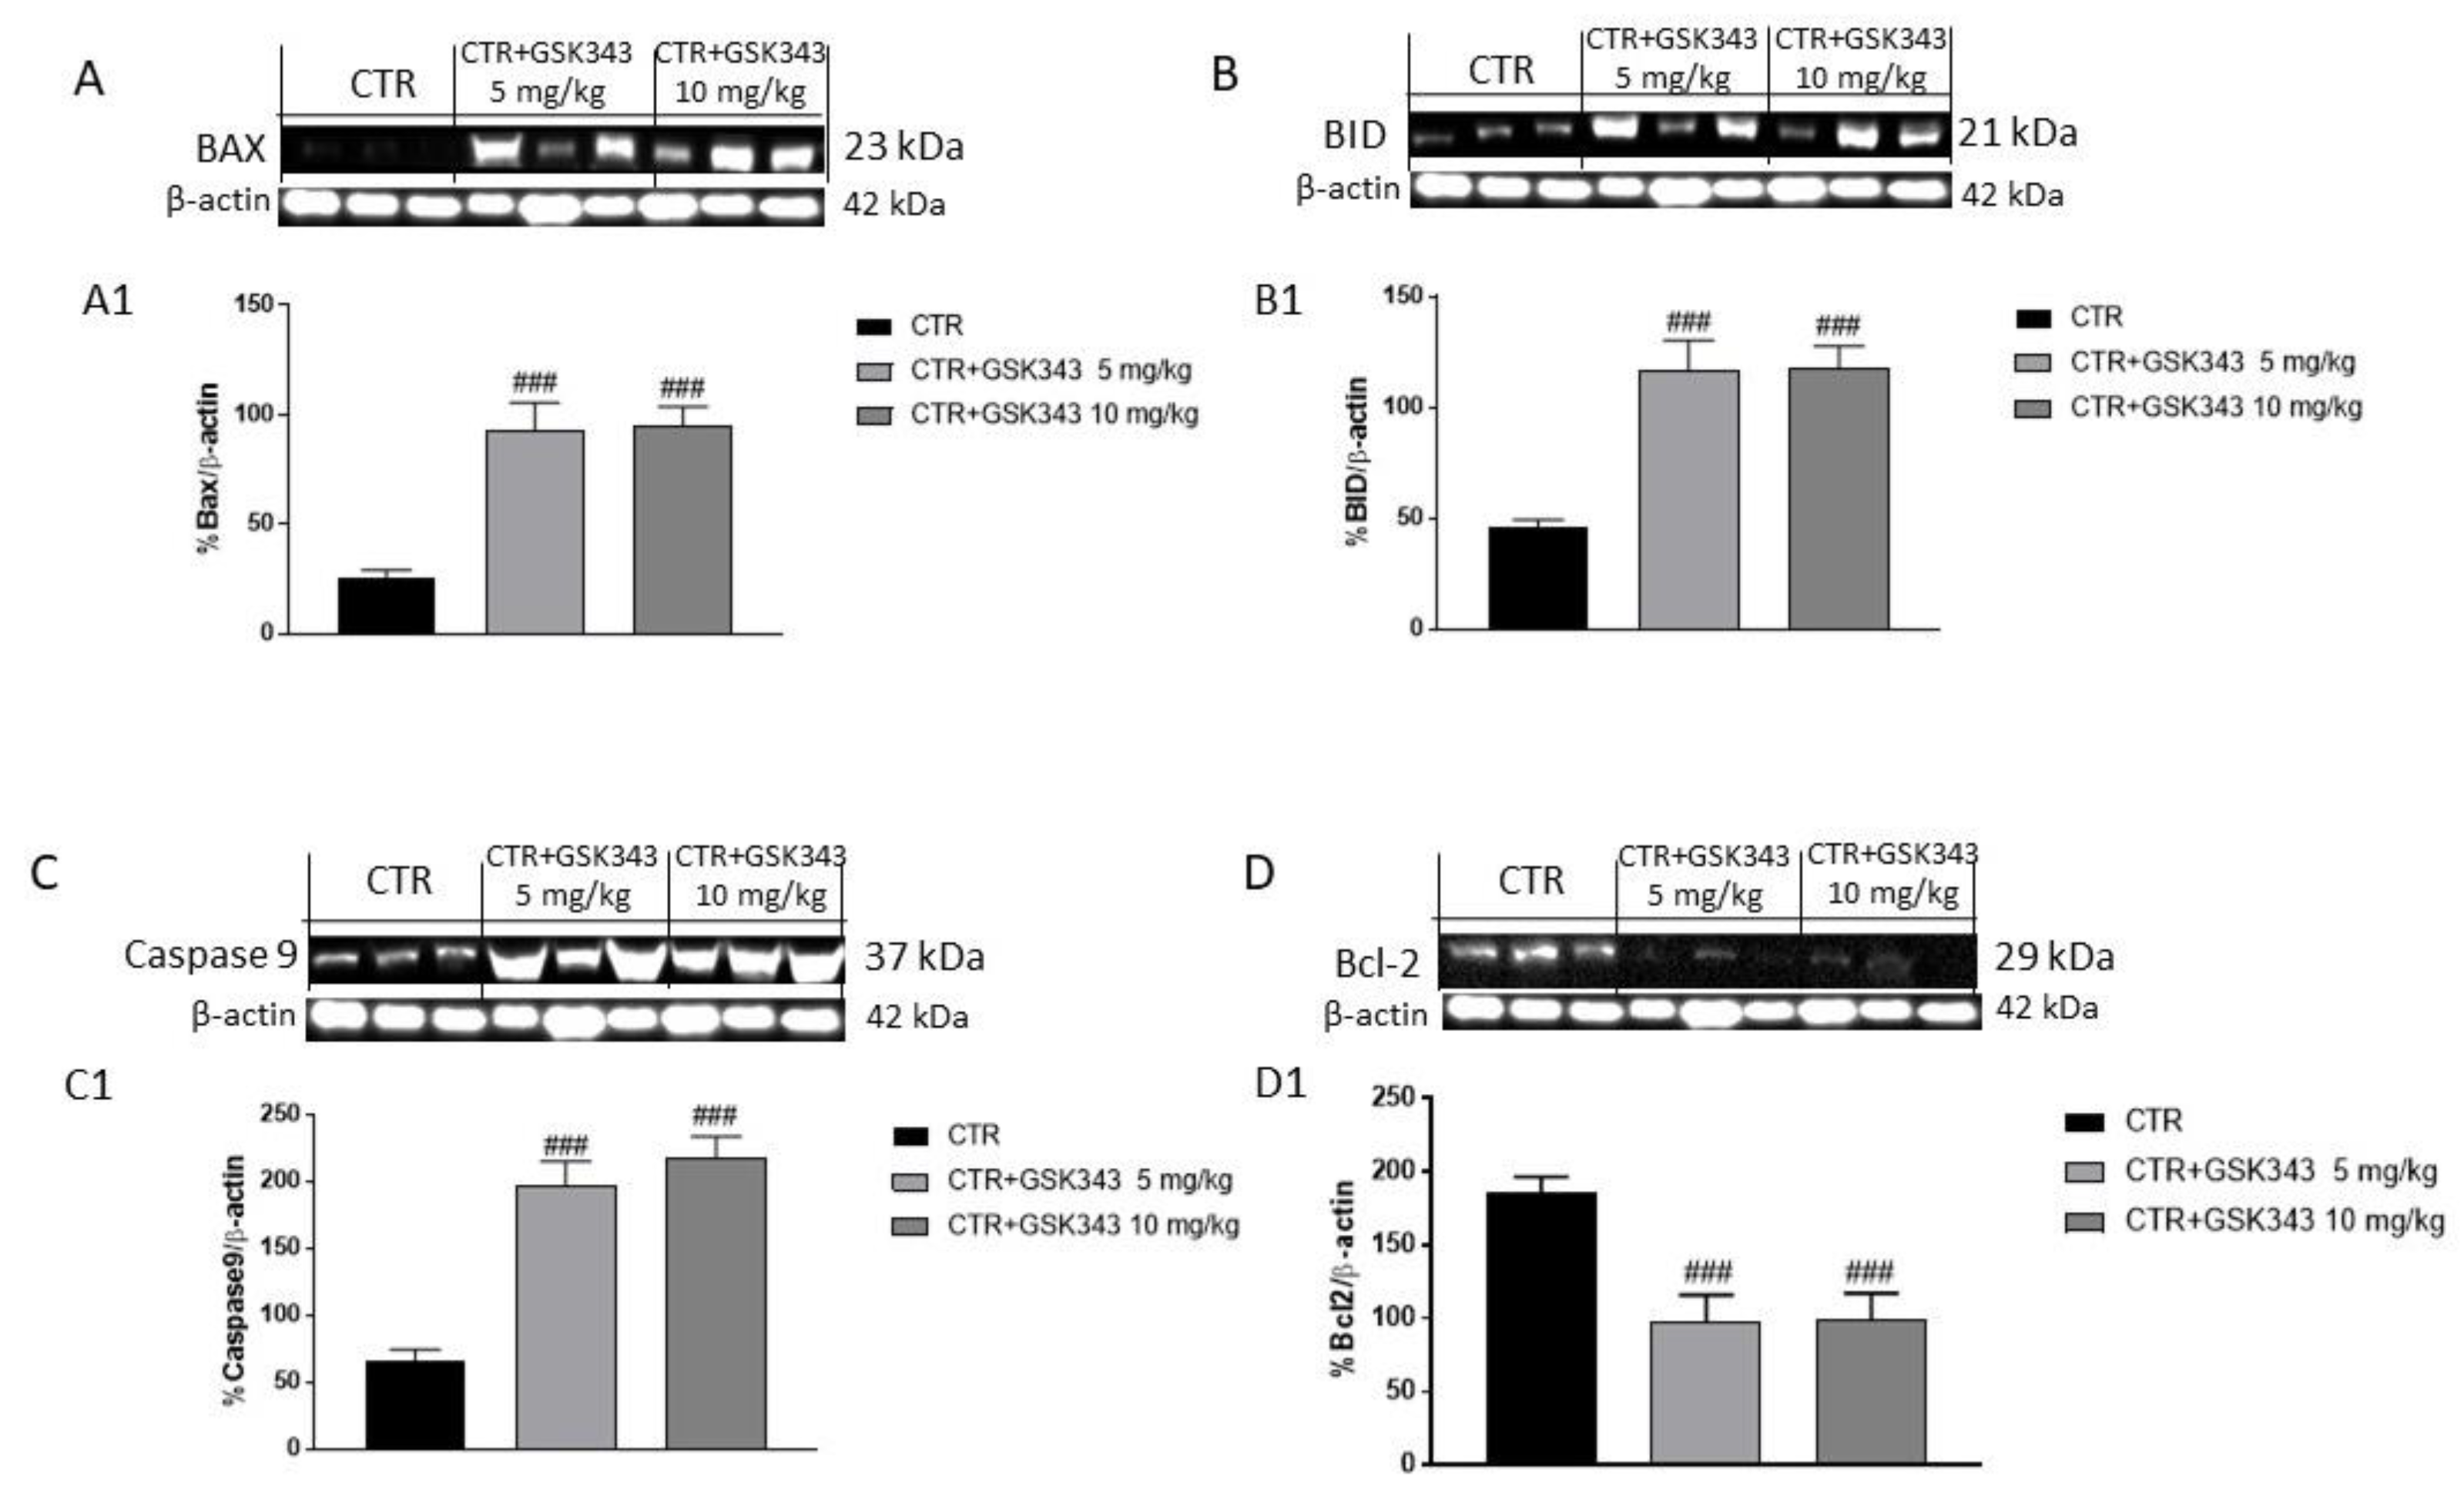
2.2.3. Effect of GSK343 Treatment on the Apoptotic Process in U87-Xenograft Model
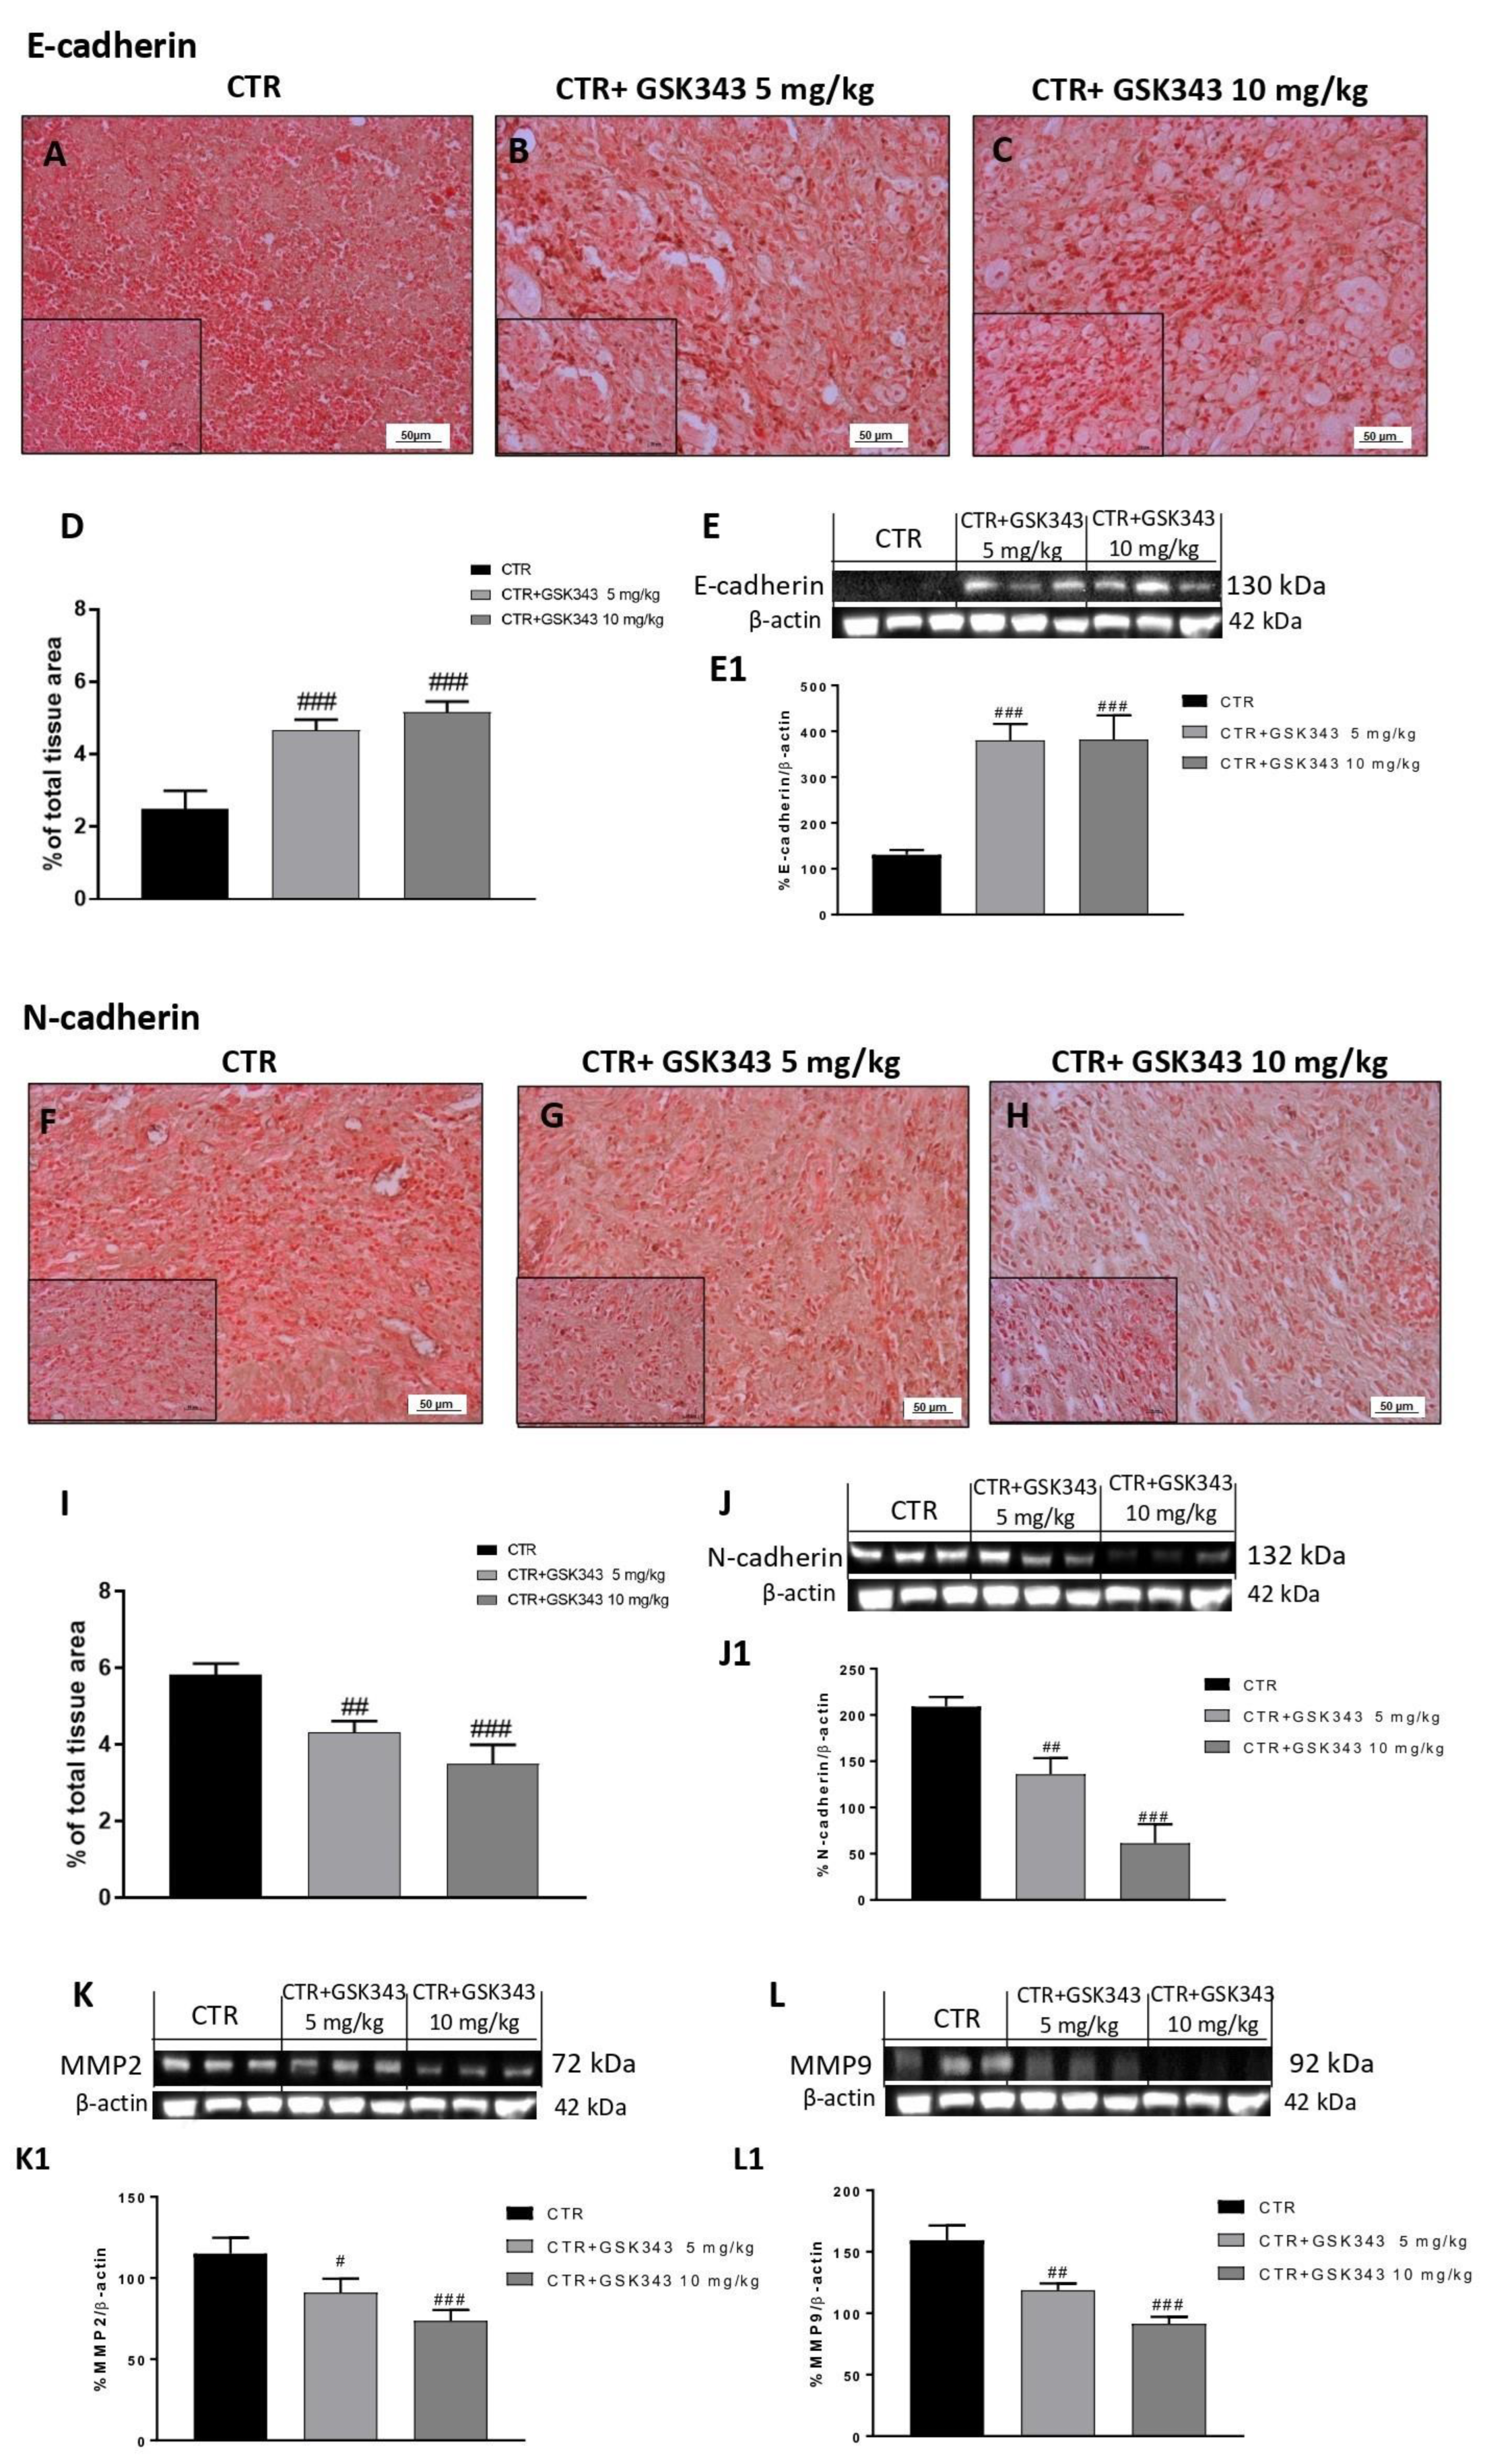
2.2.4. Effect of GSK343 Treatment on Epithelial–Mesenchymal Transition and Metalloproteases Expression in U87-Xenograft Model
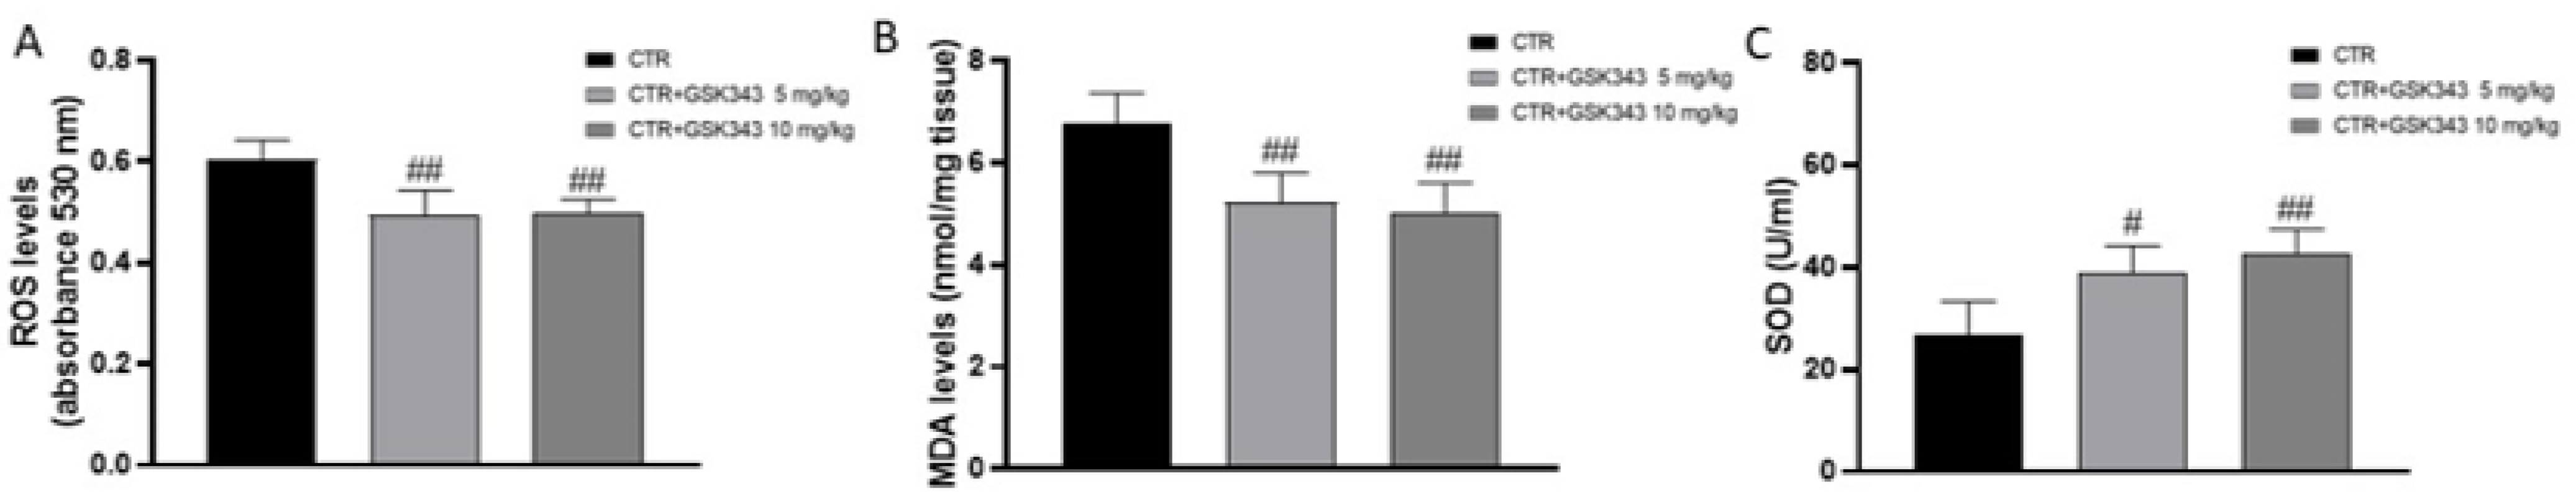
2.2.5. Effect of GSK343 on Oxidative Stress in U87-Xenograft Model
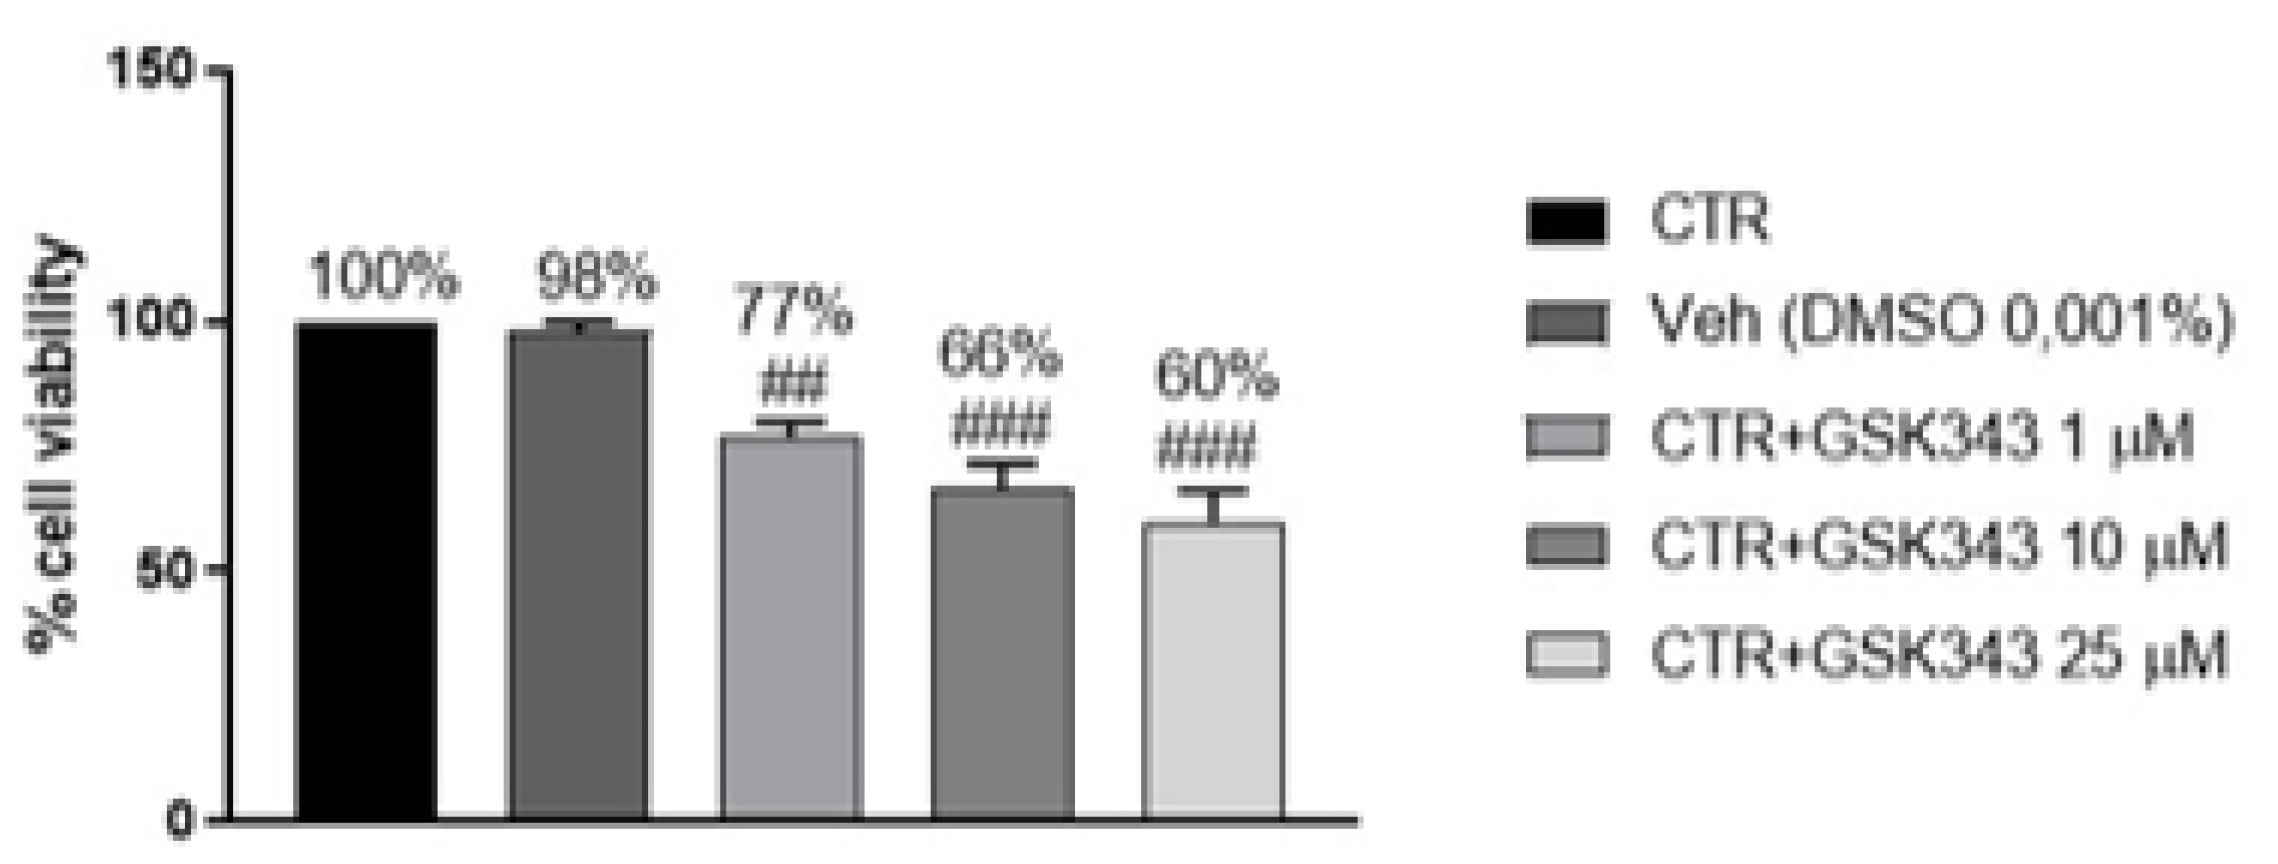
2.2.6. Effect of GSK343 Treatment on Primary GB Cell Viability
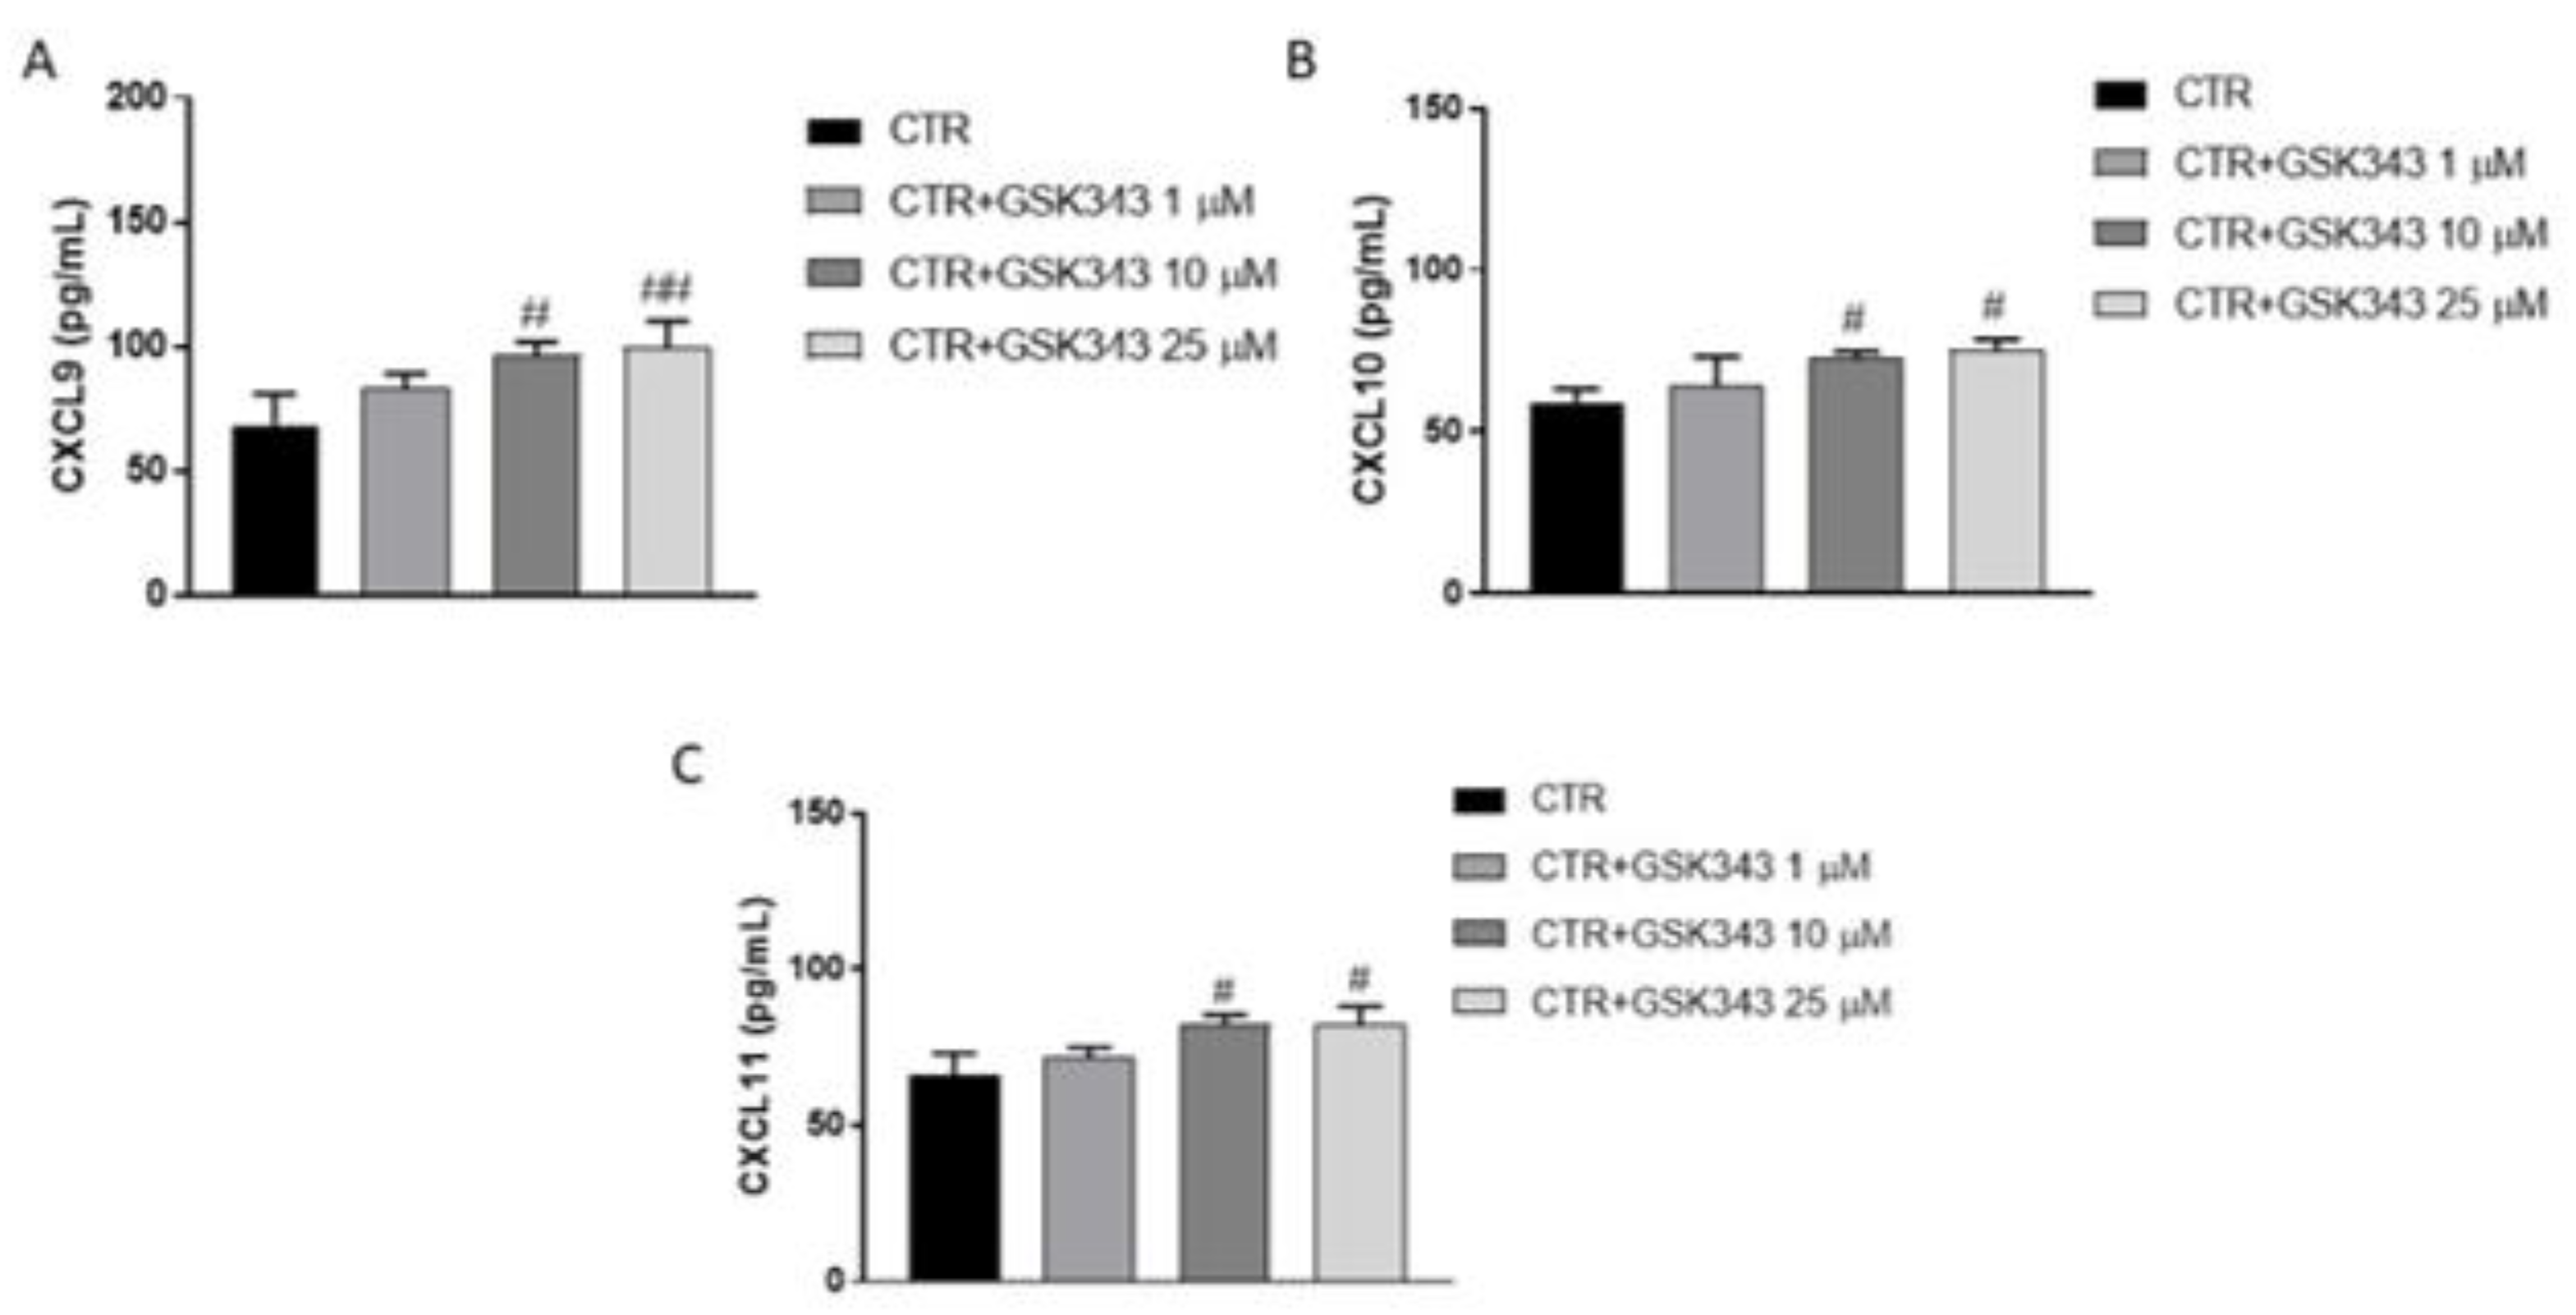
2.2.7. Effect of GSK343 Treatment on Immune Response
3. Discussion
4. Material and Methods
4.1. In Vitro Studies
4.1.1. Cell Lines
4.1.2. Cell Treatment
Experimental Groups
- Control groups: U87, U138 and A172 cell lines were treated with culture medium.
- Vehicle groups: U87, U138 and A172 cell lines were treated with 0.001% of DMSO dissolved in culture medium.
- GSK343 1 μM group: U87, U138 and A172 cell lines were treated with GSK343 1μM dissolved in culture medium with 0.001% of DMSO.
- GSK343 10 μM group: U87, U138 and A172 cell lines were treated with GSK343 10 μM dissolved in culture medium with 0.001% of DMSO.
- GSK343 25 μM group: U87, U138 and A172 cell lines were treated with GSK343 25 μM dissolved in culture medium with 0.001% of DMSO.
- GSK343 50 μM group: U87, U138 and A172 cell lines were treated with GSK343 50 μM dissolved in culture medium with 0.001% of DMSO.
4.1.3. MTT Assay
4.1.4. Western Blot Analysis
4.1.5. Enzyme-Linked Immunosorbent Assay (ELISA) for NF-κB-Inducing Kinase (NIK) and IKKβ
4.1.6. Cell Migration Assay
4.1.7. Statistical Analysis
4.2. In Vivo Studies
4.2.1. Cell Line
4.2.2. Animals
4.2.3. Experimental Design
Experimental Groups
- Control group (vehicle): intraperitoneal (ip) administration of PBS with 0.001% of DMSO.
- Control group+ GSK343 5 mg/kg: intraperitoneal (ip) administration of GSK343 5 mg/kg dissolved in PBS with 0.001% of DMSO.
- Control group+ GSK343 10 mg/kg: intraperitoneal (ip) administration of GSK343 10 mg/kg dissolved in PBS with 0.001% of DMSO.
4.2.4. Histological Evaluation
4.2.5. Western Blot Analysis
4.2.6. Immunohistochemical Localization for E-Cadherin and N-Cadherin
4.2.7. Enzyme-Linked Immunosorbent Assay (ELISA) for NIK, IL-1β, TNFα and SOD
4.2.8. Malondialdehyde (MDA) Assay
4.2.9. Reactive Oxygen Species (ROS) Assay
4.2.10. Statistical Analysis
4.3. Ex Vivo Studies
4.3.1. Patient-Derived Glioblastoma Cell Culture
Experimental Groups
- Control group: primary GB cells obtained from patients were treated with culture medium.
- Vehicle group: primary GB cells obtained from patients were treated with 0.001% of DMSO dissolved in culture medium.
- GSK343 1 μM: GB cells from patients were treated with GSK343 at concentration of 1 μM dissolved in culture medium with 0.001% of DMSO.
- GSK343 10 μM: GB cells from patients were treated with GSK343 at concentration of 10 μM dissolved in culture medium with 0.001% of DMSO.
- GSK343 25 μM: GB cells from patients were treated with GSK343 at concentration of 25 μM dissolved in culture medium with 0.001% of DMSO.
4.3.2. Cell Viability Assay
4.3.3. Enzyme-Linked Immunosorbent Assay (ELISA) for CXCL9, CXCL10 and CXCL11
4.4. Materials
4.5. Statistical Analysis
5. Conclusions
Supplementary Materials
Author Contributions
Funding
Institutional Review Board Statement
Informed Consent Statement
Data Availability Statement
Conflicts of Interest
References
- Hanif, F.; Muzaffar, K.; Perveen, K.; Malhi, S.M.; Simjee, S.U. Glioblastoma Multiforme: A Review of its Epidemiology and Pathogenesis through Clinical Presentation and Treatment. Asian Pac. J. Cancer Prev. 2017, 18, 3–9. [Google Scholar]
- Ohgaki, H.; Kleihues, P. The definition of primary and secondary glioblastoma. Clin. Cancer Res. 2013, 19, 764–772. [Google Scholar] [CrossRef]
- Brandes, A.A.; Tosoni, A.; Franceschi, E.; Reni, M.; Gatta, G.; Vecht, C. Glioblastoma in adults. Crit. Rev. Oncol. Hematol. 2008, 67, 139–152. [Google Scholar] [CrossRef]
- Omuro, A.; DeAngelis, L.M. Glioblastoma and other malignant gliomas: A clinical review. JAMA 2013, 310, 1842–1850. [Google Scholar] [CrossRef]
- Liu, A.; Hou, C.; Chen, H.; Zong, X.; Zong, P. Genetics and Epigenetics of Glioblastoma: Applications and Overall Incidence of IDH1 Mutation. Front. Oncol. 2016, 6, 16. [Google Scholar] [CrossRef]
- Belden, C.J.; Valdes, P.A.; Ran, C.; Pastel, D.A.; Harris, B.T.; Fadul, C.E.; Israel, M.A.; Paulsen, K.; Roberts, D.W. Genetics of glioblastoma: A window into its imaging and histopathologic variability. Radiographics 2011, 31, 1717–1740. [Google Scholar] [CrossRef]
- Stoyanov, G.S.; Dzhenkov, D.L. On the Concepts and History of Glioblastoma Multiforme—Morphology, Genetics and Epigenetics. Folia Med. 2018, 60, 48–66. [Google Scholar] [CrossRef]
- Chakravarthi, B.V.; Nepal, S.; Varambally, S. Genomic and Epigenomic Alterations in Cancer. Am. J. Pathol. 2016, 186, 1724–1735. [Google Scholar] [CrossRef]
- Gan, L.; Yang, Y.; Li, Q.; Feng, Y.; Liu, T.; Guo, W. Epigenetic regulation of cancer progression by EZH2: From biological insights to therapeutic potential. Biomark. Res. 2018, 6, 10. [Google Scholar] [CrossRef]
- Kim, K.H.; Roberts, C.W. Targeting EZH2 in cancer. Nat. Med. 2016, 22, 128–134. [Google Scholar] [CrossRef]
- Chang, J.W.; Gwak, S.Y.; Shim, G.-A.; Liu, L.; Lim, Y.C.; Kim, J.M.; Jung, M.G.; Koo, B.S. EZH2 is associated with poor prognosis in head-and-neck squamous cell carcinoma via regulating the epithelial-to-mesenchymal transition and chemosensitivity. Oral Oncol. 2016, 52, 66–74. [Google Scholar] [CrossRef] [PubMed]
- Duan, R.; Du, W.; Guo, W. EZH2: A novel target for cancer treatment. J. Hematol. Oncol. 2020, 13, 104. [Google Scholar] [CrossRef] [PubMed]
- Blackledge, N.P.; Klose, R.J. The molecular principles of gene regulation by Polycomb repressive complexes. Nat. Rev. Mol. Cell Biol. 2021, 22, 815–833. [Google Scholar] [CrossRef] [PubMed]
- Soubannier, V.; Stifani, S. NF-κB Signalling in Glioblastoma. Biomedicines 2017, 5, 29. [Google Scholar] [CrossRef]
- Lee, S.T.; Li, Z.; Wu, Z.; Aau, M.; Guan, P.; Karuturi, R.K.M.; Liou, Y.C.; Yu, Q. Context-specific regulation of NF-κB target gene expression by EZH2 in breast cancers. Mol. Cell 2011, 43, 798–810. [Google Scholar] [CrossRef]
- Barroso, M.; Kao, D.; Blom, H.J.; Tavares de Almeida, I.; Castro, R.; Loscalzo, J.; Handy, D.E. S-adenosylhomocysteine induces inflammation through NFkB: A possible role for EZH2 in endothelial cell activation. Biochim. Biophys. Acta 2016, 1862, 82–92. [Google Scholar] [CrossRef]
- De Donatis, G.M.; Le Pape, E.; Pierron, A.; Cheli, Y.; Hofman, V.; Hofman, P.; Allegra, M.; Zahaf, K.; Bahadoran, P.; Rocchi, S.; et al. NF-kB2 induces senescence bypass in melanoma via a direct transcriptional activation of EZH2. Oncogene 2016, 35, 2813. [Google Scholar] [CrossRef]
- Plati, J.; Bucur, O.; Khosravi-Far, R. Dysregulation of apoptotic signaling in cancer: Molecular mechanisms and therapeutic opportunities. J. Cell. Biochem. 2008, 104, 1124–1149. [Google Scholar] [CrossRef]
- Del Moral-Morales, A.; Gonzalez-Orozco, J.C.; Hernandez-Vega, A.M.; Hernandez-Ortega, K.; Pena-Gutierrez, K.M.; Camacho-Arroyo, I. EZH2 Mediates Proliferation, Migration, and Invasion Promoted by Estradiol in Human Glioblastoma Cells. Front. Endocrinol. 2022, 13, 703733. [Google Scholar] [CrossRef]
- Chien, Y.-C.; Chen, J.-N.; Chen, Y.-H.; Chou, R.-H.; Lee, H.-C.; Yu, Y.-L. Epigenetic Silencing of miR-9 Promotes Migration and Invasion by EZH2 in Glioblastoma Cells. Cancers 2020, 12, 1781. [Google Scholar] [CrossRef]
- Paskeh, M.D.A.; Mehrabi, A.; Gholami, M.H.; Zabolian, A.; Ranjbar, E.; Saleki, H.; Ranjbar, A.; Hashemi, M.; Ertas, Y.N.; Hushmandi, K.; et al. EZH2 as a new therapeutic target in brain tumors: Molecular landscape, therapeutic targeting and future prospects. Biomed. Pharmacother. 2022, 146, 112532. [Google Scholar] [CrossRef] [PubMed]
- Bugide, S.; Gupta, R.; Green, M.R.; Wajapeyee, N. EZH2 inhibits NK cell-mediated antitumor immunity by suppressing CXCL10 expression in an HDAC10-dependent manner. Proc. Natl. Acad. Sci. USA 2021, 118, e2102718118. [Google Scholar] [CrossRef] [PubMed]
- Zhou, J.; Bi, C.; Cheong, L.-L.; Mahara, S.; Liu, S.-C.; Tay, K.-G.; Koh, T.-L.; Yu, Q.; Chng, W.-J. The histone methyltransferase inhibitor, DZNep, up-regulates TXNIP, increases ROS production, and targets leukemia cells in AML. Blood 2011, 118, 2830–2839. [Google Scholar] [CrossRef]
- Zhou, J.; Huang, S.; Wang, Z.; Huang, J.; Xu, L.; Tang, X.; Wan, Y.Y.; Li, Q.-J.; Symonds, A.L.J.; Long, H.; et al. Targeting EZH2 histone methyltransferase activity alleviates experimental intestinal inflammation. Nat. Commun. 2019, 10, 2427. [Google Scholar] [CrossRef] [PubMed]
- Stazi, G.; Taglieri, L.; Nicolai, A.; Romanelli, A.; Fioravanti, R.; Morrone, S.; Sabatino, M.; Ragno, R.; Taurone, S.; Nebbioso, M.; et al. Dissecting the role of novel EZH2 inhibitors in primary glioblastoma cell cultures: Effects on proliferation, epithelial-mesenchymal transition, migration, and on the pro-inflammatory phenotype. Clin. Epigenet. 2019, 11, 173. [Google Scholar] [CrossRef] [PubMed]
- Yu, T.; Wang, Y.; Hu, Q.; Wu, W.; Wu, Y.; Wei, W.; Han, D.; You, Y.; Lin, N.; Liu, N. The EZH2 inhibitor GSK343 suppresses cancer stem-like phenotypes and reverses mesenchymal transition in glioma cells. Oncotarget 2017, 8, 98348–98359. [Google Scholar] [CrossRef] [PubMed]
- Amatangelo, M.D.; Garipov, A.; Li, H.; Conejo-Garcia, J.R.; Speicher, D.W.; Zhang, R. Three-dimensional culture sensitizes epithelial ovarian cancer cells to EZH2 methyltransferase inhibition. Cell Cycle 2013, 12, 2113–2119. [Google Scholar] [CrossRef]
- Xiong, X.; Zhang, J.; Li, A.; Dai, L.; Qin, S.; Wang, P.; Liu, W.; Zhang, Z.; Li, X.; Liu, Z. GSK343 induces programmed cell death through the inhibition of EZH2 and FBP1 in osteosarcoma cells. Cancer Biol. Ther. 2020, 21, 213–222. [Google Scholar] [CrossRef]
- Bownes, L.V.; Williams, A.P.; Marayati, R.; Stafman, L.L.; Markert, H.; Quinn, C.H.; Wadhwani, N.; Aye, J.M.; Stewart, J.E.; Yoon, K.J.; et al. EZH2 inhibition decreases neuroblastoma proliferation and in vivo tumor growth. PLoS ONE 2021, 16, e0246244. [Google Scholar] [CrossRef]
- Ratnam, N.M.; Sonnemann, H.M.; Frederico, S.C.; Chen, H.; Hutchinson, M.N.D.; Dowdy, T.; Reid, C.M.; Jung, J.; Zhang, W.; Song, H.; et al. Reversing Epigenetic Gene Silencing to Overcome Immune Evasion in CNS Malignancies. Front. Oncol. 2021, 11, 719091. [Google Scholar] [CrossRef]
- Miele, E.; Valente, S.; Alfano, V.; Silvano, M.; Mellini, P.; Borovika, D.; Marrocco, B.; Po, A.; Besharat, Z.M.; Catanzaro, G.; et al. The histone methyltransferase EZH2 as a druggable target in SHH medulloblastoma cancer stem cells. Oncotarget 2017, 8, 68557–68570. [Google Scholar] [CrossRef] [PubMed]
- Zhang, R.; Wang, R.; Chang, H.; Wu, F.; Liu, C.; Deng, D.; Fan, W. Downregulation of Ezh2 expression by RNA interference induces cell cycle arrest in the G0/G1 phase and apoptosis in U87 human glioma cells. Oncol. Rep. 2012, 28, 2278–2284. [Google Scholar] [CrossRef] [PubMed]
- Clark, M.J.; Homer, N.; O’Connor, B.D.; Chen, Z.; Eskin, A.; Lee, H.; Merriman, B.; Nelson, S.F. Correction: U87MG Decoded: The Genomic Sequence of a Cytogenetically Aberrant Human Cancer Cell Line. PLoS Genet. 2018, 14, e1007392. [Google Scholar] [CrossRef] [PubMed]
- Yin, Y.; Qiu, S.; Peng, Y. Functional roles of enhancer of zeste homolog 2 in gliomas. Gene 2016, 576 Pt 2, 189–194. [Google Scholar] [CrossRef]
- Valdes-Rives, S.A.; Casique-Aguirre, D.; German-Castelan, L.; Velasco-Velazquez, M.A.; Gonzalez-Arenas, A. Apoptotic Signaling Pathways in Glioblastoma and Therapeutic Implications. Biomed. Res. Int. 2017, 2017, 7403747. [Google Scholar] [CrossRef]
- Dharmajaya, R.; Sari, D.K. Malondialdehyde value as radical oxidative marker and endogenous antioxidant value analysis in brain tumor. Ann. Med. Surg. 2022, 77, 103231. [Google Scholar] [CrossRef]
- Yamagishi, M.; Uchimaru, K. Targeting EZH2 in cancer therapy. Curr. Opin. Oncol. 2017, 29, 375–381. [Google Scholar] [CrossRef]
- Li, B.; Chng, W.-J. EZH2 abnormalities in lymphoid malignancies: Underlying mechanisms and therapeutic implications. J. Hematol. Oncol. 2019, 12, 118. [Google Scholar] [CrossRef]
- Duan, S.; Chan, W.K.; Oman, A.; Basile, D.P.; Alvira, C.M.; Buxton, I.L.O.; Iosef, C. NF-κB/NKILA signaling modulates the anti-cancerous effects of EZH2 inhibition. J. Cell. Mol. Med. 2019, 23, 6182–6192. [Google Scholar] [CrossRef]
- Jin, M.; Duan, J.; Liu, W.; Ji, J.; Liu, B.; Zhang, M. Feedback activation of NF-KB signaling leads to adaptive resistance to EZH2 inhibitors in prostate cancer cells. Cancer Cell Int. 2021, 21, 191. [Google Scholar] [CrossRef]
- Kore, R.A.; Abraham, E.C. Inflammatory cytokines, interleukin-1 beta and tumor necrosis factor-alpha, upregulated in glioblastoma multiforme, raise the levels of CRYAB in exosomes secreted by U373 glioma cells. Biochem. Biophys. Res. Commun. 2014, 453, 326–331. [Google Scholar] [CrossRef] [PubMed]
- Torrisi, F.; Vicario, N.; Spitale, F.M.; Cammarata, F.P.; Minafra, L.; Salvatorelli, L.; Russo, G.; Cuttone, G.; Valable, S.; Gulino, R.; et al. The Role of Hypoxia and SRC Tyrosine Kinase in Glioblastoma Invasiveness and Radioresistance. Cancers 2020, 12, 2860. [Google Scholar] [CrossRef] [PubMed]
- Torrisi, F.; Alberghina, C.; D’Aprile, S.; Pavone, A.M.; Longhitano, L.; Giallongo, S.; Tibullo, D.; Di Rosa, M.; Zappalà, A.; Cammarata, F.P.; et al. The Hallmarks of Glioblastoma: Heterogeneity, Intercellular Crosstalk and Molecular Signature of Invasiveness and Progression. Biomedicines 2022, 10, 806. [Google Scholar] [CrossRef] [PubMed]
- Ramirez-Exposito, M.J.; Martinez-Martos, J.M. The Delicate Equilibrium between Oxidants and Antioxidants in Brain Glioma. Curr. Neuropharmacol. 2019, 17, 342–351. [Google Scholar] [CrossRef] [PubMed]
- Kong, Q.; Beel, J.A.; Lillehei, K.O. A threshold concept for cancer therapy. Med. Hypotheses 2000, 55, 29–35. [Google Scholar] [CrossRef] [PubMed]
- Olivier, C.; Oliver, L.; Lalier, L.; Vallette, F.M. Drug Resistance in Glioblastoma: The Two Faces of Oxidative Stress. Front. Mol. Biosci. 2020, 7, 620677. [Google Scholar] [CrossRef]
- Liu, S.; Dong, L.; Shi, W.; Zheng, Z.; Liu, Z.; Meng, L.; Xin, Y.; Jiang, X. Potential targets and treatments affect oxidative stress in gliomas: An overview of molecular mechanisms. Front. Pharmacol. 2022, 13, 921070. [Google Scholar] [CrossRef]
- Wan, S.-S.; Pan, Y.-M.; Yang, W.-J.; Rao, Z.-Q.; Yang, Y.-N. Inhibition of EZH2 alleviates angiogenesis in a model of corneal neovascularization by blocking FoxO3a-mediated oxidative stress. FASEB J. 2020, 34, 10168–10181. [Google Scholar] [CrossRef]
- Xu, W.; Yan, Z.; Hu, F.; Wei, W.; Yang, C.; Sun, Z. Long non-coding RNA GAS5 accelerates oxidative stress in melanoma cells by rescuing EZH2-mediated CDKN1C downregulation. Cancer Cell Int. 2020, 20, 116. [Google Scholar] [CrossRef]
- Loh, C.-Y.; Chai, J.-Y.; Tang, T.-F.; Wong, W.-F.; Sethi, G.; Shanmugam, M.K.; Chong, P.P.; Looi, C.Y. The E-Cadherin and N-Cadherin Switch in Epithelial-to-Mesenchymal Transition: Signaling, Therapeutic Implications, and Challenges. Cells 2019, 8, 1118. [Google Scholar] [CrossRef]
- Majc, B.; Sever, T.; Zaric, M.; Breznik, B.; Turk, B.; Lah, T.T. Epithelial-to-mesenchymal transition as the driver of changing carcinoma and glioblastoma microenvironment. Biochim. Biophys. Acta Mol. Cell Res. 2020, 1867, 118782. [Google Scholar] [CrossRef]
- Azevedo Martins, J.M.; Rabelo-Santos, S.H.; do Amaral Westin, M.C.; Zeferino, L.C. Tumoral and stromal expression of MMP-2, MMP-9, MMP-14, TIMP-1, TIMP-2, and VEGF-A in cervical cancer patient survival: A competing risk analysis. BMC Cancer 2020, 20, 660. [Google Scholar] [CrossRef] [PubMed]
- Kessenbrock, K.; Plaks, V.; Werb, Z. Matrix metalloproteinases: Regulators of the tumor microenvironment. Cell 2010, 141, 52–67. [Google Scholar] [CrossRef] [PubMed]
- Domagala, J.; Lachota, M.; Klopotowska, M.; Graczyk-Jarzynka, A.; Domagala, A.; Zhylko, A.; Soroczynska, K.; Winiarska, M. The Tumor Microenvironment—A Metabolic Obstacle to NK Cells’ Activity. Cancers 2020, 12, 3542. [Google Scholar] [CrossRef] [PubMed]
- Cuperlovic-Culf, M.; Khieu, N.H.; Surendra, A.; Hewitt, M.; Charlebois, C.; Sandhu, J.K. Analysis and Simulation of Glioblastoma Cell Lines-Derived Extracellular Vesicles Metabolome. Metabolites 2020, 10, 88. [Google Scholar] [CrossRef]
- Maszczyk, M.; Banach, K.; Karkoszka, M.; Rzepka, Z.; Rok, J.; Beberok, A.; Wrześniok, D. Chemosensitization of U-87 MG Glioblastoma Cells by Neobavaisoflavone towards Doxorubicin and Etoposide. Int. J. Mol. Sci. 2022, 23, 5621. [Google Scholar] [CrossRef]
- Campolo, M.; Lanza, M.; Casili, G.; Paterniti, I.; Filippone, A.; Caffo, M.; Cardali, S.; Puliafito, I.; Colarossi, C.; Raciti, G.; et al. TAK1 Inhibitor Enhances the Therapeutic Treatment for Glioblastoma. Cancers 2020, 13, 41. [Google Scholar] [CrossRef]
- Scuderi, S.A.; Casili, G.; Filippone, A.; Lanza, M.; Basilotta, R.; Giuffrida, R.; Munaò, S.; Colarossi, L.; Capra, A.P.; Esposito, E.; et al. Beneficial effect of KYP-2047, a propyl-oligopeptidase inhibitor, on oral squamous cell carcinoma. Oncotarget 2021, 12, 2459–2473. [Google Scholar] [CrossRef]
- Scuderi, S.A.; Casili, G.; Ardizzone, A.; Forte, S.; Colarossi, L.; Sava, S.; Paterniti, I.; Esposito, E.; Cuzzocrea, S.; Campolo, M. KYP-2047, an Inhibitor of Prolyl-Oligopeptidase, Reduces GlioBlastoma Proliferation through Angiogenesis and Apoptosis Modulation. Cancers 2021, 13, 3444. [Google Scholar] [CrossRef]
- Lanza, M.; Filippone, A.; Ardizzone, A.; Casili, G.; Paterniti, I.; Esposito, E.; Campolo, M. SCFA Treatment Alleviates Pathological Signs of Migraine and Related Intestinal Alterations in a Mouse Model of NTG-Induced Migraine. Cells 2021, 10, 2756. [Google Scholar] [CrossRef]
- Casili, G.; Campolo, M.; Lanza, M.; Filippone, A.; Scuderi, S.; Messina, S.; Ardizzone, A.; Esposito, E.; Paterniti, I. Role of ABT888, a Novel Poly(ADP-Ribose) Polymerase (PARP) Inhibitor in Countering Autophagy and Apoptotic Processes Associated to Spinal Cord Injury. Mol. Neurobiol. 2020, 57, 4394–4407. [Google Scholar] [CrossRef]
- Filippone, A.; Lanza, M.; Campolo, M.; Casili, G.; Paterniti, I.; Cuzzocrea, S.; Esposito, E. Protective effect of sodium propionate in Abeta1-42—Induced neurotoxicity and spinal cord trauma. Neuropharmacology 2020, 166, 107977. [Google Scholar] [CrossRef]
- Scuderi, S.A.; Lanza, M.; Casili, G.; Esposito, F.; Colarossi, C.; Giuffrida, D.; Irene, P.; Cuzzocrea, S.; Esposito, E.; Campolo, M. TBK1 Inhibitor Exerts Antiproliferative Effect on Glioblastoma Multiforme Cells. Oncol. Res. 2021, 28, 779–790. [Google Scholar] [CrossRef]


Publisher’s Note: MDPI stays neutral with regard to jurisdictional claims in published maps and institutional affiliations. |
© 2022 by the authors. Licensee MDPI, Basel, Switzerland. This article is an open access article distributed under the terms and conditions of the Creative Commons Attribution (CC BY) license (https://creativecommons.org/licenses/by/4.0/).
Share and Cite
Scuderi, S.A.; Filippone, A.; Basilotta, R.; Mannino, D.; Casili, G.; Capra, A.P.; Chisari, G.; Colarossi, L.; Sava, S.; Campolo, M.; et al. GSK343, an Inhibitor of Enhancer of Zeste Homolog 2, Reduces Glioblastoma Progression through Inflammatory Process Modulation: Focus on Canonical and Non-Canonical NF-κB/IκBα Pathways. Int. J. Mol. Sci. 2022, 23, 13915. https://doi.org/10.3390/ijms232213915
Scuderi SA, Filippone A, Basilotta R, Mannino D, Casili G, Capra AP, Chisari G, Colarossi L, Sava S, Campolo M, et al. GSK343, an Inhibitor of Enhancer of Zeste Homolog 2, Reduces Glioblastoma Progression through Inflammatory Process Modulation: Focus on Canonical and Non-Canonical NF-κB/IκBα Pathways. International Journal of Molecular Sciences. 2022; 23(22):13915. https://doi.org/10.3390/ijms232213915
Chicago/Turabian StyleScuderi, Sarah Adriana, Alessia Filippone, Rossella Basilotta, Deborah Mannino, Giovanna Casili, Anna Paola Capra, Giulia Chisari, Lorenzo Colarossi, Serena Sava, Michela Campolo, and et al. 2022. "GSK343, an Inhibitor of Enhancer of Zeste Homolog 2, Reduces Glioblastoma Progression through Inflammatory Process Modulation: Focus on Canonical and Non-Canonical NF-κB/IκBα Pathways" International Journal of Molecular Sciences 23, no. 22: 13915. https://doi.org/10.3390/ijms232213915
APA StyleScuderi, S. A., Filippone, A., Basilotta, R., Mannino, D., Casili, G., Capra, A. P., Chisari, G., Colarossi, L., Sava, S., Campolo, M., Esposito, E., & Paterniti, I. (2022). GSK343, an Inhibitor of Enhancer of Zeste Homolog 2, Reduces Glioblastoma Progression through Inflammatory Process Modulation: Focus on Canonical and Non-Canonical NF-κB/IκBα Pathways. International Journal of Molecular Sciences, 23(22), 13915. https://doi.org/10.3390/ijms232213915