Article

Comparative Analysis of Whole Chloroplast Genomes of Three Common Species of Echinochloa (Gramineae) in Paddy Fields

Eco-Environmental Protection Research Institute, Shanghai Academy of Agricultural Sciences, Shanghai 201403, China
*
Author to whom correspondence should be addressed.
Int. J. Mol. Sci. 2022, 23(22), 13864; https://doi.org/10.3390/ijms232213864
Submission received: 25 September 2022 / Revised: 30 October 2022 / Accepted: 6 November 2022 / Published: 10 November 2022
(This article belongs to the Special Issue Plant Genomics and Genome Editing 2.0)

Abstract

:
Echinochloa crus-galli var. crus-galli, E. crus-galli var. zelayensis, and E. glabrescens, morphologically similar at the seedling stage, are the most pernicious barnyard grass species in paddy fields worldwide. Chloroplast (cp) genomes could be conducive to their identification. In this study, we assembled the complete cp genome sequences of Echinochloa crus-galli var. crus-galli (139,856 bp), E. crus-galli var. zelayensis (139,874 bp), and E. glabrescens (139,874 bp), which exhibited a typical circular tetramerous structure, large and small single-copy regions, and a pair of inverted repeats. In Echinochloa crus-galli var. crus-galli, there were 136 simple sequence (SSRs) and 62 long (LRs) repeats, and in the other two species, 139 SSRs and 68 LRs. Each cp genome contains 92 protein-encoding genes. In Echinochloa crus-galli var. crus-galli and E. glabrescens, 321 and 1 single-nucleotide polymorphisms were detected compared to Echinochloa crus-galli var. zelayensis. IR expansion and contraction revealed small differences between the three species. The phylogenetic tree based on cp genomes demonstrated the phylogenetic relationship between ten barnyard grass species and other common Gramineae plants, showing new genetic relationships of the genus Echinochloa. This study provides valuable information on cp genomes, useful for identifying and classifying the genus Echinochloa and studying its phylogenetic relationships and evolution.

1. Introduction

The genus Echinochloa Beauv (barnyard grass) is an annual or perennial gramineous plant widely distributed worldwide. This genus contains approximately 50 of the most pernicious weed species in global crops, especially in rice (Oryza sativa) fields [1,2,3,4], where they are very successful competitors, mainly because their ecological evolution is similar to that of rice [5,6]. The rice yield reduction caused by the wanton occurrence of barnyard grass may be very serious, making it the most troublesome weed for rice farmers [7,8]. Echinochloa crus-galli (L.) P. Beauv, E. crus-galli var. zelayensis (Kunth) Hitchc., and E. glabrescens Munro ex Hook. f. are the most common weeds in the middle and lower reaches of the Yangtze River, China, one of which often forms a dominant species in paddy fields. These three barnyard grass species are very similar in morphology at the seedling stage and can hardly be identified unless they are in heading stage. However, there are differences in the sensitivity to herbicides among different barnyard grass species [9,10], and the seedling stage of barnyard grass is the key management period. Therefore, it is important to identify the type of barnyard grass at the seedling stage.
Presently, the classification of the genus Echinochloa is mainly based on external forms such as spikes, small ears, awn length, and seed morphology [11,12]. However, external forms cannot distinguish many types of barnyard grass [13]. Several scholars believe that studying chromosomes and biochemical data helps identify barnyard grass species because the chromosome number of different barnyard grass species is not similar, and the number of chromosomes of some barnyard grass species is 2n = 54, while others are 2n = 36 [14,15,16]. With the rapid development of molecular biology techniques, new techniques have been applied to identify barnyard grass species. Inter-simple sequence repeat (ISSR) has also been widely used for genetic diversity analysis and germplasm identification [17,18]. Lu et al. performed molecular identification of 53 samples of barnyard grass species collected from 14 provinces and regions in China using ISSR technology and showed that the taxa of barnyard grass in rice areas have a certain genetic basis [19]. Yamaguchi et al. used the non-coding gene sequence trnt-l-f to investigate the molecular system of barnyard grass species in East Asia and divided the nine barnyard grass species into five groups [13]. In summary, this genus has no unified and widely recognized classification standard. Wu et al. conducted an in-depth analysis of the genetic evolution of barnyard grass as a weed and an orphan crop through genomics, showing its complex role in evolution [20]. In addition, owing to different agricultural farming methods, crop growth characteristics, geographical location, and herbicide use, barnyard grass from different regions also have many differences in seed germination rate, flowering time, leaf area, plant height, spikelet length, aboveground biomass, root weight, and seed quantity [21,22], which further complicates the classification of barnyard grass.
Chloroplasts (cps), organelles in photosynthetic plants or algae, contain genetic material, and their genomes are highly conserved because of haploidy, uniparental inheritance, and no recombination, providing abundant evolutionary information [23,24,25,26]. In addition, the cp genome is small and easy to obtain completely compared to the nuclear genome; therefore, its research is worthy in species identification, population genetics, and phylogeny [27]. Due to these common characteristics, identifying and analyzing ribosomal tissues in chloroplast systems has become an important method for solving plant phylogeny and evaluating biodiversity [28,29,30]. The cp genome has a typical quadripartite structure, large single-copy (LSC) and small single-copy (SSC) regions separated by the region of inverted repeats (IRs), which are a pair of sequences with opposite orientations, named IRa and IRb [31,32,33,34,35]. Sequences between the IRa and IRb regions can generate triggered flip-flop recombination, stabilizing single-copy regions [36]. Studies have shown that plant cp genomes are particularly helpful in characterizing the phylogeny and history of most plant lineages in reticular evolution (hybridization) and polyploidy [37,38,39]. With the development of chloroplast genome sequencing technology and an in-depth understanding of chloroplast genomes by researchers, the genetic relationships of many plant species have been clarified, such as the genera Camellia, Taxodium, and Pterocarpus [27,36,40]. To date, information regarding the phylogenetic relationship and evolutionary direction of the genus Echinochloa based on chloroplasts has been limited.
In this study, the cp genomes of E. crus-galli var. zelayensis and E. glabrescens were sequenced for the first time. This is also the first complete analysis and comparison of the cp genomes of three common Echinochloa weeds, E. crus-galli var. crus-galli, E. crus-galli var. zelayensis, and E. glabrescens, collected in paddy fields, which provides a convenient method for the identification of these three morphologically consistent plants and is also beneficial in identifying the choice of herbicides for individual weeds. Simultaneously, this study also conducted a systematic development analysis of the cp genome of many Echinochloa species in the NCBI database, which provides a theoretical basis for the regeneration of diversity and resource utilization of the genus Echinochloa.

2. Results

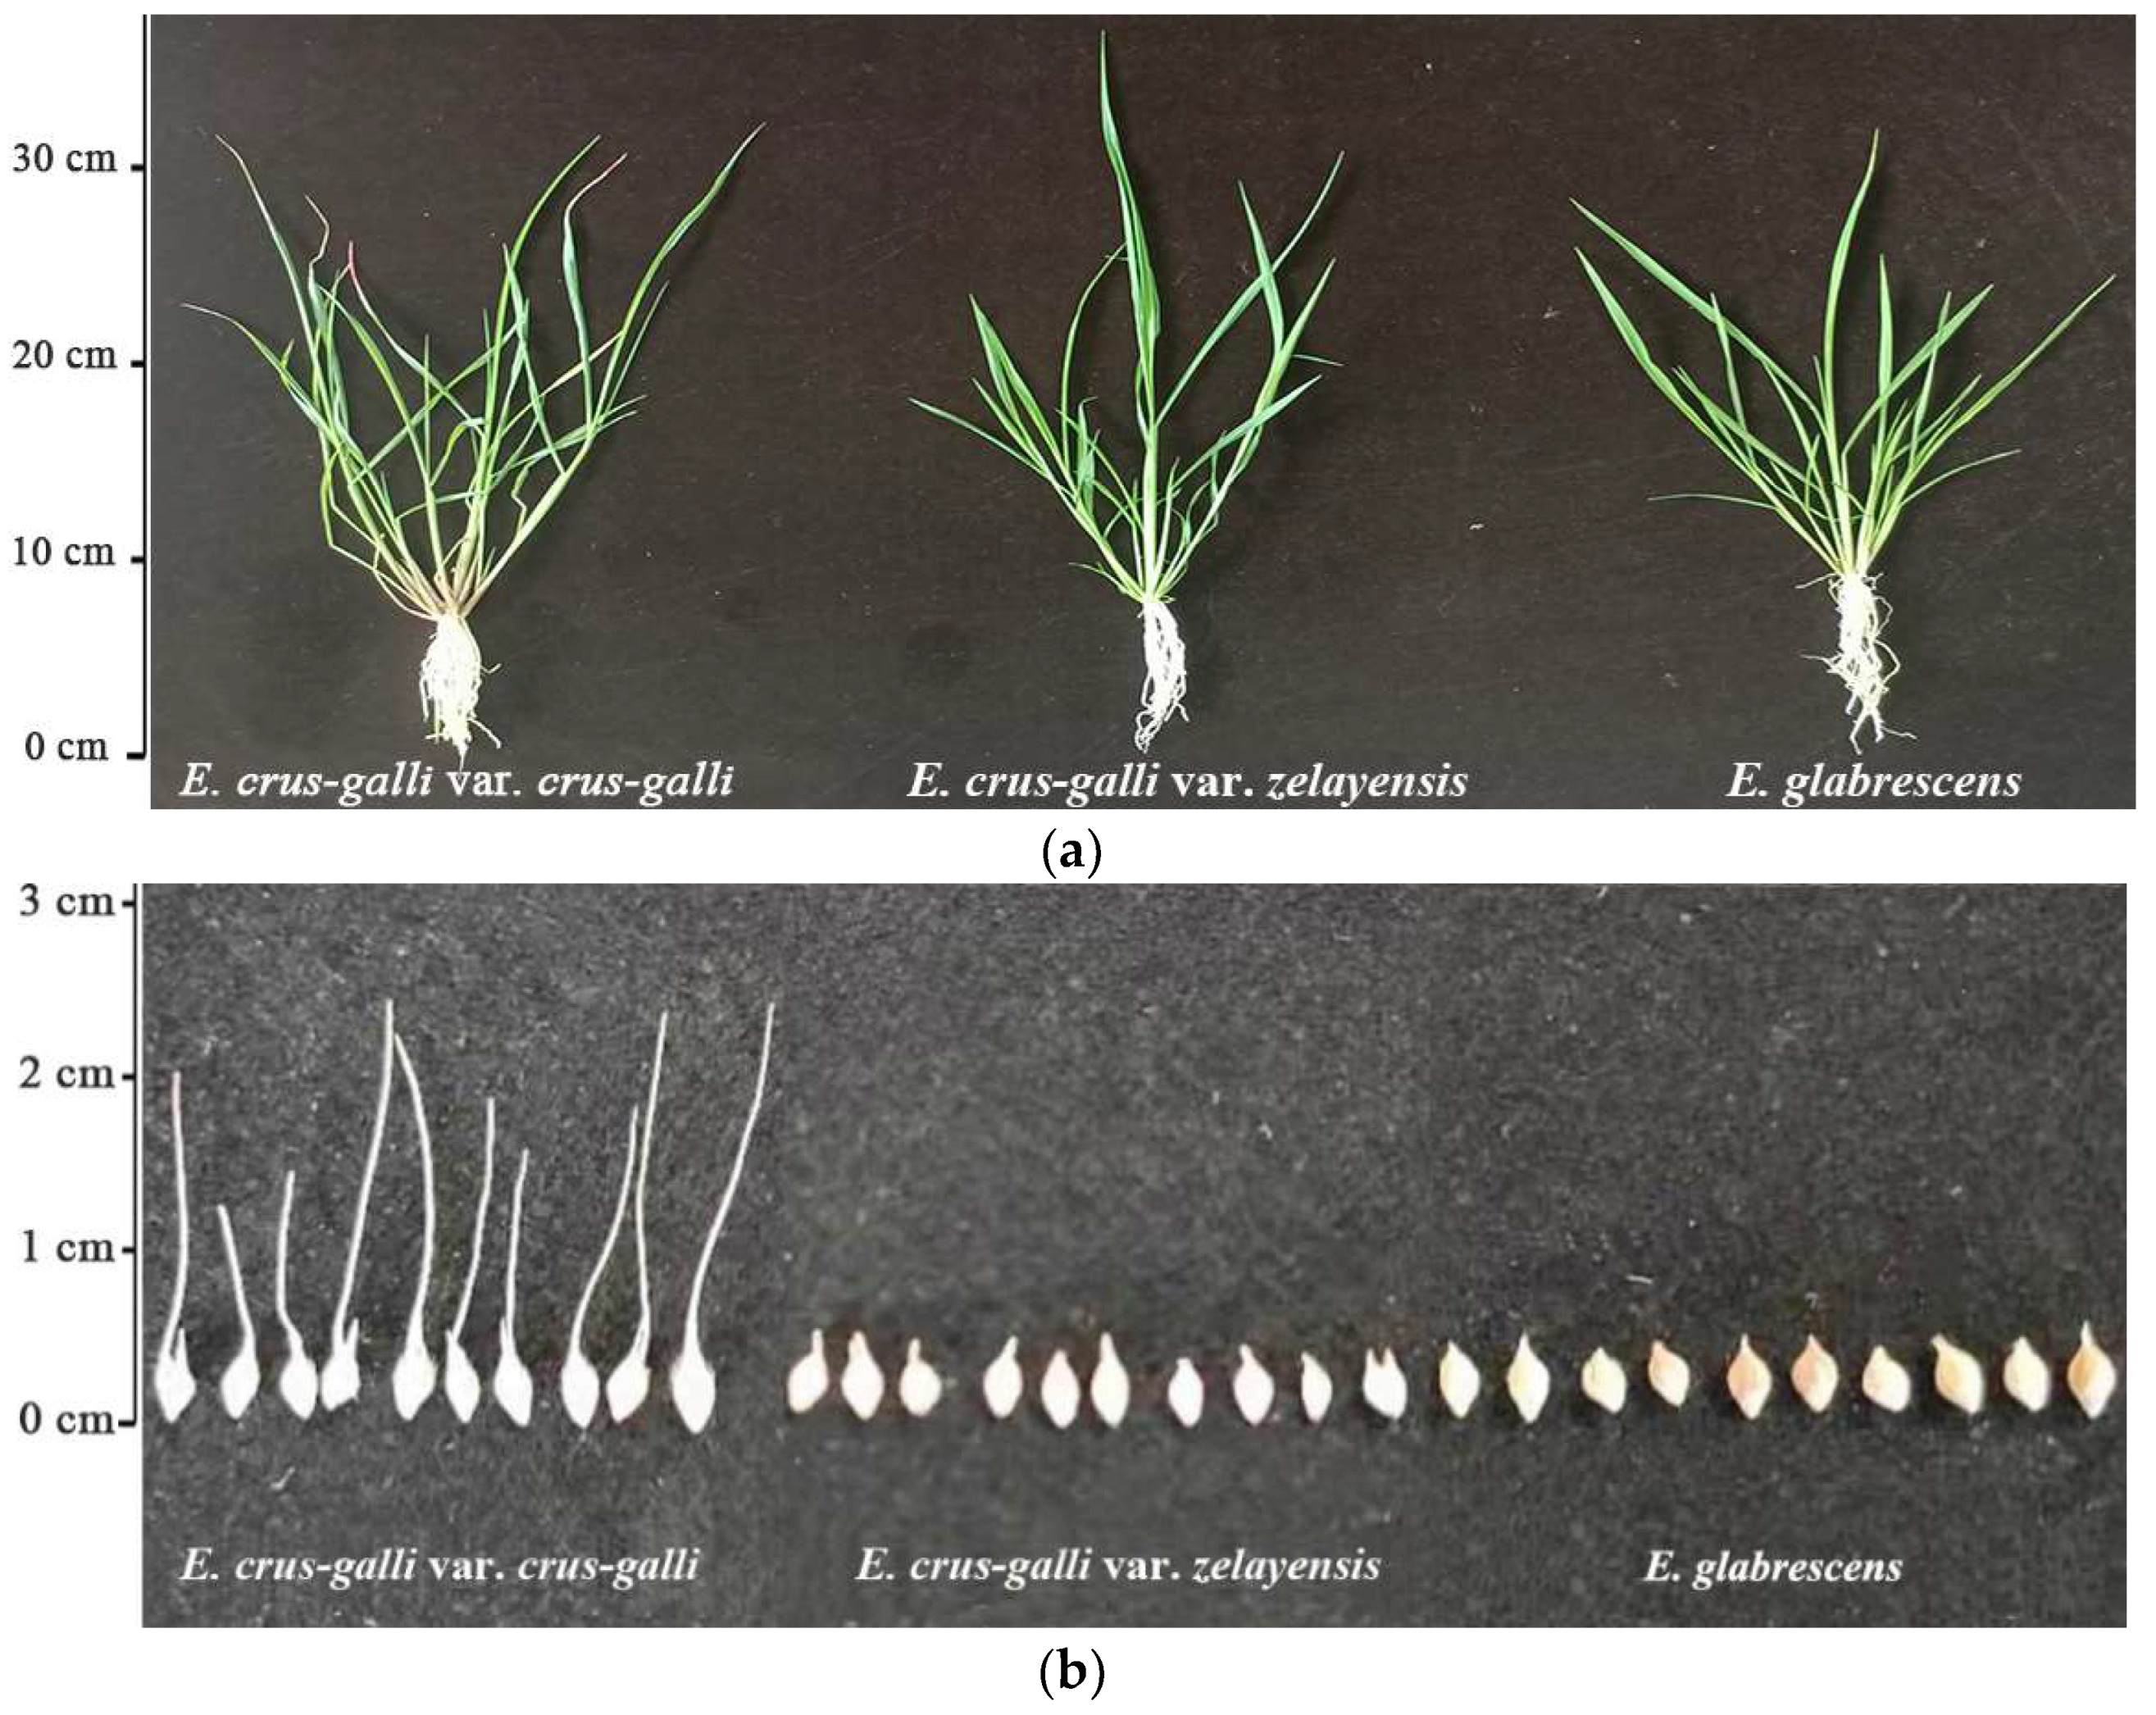
2.1. Differences in the Phenotype of Seeds

In this study, the awn length and dry weight per 1000 grains of the seeds of E. crus-galli var. crus-galli, E. crus-galli var. zelayensis, and E. glabrescens were determined (Figure 1). The awn length of the E. crus-galli var. crus-galli, E. crus-galli var. zelayensis, and E. glabrescens were 1.63, 0.00, and 0.00 cm, respectively (Table 1). The dry weight per 1000 seeds of E. crus-galli var. crus-galli, E. crus-galli var. zelayensis, and E. glabrescens were 2.806, 2.139, and 3.006 g, respectively (Table 1). The awn length of E. crus-galli var. crus-galli was significantly longer than those of the other two species (p < 0.05). In addition, the dry weight per 1000 seeds of E. glabrescens was significantly higher than those of the other two species (p < 0.05).

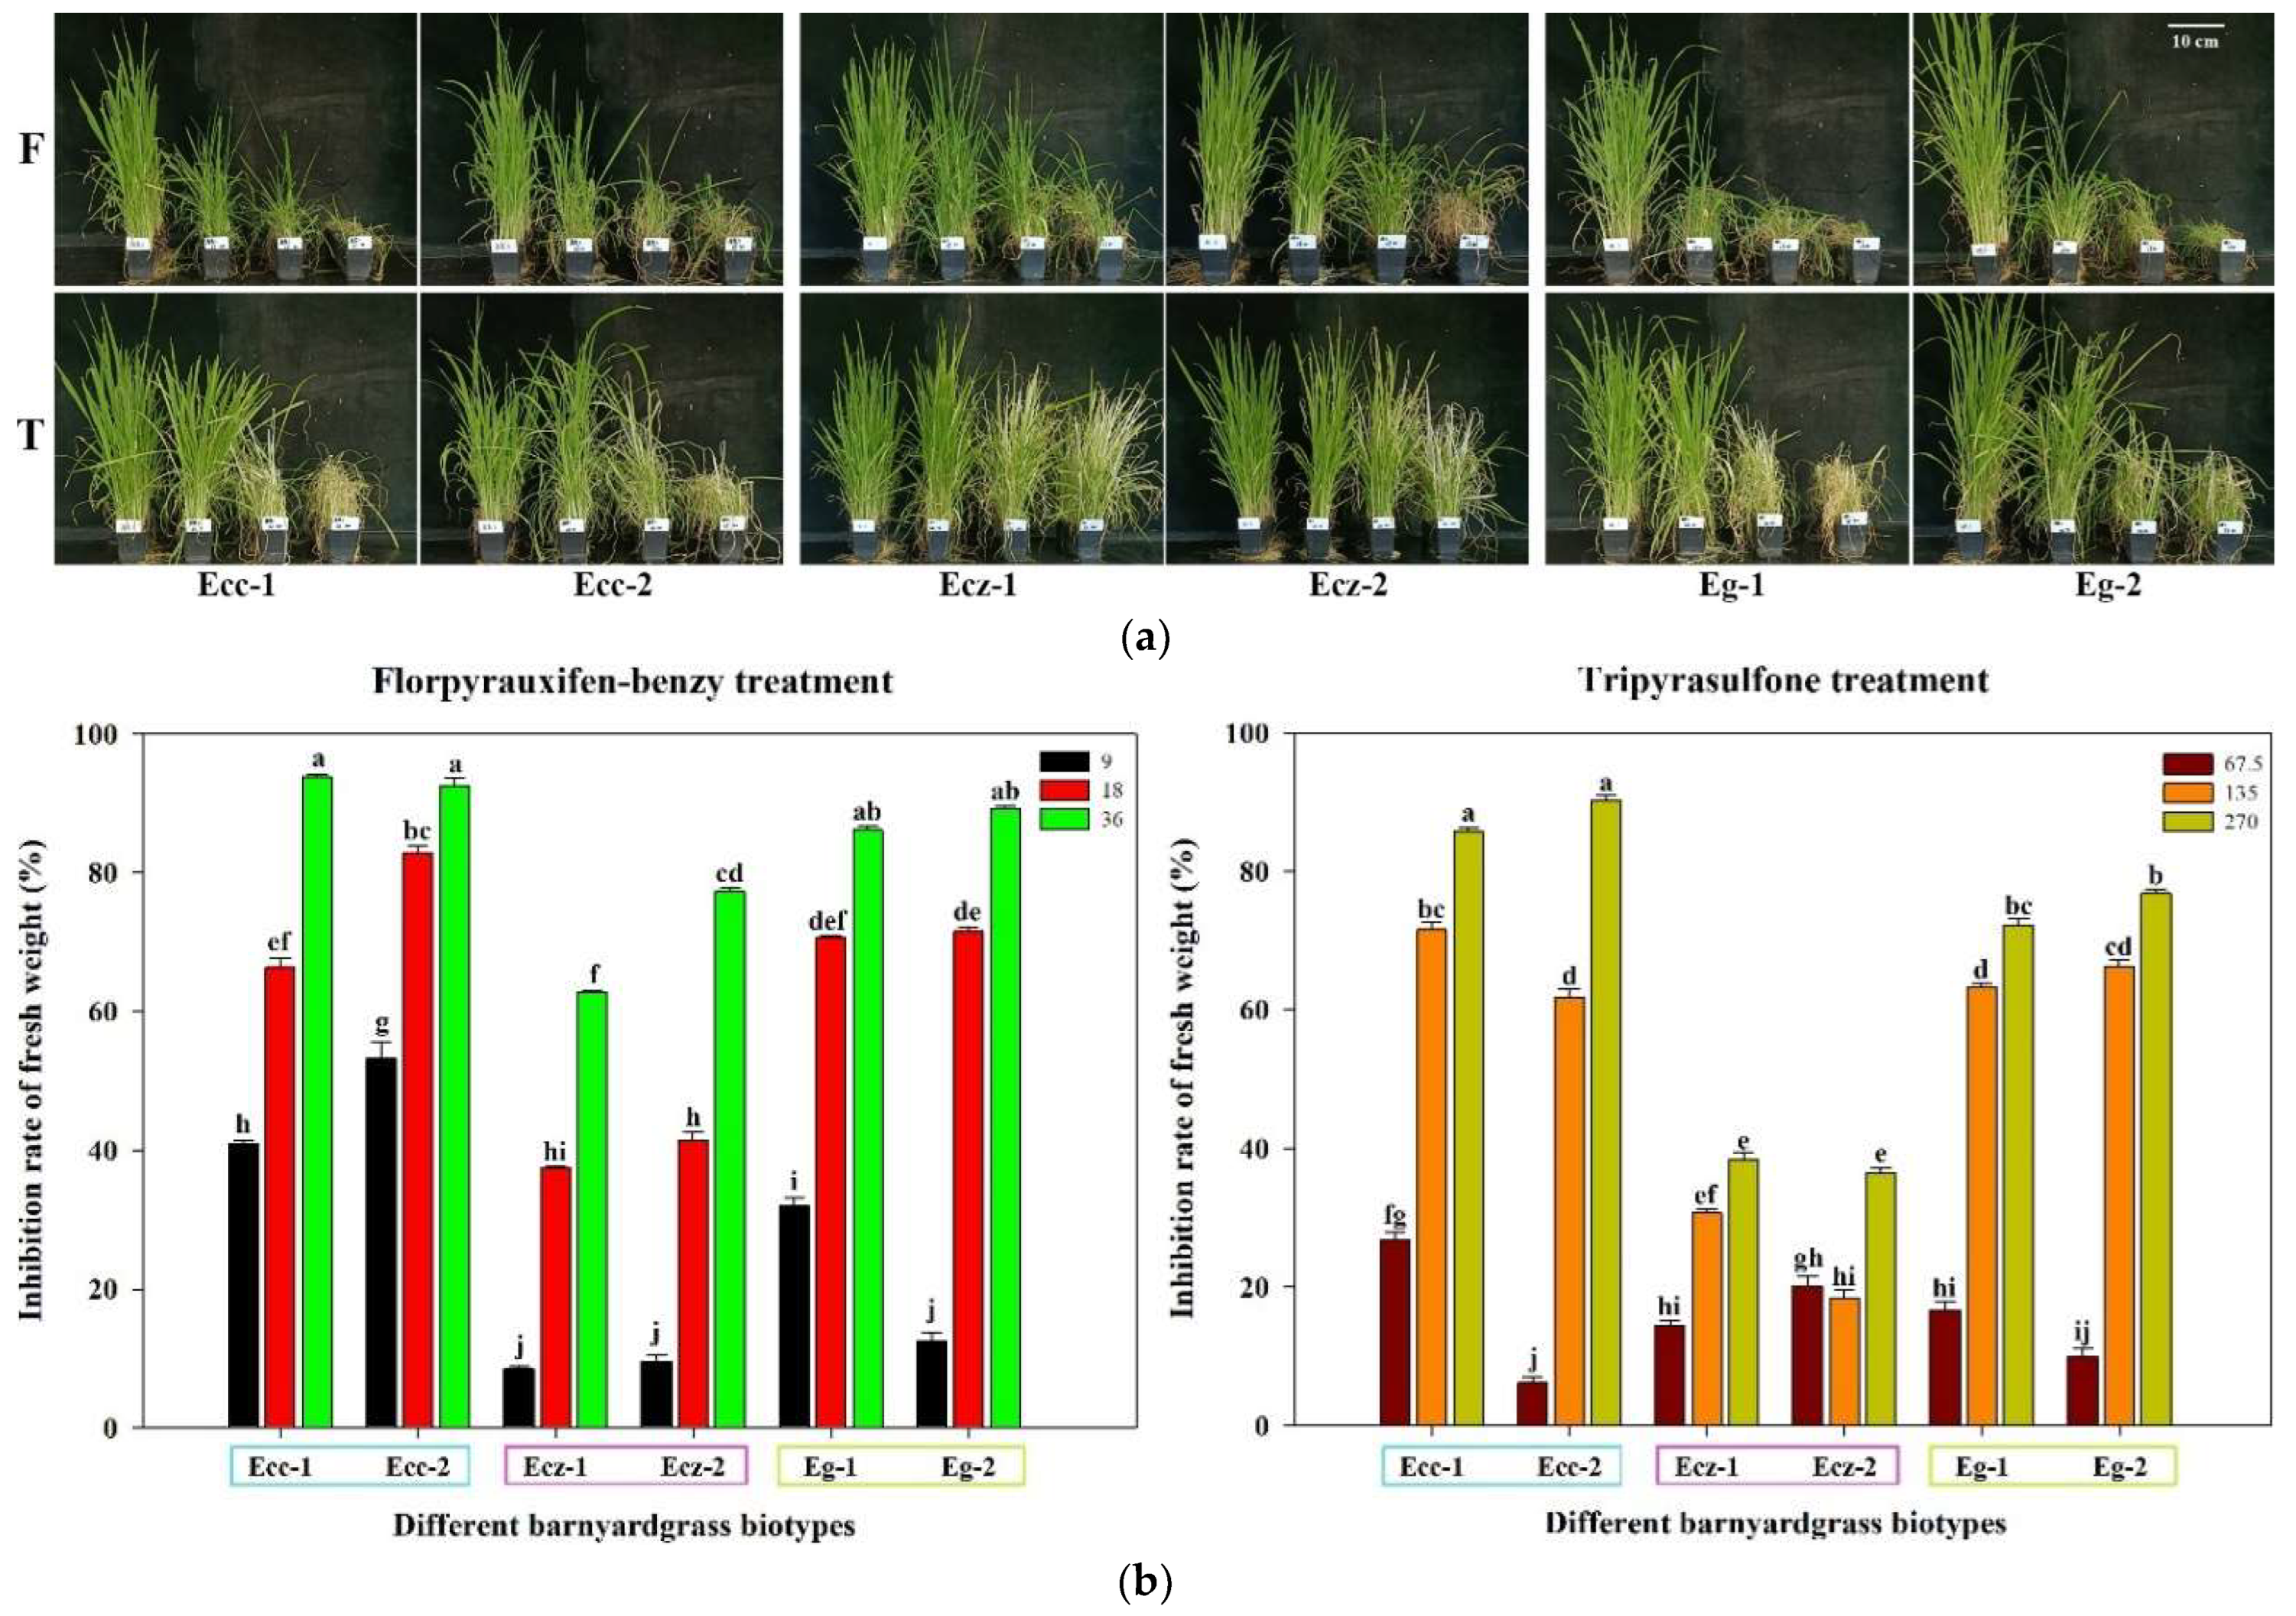
2.2. Differences in Sensitivity to New Herbicides

The sensitivity of three barnyard grass species to the new herbicides, florpyrauxifen-benzyl and tripyrasulfone, was tested. Three gradient doses of the same herbicide led to a gradient trend for each barnyard grass (Figure 2a). Florpyrauxifen-benzyl, at 36 g a.i./ha, inhibited more than 90% of the fresh weight of two E. crus-galli var. crus-galli populations, 80–90% of the fresh weight of two E. glabrescens populations, and less than 80% of the fresh weight of two E. crus-galli var. zelayensis populations. Tripyrasulfone, at 270 g a.i./ha, inhibited more than 90% of the fresh weight of two E. crus-galli var. crus-galli populations, 70–80% of the fresh weight of two E. glabrescens populations, and less than 40% of the fresh weight of two E. crus-galli var. zelayensis populations. The decrease in the fresh weight of E. crus-galli var. zelayensis caused by the highest and second highest doses of the two herbicides was significantly lower than that of the other four populations of E. crus-galli var. crus-galli and E. glabrescens (p < 0.05) (Figure 2b).

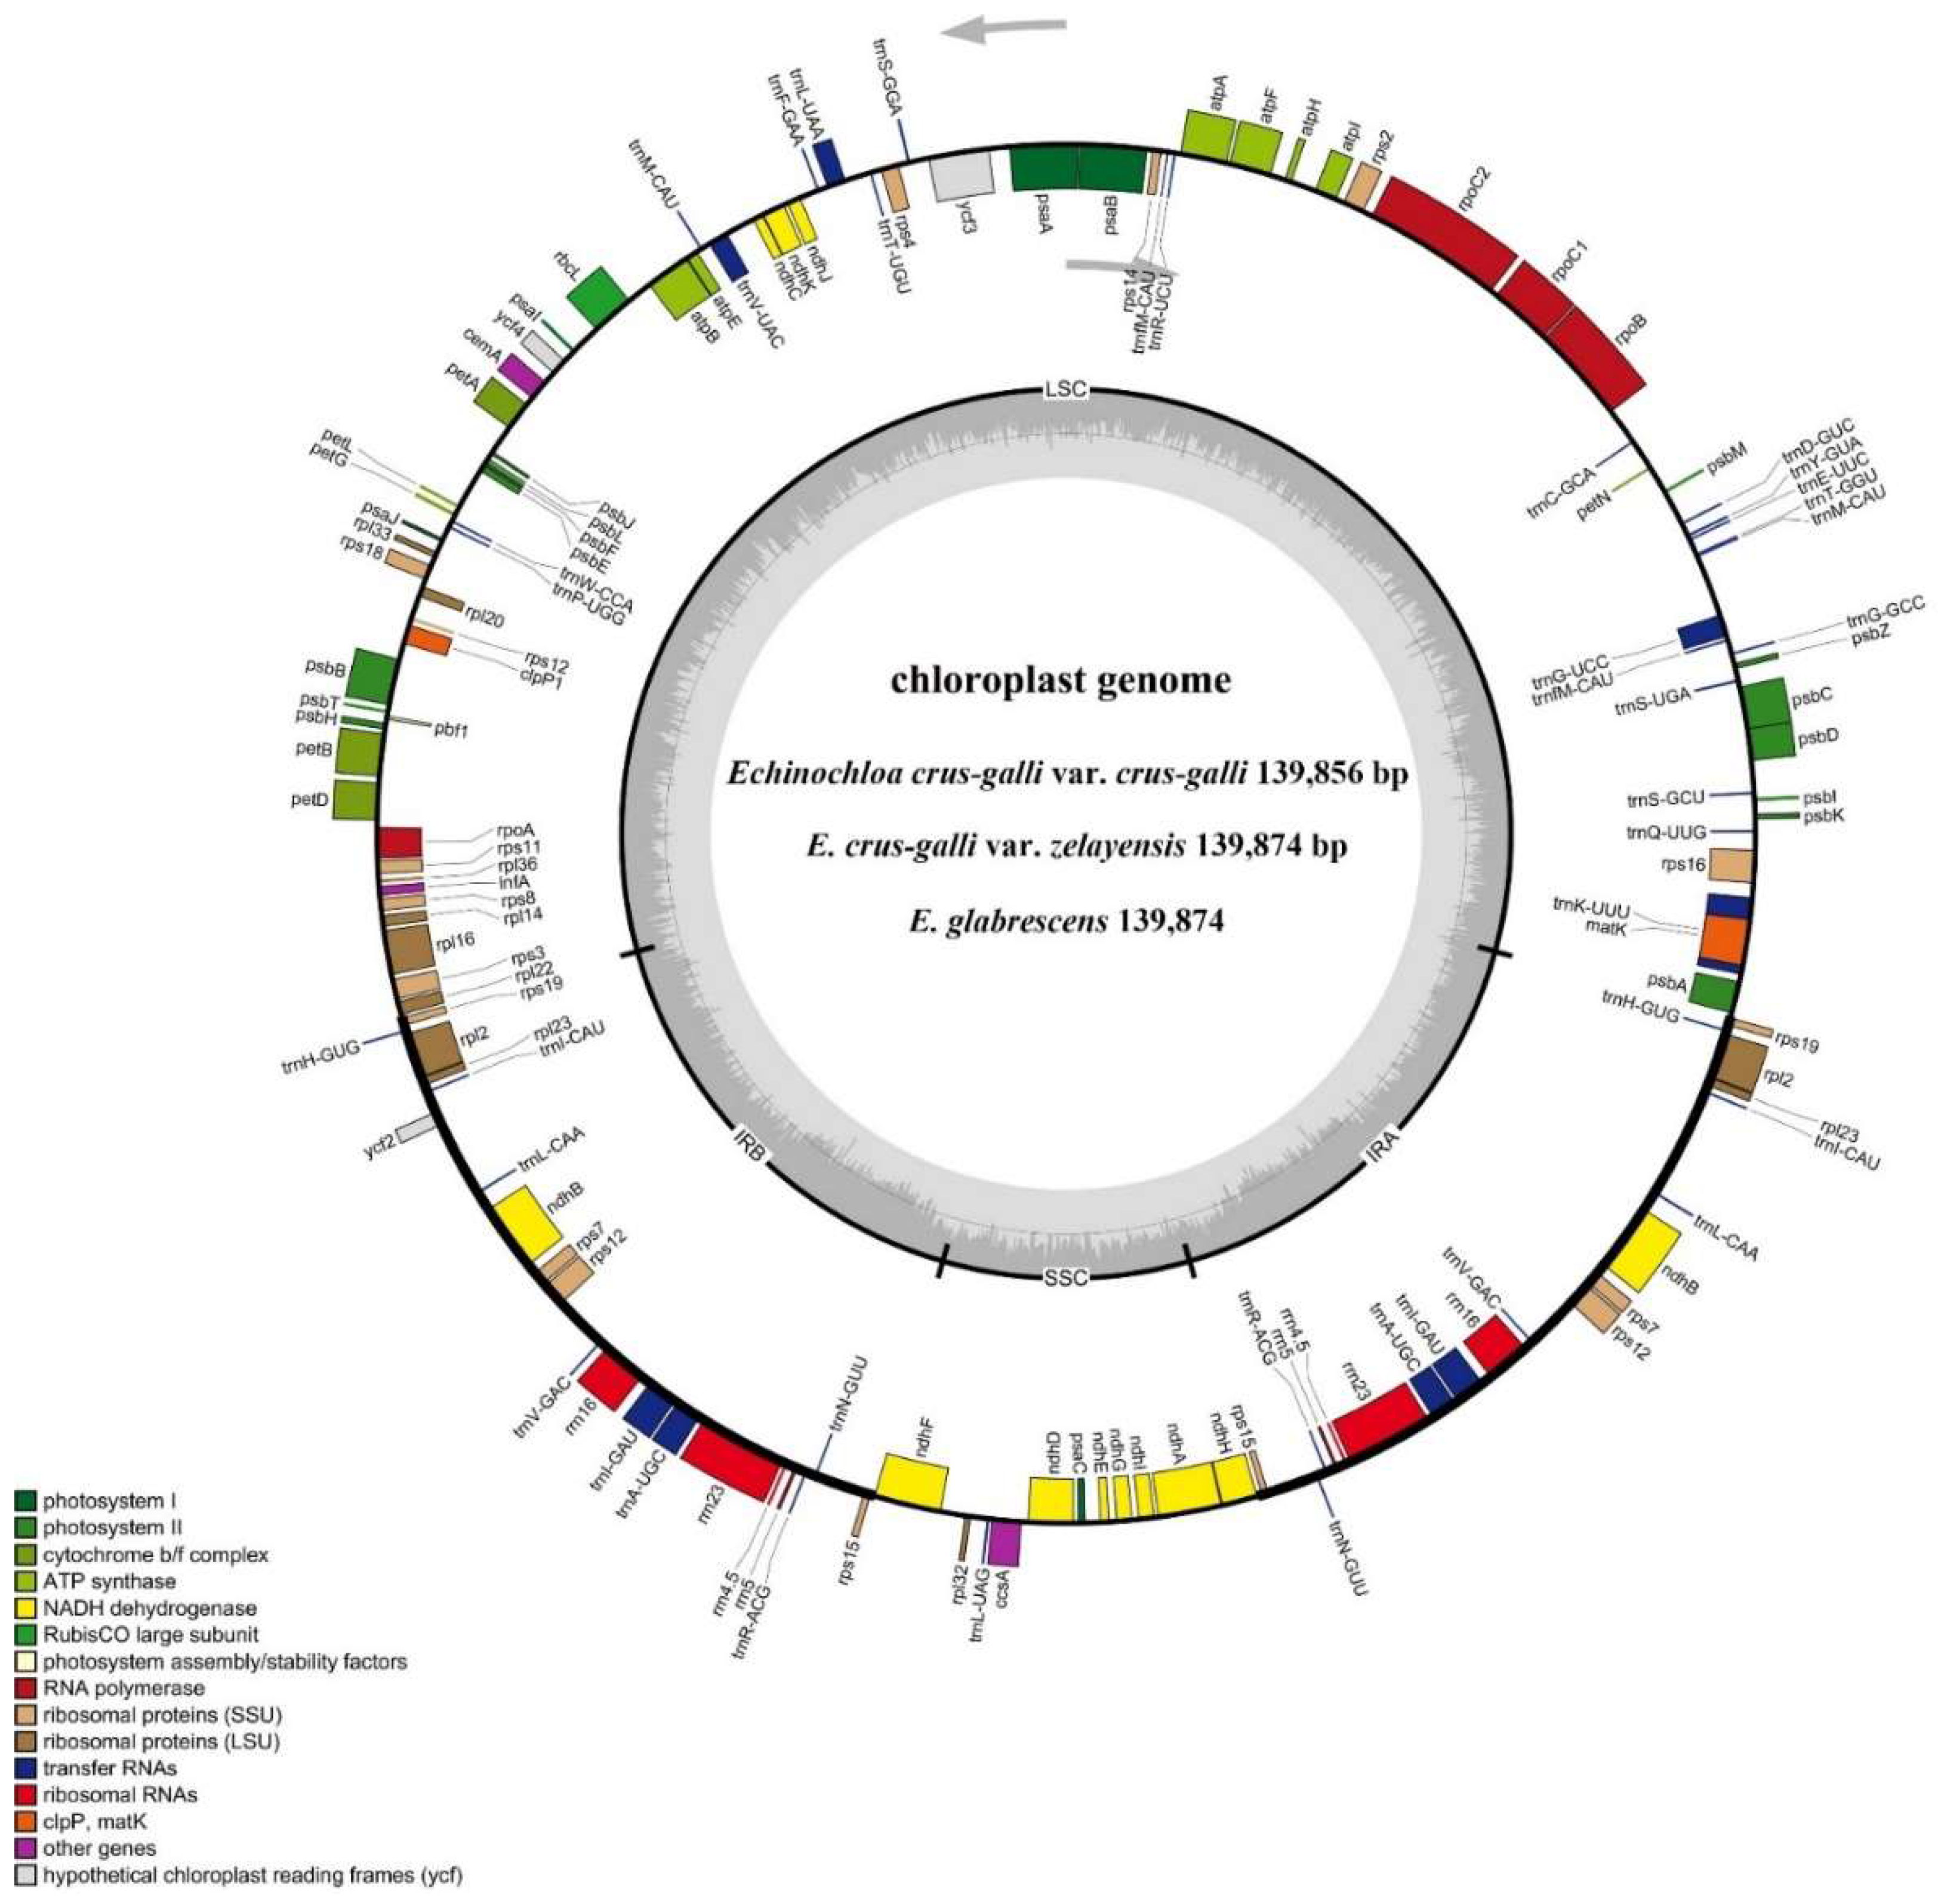
2.3. Characteristics of Chloroplast Genomes

The cp genome library of E. crus-galli var. crus-galli, E. crus-galli var. zelayensis, and E. glabrescens was constructed using the Illumina TruSeq Nano DNA Sample Prep Kit. After trimming low-quality fragments from the raw data, 51,498,928, 48,018,716, and 57,983,252 clean reads with 46.36%, 45.10%, and 45.51GC% were mapped to the complete genome of E. crus-galli var. crus-galli, E. crus-galli var. zelayensis, and E. glabrescens, respectively. The de novo assembly using NOVOPlasty v4.2 software (https://github.com/ndierckx/NOVOPlasty, accessed on 26 November 2021) resulted in a circular genome of 139,856, 139,874, and 139,874 bp in length (Figure 3). Raw reads were deposited in the NCBI GenBank database (accession number: PRJNA827798). All three complete cp genomes displayed the typical quadripartite structure of most angiosperms, including a large single-copy (LSC) and small single-copy (SSC) region, and a pair of inverted repeats (IRa and IRb). The lengths of the LSC and SSC regions, and IRs were 81,843, 12,517, and 22,748 bp in E. crus-galli var. crus-galli, and 81,890, 12,514, and 22,735 bp in E. crus-galli var. zelayensis and E. glabrescens; the intergenic region lengths were 79,775, 79,751, and 79,751 bp in E. crus-galli var. crus-galli, E. crus-galli var. zelayensis, and E. glabrescens, respectively. The cp genome of all three barnyard grass genes contained 132 genes, including 84 protein-coding genes (Table 2).

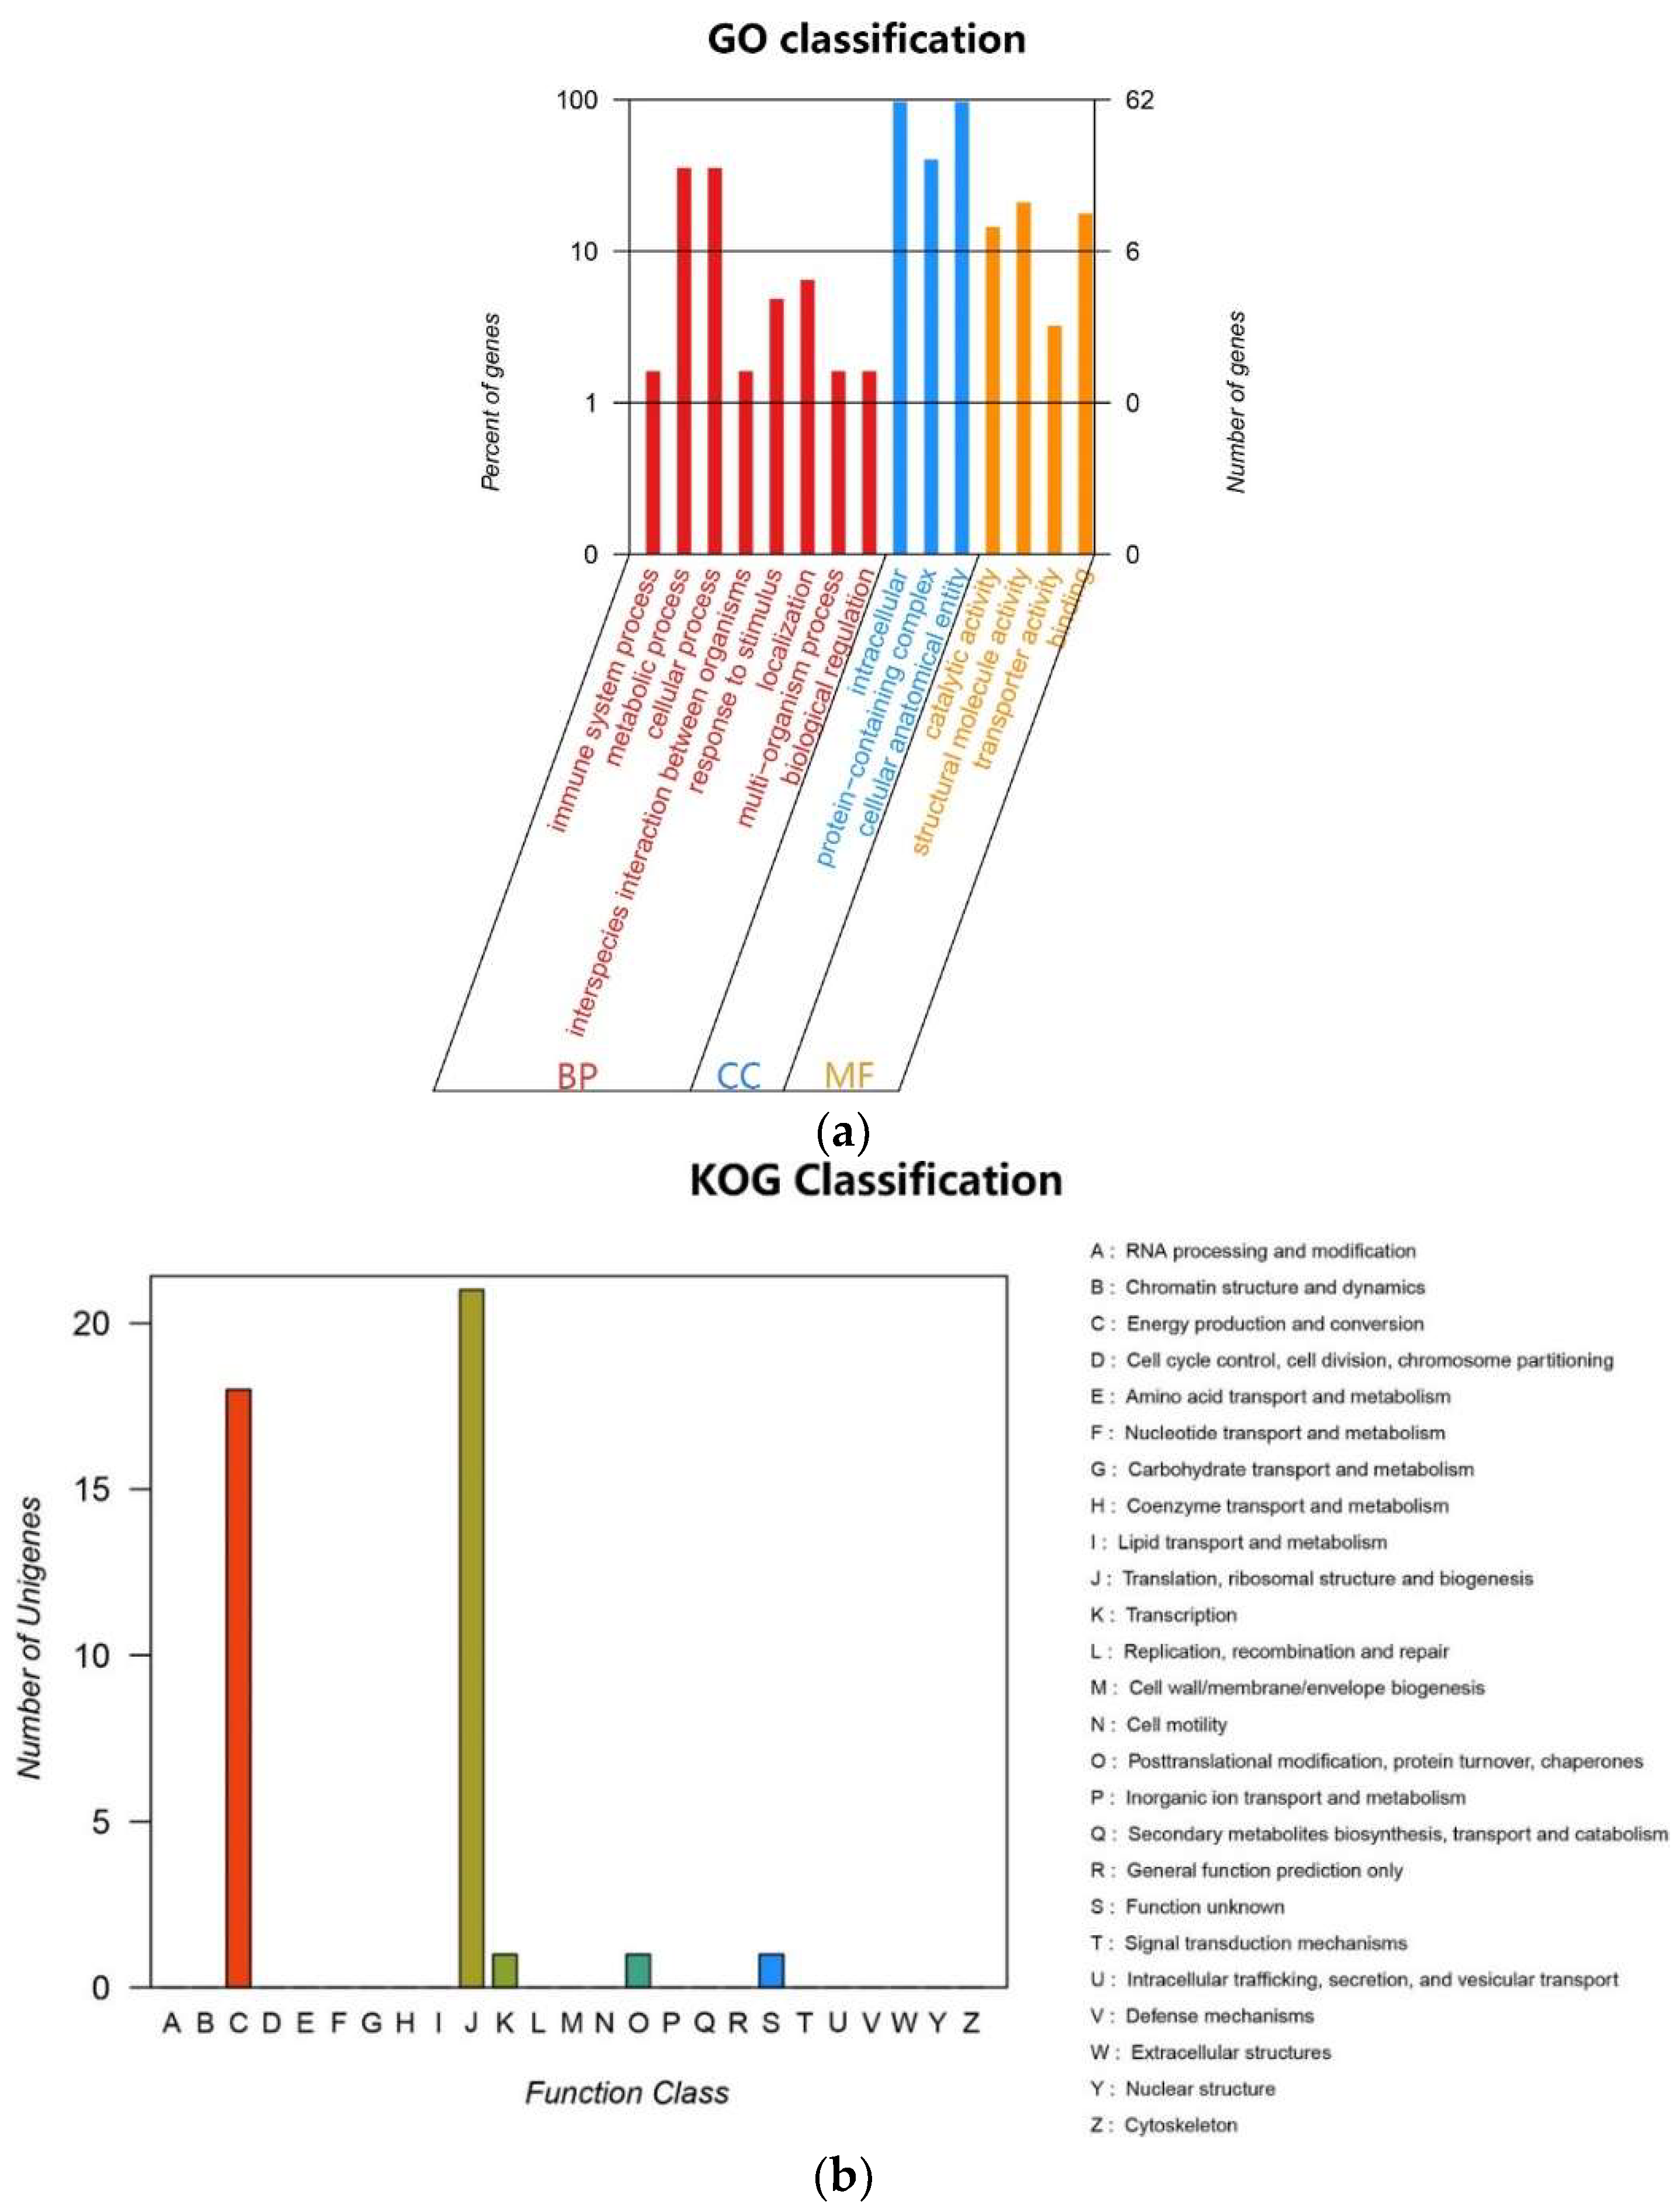
2.4. Chloroplast Genome Component

The cp genome of E. crus-galli var. crus-galli, E. crus-galli var. zelayensis, and E. glabrescens contained 40 transfer RNA (tRNA) genes and eight ribosomal RNA (rrn) (Table 3). There were 67 protein-coding and 27 tRNA genes located within the LSC region, 12 protein-coding genes, 10 tRNA-coding genes, and four rRNA-coding genes located within IRb or IRa, and 11 protein-coding and one tRNA gene located within the SSC region (Figure 3). All 84 genes encoding proteins in the cp genome of these three barnyard grass species were functionally annotated in this study, mainly belonging to the photosynthesis and self-replication categories. The gene names, groups, and categories are listed in Table 4. Genes mainly belonged to biological processes in GO (Figure 4a) and were mainly involved in energy production and conversion, translocation, ribosomal structure and biogenesis, and transcription pathways in KEGG (Figure 4b). A total of 136, 139, and 139 simple sequence repeats (SSRs) were identified in E. crus-galli var. crus-galli, E. crus-galli var. zelayensis, and E. glabrescens cp genomes. There were five SSRs on IRa or IRb, 110 SSRs on the LSC, and 16 SSRs on the SSC in E. crus-galli var. crus-galli, and five SSRs on IRa or IRb, 113 on the LSC, and 16 on the SSC in E. crus-galli var. zelayensis or E. glabrescens. There were 62 long repeats (LRs) in E. crus-galli var. crus-gall and 68 LRs in E. crus-galli var. zelayensis and E. glabrescens (Table 5).

2.5. Single-Nucleotide Polymorphism Analysis

Single-nucleotide polymorphism analysis was performed to further explore the DNA sequence polymorphisms and differences caused by single-nucleotide variations in E. crus-galli var. crus-galli, E. crus-galli var. zelayensis, and E. glabrescens. The results indicate that 321 SNPs were detected in E. crus-galli var. crus-galli, representing 223 in intergenic spacer (IGS) regions, 98 in CDS regions (Supporting Table S1), and only one SNP IGS region of the E. glabrescens cp genome, compared to E. crus-galli var. zelayensis (Table 6). One SNP appeared in the stop codon, and 76 synonymous mutations and 21 non-synonymous mutations in E. crus-galli var. crus-galli. A total of 21 non-synonymous mutations were found in 14 coding genes, including matK, psbC, rpoC1, rpoC2, atpF, atpE, rbcL, petA, petD, rpoA, rpl22, ndhF, ndhA, and ndhH (Supporting Table S1). The non-synonymous to synonymous substitution (dN/dS) ratio was 0.28.

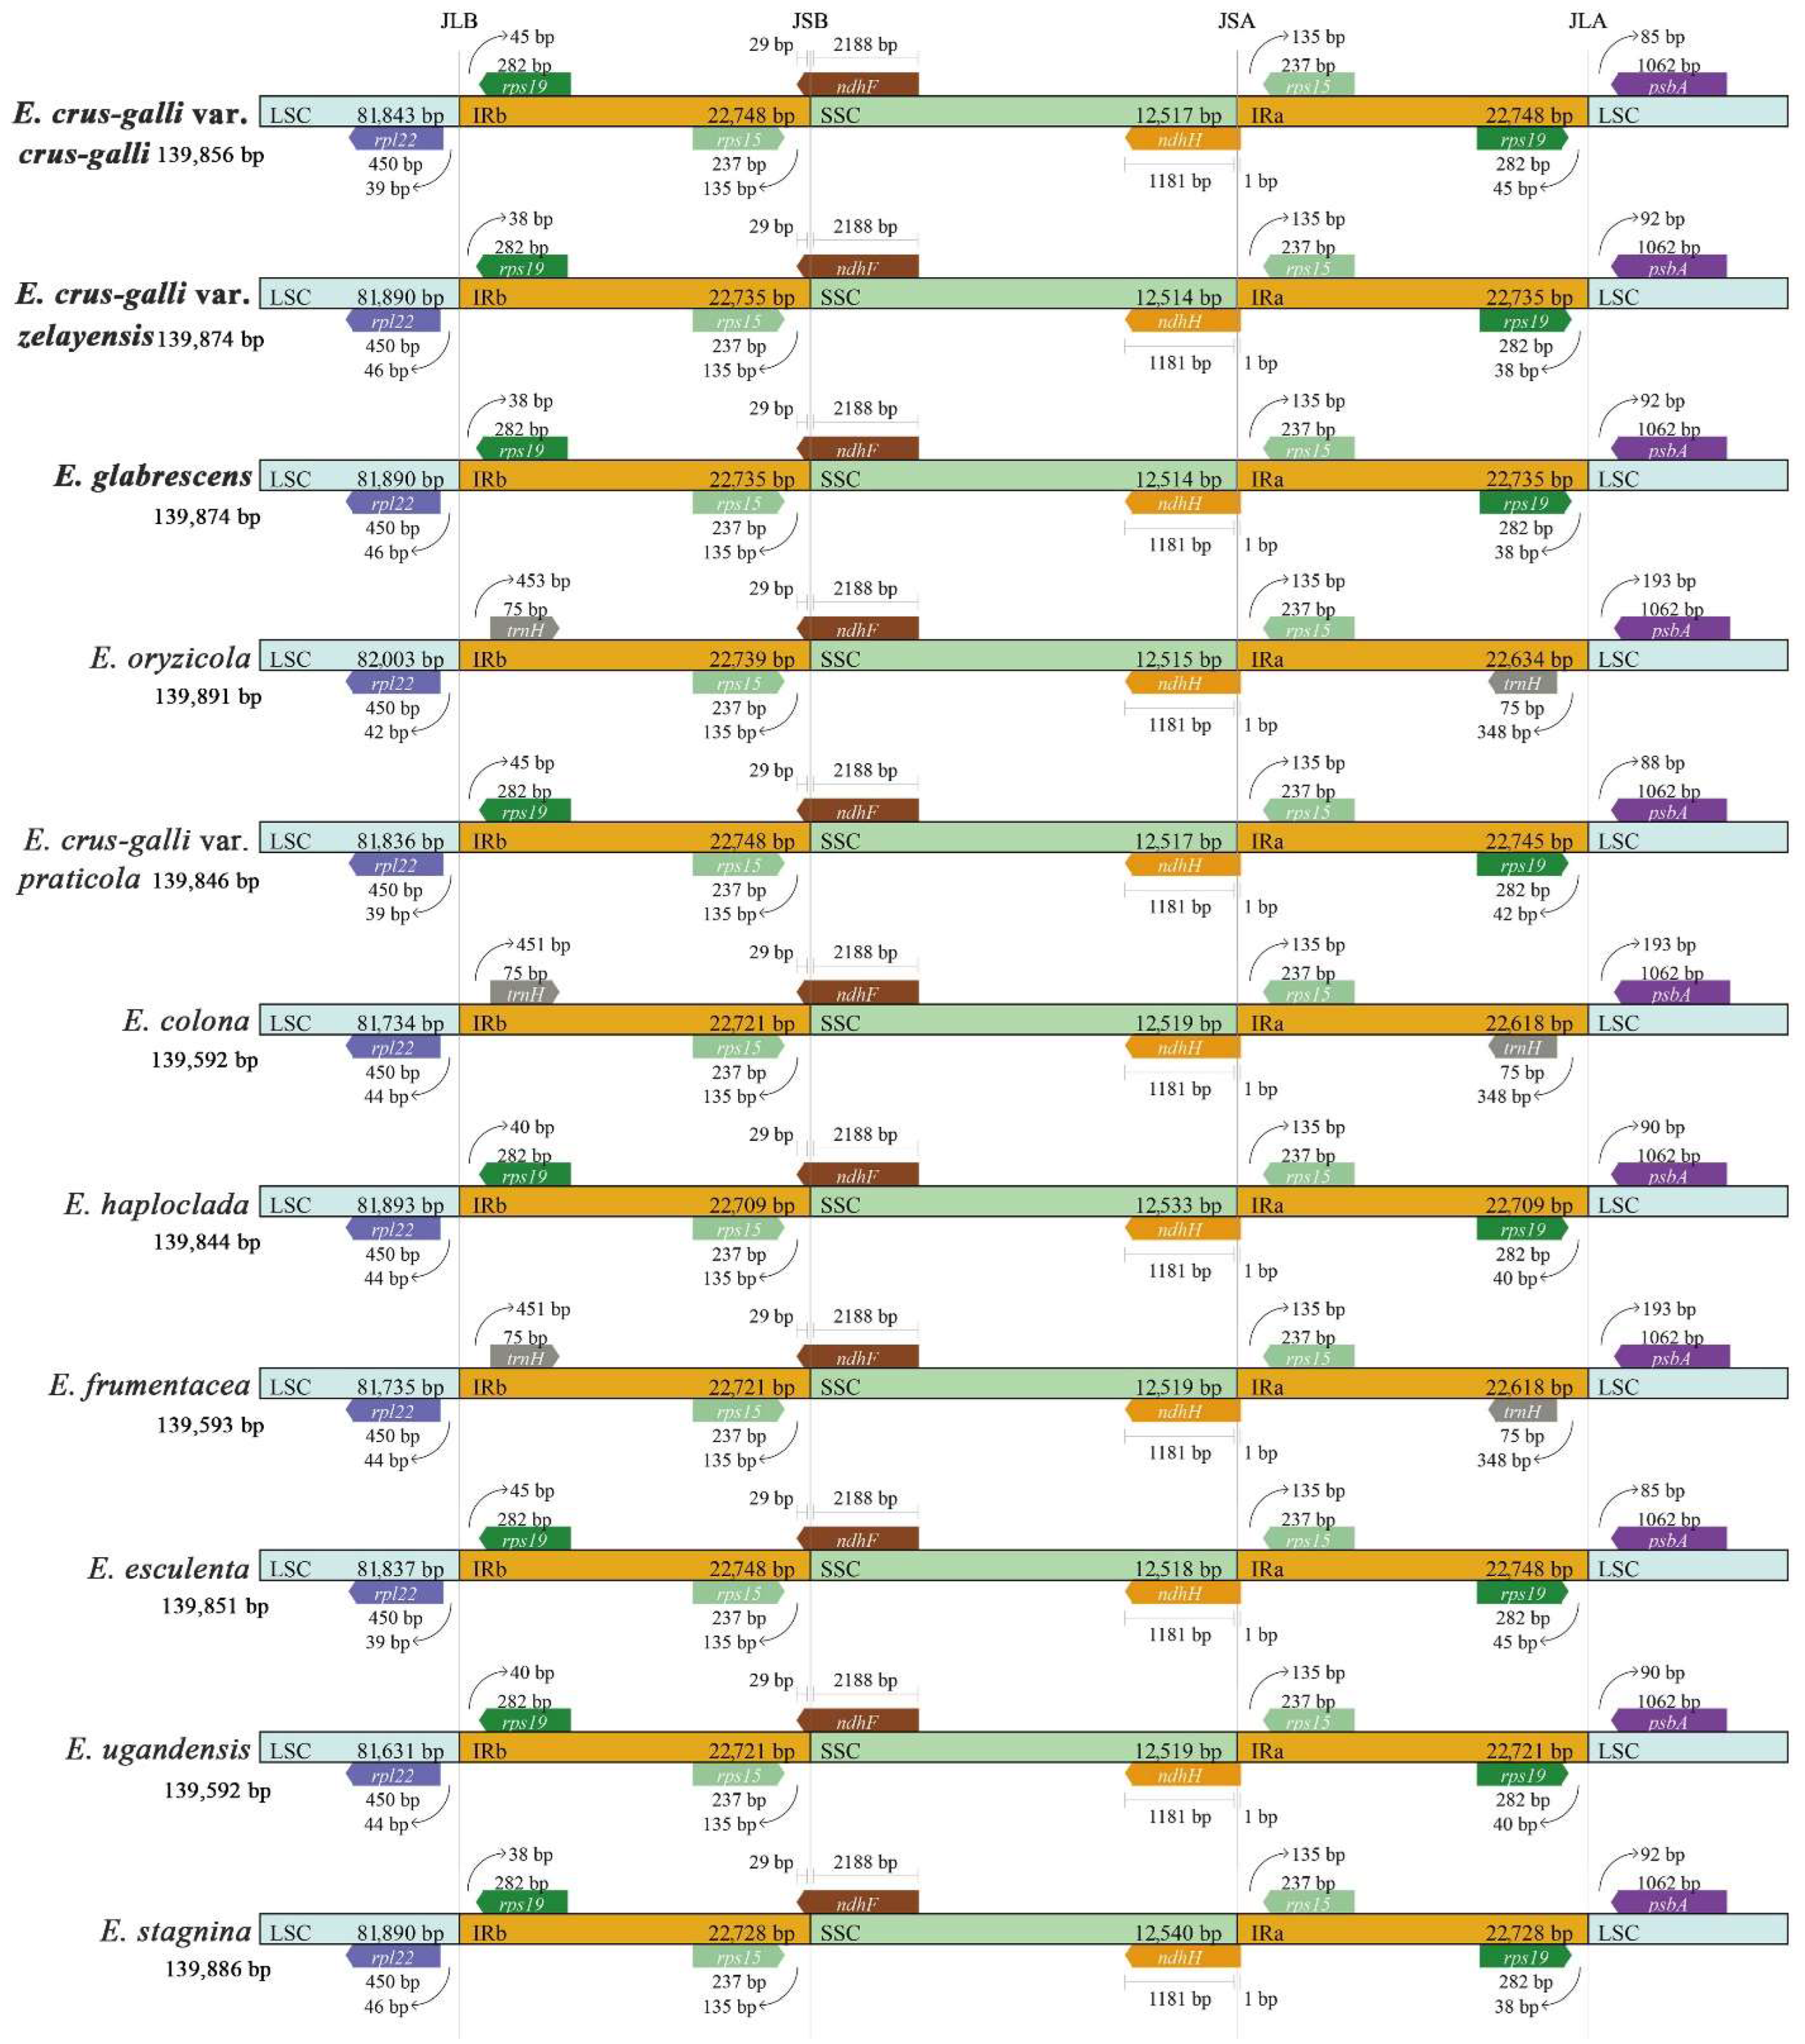
2.6. IR Expansion and Contraction

To further observe the potential contraction and expansion of the IR regions, the gene variations at the IR/SSC and IR/LSC boundary regions of ten sedges were compared (Figure 5). The rps19/rpl22, rps15/ndhF, ndhH/rps15, and rps19/psbA genes were located on the junctions of IRb/LSC, IRb/SSC, IRa/SSC, and IRa/LSC regions in E. crus-galli var. crus-galli, E. crus-galli var. zelayensis, and E. glabrescens. The junction genes at IRb/LSC and IRa/LSC of E. colona, E. frumentacea, and E. oryzicola differ from those of our three species, namely, rpl22/trnH and trnH/psbA. The length of the junction genes was consistent in E. crus-galli var. crus-galli, E. crus-galli var. zelayensis, and E. glabrescens. The rpl22 gene located in the LSC region was 39 bp from the IRb region in E. crus-galli var. crus-galli, whereas the distance in E. crus-galli var. zelayensis and E. glabrescens was 46 bp long. The gene, rps19, located in the IRa region of E. crus-galli var. crus-galli was 45 bp from the LSC region, whereas the distance in E. crus-galli var. zelayensis and E. glabrescens was 38 bp long. The psbA gene, located in the LSC region of E. crus-galli var. crus-galli, was 85 bp from the IRa region, whereas the distance in E. crus-galli var. zelayensis and E. glabrescens was 92 bp long. The length and distance from the boundaries of junction genes located in IRb/SSC and IRa/SSC regions were consistent in eleven barnyard grass species.

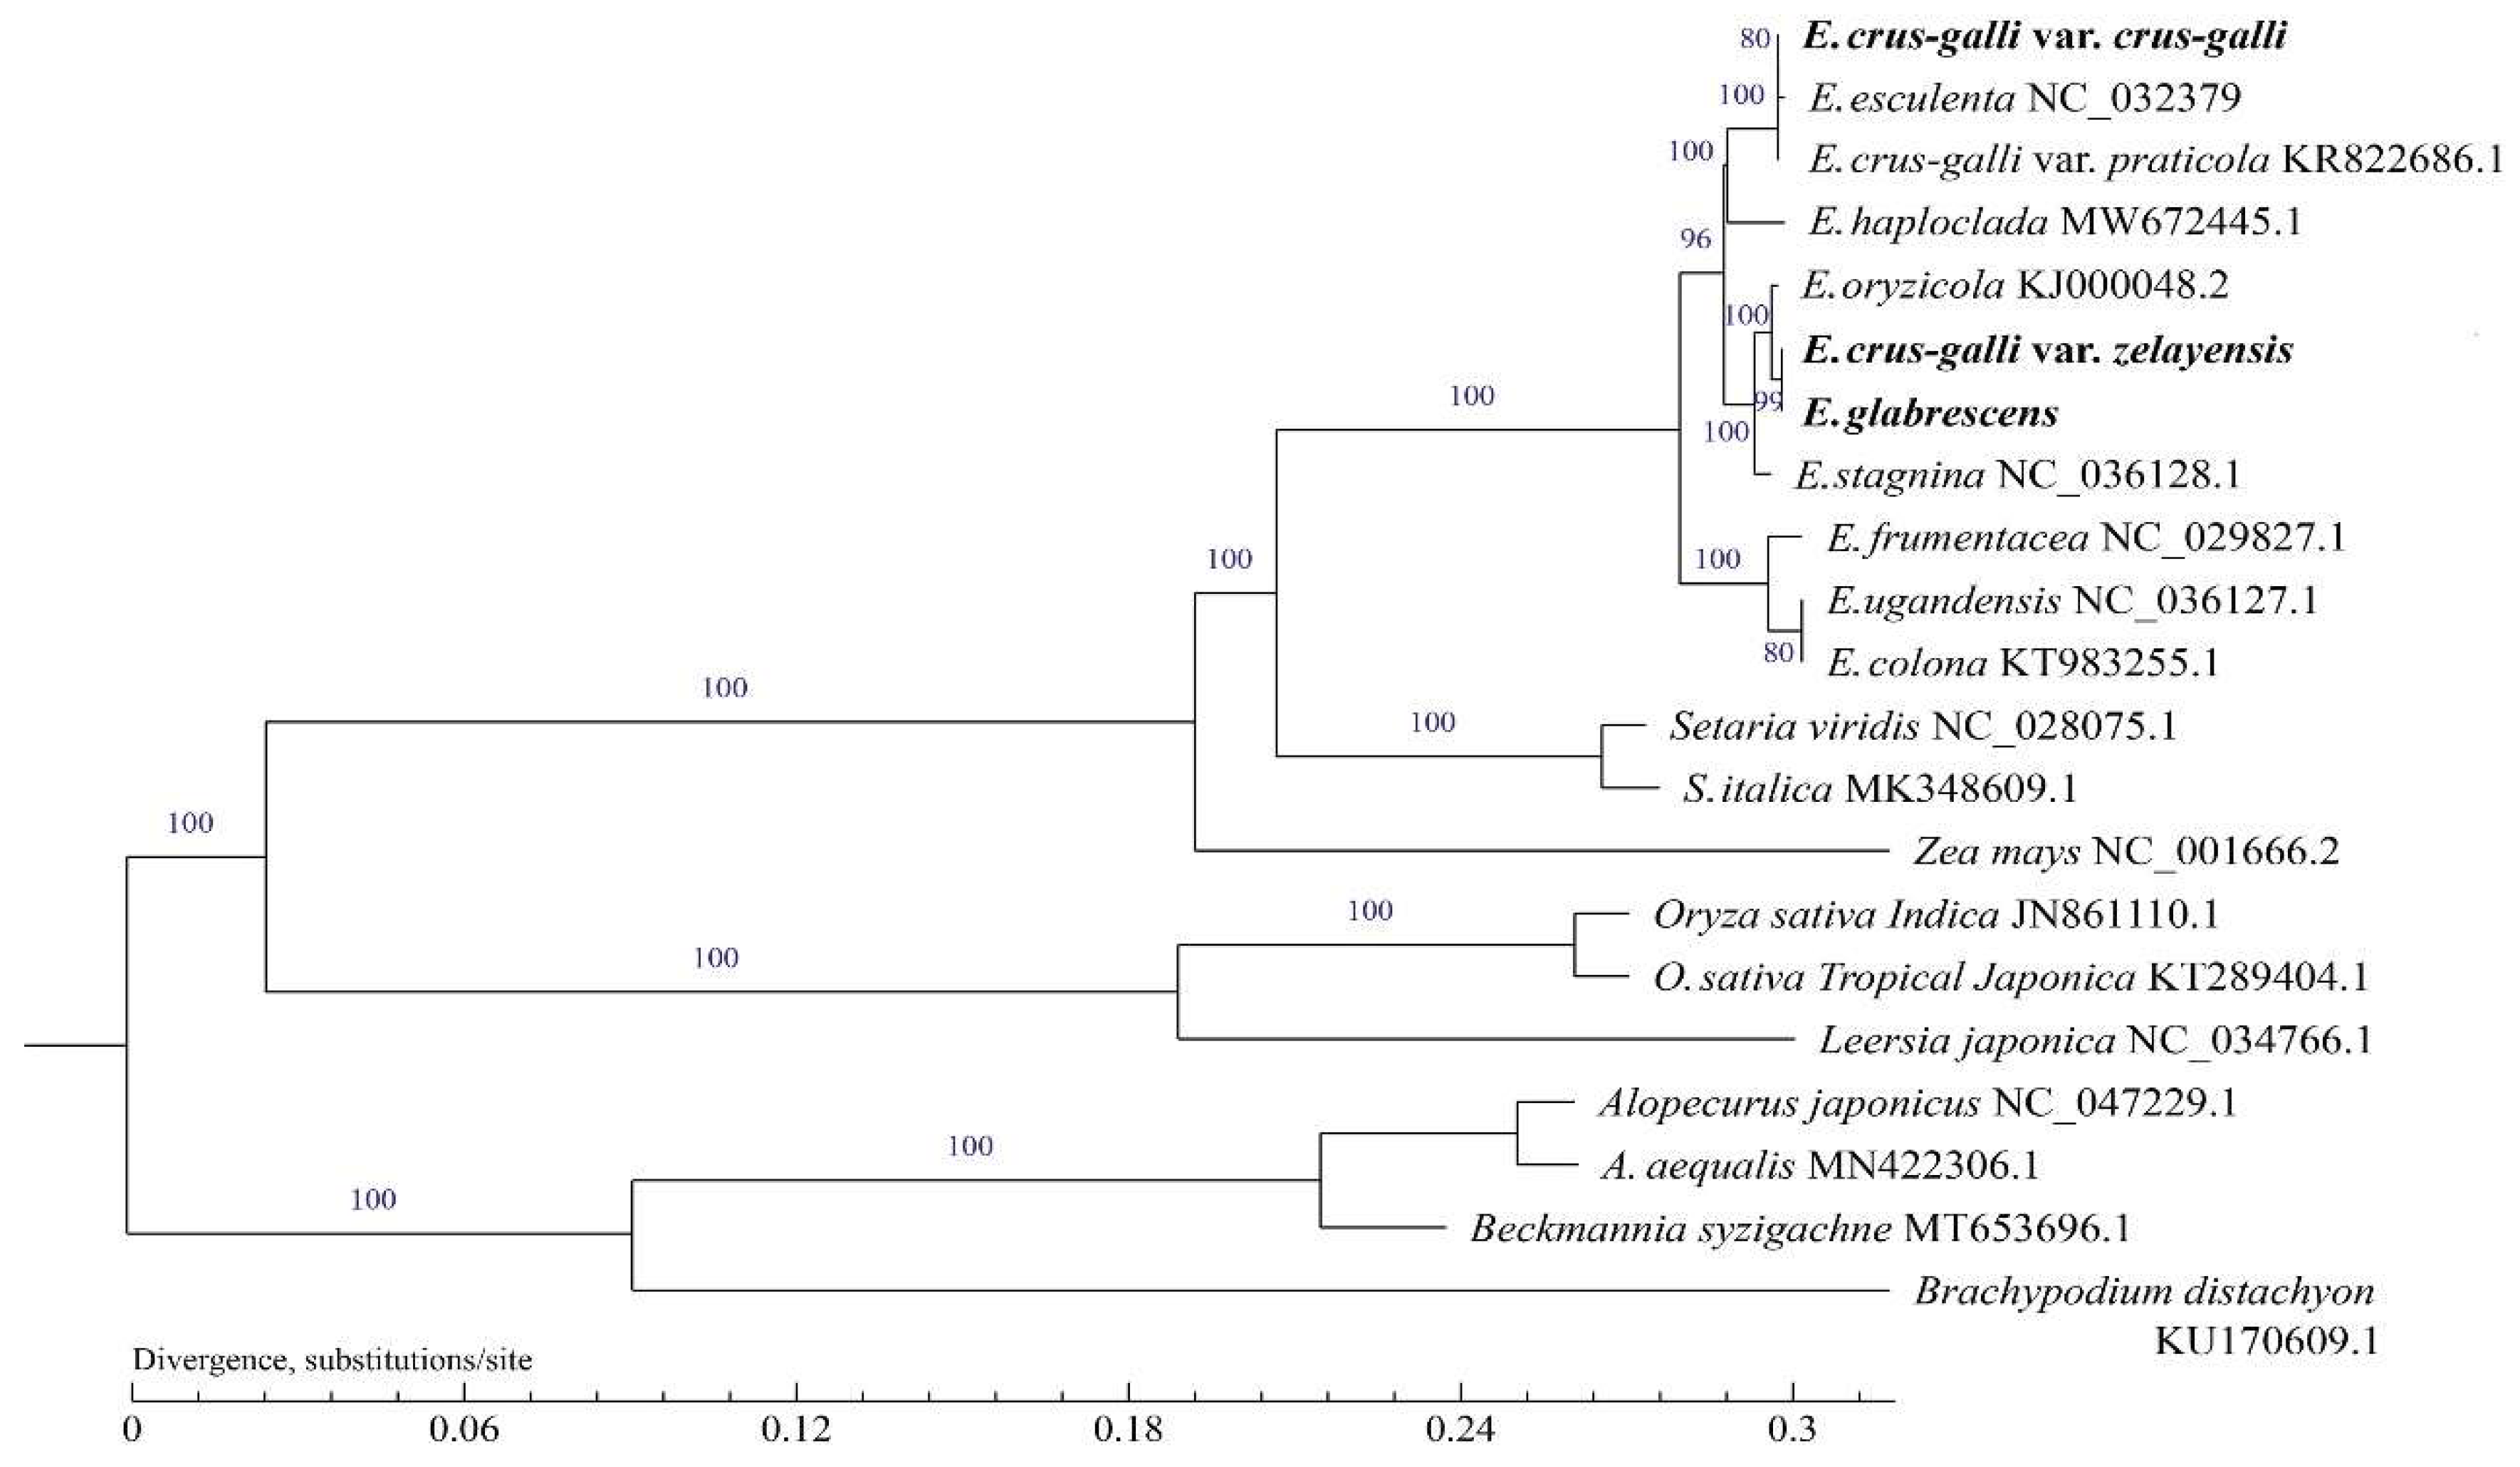
2.7. Phylogenetic Analysis

Phylogenetic trees were generated using maximum likelihood (ML) and Bayesian inference (BI) analysis methods based on 21 complete cp genomes showing the same topology (Figure 6). Echinochloa spp. were clustered into a single clade. E. crus-galli var. zelayensis and E. glabrescens have the most recent common ancestor (MRCA) (BS = 99 for ML), which has an MRCA with E. oryzicola (BS = 100 for ML). The closest relative to the above three Echinochloa spp. is E. stagnina (BS = 100 for ML). The species close to the above four Echinochloa spp. is E. crus-galli var. crus-galli sequenced in the present study (BS = 98 for ML). Although E. crus-galli var. crus-galli and E. esculenta were found to be closely related, the BS value was only 80 for ML. Among all the different plant species we collected, the closest relationship with the genus Echinochloa was the genus Setaria (BS = 100 for ML), the second most closely related to Zea mays (BS = 100 for ML), and the third most closely related to the genus Oryza (BS = 100 for ML). Alopecurus spp., Beckmannia syzigachne, and Brachypodium distachyum were all on another branch of the phylogenetic tree.

3. Discussion

Studies have distinguished the species of barnyard grass weeds mainly according to their morphology after budding [11]. The awn length is significantly different in the seeds of different barnyard grass species. Although Ruiz-Santailla et al. found that the awn length of barnyard grass is related to the growth environment [12], the differences in awn length between some barnyard grass species are still very prominent. In the present study, the morphological differences in seeds were the main basis for identifying several barnyard grass species (Figure 1b). The seeds of E. crus-galli var. crus-galli awns are 1–2 cm long at the top, and E. glabrescens seeds are convex on both sides, bright leather, and heavier, which are important distinguishing features for the two barnyard grass species. However, the seeds of E. crus-galli var. zelayensis had no prominent identification characteristics. More importantly, it is difficult to identify barnyard grass at the seedling stage (Figure 1a), which is the key period for herbicide selection. Therefore, it is important to determine the differences among barnyard grass species using chloroplast genome sequencing.
Barnyard grass is one of the most troublesome weeds in paddy fields [3,4,7,8]. The genus has many species that are difficult to distinguish, and their genetic relationships are complex; however, related research is still not systematic. Previous studies have reported differences in the sensitivity of different barnyard grasses to one herbicide [9,10]. The herbicide sensitivity test in this study demonstrated the importance of identifying barnyard grass species. Barnyard grass has evolved resistance to many post-emergence herbicides in China [3,4,41,42,43]. Therefore, in this study, two new herbicides, florpyrauxifen-benzyl and tripyrasulfone, that have not been widely used in paddy fields in China but have the potential to control barnyard grass were selected to test the difference in tolerance to herbicides. E. crus-galli var. crus-galli and E. glabrescens were susceptible to two herbicides; therefore, tripyrasulfone, owing to its lower cost, can be selected for the management of these species. Meanwhile, the control effect of florpyrauxifen-benzyl on E. crus-galli var. zelayensis is significantly better than that of tripyrasulfone (<40%), so florpyrauxifen-benzyl should be selected in this case despite its higher price. Therefore, accurately identifying barnyard grass species is key to selecting suitable herbicides.
Since the complete chloroplast (cp) genome sequence of tobacco was first reported [44], many plant cp genome sequences have been determined [36,40,45,46]. Although the cp genomes of many barnyard grass species have been sequenced [47], those of E. crus-galli var. zelayensis and E. glabrescens have not yet been reported. In this study, the cp genome of E. crus-galli var. crus-galli, E. crus-galli var. zelayensis, and E. glabrescens were sequenced, which showed that the genomes of the three species were similar in size (Figure 3). The reported cp genomes of barnyard grass species are between 139,592 and 139,891 bp in size [47], indicating that the differentiation of cp genome size in the genus is not prominent. The cp genome of barnyard grass is relatively small compared with that of many terrestrial plants [27,40,45,46]. The typical tetrad structure of the chloroplast genome is conserved in plants [31,32,33], and, generally, there is little difference in the length of each tetrad of the same genus [27,40,46]. A tetrameric structure exists in the cp genomes of all three barnyard grass species sequenced in our study, and the length difference of each region was only within 3–47 bp. From the GC content perspective, the differences among the three barnyard grass species are only within 0.02% (Table 2). The parameters were consistent in E. crus-galli var. zelayensis and E. glabrescens, preliminarily implying that they have a relatively close genetic relationship.
The chloroplast genome is highly conserved in plants of the same genus [24,25,26]. The number of coding, tRNA, and rrn genes in the cp genomes of E. crus-galli var. crus-galli, E. crus-galli var. zelayensis, and E. glabrescens were completely consistent. Furthermore, their distribution in the four tetramerous structures was also consistent (Figure 3). Simultaneously, the annotated coding genes also maintained a high degree of consistency among the three barnyard grass species (Table 4). These results confirm the conservation of the cp genome among the three barnyard grass species. SSRs, also known as microsatellites, are widely distributed in plant cp genomes and are composed of one–six-nucleotide repeat units [48,49]. These repetitive structures exhibit diversity among cp genomes in the population and promote molecular recombination [50]. SSRs are an important molecular genetic marker now widely used in population genetics and plant genotyping [51,52,53,54]. This study showed three more SSRs in the cp genome of E. crus-galli var. zelayensis and E. glabrescens than in E. crus-galli var. crus-galli, and one less in the coding region (Table 5). Differential SSRs can be used as a specific molecular marker for this species. LRs usually occupy a large proportion of the genome, which is also a special and repeated DNA sequence [55]. Repeat fragments have an important molecular significance in the study of plant evolution [56]. The number and distribution of LRs in the cp genome of E. crus-galli var. zelayensis and E. glabrescens were consistent, three times higher than that of E. crus-galli var. crus-galli (Table 5). The repeats identified in this study are of great significance for the species identification, genetic diversity, and population structure of the genus Echinochloa. The cp genomes of E. crus-galli var. zelayensis and E. glabrescens were more similar. Concurrently, there were limited differences between the two barnyard grass species and E. crus-galli var. crus-galli.
Recently, SNPs have become a key tool and measurement indicator in evolution and classification research because many samples can be screened by cheap high-throughput technology [57]. They can display the exact nature and location of allele variation, which is widely used as a direct marker [58]. Researchers have successfully distinguished white, black, and red spruces using SNPs as molecular markers [58]. In the present study, compared with the cp genome of E. crus-galli var. zelayensis, 97 SNPs were detected in the E. crus-galli var. crus-gall and the number of non-synonymous SNPs is lower than that of synonymous SNPs, indicating no strong diversification between the two barnyard grass species [59]. These SNPs can be used as important differential nucleotide databases to distinguish barnyard grass species. Simultaneously, this study showed a close genetic relationship between E. crus-galli var. zelayensis and E. glabrescens because only one mutation was detected in the cp genome between them. SNPs usually occur more frequently in variable and less conserved genes [58], which was also confirmed by our study. McDonald et al. proposed that repeat-induced recurrence repair is the mechanism underlying SNP induction [60]. The mechanism of Echinochloa differentiation and SNP production requires further research.
The expansion and contraction of the chloroplast genome mainly occur at the junction of IR/SC [61], a very common biological phenomenon in plants [24]. Although highly conserved, IR expansion and contraction are important driving forces of genome evolution because they are directly related to variations in cp genome size and rearrangement [62,63,64,65]. This phenomenon has been repeatedly observed in many plants [27,36,40]. This study showed that, compared with E. crus-galli var. zelayensis, E. glabrescens has no expansion or contraction of the IR, whereas E. crus-galli var. crus-galli showed minimal change. Furthermore, there was no difference among the three barnyard grass species in the adjacent genes of junctions, genes across regions, and the length of these genes. Differences in E. crus-galli var. crus-galli were mainly caused by the distance between the boundary gene and the boundary, but this change was only 7 bp (Figure 5). Our IR expansion and contraction results fully demonstrate the high conservatism of barnyard grass. Genes, gene length, and distance from the boundary at the junction of IRs and SSCs were completely consistent between the 10 barnyard grass species (Figure 5). The main difference was the boundary gene between IRs and LSC regions, which is trnH in E. colona, E. frumentacea, and E. oryzicola, but rps19 in other barnyard grass species (Figure 5), inconsistent with the genetic relationship among barnyard grass species previously reported [13,14,15,16,19,66]. Our results provide a novel idea for studying the genetic relationships of the genus Echinochloa, and the differentiation mechanism needs to be further explored.
The cp genome is essential for plant phylogeny and species identification [67,68,69]. CP genome data can also establish organelle-based “barcodes” for some species, which is valuable for establishing species definition because it is then used to reveal phylogenetic relationships [70]. The main method consists in constructing a phylogenetic tree based on the cp genome. With the continuous development of cp genome information and technological improvements, the genetic and evolutionary relationships of many plants have been successfully clarified [27,46,71]. However, the genetic evolution of the genus Echinochloa from the perspective of the cp genome has not yet been reported. In this study, we collected all reported cp genomes of barnyard grass and some cp genomes of representative grasses from the NCBI to conduct phylogenetic analysis. The cp genome data of E. crus-galli var. zelayensis and E. glabrescens were measured and published for the first time (accession number: PRJNA827798). According to the results of genetic relationships, the 10 species of barnyard grass in this study can be divided into four groups. The first group comprises E. oryzicola, E. crus-galli var. zelayensis, E. glabrescens, and E. stagnina; the second group includes E. crus-galli var. crus-galli, and E. esculenta; the third group contains E. haploclada alone; and the fourth group consists of E. ugandensis, E. colona, and E. frumentacea. The genus Echinochloa is closely related to the genus Setaria (Figure 6), which is why many genes of the genus Echinochloa weeds can be matched to those of the genus Setaria [72,73]. Although analysis of the complete cp genome may not be sufficient to fully solve all phylogenetic relationships, it can still provide a feasible way to clarify species relationships [68,74,75].

4. Materials and Methods

4.1. Plant Materials

Two E. crus-galli var. zelayensis populations were provided by the Herbicide Research Laboratory of Nanjing Agricultural University, China [3]. In addition, two E. crus-galli var. crus-galli and two E. glabrescens populations were collected from paddy fields in the Yangtze River Delta, China, in 2020. All six populations were tested for whole-plant bioassays and seed morphology. In addition, one population of each barnyard grass species was subjected to chloroplast (cp) genome sequencing.

4.2. Measurement of Awn Length and Seed Weight

Barnyard grass seeds were dried to a constant weight under the sun before the test. Thirty seeds of each barnyard grass species were randomly selected, and the awn length of the seeds was measured. A total of 1000 seeds of each species of barnyard grass were randomly selected as a group for weight determination, and six groups were used as replicates. The experimental groups were randomly arranged. The data were subjected to ANOVA. To compare the differences in awn length and seed weight among the three barnyard grass species, Duncan’s multiple range test (p < 0.05) was used. ANOVA was performed using SPSS version 20 (SPSS, Chicago, IL, USA).

4.3. Whole-Plant Bioassay to Determine Sensitivity to New Herbicides

The stems and leaves of six barnyard grass populations belonging to three species were sprayed with florpyrauxifen-benzyl (Corteva Agriscience, Wilmington, DE, USA) or tripyrasulfone (KingAgroot, Qingdao, Shandong Province, China) when the plants reached the 3–4-leaf stage using a 3WP-2000 walking-type spraying system (Nanjing, China). The spraying system was equipped with a 390 mL/min flow nozzle with a pressure of 3.0 kg/cm2 at the time of spraying. When spraying herbicides, whole plants grown in pots were placed in the spraying system, and 30 mL of the diluted herbicide solution was sprayed onto the plants at a forward speed of 291 mm/s through the nozzle to ensure that the droplets of quinclorac solution that fell on the plants were small and uniform enough and that the final doses were 9, 18, and 36 g a.i. ha−1 for florpyrauxifen-benzyl and 67.5, 135, and 270 g a.i. ha−1 for tripyrasulfone. Each experimental treatment contained four biological replicates, and the experiment was conducted twice.
All studies were conducted using the inhibition rate (IR) of fresh weight, which is based on the fresh weight of CK. The experimental groups were randomly arranged. The data were subjected to ANOVA. To compare the differences in the percentage of inhibition rate among the 18 groups, Duncan’s multiple range test (p < 0.05) was used. ANOVA was performed using SPSS version 20 (SPSS, Chicago, IL, USA).
IR = (WCK − WT)/WCK × 100%
where WCK represents the fresh weight of the plants in the untreated group and WT represents the fresh weight of the plants in the treatment group.

4.4. DNA Extraction and Sequencing

Fresh leaves and stems of total genomic DNA were extracted using a modified cetyltrimethylammonium bromide (CTAB) method and applied to 500 bp paired-end library construction using the NEBNext Ultra DNA Library Prep Kit for Illumina sequencing. Sequencing was performed on an Illumina NovaSeq 6000 platform (BIOZERON Co., Ltd., Shanghai, China). Raw data from three barnyard grass species were generated with 150 bp paired-end read lengths.

4.5. DNA Sequencing and Genome Assembly

De novo assembly with NOVOPlasty, referencing the cp genome of closely related species, produced two optional circular contigs of the cp genome. One of them, with higher homology cpDNA, was selected as the candidate cp genome. Several potential chloroplast reads were extracted from the pool of Illumina reads using BLAST searches against the cp genomes of related species E. stagnina voucher K: RCH49 chloroplast (Accession Number: MF563381) and the NOVOPlasty results. Illumina chloroplast reads were obtained to perform cp genome de novo assembly using the SPAdes-3.13.0 package. The NOVOPlasty assembly contig was optimized by the scaffolds from the SPAdes-3.13.0 result and aligned with the original clean Illumina reads using the BWA, and the base correction was performed with Pilon v1.22. Finally, the assembled sequence was reordered and oriented according to the reference cp genome to generate the final assembled chloroplast genomic sequence.

4.6. Genome Component Analysis

Genes encoding proteins, tRNAs, and rRNAs in the chloroplast genome of E. crus-galli var. crus-galli, E. crus-galli var. zelayensis, and E. glabrescens were predicted using the GeSeq (https://chlorobox.mpimp-golm.mpg.de/geseq.html/, accessed on 26 November 2021). The specific parameters were set as follows: protein search identity: 60; rRNA, tRNA, DNA search identity: 35; 3rd party tRNA annotators: tRNAscan-SE v2.0.7. High-accuracy gene bundles were obtained by removing the redundancy of predicted initial genes, followed by manual correction of the head, tail, and exon/intron boundaries of the genes. Finally, the base composition of the chloroplast genome; the gene distribution of each interval, including the large single-copy (LSC) regiom, small single-copy (SSC) region, and inverted repeats (IRs); and the classification of each functional gene was counted and summarized.

4.7. Gene Function Annotation and Classification Analysis

The protein sequences of chloroplast genes were compared with known protein databases using BLASTP (evalue < 1 × 10⁻⁵). Since there may be more than one alignment result for each sequence, to ensure its biological significance, only one optimal alignment result was reserved as the database alignment information of the gene. These databases included NR (http://www.ncbi.nlm.nih.gov/, accessed on 26 November 2021), Swiss-Prot (http://www.ebi.ac.uk/uniprot, accessed on 26 November 2021), eggNOG (http://eggnogdb.embl.de/, accessed on 26 November 2021), KEGG (http://www.genome.jp/kegg/, accessed on 26 November 2021), and GO (http://geneontology.org/, accessed on 26 November 2021). The amino acid sequences of C. difformis and C. iria were aligned with the NR, Swiss-Prot, eggNOG, KEGG, and GO databases to obtain functional annotation information for the coding genes.

4.8. Contraction and Expansion Analysis of Inverted Repeat (IR) Regions

In this part, in addition to the three newly sequenced cp genomes of barnyard grass, eight other barnyard grass species and an additional 10 Gramineae plant cp genomes were downloaded from NCBI to resolve the IR analysis. The four quadripartite structures of each chloroplast (LSC, SSC, and two IR repeat regions) were compared, and changes in the copy number of related genes caused by contraction and expansion of the IR or pseudogenes resulting in boundary regions were analyzed. Genes that crossed the boundary or genes closest to the boundary were obtained. The function, length, and distance from the boundaries of these genes were analyzed.

4.9. Phylogenetic Analysis

In this part, in addition to the three newly sequenced cp genomes of barnyard grass, eight other barnyard grass species and an additional 10 Gramineae plants were downloaded from NCBI to resolve a chloroplast phylogenetic tree. The sequences were aligned using ClustalW (v2.0.12) with the default settings. The DNA substitution model was assessed using the Akaike information criterion (AIC) method [76]. The phylogenetic tree was constructed by the maximum likelihood (ML) method using PhyML v3.0 (htp://ww.atgc-montpeller.fr/phyml/, accessed on 19 October 2022), and the bootstrap was 1000 [77,78]. Bayesian inference (BI) was also used based on the method described by Wu et al. [79], using MrBayes v3.1.2.

5. Conclusions

The cp genomes of E. crus-galli var. zelayensis and E. glabrescens were first sequenced, revealing a close relationship in our study. Although E. crus-galli var. zelayensis, E. glabrescens, and E. crus-galli var. crus-galli were very similar in morphology at the seedling stage, E. crus-galli var. crus-galli showed some differences in size, components, gene annotation, repeats, and IR expansion and contraction of the cp genome. The SNP results further revealed a close relationship between E. crus-galli var. zelayensis and E. glabrescens. The detected SNPs can be used to conveniently identify the three barnyard grass species. Furthermore, IR expansion and contraction and the phylogenetic tree illustrated differences in the evolutionary directions of the genus Echinochloa, which is the molecular basis of biodiversity. The results also provide important biological information for the identification and evolution of the genus Echinochloa. However, the mechanisms that cause the substantial differentiation of the genus Echinochloa and the difference of herbicide sensitivity are still unclear and need further study.

Supplementary Materials

The following supporting information can be downloaded at: https://www.mdpi.com/article/10.3390/ijms232213864/s1.

Author Contributions

Conceptualization, Y.G. and Z.T.; methodology, Y.G.; software, Y.G. and G.Y.; validation, Y.G., G.Y. and Z.T.; formal analysis, Y.G. and G.Y.; investigation, Y.G., G.Y. and Z.T.; resources, Y.G. and Z.T.; data curation, Z.T. and G.S.; writing—original draft preparation, Y.G.; writing—review and editing, Z.T. and G.S.; visualization, Y.G., G.Y. and Z.T.; supervision, Z.T. and G.S.; project administration, Z.T. and G.S.; funding acquisition, Y.G. All authors have read and agreed to the published version of the manuscript.

Funding

This research was funded by the Shanghai Sailing Program, grant number [22YF1441100].

Institutional Review Board Statement

Not applicable.

Informed Consent Statement

Not applicable.

Data Availability Statement

Raw reads of cp genomes of E. crus-galli var. crus-galli, E. crus-galli var. zelayensis, and E. glabrescens were deposited in the NCBI GenBank database (accession number: PRJNA827798).

Acknowledgments

We thank Shanghai BIOZERON Biotechnology Co., Ltd. for performing the high throughput sequencing.

Conflicts of Interest

The authors declare no conflict of interest.

References

  1. Michael, P. Taxonomy and distribution of Echinochloa species with special reference to their occurrence as weeds of rice. In Proceedings of the Conference on Weed Control in Rice, Los Banos, Philippines, 31 August–4 September 1981; pp. 291–306. [Google Scholar]
  2. Yabuno, T. Biology of Echinochloa species. In Proceedings of the Conference on Weed Control in Rice, Los Banos, Philippines, 31 August–4 September 1981; pp. 307–318. [Google Scholar]
  3. Xu, J.; Lv, B.; Wang, Q.; Li, J.; Dong, L. A resistance mechanism dependent upon the inhibition of ethylene biosynthesis. Pest Manag. Sci. 2013, 69, 1407–1414. [Google Scholar] [CrossRef] [PubMed]
  4. Fang, J.; Zhang, Y.; Liu, T.; Yan, B.; Li, J.; Dong, L. Target-site and metabolic resistance mechanisms to penoxsulam in barnyardgrass (Echinochloa crus-galli (L.) P. Beauv). J. Agric. Food Chem. 2019, 67, 8085–8095. [Google Scholar] [CrossRef]
  5. Danquah, E.; Johnson, D.; Riches, C.; Arnold, G.; Karp, A. Genetic diversity in Echinochloa spp. collected from different geographic origins and within rice fields in Cote d’Ivoire. Weed Res. 2002, 42, 394–405. [Google Scholar] [CrossRef]
  6. Gibson, K.D.; Fischer, A.J.; Foin, T.C.; Hill, J.E. Implications of delayed Echinochloa spp. germination and duration of competition for integrated weed management in water-seeded rice. Weed Res. 2010, 42, 351–358. [Google Scholar] [CrossRef]
  7. Chauhan, B.; Johnson, D. Ecological studies on Echinochloa crus-galli and the implications for weed management in direct-seeded rice. Crop Prot. 2011, 30, 1385–1391. [Google Scholar] [CrossRef]
  8. Rao, A.; Johnson, D.; Sivaprasad, B.; Ladha, J.; Mortimer, A. Weed management in direct-seeded rice. Adv. Agron. 2007, 93, 153–255. [Google Scholar]
  9. Vidotto, F.; Tesio, F.; Tabacchi, M.; Ferrero, A. Herbicide sensitivity of Echinochloa spp. accessions in Italian rice fields. Crop Prot. 2007, 26, 285–293. [Google Scholar] [CrossRef]
  10. Wang, Q.; Chen, G.; Jiang, Y.; Wang, Q.; Yao, Z.; Dong, L. Sensitivity of Echinochloa species to frequently used herbicides in paddy rice field. J. Nanjing Agric. Univ. 2015, 38, 804–809. (In Chinese) [Google Scholar]
  11. Qiao, L.; Wang, Q.; Zhang, S.; Li, Y. Review on the biology of weed of Echinochloa Beauv. Weed Sci. 2002, 3, 8–12. (In Chinese) [Google Scholar]
  12. Ruiz-Santaella, J.; Bastida, F.; Franco, A.; De Prado, R. Morphological and molecular characterization of different Echinochloa spp. and Oryza sativa populations. J. Agric. Food Chem. 2006, 54, 1166–1172. [Google Scholar] [CrossRef]
  13. Yamaguchi, H.; Utano, A.; Yasuda, K.; Yano, A.; Soejima, A. A molecular phylogeny of wild and cultivated Echinochloa in East Asia inferred from non-coding region sequences of trnT-L-F. Weed Biol. Manag. 2005, 5, 210–218. [Google Scholar] [CrossRef]
  14. Nakayama, Y.; Umemoto, S.; Yamaguchi, H. Identification of polyploid groups in the genus Echinochloa by isozyme analysis. Weed Res. 1999, 44, 205–217. [Google Scholar]
  15. Yasuda, K.; Yano, A.; Nakayama, Y.; Yamaguchi, H. Molecular identification of Echinochloa oryzicola Vasing. and E. crus-galli (L.) Beauv. using a polymerase chain reaction-restriction fragment length polymorphism technique. Weed Biol. Manag. 2002, 2, 11–17. [Google Scholar] [CrossRef]
  16. Feng, J.; Zhang, T. Cytological study on Chinese species in the genus Echinochloa. J. Wuhan Bot. Res. 1993, 11, 293–299. (In Chinese) [Google Scholar]
  17. Qian, W.; Ge, S.; Hong, D.Y. Genetic variation within and among populations of a wild rice Oryza granulata from China detected by RAPD and ISSR markers. Theor. Appl. Genet. 2001, 102, 440–449. [Google Scholar] [CrossRef]
  18. Devarumath, R.; Nandy, S.; Rani, V.; Marimuthu, S.; Muraleedharan, N.; Raina, S. RAPD, ISSR and RFLP fingerprints as useful markers to evaluate genetic integrity of micropropagated plants of three diploid and triploid elite tea clones representing Camellia sinensis (China type) and C. assamica ssp. assamica (Assam-India type). Plant Cell Rep. 2002, 21, 166–173. [Google Scholar]
  19. Lu, Y.; Liu, D.; Guo, S.; Yu, L. Classification of Echinochloa species in Chinese paddy fields based on ISSR markers. Acta Agric. Zhejiangensis 2014, 26, 1309–1314. (In Chinese) [Google Scholar]
  20. Wu, D.; Shen, E.; Jiang, B.; Feng, Y.; Tang, W.; Lao, S.; Jia, L.; Lin, H.-Y.; Xie, L.; Weng, X. Genomic insights into the evolution of Echinochloa species as weed and orphan crop. Nat. Commun. 2022, 13, 689. [Google Scholar] [CrossRef]
  21. Altop, E.K.; Mennan, H. Genetic and morphologic diversity of Echinochloa crus-galli populations from different origins. Phytoparasitica 2011, 39, 93–102. [Google Scholar] [CrossRef]
  22. Gupta, A.; Mahajan, V.; Kumar, M.; Gupta, H. Biodiversity in the barnyard millet (Echinochloa frumentacea Link, Poaceae) germplasm in India. Genet. Resour. Crop Evol. 2009, 56, 883–889. [Google Scholar] [CrossRef]
  23. Howe, C.J.; Barbrook, A.C.; Koumandou, V.L.; Nisbet, R.E.R.; Symington, H.A.; Wightman, T.F. Evolution of the chloroplast genome. Philos. Trans. R. Soc. London. Ser. B Biol. Sci. 2003, 358, 99–107. [Google Scholar] [CrossRef] [PubMed] [Green Version]
  24. Plunkett, G.M.; Downie, S.R. Expansion and contraction of the chloroplast inverted repeat in Apiaceae subfamily Apioideae. Syst. Bot. 2000, 25, 648–667. [Google Scholar] [CrossRef]
  25. Wicke, S.; Schneeweiss, G.M.; Depamphilis, C.W.; Müller, K.F.; Quandt, D. The evolution of the plastid chromosome in land plants: Gene content, gene order, gene function. Plant Mol. Biol. 2011, 76, 273–297. [Google Scholar] [CrossRef] [Green Version]
  26. Cosner, M.E.; Raubeson, L.A.; Jansen, R.K. Chloroplast DNA rearrangements in Campanulaceae: Phylogenetic utility of highly rearranged genomes. BMC Evol. Biol. 2004, 4, 27. [Google Scholar] [CrossRef] [PubMed] [Green Version]
  27. Hong, Z.; Wu, Z.; Zhao, K.; Yang, Z.; Zhang, N.; Guo, J.; Tembrock, L.R.; Xu, D. Comparative analyses of five complete chloroplast genomes from the genus Pterocarpus (Fabacaeae). Int. J. Mol. Sci. 2020, 21, 3758. [Google Scholar] [CrossRef]
  28. Lu, R.-S.; Li, P.; Qiu, Y.-X. The complete chloroplast genomes of three Cardiocrinum (Liliaceae) species: Comparative genomic and phylogenetic analyses. Front. Plant Sci. 2017, 7, 2054. [Google Scholar] [CrossRef] [Green Version]
  29. Niu, Y.-T.; Jabbour, F.; Barrett, R.L.; Ye, J.-F.; Zhang, Z.-Z.; Lu, K.-Q.; Lu, L.-M.; Chen, Z.-D. Combining complete chloroplast genome sequences with target loci data and morphology to resolve species limits in Triplostegia (Caprifoliaceae). Mol. Phylogenetics Evol. 2018, 129, 15–26. [Google Scholar] [CrossRef]
  30. Pinard, D.; Myburg, A.A.; Mizrachi, E. The plastid and mitochondrial genomes of Eucalyptus grandis. BMC Genom. 2019, 20, 132. [Google Scholar] [CrossRef]
  31. Wu, F.-H.; Chan, M.-T.; Liao, D.-C.; Hsu, C.-T.; Lee, Y.-W.; Daniell, H.; Duvall, M.R.; Lin, C.-S. Complete chloroplast genome of Oncidium Gower Ramsey and evaluation of molecular markers for identification and breeding in Oncidiinae. BMC Plant Biol. 2010, 10, 68. [Google Scholar] [CrossRef] [Green Version]
  32. Li, P.; Lu, R.-S.; Xu, W.-Q.; Ohi-Toma, T.; Cai, M.-Q.; Qiu, Y.-X.; Cameron, K.M.; Fu, C.-X. Comparative genomics and phylogenomics of East Asian tulips (Amana, Liliaceae). Front. Plant Sci. 2017, 8, 451. [Google Scholar] [CrossRef] [Green Version]
  33. Bi, Y.; Zhang, M.-F.; Xue, J.; Dong, R.; Du, Y.-P.; Zhang, X.-H. Chloroplast genomic resources for phylogeny and DNA barcoding: A case study on Fritillaria. Sci. Rep. 2018, 8, 1184. [Google Scholar] [CrossRef] [PubMed] [Green Version]
  34. Fu, J.; Liu, H.; Hu, J.; Liang, Y.; Liang, J.; Wuyun, T.; Tan, X. Five complete chloroplast genome sequences from Diospyros: Genome organization and comparative analysis. PLoS ONE 2016, 11, e0159566. [Google Scholar] [CrossRef] [PubMed] [Green Version]
  35. Maréchal, A.; Brisson, N. Recombination and the maintenance of plant organelle genome stability. New Phytol. 2010, 186, 299–317. [Google Scholar] [CrossRef]
  36. Duan, H.; Guo, J.; Xuan, L.; Wang, Z.; Li, M.; Yin, Y.; Yang, Y. Comparative chloroplast genomics of the genus Taxodium. BMC Genom. 2020, 21, 114. [Google Scholar] [CrossRef] [PubMed] [Green Version]
  37. Kugita, M.; Kaneko, A.; Yamamoto, Y.; Takeya, Y.; Matsumoto, T.; Yoshinaga, K. The complete nucleotide sequence of the hornwort (Anthoceros formosae) chloroplast genome: Insight into the earliest land plants. Nucleic Acids Res. 2003, 31, 716–721. [Google Scholar] [CrossRef] [Green Version]
  38. Henry, R.J. Plant Diversity and Evolution: Genotypic and Phenotypic Variation in Higher Plants; Cabi Publishing: Wallingford, UK, 2005. [Google Scholar]
  39. Yamane, K.; Yasui, Y.; Ohnishi, O. Intraspecific cpDNA variations of diploid and tetraploid perennial buckwheat, Fagopyrum cymosum (Polygonaceae). Am. J. Bot. 2003, 90, 339–346. [Google Scholar] [CrossRef]
  40. Li, L.; Hu, Y.; He, M.; Zhang, B.; Wu, W.; Cai, P.; Huo, D.; Hong, Y. Comparative chloroplast genomes: Insights into the evolution of the chloroplast genome of Camellia sinensis and the phylogeny of Camellia. BMC genomics 2021, 22, 138. [Google Scholar] [CrossRef]
  41. Liu, J.; Fang, J.; He, Z.; Li, J.; Dong, L. Target site–based resistance to penoxsulam in late watergrass (Echinochloa phyllopogon) from China. Weed Sci. 2019, 67, 1–9. [Google Scholar] [CrossRef]
  42. Qiong, P.; Heping, H.; Xia, Y.; Lianyang, B.; Qin, Y.; Powles, S.B. Quinclorac resistance in Echinochloa crus-galli from China. Rice Sci. 2019, 26, 300–308. [Google Scholar] [CrossRef]
  43. Yang, X.; Zhang, Z.; Gu, T.; Dong, M.; Peng, Q.; Bai, L.; Li, Y. Quantitative proteomics reveals ecological fitness cost of multi-herbicide resistant barnyardgrass (Echinochloa crus-galli L.). J. Proteom. 2017, 150, 160–169. [Google Scholar] [CrossRef]
  44. Shinozaki, K.; Ohme, M.; Tanaka, M.; Wakasugi, T.; Hayashida, N.; Matsubayashi, T.; Zaita, N.; Chunwongse, J.; Obokata, J.; Yamaguchi-Shinozaki, K. The complete nucleotide sequence of the tobacco chloroplast genome: Its gene organization and expression. EMBO J. 1986, 5, 2043–2049. [Google Scholar] [CrossRef]
  45. Wang, S.; Zhang, T.; Xu, L.; Zhan, Z.; Bao, G.; Zhang, T.; Ding, Z.; Sun, N.; Sun, S.; Xie, M. Comparative analysis of whole chloroplast genomes of Ligusticum sinense and L. jeholense, Umbelliferae. Res. Sq. 2020. [Google Scholar] [CrossRef]
  46. Fan, R.; Ma, W.; Liu, S.; Huang, Q. Integrated analysis of three newly sequenced fern chloroplast genomes: Genome structure and comparative analysis. Ecol. Evol. 2021, 11, 4550–4563. [Google Scholar] [CrossRef] [PubMed]
  47. NCBI. 2022. Available online: https://www.ncbi.nlm.nih.gov/nuccore/?term=Echinochloa+chloroplast+complete+genome (accessed on 18 October 2022).
  48. Wu, M.; Li, Q.; Hu, Z.; Li, X.; Chen, S. The complete Amomum kravanh chloroplast genome sequence and phylogenetic analysis of the commelinids. Molecules 2017, 22, 1875. [Google Scholar] [CrossRef] [PubMed] [Green Version]
  49. Zhou, J.; Cui, Y.; Chen, X.; Li, Y.; Xu, Z.; Duan, B.; Li, Y.; Song, J.; Yao, H. Complete chloroplast genomes of Papaver rhoeas and Papaver orientale: Molecular structures, comparative analysis, and phylogenetic analysis. Molecules 2018, 23, 437. [Google Scholar] [CrossRef] [PubMed] [Green Version]
  50. Guo, H.; Liu, J.; Luo, L.; Wei, X.; Zhang, J.; Qi, Y.; Zhang, B.; Liu, H.; Xiao, P. Complete chloroplast genome sequences of Schisandra chinensis: Genome structure, comparative analysis, and phylogenetic relationship of basal angiosperms. Sci. China Life Sci. 2017, 60, 1286–1290. [Google Scholar] [CrossRef]
  51. Doorduin, L.; Gravendeel, B.; Lammers, Y.; Ariyurek, Y.; Chin-A-Woeng, T.; Vrieling, K. The complete chloroplast genome of 17 individuals of pest species Jacobaea vulgaris: SNPs, microsatellites and barcoding markers for population and phylogenetic studies. DNA Res. 2011, 18, 93–105. [Google Scholar] [CrossRef]
  52. He, S.; Wang, Y.; Volis, S.; Li, D.; Yi, T. Genetic diversity and population structure: Implications for conservation of wild soybean (Glycine soja Sieb. et Zucc) based on nuclear and chloroplast microsatellite variation. Int. J. Mol. Sci. 2012, 13, 12608–12628. [Google Scholar] [CrossRef] [Green Version]
  53. Yang, A.H.; Zhang, J.J.; Yao, X.H.; Huang, H.W. Chloroplast microsatellite markers in Liriodendron tulipifera (Magnoliaceae) and cross-species amplification in L. chinense. Am. J. Bot. 2011, 98, e123–e126. [Google Scholar] [CrossRef]
  54. Xue, J.; Wang, S.; Zhou, S.L. Polymorphic chloroplast microsatellite loci in Nelumbo (Nelumbonaceae). Am. J. Bot. 2012, 99, e240–e244. [Google Scholar] [CrossRef]
  55. Han, Y.; Gao, Y.; Zhai, X.; Zhou, H.; Ding, Q.; Ma, L. Assembly and comparative analysis of chloroplast genome of wheat K-CMS line and maintainer line. Res. Sq. 2020. [Google Scholar] [CrossRef] [Green Version]
  56. Cavalier-Smith, T. Chloroplast evolution: Secondary symbiogenesis and multiple losses. Curr. Biol. 2002, 12, R62–R64. [Google Scholar] [CrossRef] [Green Version]
  57. Landegren, U.; Nilsson, M.; Kwok, P.-Y. Reading bits of genetic information: Methods for single-nucleotide polymorphism analysis. Genome Res. 1998, 8, 769–776. [Google Scholar] [CrossRef] [PubMed] [Green Version]
  58. Germano, J.; Klein, A.S. Species-specific nuclear and chloroplast single nucleotide polymorphisms to distinguish Picea glauca, P. mariana and P. rubens. Theor. Appl. Genet. 1999, 99, 37–49. [Google Scholar] [CrossRef]
  59. Jeffares, D.C.; Tomiczek, B.; Sojo, V.; Reis, M.D. A beginners guide to estimating the non-synonymous to synonymous rate ratio of all protein-coding genes in a genome. In Parasite Genomics Protocols; Springer: Berlin/Heidelberg, Germany, 2015; pp. 65–90. [Google Scholar]
  60. McDonald, M.J.; Wang, W.-C.; Huang, H.-D.; Leu, J.-Y. Clusters of nucleotide substitutions and insertion/deletion mutations are associated with repeat sequences. PLoS Biol. 2011, 9, e1000622. [Google Scholar] [CrossRef] [Green Version]
  61. Wang, W.; Messing, J. High-throughput sequencing of three Lemnoideae (duckweeds) chloroplast genomes from total DNA. PLoS ONE 2011, 6, e24670. [Google Scholar] [CrossRef] [Green Version]
  62. Raubeson, L.A.; Peery, R.; Chumley, T.W.; Dziubek, C.; Fourcade, H.M.; Boore, J.L.; Jansen, R.K. Comparative chloroplast genomics: Analyses including new sequences from the angiosperms Nuphar advena and Ranunculus macranthus. BMC Genom. 2007, 8, 174. [Google Scholar] [CrossRef]
  63. Yang, M.; Zhang, X.; Liu, G.; Yin, Y.; Chen, K.; Yun, Q.; Zhao, D.; Al-Mssallem, I.S.; Yu, J. The complete chloroplast genome sequence of date palm (Phoenix dactylifera L.). PLoS ONE 2010, 5, e12762. [Google Scholar] [CrossRef] [Green Version]
  64. Daniell, H.; Lin, C.-S.; Yu, M.; Chang, W.-J. Chloroplast genomes: Diversity, evolution, and applications in genetic engineering. Genome Biol. 2016, 17, 134. [Google Scholar] [CrossRef] [Green Version]
  65. Logacheva, M.D.; Krinitsina, A.A.; Belenikin, M.S.; Khafizov, K.; Konorov, E.A.; Kuptsov, S.V.; Speranskaya, A.S. Comparative analysis of inverted repeats of polypod fern (Polypodiales) plastomes reveals two hypervariable regions. BMC Plant Biol. 2017, 17, 61–73. [Google Scholar] [CrossRef] [Green Version]
  66. Kim, J.; Hwang, I.; Cho, K. Effect of storage conditions on the dormancy release and the induction of secondary dormancy in weed seeds. Korean J. Weed Sci. 1996, 16, 200–209. [Google Scholar]
  67. Li, H.-T.; Yi, T.-S.; Gao, L.-M.; Ma, P.-F.; Zhang, T.; Yang, J.-B.; Gitzendanner, M.A.; Fritsch, P.W.; Cai, J.; Luo, Y. Origin of angiosperms and the puzzle of the Jurassic gap. Nat. Plants 2019, 5, 461–470. [Google Scholar] [CrossRef] [PubMed]
  68. Li, X.; Yang, Y.; Henry, R.J.; Rossetto, M.; Wang, Y.; Chen, S. Plant DNA barcoding: From gene to genome. Biol. Rev. 2015, 90, 157–166. [Google Scholar] [CrossRef] [PubMed]
  69. Zhang, Z.; Zhang, Y.; Song, M.; Guan, Y.; Ma, X. Species identification of Dracaena using the complete chloroplast genome as a super-barcode. Front. Pharmacol. 2019, 10, 1441. [Google Scholar] [CrossRef]
  70. Yang, J.-B.; Yang, S.-X.; Li, H.-T.; Yang, J.; Li, D.-Z. Comparative chloroplast genomes of Camellia species. PLoS ONE 2013, 8, e73053. [Google Scholar] [CrossRef] [Green Version]
  71. Zhang, Y.; Song, M.-F.; Sun, H.-F.; Tang, D.-Y.; Xu, A.-S.; Zhang, Z.-L. Complete chloroplast genome analysis of two important medicinal Alpinia species: Alpinia galanga and Alpinia kwangsiensis. Front. Plant Sci. 2021, 12, 2908. [Google Scholar] [CrossRef]
  72. Gao, Y.; Li, J.; Pan, X.; Liu, D.; Napier, R.; Dong, L. Quinclorac resistance induced by the suppression of the expression of 1-aminocyclopropane-1-carboxylic acid (ACC) synthase and ACC oxidase genes in Echinochloa crus-galli var. zelayensis. Pestic. Biochem. Physiol. 2018, 146, 25–32. [Google Scholar] [CrossRef] [Green Version]
  73. Gao, Y.; Pan, X.; Sun, X.; Li, J.; Dong, L. Is the protection of photosynthesis related to the mechanism of quinclorac resistance in Echinochloa crus-galli var. zelayensis? Gene 2019, 683, 133–148. [Google Scholar] [CrossRef]
  74. Wortley, A.H.; Rudall, P.J.; Harris, D.J.; Scotland, R.W. How much data are needed to resolve a difficult phylogeny? Case study in Lamiales. Syst. Biol. 2005, 54, 697–709. [Google Scholar] [CrossRef] [Green Version]
  75. Petersen, G.; Aagesen, L.; Seberg, O.; Larsen, I.H. When is enough, enough in phylogenetics? A case in point from Hordeum (Poaceae). Cladistics 2011, 27, 428–446. [Google Scholar] [CrossRef]
  76. Miller, M.A.; Pfeiffer, W.; Schwartz, T. Creating the CIPRES Science Gateway for inference of large phylogenetic trees. In Proceedings of the 2010 Gateway Computing Environments Workshop (GCE), New Orleans, LA, USA, 14 November 2010; pp. 1–8. [Google Scholar]
  77. Stamatakis, A. RAxML version 8: A tool for phylogenetic analysis and post-analysis of large phylogenies. Bioinformatics 2014, 30, 1312–1313. [Google Scholar] [CrossRef] [PubMed] [Green Version]
  78. Felsenstein, J. Confidence limits on phylogenies: An approach using the bootstrap. Evolution 1985, 39, 783–791. [Google Scholar] [CrossRef] [PubMed]
  79. Wu, Z.; Tembrock, L.R.; Ge, S. Are differences in genomic data sets due to true biological variants or errors in genome assembly: An example from two chloroplast genomes. PLoS ONE 2015, 10, e0118019. [Google Scholar] [CrossRef] [PubMed]
Figure 1. Morphology of three barnyard grass species. (a). Comparison of morphology of shoots. (b). Differences in the morphology of seeds.
Ijms 23 13864 g001
Figure 2. Differences in sensitivity to florpyrauxifen-benzyl and tripyrasulfone among E. crus-galli var. crus-galli, E. crus-galli var. zelayensis, and E. glabrescens. “F” means florpyrauxifen-benzyl treatment and the doses from left to right are 0, 9, 18, and 36 g a.i. ha−1. “T” means tripyrasulfone treatment and the doses from left to right are 0, 67.5, 135, and 270 g a.i. ha−1. “Ecc” means E. crus-galli var. crus-galli. “Ecz” means E. crus-galli var. zelayensis. “Eg” means E. glabrescens. ”-1” means biotype 1. ”-2” means biotype 2. ANOVA significance groupings were shown as a–j. (a) Differences in morphology after florpyrauxifen-benzyl and tripyrasulfone treatment. (b) Fresh weights of plants from each biotype at the end of equivalent treatment periods plotted as a percentage of the respective control.
Ijms 23 13864 g002
Figure 3. Assembly, size, and features of cp genomes of three Echinochloa spp. The genes outside the circle are transcribed in the counterclockwise direction, and the genes inside the circle are transcribed in the clockwise direction. Different colors in genes represent different functions. The dark gray area and light gray area of the inner circle represent the GC content to AT content of the genome, respectively.
Ijms 23 13864 g003
Figure 4. Classifications of gene functions of E. crus-galli var. crus-galli, E. crus-galli var. zelayensis, and E. glabrescens. (a) Percentages of genes matched to GO function classification. BP means biological process, CC means cellular component, and MF means molecular function. (b) Number of unigenes matched to KOG function classification.
Ijms 23 13864 g004
Figure 5. Comparison of LSC, IRb, SSC, and IRa border regions in ten species of Echinochloa spp. The species in bold font were sequenced in this study.
Ijms 23 13864 g005
Figure 6. Phylogenetic tree for 20 species of Gramineae using maximum likelihood, based on alignments of complete chloroplast genomes. The numbers at the nodes indicate bootstrap values from 1000 replicates. If the bootstrap values are 100, this number was not shown on the nodes. The species in bold font were sequenced in this study.
Ijms 23 13864 g006
Table 1. Differences in seeds of three Chinchaga spp.
Echinochloa spp.Length of Awn (cm)Dry Weight Per 1000 Seeds (g)
E. crusgalli var. crusgalli1.63 ± 0.05 a2.806 ± 0.011 b
E. crusgalli var. zelayensis0.00 ± 0.00 b2.139 ± 0.016 c
E. glabrescens0.00 ± 0.00 b3.006 ± 0.032 a
“a–c” are the significance levels at different lengths of awn or dry weight per 1000 seeds of each barnyard grass species.
Table 2. Summary of chloroplast genome features in three barnyard grass biotypes.
Genome FeaturesE. crus-galli var. crus-galliE. crus-galli var. zelayensisE. glabrescens
Genome size (bp)139,856139,874139,874
LSC length (bp)81,84381,89081,890
SSC length (bp)12,51712,51412,514
IR length (bp)22,74822,73522,735
Intergenic region length (bp)79,77579,75179,751
Overall GC content (%)38.6338.6338.63
GC content of LSC (%)36.4736.4636.46
GC content of SSC (%)33.2133.2233.22
GC content of IRs (%)44.0144.0344.02
Total genes132132132
Number of protein-coding genes848484
Table 3. Non-coding RNA statistics.
Echinochloa spp.TypencRNA NumberTotal Length (bp)Average Length (bp)Length/
Genome (%)
E. crus-galli var. crus-gallitRNA402972 *742.13
rrn232577828894.13
rrn4.52190950.14
rrn162298214912.13
rrn522421210.17
E. crus-galli var. zelayensistRNA402976742.13
rrn232557927893.99
rrn4.52190950.14
rrn162298214912.13
rrn522421210.17
E. glabrescenstRNA402976742.13
rrn232538026903.85
rrn4.52190950.14
rrn162298214912.13
rrn522421210.17
* The bold number indicates that the data are different among the three barnyard grass species.
Table 4. Genes encoded by three species of Echinochloa chloroplast genome.
CategoryGroupsGenes
PhotosynthesisSubunits_of_photosystem_IpsaA, psaB, psaC, psaI, and psaJ
Subunits_of_photosystem_IIpbsN, psbA, psbB, psbC, psbD, psbE, psbF, psbH, psbI, psbJ, psbK, psbL, psbM, psbT, and psbZ
Subunits_of_NADH_dehydrogenasendhA, ndhB, ndhB, ndhC, ndhD, ndhE, ndhF, ndhG, ndhH, ndhI, ndhJ, and ndhK
Subunits_of_cytochrome_b/f_complexpetA, petB, petD, petG, petL, and petN
Subunits_of_ATP_synthaseatpA, atpB, atpE, atpF, atpH, and atpI
Large_subunit_of_RubiscorbcL
Self-replicationLarge_subunits_of_ribosomerpl14, rpl16, rpl2, rpl2, rpl20, rpl22, rpl23, rpl23, rpl32, rpl33, and rpl36
Small_subunits_of_ribosomerps11, rps12, rps12, rps14, rps15, rps15, rps16, rps18, rps19, rps19, rps2, rps3, rps4, rps7, rps7, and rps8
DNA-dependent_RNA_polymeraserpoA, rpoB, rpoC1, and rpoC2
Ribosomal_RNAs8 rRNA
Transfer_RNAs40 tRNAs
Other genesMaturasematK
ProteaseclpP1
Envelope_membrane_proteincemA
Acetyl-CoA_carboxylase
C-type_cytochrome_synthesis_geneccsA
Translation_initiation_factorinfA
protochlorophillide_reductase_subunit
Genes of unknown functionProteins_of_unknown_functionycf2, ycf3, and ycf4
Table 5. SSRs and LRs in three barnyard grass biotypes.
Types of RepeatsE. crus-galli var. crus-galliE. crus-galli var. zelayensisE. glabrescens
SSR
Region Distribution
Genome136139139
Coding434242
IRa555
IRb555
LSC110113113
SSC161616
LR
Hamming Distance
0899
1022
2212121
3333636
Table 6. Single-Nucleotide Polymorphism (SNP) in Echinochloa crus-galli var. crus-galli and E. glabrescens compared to E. crus-galli var. crus-galli.
Barnyard Grass SpeciesStartStopSynonymousNon-SynonymousCDSIntergenicTotal_SNP
E. crus-galli var. crus-galli01762198223321
E. glabrescens0000011
Publisher’s Note: MDPI stays neutral with regard to jurisdictional claims in published maps and institutional affiliations.

