

Tumor-Associated Lymphatics Upregulate MHC-II to Suppress Tumor-Infiltrating Lymphocytes

 ,
,  and
and 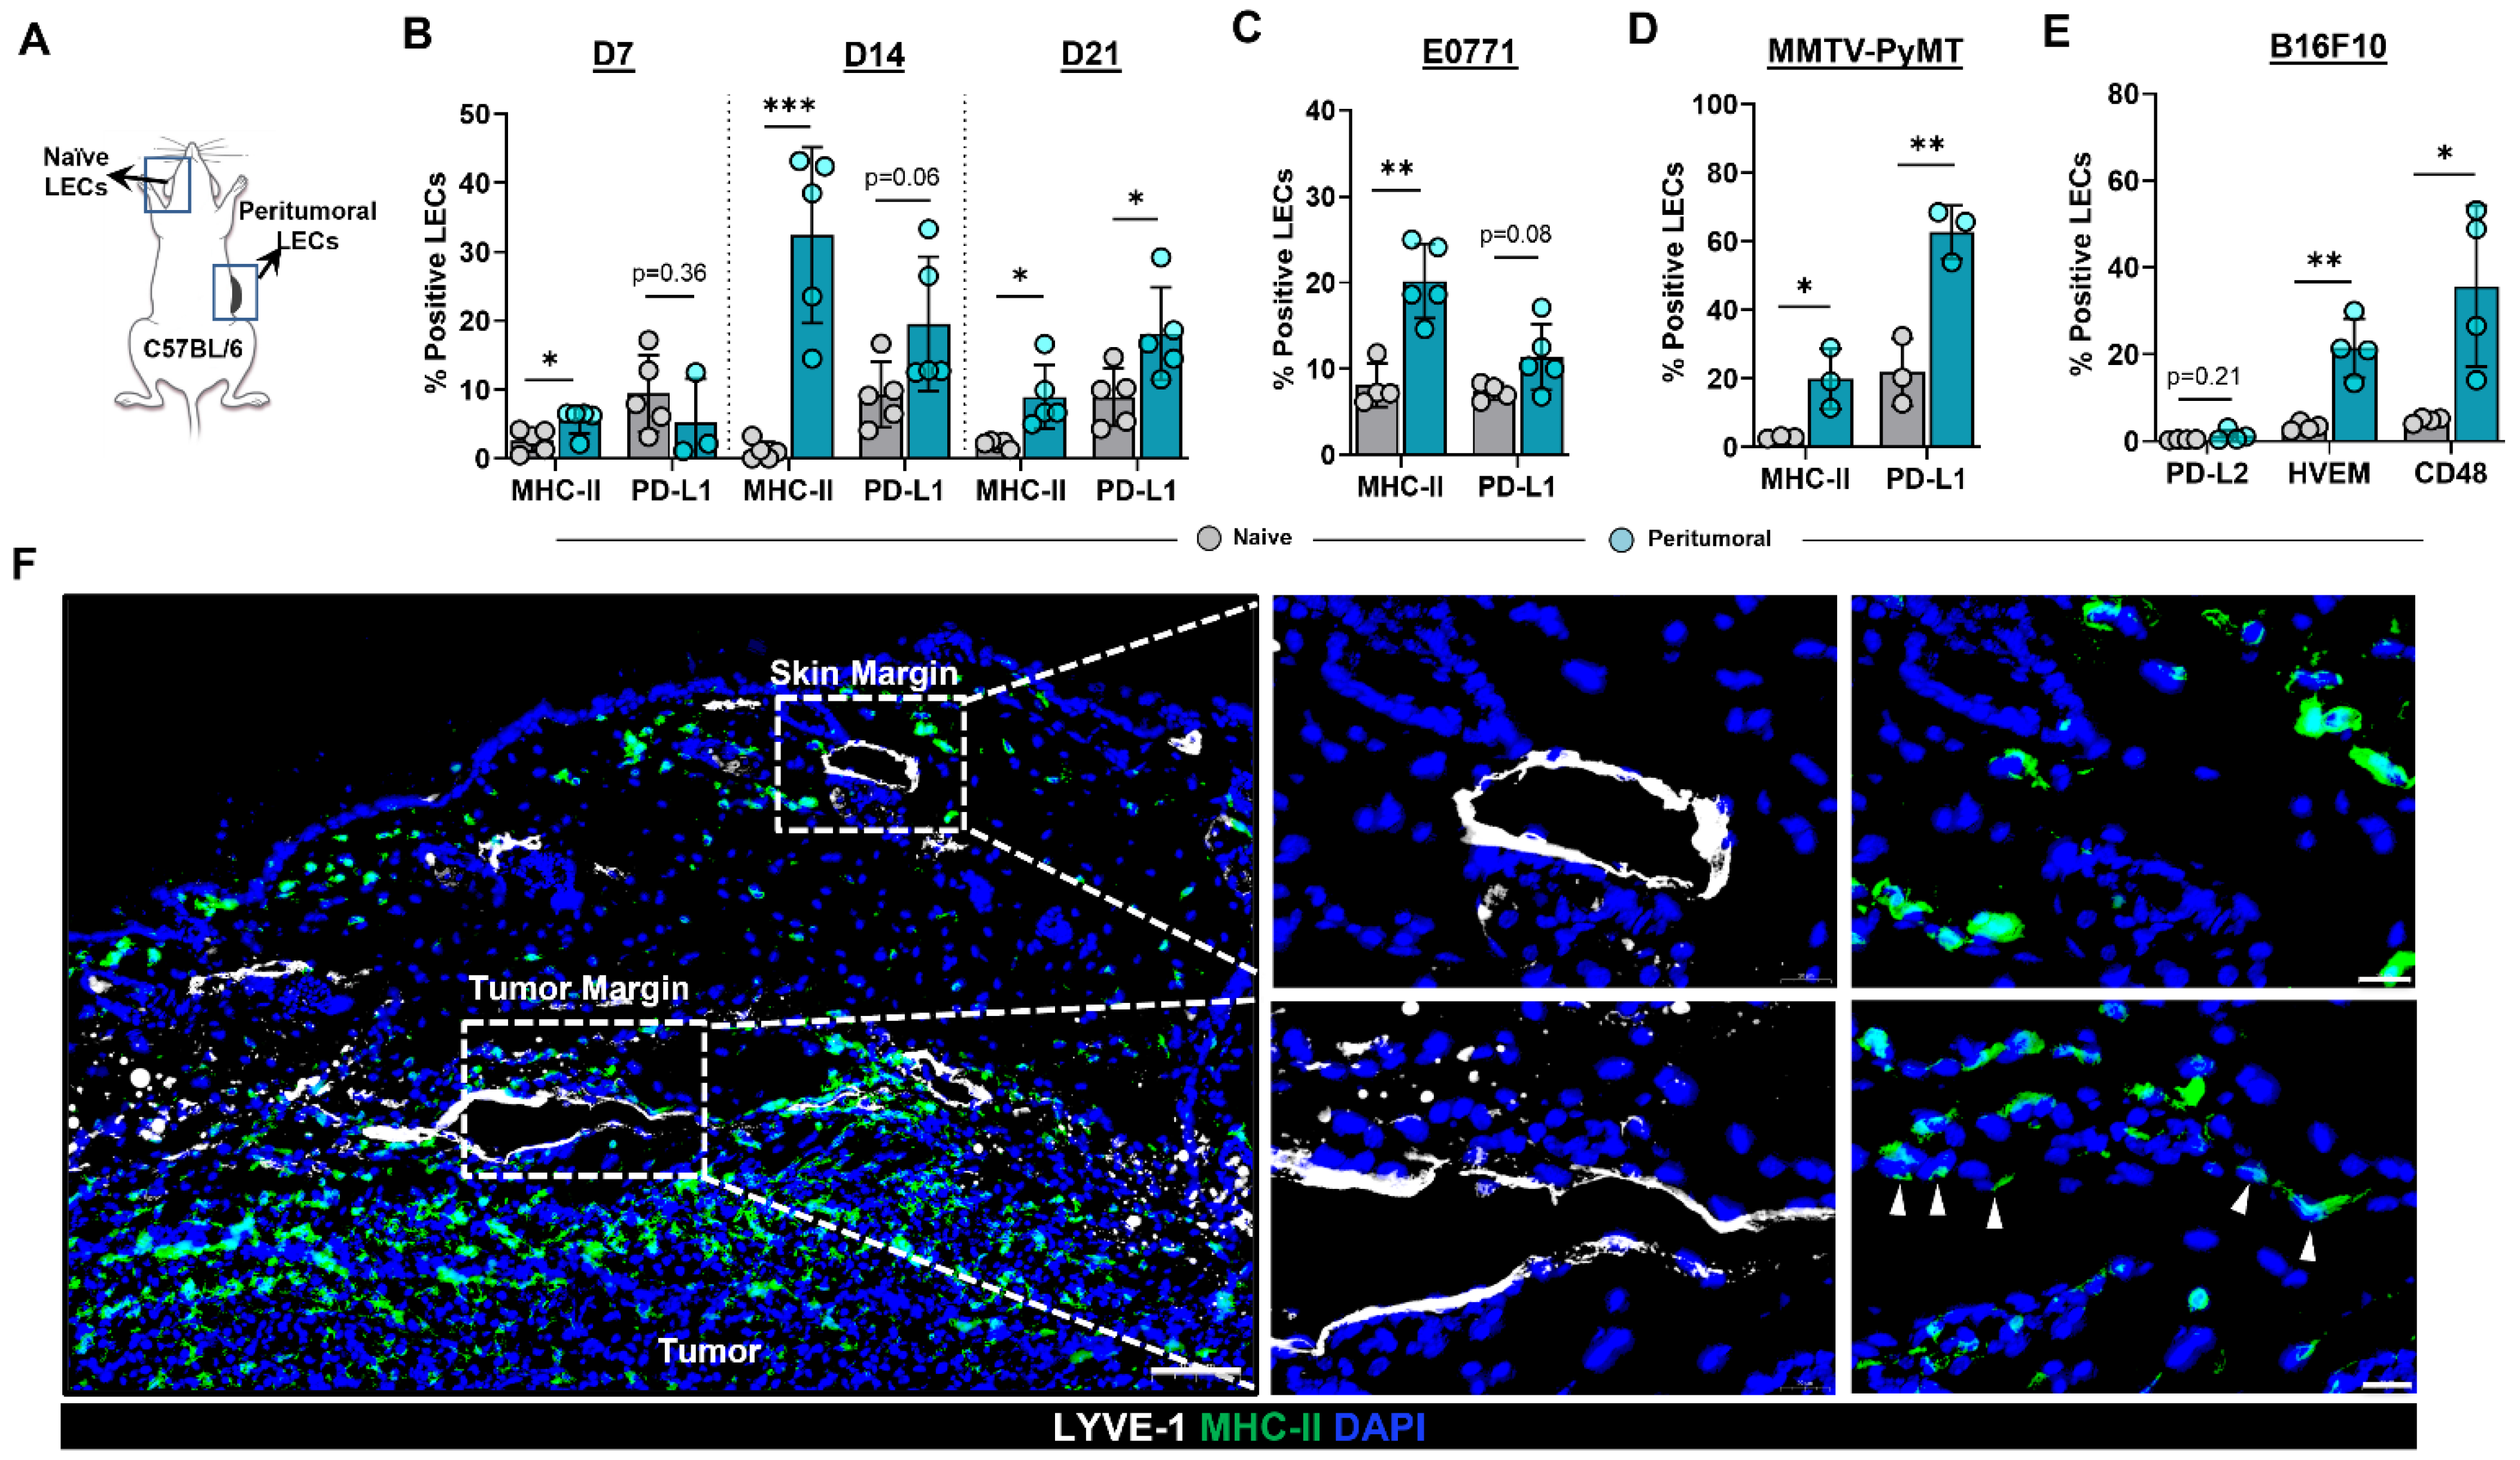
Abstract
1. Introduction
2. Results
2.1. Peritumoral Lymphatics Upregulate MHC-II Expression in the Context of Co-Inhibitory Molecules
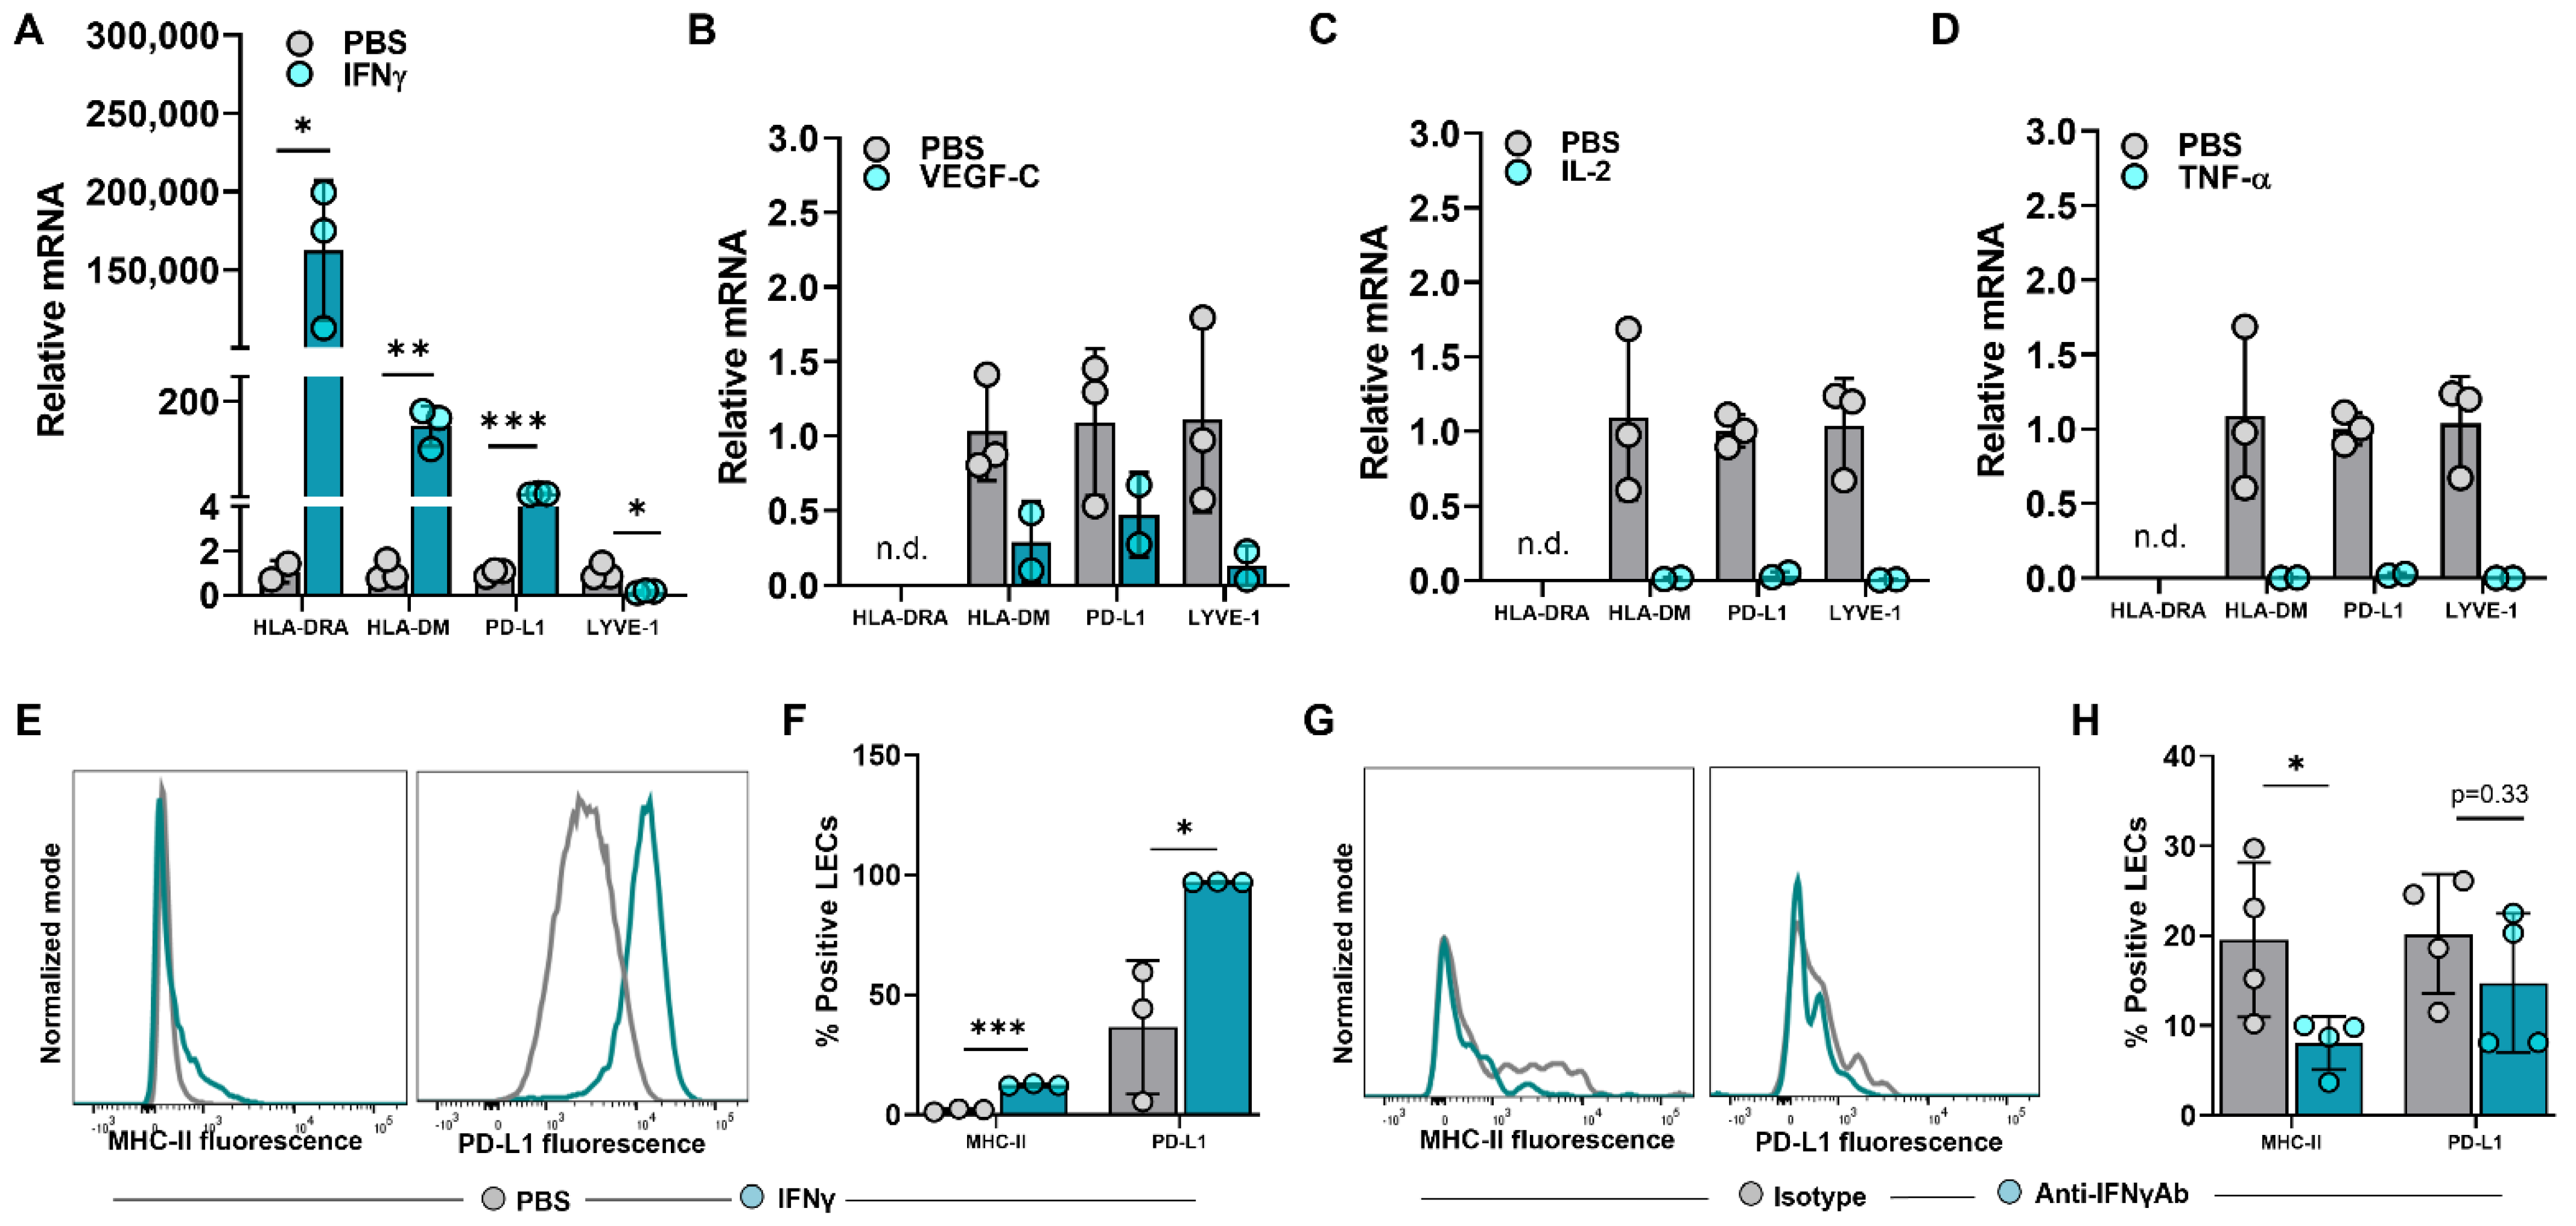
2.2. IFNγ Induces Upregulation of MHC-II in LECs
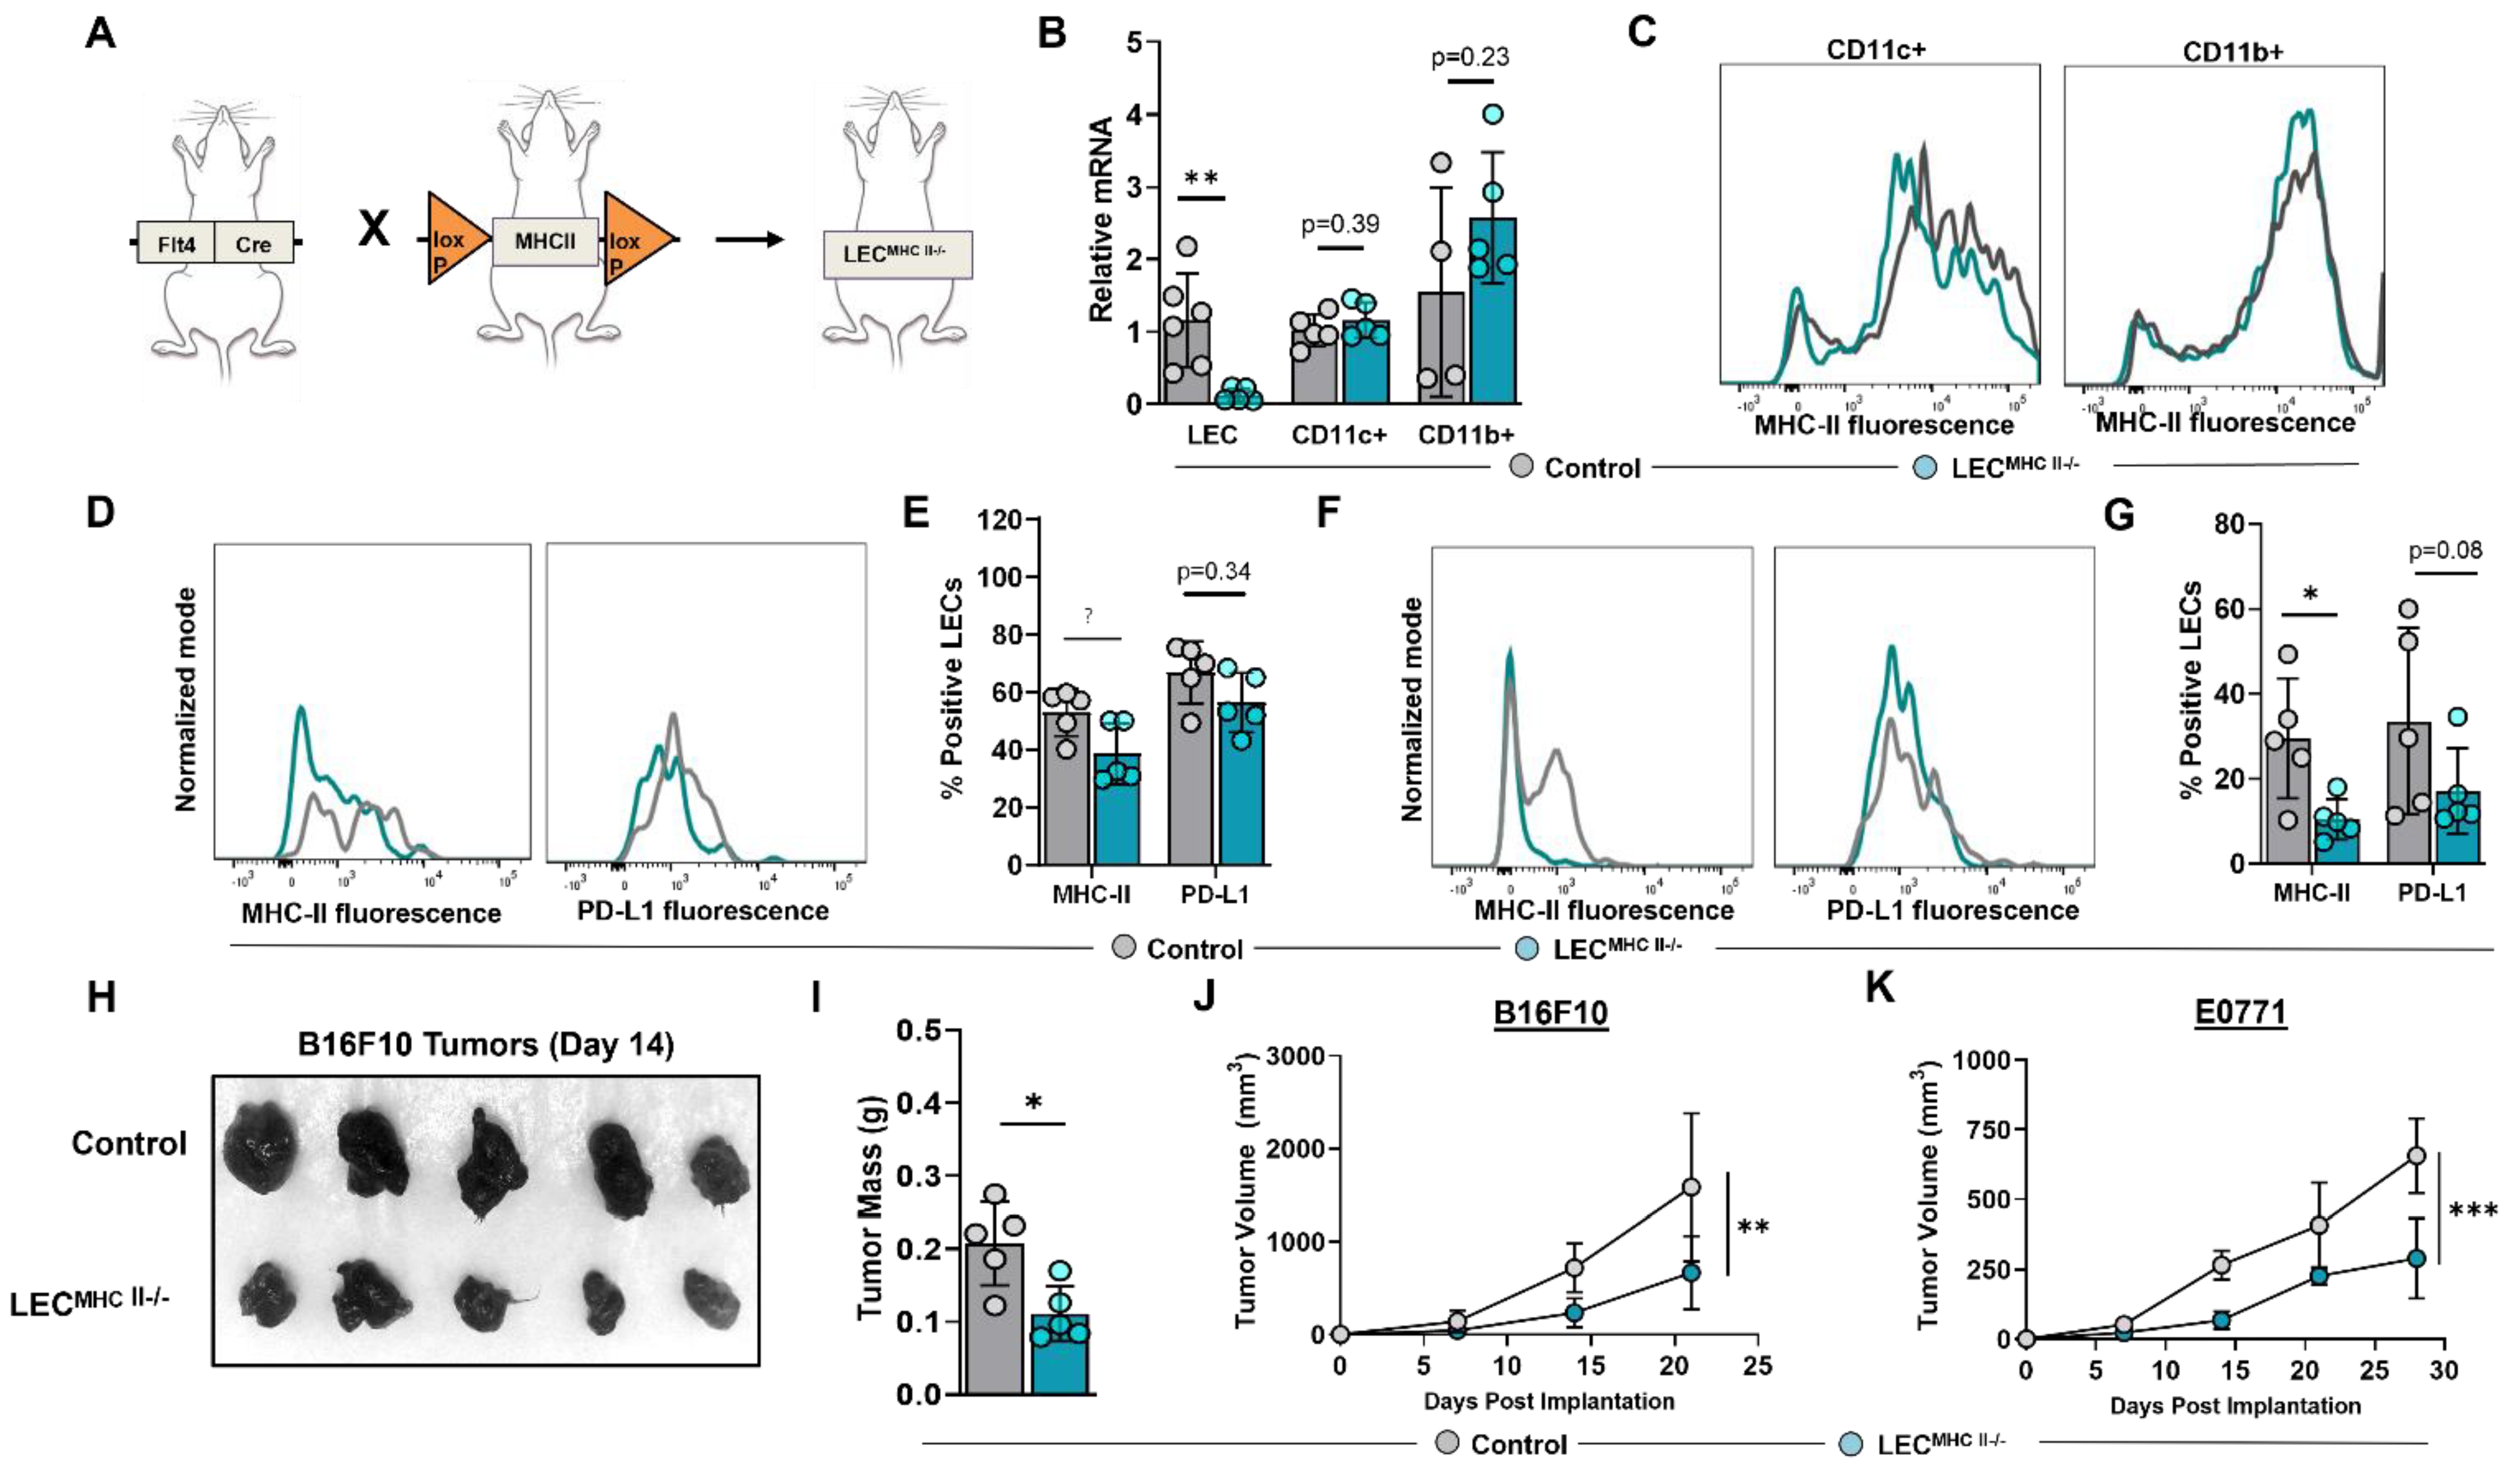
2.3. Generation of a Conditional, Lymphatic-Specific MHC-II−/− Mouse Model
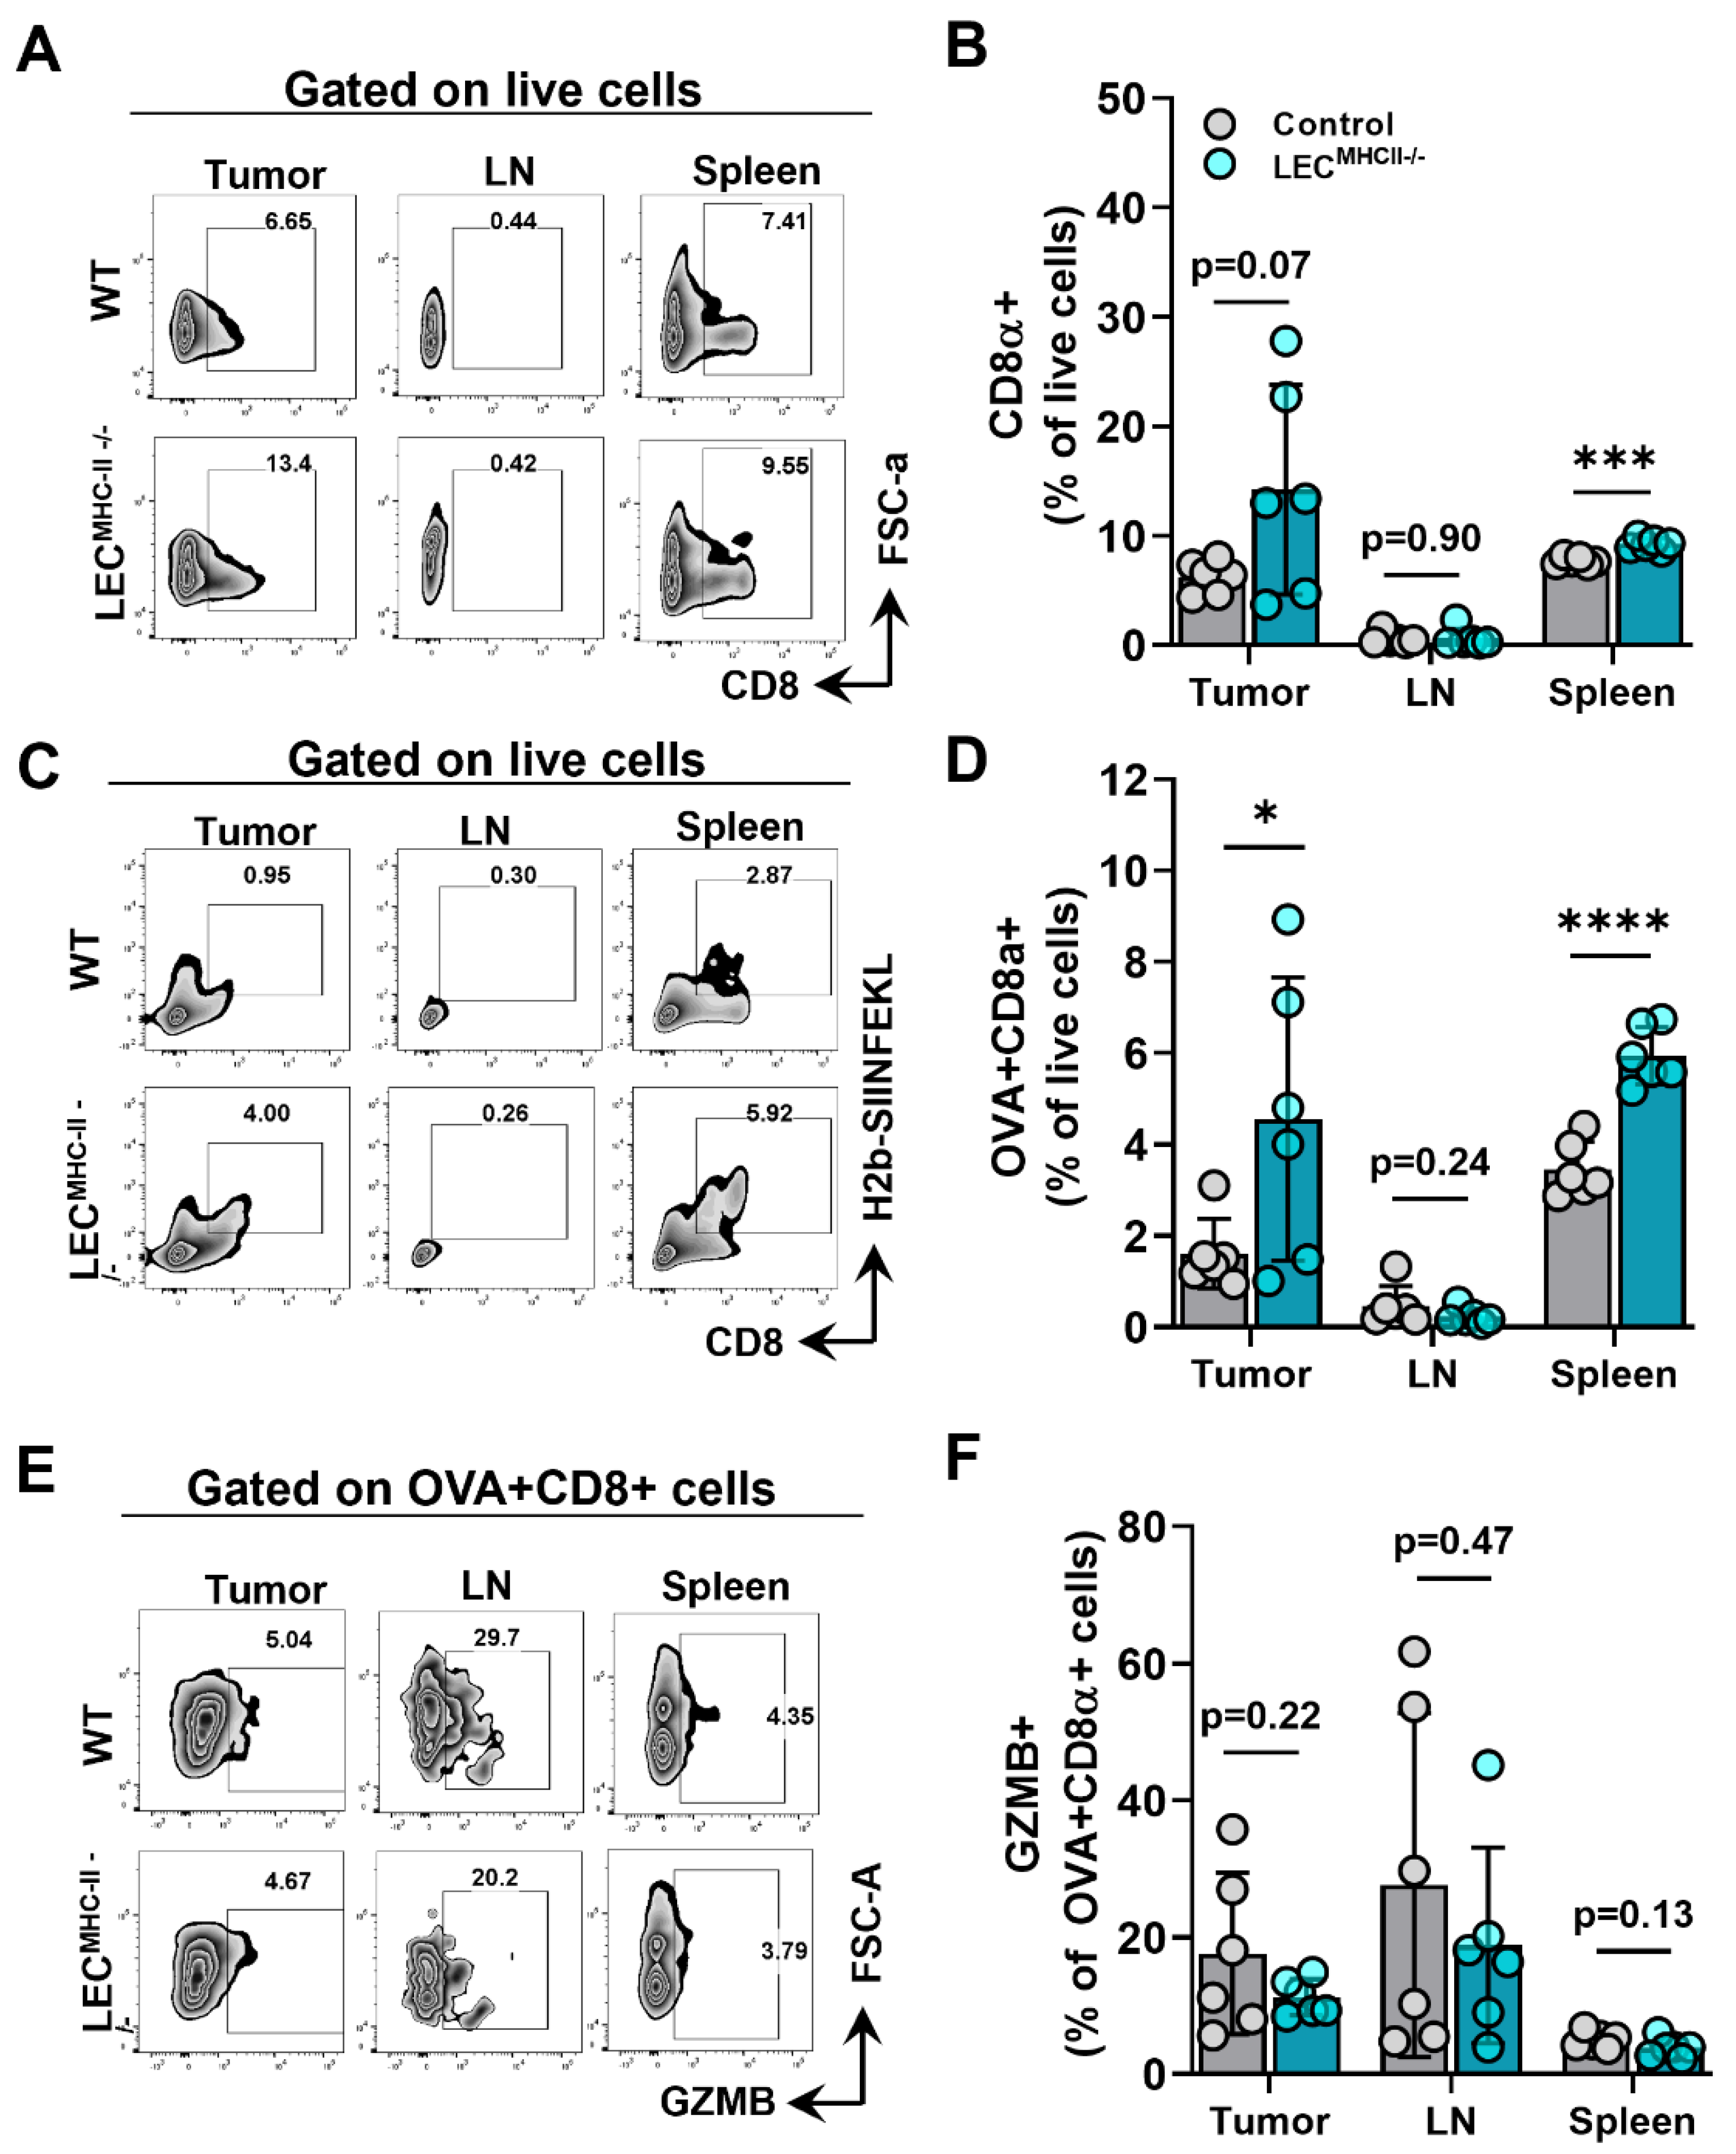
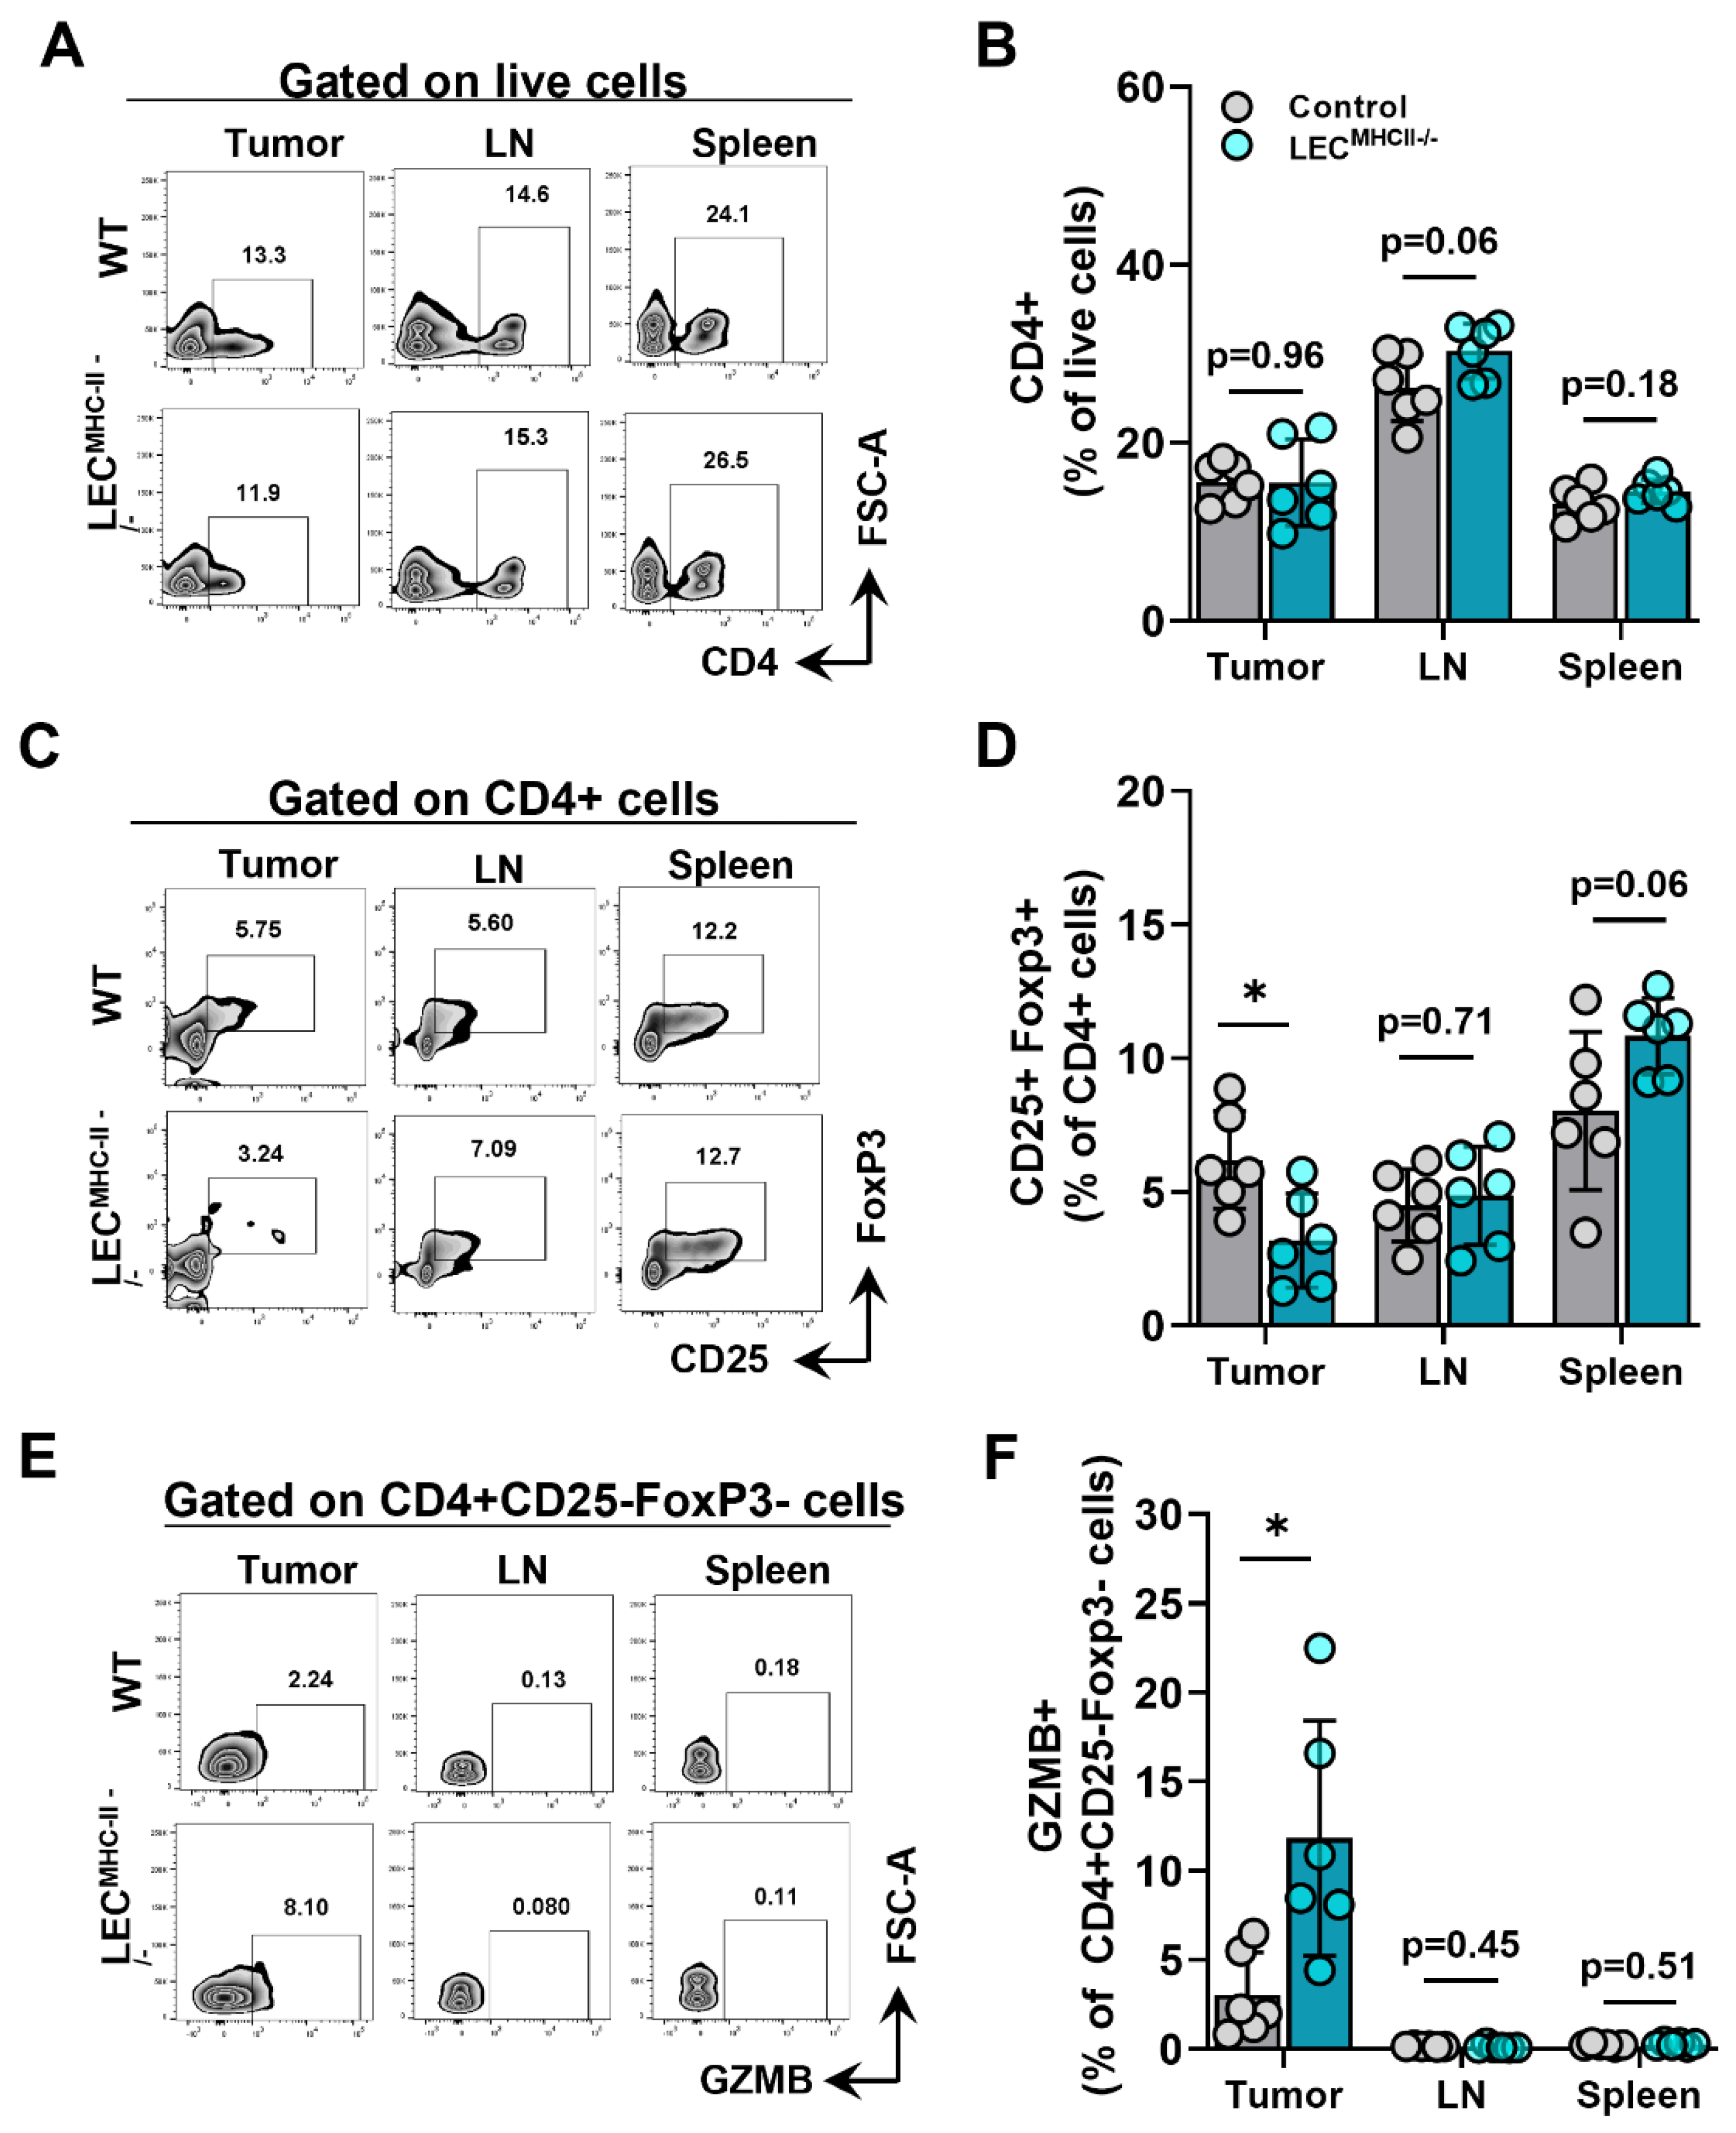
2.4. Attenuated Tumor Growth in Lymphatic-Specific MHC-II−/− Background Is Associated with Effector Phenotypes in TILs
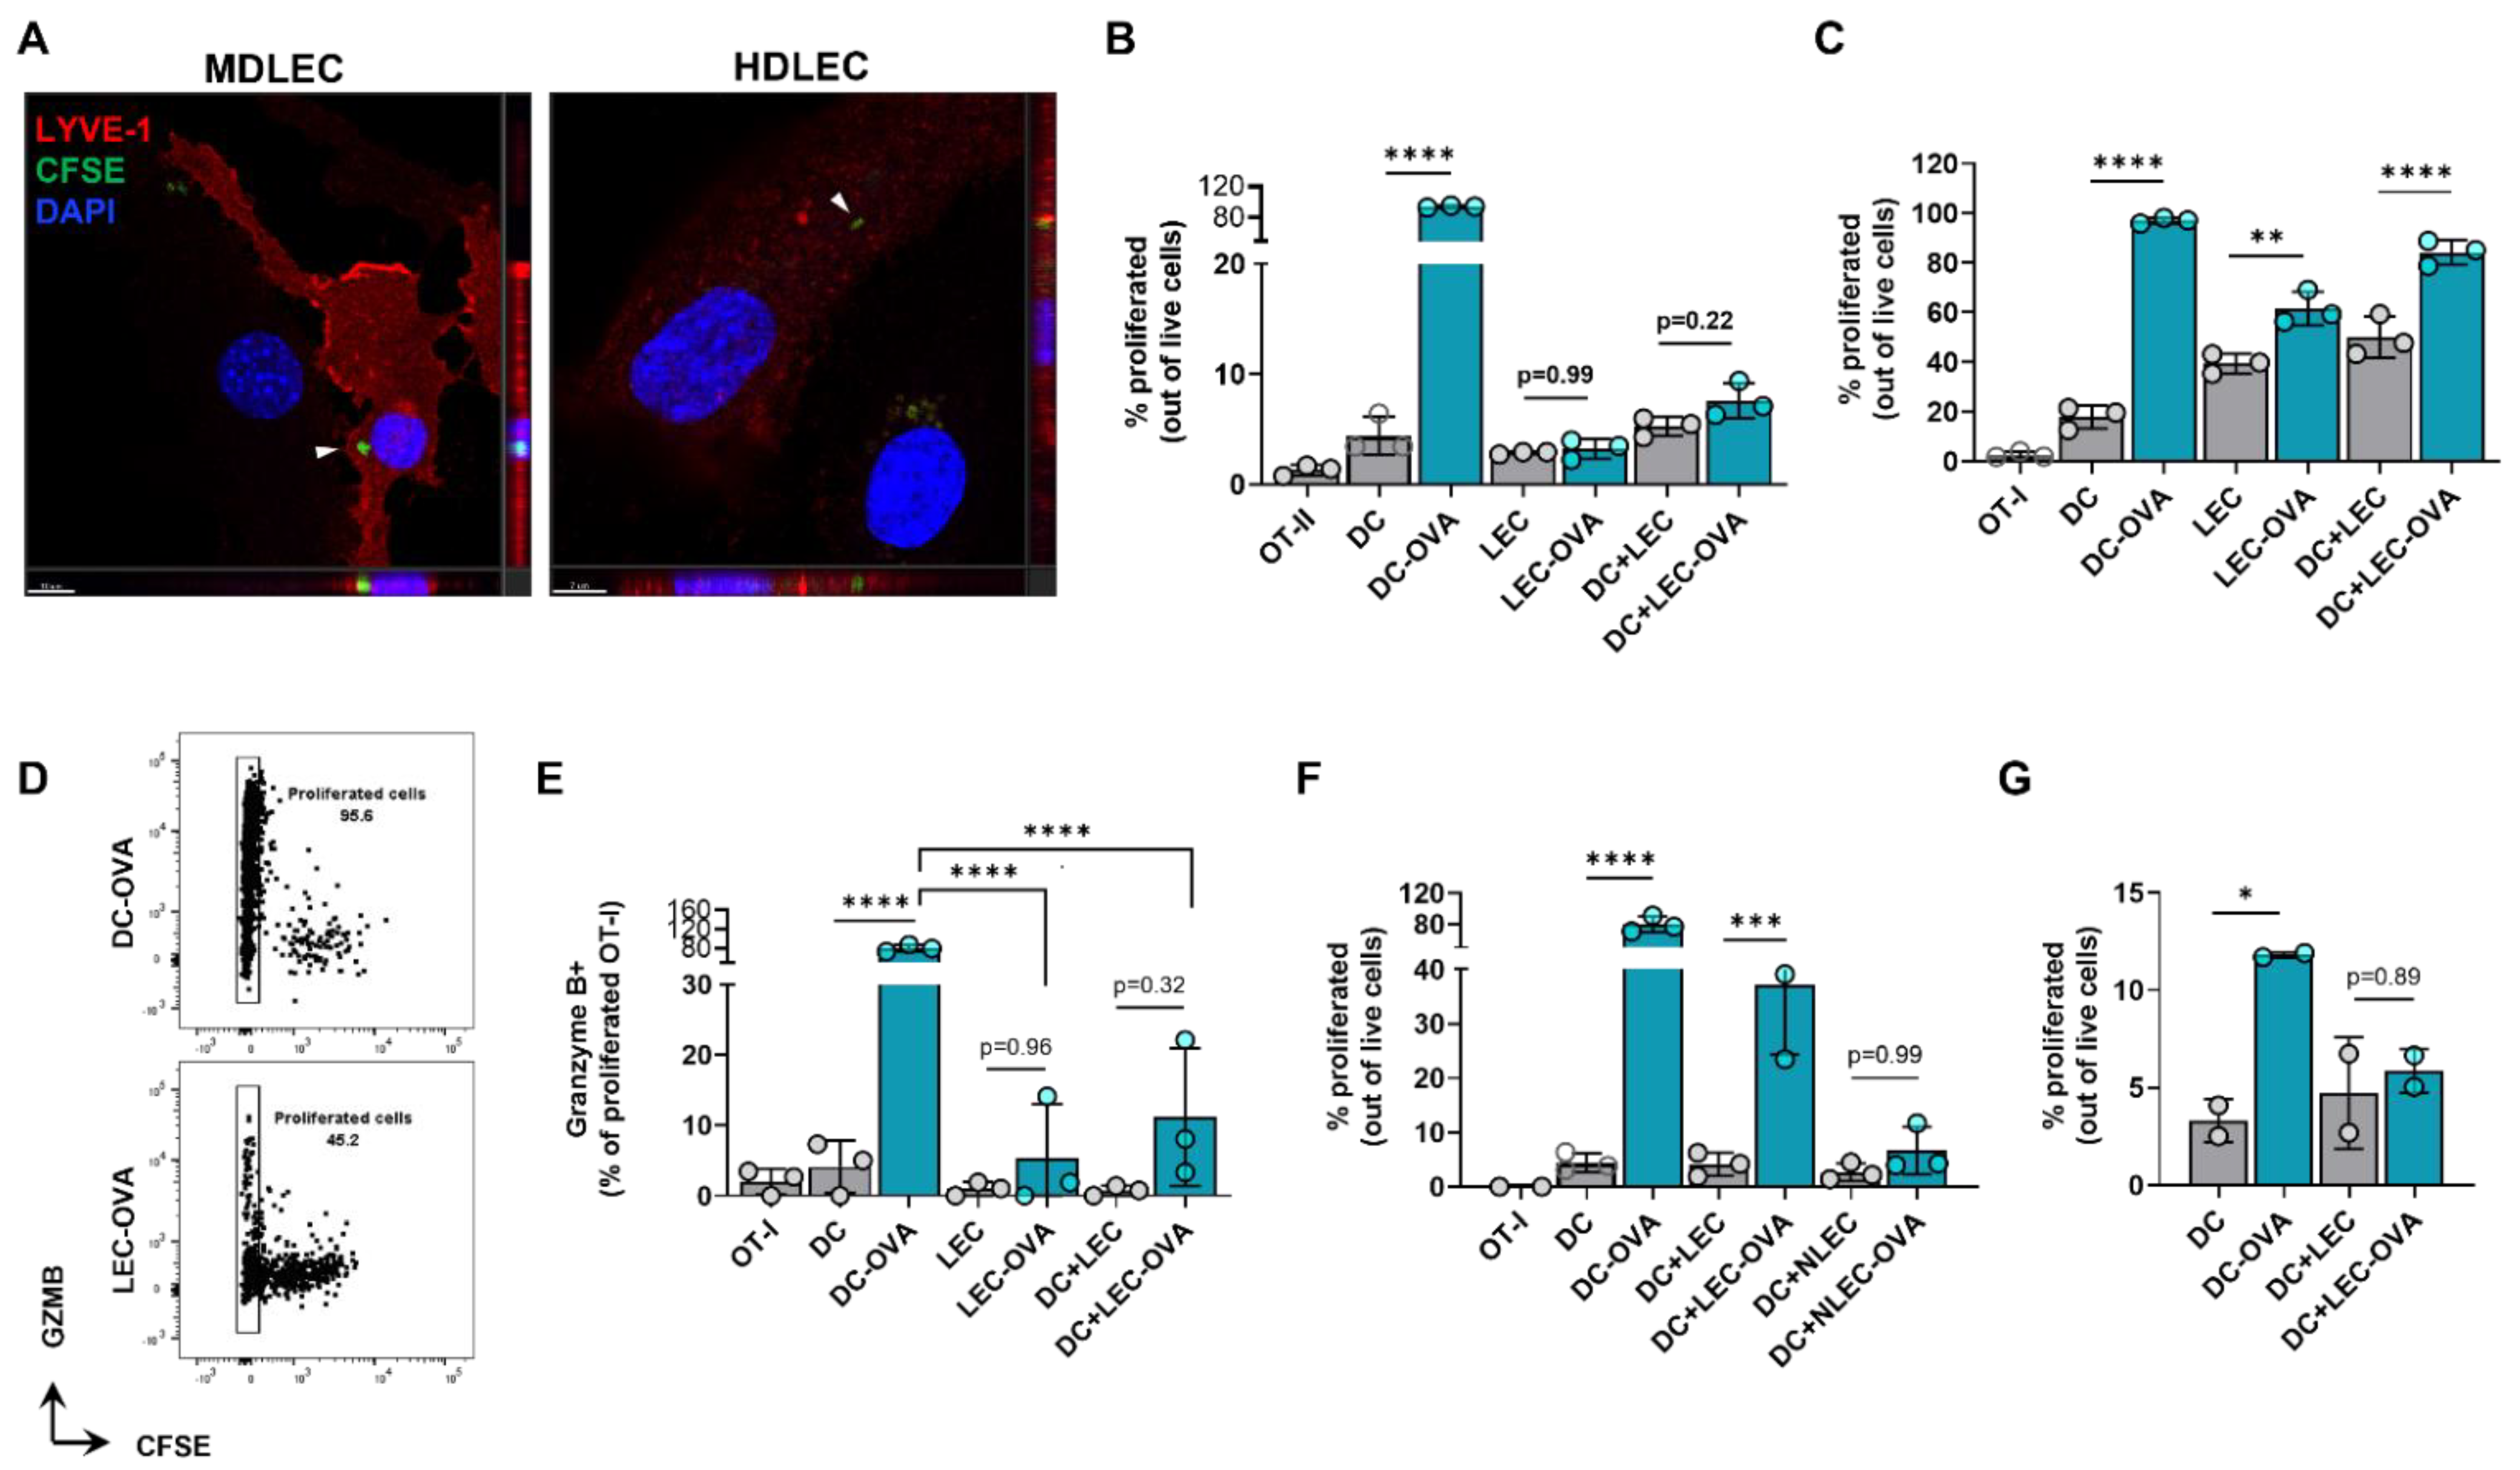
2.5. Cultured LECs Take Up Tumor Debris and Induce Antigen-Specific CD8+ T Cell Proliferation with Reduced Effector Function
3. Discussion
4. Materials and Methods
4.1. Mice
4.2. Tumor Models
4.3. Histology and Immunohistochemistry
4.4. In Vitro Cytokine Treatment
4.5. Quantitative PCR Analysis
4.6. Flow Cytometry
4.7. FACs Cell Sorting
4.8. Dendritic Cell Migration Assay
4.9. BMDC Isolation and Culture
4.10. Tumor Antigen Uptake
4.11. T Cell Proliferation
4.12. Publicly Available Data
4.13. Statistical Analysis
Supplementary Materials
Author Contributions
Funding
Institutional Review Board Statement
Informed Consent Statement
Data Availability Statement
Acknowledgments
Conflicts of Interest
References
- Baghban, R.; Roshangar, L.; Jahanban-Esfahlan, R.; Seidi, K.; Ebrahimi-Kalan, A.; Jaymand, M.; Kolahian, S.; Javaheri, T.; Zare, P. Tumor microenvironment complexity and therapeutic implications at a glance. Cell Commun. Signal. 2020, 18, 1–19. [Google Scholar] [CrossRef] [PubMed]
- Hinshaw, D.C.; Shevde, L.A. The tumor microenvironment innately modulates cancer progression. Cancer Res. 2019, 79, 4557–4566. [Google Scholar] [CrossRef] [PubMed]
- Davidson, S.; Efremova, M.; Riedel, A.; Mahata, B.; Pramanik, J.; Huuhtanen, J. Single-Cell RNA Sequencing Reveals a Dynamic Stromal Niche That Supports Tumor Growth. Cell Rep. 2020, 31, 107628. [Google Scholar] [CrossRef]
- Wu, T.; Dai, Y. Tumor microenvironment and therapeutic response. Cancer Lett. 2016, 387, 61–68. [Google Scholar] [CrossRef]
- Fang, H.; DeClerck, Y.A. Targeting the Tumor Microenvironment: From Understanding Pathways to Effective Clinical Trials. Cancer Res. 2013, 73, 4965–4977. [Google Scholar] [CrossRef] [PubMed]
- Lund, A.; Wagner, M.; Fankhauser, M.; Steinskog, E.S.; Broggi, M.; Spranger, S.; Gajewski, T.F.; Alitalo, K.; Eikesdal, H.P.; Wiig, H.; et al. Lymphatic vessels regulate immune microenvironments in human and murine melanoma. J. Clin. Investig. 2016, 126, 3389–3402. [Google Scholar] [CrossRef]
- Roberts, E.W.; Broz, M.L.; Binnewies, M.; Headley, M.B.; Nelson, A.E.; Wolf, D.M. Critical role for CD103+/CD141+ dendritic cells bearing CCR7 for tumor antigen trafficking and priming of T cell immunity in melanoma. Cancer Cell 2016, 30, 324–336. [Google Scholar] [CrossRef]
- Stachura, J.; Wachowska, M.; Kilarski, W.W.; Güç, E.; Golab, J.; Muchowicz, A. The dual role of tumor lymphatic vessels in dissemination of metastases and immune response development. OncoImmunology 2016, 5, e1182278. [Google Scholar] [CrossRef]
- Clasper, S.; Royston, D.; Baban, D.; Cao, Y.; Ewers, S.; Butz, S.; Vestweber, D.; Jackson, D.G. A Novel Gene Expression Profile in Lymphatics Associated with Tumor Growth and Nodal Metastasis. Cancer Res. 2008, 68, 7293–7303. [Google Scholar] [CrossRef]
- Lane, R.S.; Femel, J.; Breazeale, A.P.; Loo, C.P.; Thibault, G.; Kaempf, A. IFNgamma-activated dermal lymphatic vessels inhibit cytotoxic T cells in melanoma and inflamed skin. J. Exp. Med. 2018, 215, 3057–3074. [Google Scholar] [CrossRef]
- Cohen, J.N.; Tewalt, E.F.; Rouhani, S.; Buonomo, E.L.; Bruce, A.N.; Xu, X.; Bekiranov, S.; Fu, Y.-X.; Engelhard, V. Tolerogenic Properties of Lymphatic Endothelial Cells Are Controlled by the Lymph Node Microenvironment. PLoS ONE 2014, 9, e87740. [Google Scholar] [CrossRef] [PubMed]
- Dubrot, J.; Duraes, F.D.V.; Potin, L.; Capotosti, F.; Brighouse, D.; Suter, T.; LeibundGut-Landmann, S.; Garbi, N.; Reith, W.; Swartz, M.A.; et al. Lymph node stromal cells acquire peptide–MHCII complexes from dendritic cells and induce antigen-specific CD4+ T cell tolerance. J. Exp. Med. 2014, 211, 1153–1166. [Google Scholar] [CrossRef] [PubMed]
- Cohen, J.N.; Guidi, C.J.; Tewalt, E.F.; Qiao, H.; Rouhani, S.; Ruddell, A.; Farr, A.G.; Tung, K.S.; Engelhard, V. Lymph node–resident lymphatic endothelial cells mediate peripheral tolerance via Aire-independent direct antigen presentation. J. Exp. Med. 2010, 207, 681–688. [Google Scholar] [CrossRef] [PubMed]
- Dubrot, J.; Duraes, F.V.; Harlé, G.; Schlaeppi, A.; Brighouse, D.; Madelon, N.; Göpfert, C.; Stokar-Regenscheit, N.; Acha-Orbea, H.; Reith, W.; et al. Absence of MHC-II expression by lymph node stromal cells results in autoimmunity. Life Sci. Alliance 2018, 1, e201800164. [Google Scholar] [CrossRef]
- Nichols, L.A.; Chen, Y.; Colella, T.A.; Bennett, C.; Clausen, B.; Engelhard, V. Deletional Self-Tolerance to a Melanocyte/Melanoma Antigen Derived from Tyrosinase Is Mediated by a Radio-Resistant Cell in Peripheral and Mesenteric Lymph Nodes. J. Immunol. 2007, 179, 993–1003. [Google Scholar] [CrossRef]
- Rouhani, S.; Eccles, J.; Riccardi, P.; Peske, J.D.; Tewalt, E.F.; Cohen, J.N.; Liblau, R.; Makinen, T.; Engelhard, V. Roles of lymphatic endothelial cells expressing peripheral tissue antigens in CD4 T-cell tolerance induction. Nat. Commun. 2015, 6, 6771. [Google Scholar] [CrossRef]
- Tewalt, E.F.; Cohen, J.N.; Rouhani, S.J.; Engelhard, V.H. Lymphatic endothelial cells - key players in regulation of tolerance and immunity. Front. Immunol. 2012, 3, 305. [Google Scholar] [CrossRef]
- Hirosue, S.; Vokali, E.; Raghavan, V.R.; Rincon-Restrepo, M.; Lund, A.W.; Corthesy-Henrioud, P. Steady-state antigen scavenging, cross-presentation, and CD8+ T cell priming: A new role for lymphatic endothelial cells. J. Immunol. 2014, 192, 5002–5011. [Google Scholar] [CrossRef]
- Tewalt, E.F.; Cohen, J.N.; Rouhani, S.; Guidi, C.J.; Qiao, H.; Fahl, S.; Conaway, M.R.; Bender, T.P.; Tung, K.S.; Vella, A.T.; et al. Lymphatic endothelial cells induce tolerance via PD-L1 and lack of costimulation leading to high-level PD-1 expression on CD8 T cells. Blood 2012, 120, 4772–4782. [Google Scholar] [CrossRef]
- Cousin, N.; Cap, S.; Dihr, M.; Tacconi, C.; Detmar, M.; Dieterich, L.C. Lymphatic PD-L1 Expression Restricts Tumor-Specific CD8+ T-cell Responses. Cancer Res. 2021, 81, 4133. [Google Scholar] [CrossRef]
- Baptista, A.P.; Roozendaal, R.; Reijmers, R.M.; Koning, J.J.; Unger, W.W.; Greuter, M.; Keuning, E.D.; Molenaar, R.; Goverse, G.; Sneeboer, M.M.S.; et al. Lymph node stromal cells constrain immunity via MHC class II self-antigen presentation. eLife 2014, 3, e04433. [Google Scholar] [CrossRef] [PubMed]
- Nadafi, R.; de Graça, C.G.; Keuning, E.D.; Koning, J.J.; de Kivit, S.; Konijn, T.; Henri, S.; Borst, J.; Reijmers, R.M.; van Baarsen, L.G.; et al. Lymph Node Stromal Cells Generate Antigen-Specific Regulatory T Cells and Control Autoreactive T and B Cell Responses. Cell Rep. 2020, 30, 4110–4123.e4. [Google Scholar] [CrossRef] [PubMed]
- Lund, A.W.; Duraes, F.V.; Hirosue, S.; Raghavan, V.R.; Nembrini, C.; Thomas, S.N.; Issa, A.; Hugues, S.; Swartz, M.A. VEGF-C Promotes Immune Tolerance in B16 Melanomas and Cross-Presentation of Tumor Antigen by Lymph Node Lymphatics. Cell Rep. 2012, 1, 191–199. [Google Scholar] [CrossRef] [PubMed]
- Dieterich, L.C.; Ikenberg, K.; Cetintas, T.; Kapaklikaya, K.; Hutmacher, C.; Detmar, M. Tumor-Associated Lymphatic Vessels Upregulate PDL1 to Inhibit T-Cell Activation. Front. Immunol. 2017, 8, 66. [Google Scholar] [CrossRef]
- Fankhauser, M.; Broggi, M.A.S.; Potin, L.; Bordry, N.; Jeanbart, L.; Lund, A.W.; Da Costa, E.; Hauert, S.; Rincon-Restrepo, M.; Tremblay, C.; et al. Tumor lymphangiogenesis promotes T cell infiltration and potentiates immunotherapy in melanoma. Sci. Transl. Med. 2017, 9, eaal4712. [Google Scholar] [CrossRef]
- Gkountidi, A.O.; Garnier, L.; Dubrot, J.; Angelillo, J.; Harlé, G.; Brighouse, D. MHC Class II Antigen Presentation by Lymphatic Endothelial Cells in Tumors Promotes Intratumoral Regulatory T cell-Suppressive Functions. Cancer Immunol. Res. 2021, 9, 748–764. [Google Scholar] [CrossRef]
- Berendam, S.J.; Koeppel, A.F.; Godfrey, N.R.; Rouhani, S.J.; Woods, A.N.; Rodriguez, A.B.; Peske, J.D.; Cummings, K.L.; Turner, S.D.; Engelhard, V.H. Comparative Transcriptomic Analysis Identifies a Range of Immunologically Related Functional Elaborations of Lymph Node Associated Lymphatic and Blood Endothelial Cells. Front. Immunol. 2019, 10, 816. [Google Scholar] [CrossRef]
- Waldburger, J.-M.; Suter, T.; Fontana, A.; Acha-Orbea, H.; Reith, W. Selective Abrogation of Major Histocompatibility Complex Class II Expression on Extrahematopoietic Cells in Mice Lacking Promoter IV of the Class II Transactivator Gene. J. Exp. Med. 2001, 194, 393–406. [Google Scholar] [CrossRef]
- Jorgovanovic, D.; Song, M.; Wang, L.; Zhang, Y. Roles of IFN-γ in tumor progression and regression: A review. Biomark. Res. 2020, 8, 1–16. [Google Scholar] [CrossRef]
- Skobe, M.; Hawighorst, T.; Jackson, D.G.; Prevo, R.; Janes, L.; Velasco, P.; Riccardi, L.; Alitalo, K.; Claffey, K.; Detmar, M. Induction of tumor lymphangiogenesis by VEGF-C promotes breast cancer metastasis. Nat. Med. 2001, 7, 192–198. [Google Scholar] [CrossRef]
- Sun, Z.; Ren, Z.; Yang, K.; Liu, Z.; Cao, S.; Deng, S.; Xu, L.; Liang, Y.; Guo, J.; Bian, Y.; et al. A next-generation tumor-targeting IL-2 preferentially promotes tumor-infiltrating CD8+ T-cell response and effective tumor control. Nat. Commun. 2019, 10, 1–12. [Google Scholar] [CrossRef] [PubMed]
- Montfort, A.; Colacios, C.; Levade, T.; Andrieu-Abadie, N.; Meyer, M.; Ségui, B. The TNF Paradox in Cancer Progression and Immunotherapy. Front. Immunol. 2019, 10, 1818. [Google Scholar] [CrossRef] [PubMed]
- Farnsworth, R.H.; Achen, M.G.; Stacker, S.A. The evolving role of lymphatics in cancer metastasis. Curr. Opin. Immunol. 2018, 53, 64–73. [Google Scholar] [CrossRef] [PubMed]
- Garnier, L.; Gkountidi, A.-O.; Hugues, S. Tumor-Associated Lymphatic Vessel Features and Immunomodulatory Functions. Front. Immunol. 2019, 10, 720. [Google Scholar] [CrossRef]
- Vaahtomeri, K.; Alitalo, K. Lymphatic Vessels in Tumor Dissemination versus Immunotherapy. Cancer Res. 2020, 80, 3463–3465. [Google Scholar] [CrossRef]
- Alitalo, A.; Detmar, M. Interaction of tumor cells and lymphatic vessels in cancer progression. Oncogene 2011, 31, 4499–4508. [Google Scholar] [CrossRef]
- Beasley, N.J.P.; Prevo, R.; Banerji, S.; Leek, R.D.; Moore, J.; Van Trappen, P.; Cox, G.; Harris, A.L.; Jackson, D.G. Intratumoral lymphangiogenesis and lymph node metastasis in head and neck cancer. Cancer Res. 2002, 62, 1315–1320. [Google Scholar]
- Roma, A.A.; Magi-Galluzzi, C.; Kral, M.A.; Jin, T.T.; Klein, E.A.; Zhou, M. Peritumoral lymphatic invasion is associated with regional lymph node metastases in prostate adenocarcinoma. Mod. Pathol. 2006, 19, 392–398. [Google Scholar] [CrossRef]
- Thelen, A.; Scholz, A.; Benckert, C.; Weichert, W.; Dietz, E.; Wiedenmann, B.; Neuhaus, P.; Jonas, S. Tumor-Associated Lymphangiogenesis Correlates with Lymph Node Metastases and Prognosis in Hilar Cholangiocarcinoma. Ann. Surg. Oncol. 2008, 15, 791–799. [Google Scholar] [CrossRef]
- Dadras, S.S.; Lange-Asschenfeldt, B.; Velasco, P.; Nguyen, L.; Vora, A.; Muzikansky, A.; Jahnke, K.; Hauschild, A.; Hirakawa, S.; Mihm, M.C.; et al. Tumor lymphangiogenesis predicts melanoma metastasis to sentinel lymph nodes. Mod. Pathol. 2005, 18, 1232–1242. [Google Scholar] [CrossRef]
- Deutsch, A.; Lubach, D.; Nissen, S.; Neukam, D. Ultrastructural Studies on the Invasion of Melanomas in Initial Lymphatics of Human Skin. J. Investig. Dermatol. 1992, 98, 64–67. [Google Scholar] [CrossRef] [PubMed][Green Version]
- Kataru, R.P.; Ly, C.L.; Shin, J.; Park, H.J.; Baik, J.E.; Rehal, S.; Ortega, S.; Lyden, D.; Mehrara, B.J. Tumor Lymphatic Function Regulates Tumor Inflammatory and Immunosuppressive Microenvironments. Cancer Immunol. Res. 2019, 7, 1345–1358. [Google Scholar] [CrossRef] [PubMed]
- Song, E.; Mao, T.; Dong, H.; Boisserand, L.S.B.; Antila, S.; Bosenberg, M.; Alitalo, K.; Thomas, J.-L.; Iwasaki, A. VEGF-C-driven lymphatic drainage enables immunosurveillance of brain tumours. Nature 2020, 577, 689–694. [Google Scholar] [CrossRef] [PubMed]
- Nörder, M.; Gutierrez, M.G.; Zicari, S.; Cervi, E.; Caruso, A.; Guzmán, C.A. Lymph node-derived lymphatic endothelial cells express functional costimulatory molecules and impair dendritic cell-induced allogenic T-cell proliferation. FASEB J. 2012, 26, 2835–2846. [Google Scholar] [CrossRef]
- Vokali, E.; Yu, S.S.; Hirosue, S.; Rinçon-Restrepo, M.; Duraes, F.V.; Scherer, S.; Corthésy-Henrioud, P.; Kilarski, W.W.; Mondino, A.; Zehn, D.; et al. Lymphatic endothelial cells prime naïve CD8+ T cells into memory cells under steady-state conditions. Nat. Commun. 2020, 11, 1–18. [Google Scholar] [CrossRef]
- Martinez-Corral, I.; Stanczuk, L.; Frye, M.; Ulvmar, M.H.; Diéguez-Hurtado, R.; Olmeda, D.; Makinen, T.; Ortega, S. Vegfr3-CreER T2 mouse, a new genetic tool for targeting the lymphatic system. Angiogenesis 2016, 19, 433–445. [Google Scholar] [CrossRef]
- Dieterich, L.C.; Kapaklikaya, K.; Cetintas, T.; Proulx, S.T.; Commerford, C.D.; Ikenberg, K.; Bachmann, S.B.; Scholl, J.; Detmar, M. Transcriptional profiling of breast cancer-associated lymphatic vessels reveals VCAM-1 as regulator of lymphatic invasion and permeability. Int. J. Cancer 2019, 145, 2804–2815. [Google Scholar] [CrossRef]
- Wendland, M.; Willenzon, S.; Kocks, J.; Davalos-Misslitz, A.C.; Hammerschmidt, S.I.; Schumann, K.; Kremmer, E.; Sixt, M.; Hoffmeyer, A.; Pabst, O.; et al. Lymph Node T Cell Homeostasis Relies on Steady State Homing of Dendritic Cells. Immunity 2011, 35, 945–957. [Google Scholar] [CrossRef]
- Lutz, M.B.; Kukutsch, N.; Ogilvie, A.L.; Rößner, S.; Koch, F.; Romani, N.; Schuler, G. An advanced culture method for generating large quantities of highly pure dendritic cells from mouse bone marrow. J. Immunol. Methods 1999, 223, 77–92. [Google Scholar] [CrossRef]
- Quah, B.J.C.; Warren, H.S.; Parish, C. Monitoring lymphocyte proliferation in vitro and in vivo with the intracellular fluorescent dye carboxyfluorescein diacetate succinimidyl ester. Nat. Protoc. 2007, 2, 2049–2056. [Google Scholar] [CrossRef]
- Wei, J.-C.; Yang, J.; Liu, D.; Wu, M.-F.; Qiao, L.; Wang, J.-N.; Ma, Q.-F.; Zeng, Z.; Ye, S.-M.; Guo, E.-S.; et al. Tumor-associated Lymphatic Endothelial Cells Promote Lymphatic Metastasis By Highly Expressing and Secreting SEMA4C. Clin. Cancer Res. 2017, 23, 214–224. [Google Scholar] [CrossRef] [PubMed]


Publisher’s Note: MDPI stays neutral with regard to jurisdictional claims in published maps and institutional affiliations. |
© 2022 by the authors. Licensee MDPI, Basel, Switzerland. This article is an open access article distributed under the terms and conditions of the Creative Commons Attribution (CC BY) license (https://creativecommons.org/licenses/by/4.0/).
Share and Cite
Li, C.Y.; Park, H.J.; Shin, J.; Baik, J.E.; Mehrara, B.J.; Kataru, R.P. Tumor-Associated Lymphatics Upregulate MHC-II to Suppress Tumor-Infiltrating Lymphocytes. Int. J. Mol. Sci. 2022, 23, 13470. https://doi.org/10.3390/ijms232113470
Li CY, Park HJ, Shin J, Baik JE, Mehrara BJ, Kataru RP. Tumor-Associated Lymphatics Upregulate MHC-II to Suppress Tumor-Infiltrating Lymphocytes. International Journal of Molecular Sciences. 2022; 23(21):13470. https://doi.org/10.3390/ijms232113470
Chicago/Turabian StyleLi, Claire Y., Hyeung Ju Park, Jinyeon Shin, Jung Eun Baik, Babak J. Mehrara, and Raghu P. Kataru. 2022. "Tumor-Associated Lymphatics Upregulate MHC-II to Suppress Tumor-Infiltrating Lymphocytes" International Journal of Molecular Sciences 23, no. 21: 13470. https://doi.org/10.3390/ijms232113470
APA StyleLi, C. Y., Park, H. J., Shin, J., Baik, J. E., Mehrara, B. J., & Kataru, R. P. (2022). Tumor-Associated Lymphatics Upregulate MHC-II to Suppress Tumor-Infiltrating Lymphocytes. International Journal of Molecular Sciences, 23(21), 13470. https://doi.org/10.3390/ijms232113470