Abstract
Data on the long-term consequences of a single episode of generalized seizures in infants are inconsistent. In this study, we examined the effects of pentylenetetrazole-induced generalized seizures in three-week-old rats. One month after the seizures, we detected a moderate neuronal loss in several hippocampal regions: CA1, CA3, and hilus, but not in the dentate gyrus. In addition, long-term synaptic potentiation (LTP) was impaired. We also found that the mechanism of plasticity induction was altered: additional activation of metabotropic glutamate receptors (mGluR1) is required for LTP induction in experimental rats. This disturbance of the plasticity induction mechanism is likely due to the greater involvement of perisynaptic NMDA receptors compared to receptors located in the core part of the postsynaptic density. This hypothesis is supported by experiments with selective blockades of core-located NMDA receptors by the use-dependent blocker MK-801. MK-801 had no effect on LTP induction in experimental rats and suppressed LTP in control animals. The weakening of the function of core-located NMDA receptors may be due to the disturbed clearance of glutamate from the synaptic cleft since the distribution of the astrocytic glutamate transporter EAAT2 in experimental animals was found to be altered.
1. Introduction
Prolonged recurrent seizures cause serious disturbances in the hippocampus, including neurodegeneration and neurogenesis, axonal sprouting and dendrite remodeling, inflammatory cell invasion, gliosis, angiogenesis, and changes in the extracellular matrix [1,2]. Since the hippocampus plays a key role in memory consolidation [3], such pathological changes lead to the impairment of cognitive functions, especially learning and memory [4,5,6]. The effects of seizures on morphological changes in the developing hippocampus and the functional consequences are poorly understood and largely contradictory [7,8,9].
Pentylenetetrazole (PTZ), a GABAA receptor antagonist [10,11], causes myoclonic seizures and is often used to study the consequences of single episode of seizures [12,13] and to test antiepileptic drugs [14]. The effect of PTZ depends on the age of the animals; generalized tonic-clonic seizures are more typical for rats under three weeks of age, and clonic seizures of facial and forelimb muscles are more characteristic for older rats [15].
The seizure outcomes in young and adult animals are also different. In adult animals, a single episode of PTZ-induced seizures usually does not result in significant neuronal loss in the brain [2,16]; however, it can cause the rapid emergence of dark neurons [17,18], an increase in the number of proliferating cells in the dentate gyrus and the subventricular zone [16], ultrastructural changes in some neurons, glial cells, and synapses in the CA1 field of the hippocampus [19]. Subsequently, one episode of PTZ-induced seizures in adult (two-month-old) male Wistar rats is accompanied by slowly developing cognitive decline [20].
PTZ-induced seizures in 10-day-old (P10) rats resulted in significant neuronal death in the dentate gyrus, whereas neuronal loss did not reach a statistically significant level at P21 [18]. In animals receiving PTZ at P18, another research group revealed cell loss only in the CA3 area of the hippocampus and in the hilus of the dentate gyrus, while in the CA1 area of the hippocampus, the dentate gyrus remained intact [21].
Even a single episode of seizures at P21 can have both short-term and long-term effects on the functioning of neural networks in the hippocampus. In our previous study, we found that the next day following PTZ-induced seizures, pyramidal cells in the hippocampus had increased input resistance and started firing at a lower level of depolarization as compared with the control. Basal excitatory synaptic transmission was reduced in CA3-CA1 synapses, thus preventing the propagation of excitation through neural networks [22]. Within the first week after PTZ-induced seizures, we observed impaired long-term synaptic plasticity in the rat hippocampus [23]. Moreover, NMDA-dependent LTP was suppressed, and LTP transiently switched to the mGluR1-dependent form [23].
The purpose of this work was to study the delayed impairment of hippocampal synaptic plasticity after pentylenetetrazole-induced seizures in young rats
2. Results
2.1. PTZ-Induced Seizures Resulted in a Decrease in the Number of Neurons in CA1 and CA3 Areas and Hilus of the Hippocampus
Whether a single episode of early-onset seizures causes neurodegeneration remains controversial. Therefore, we evaluated potential neuronal loss in various areas of the hippocampus one month after PTZ-induced seizures. Nissl staining confirmed cell loss in pyramidal layers of three hippocampal regions: CA1, CA3, and the hilus (CA1: 20.6 ± 1.7 cells per 104 μm2 in control, n = 6; 12.9 ± 0.5 cells per 104 μm2 after SE, n = 6; t-test = 4.4, p < 0.01; CA3: 26 ± 3 cells per 104 μm2 in control, n = 6; 16.8 ± 1.3 cells per 104 μm2 after SE, n = 6; t-test = 2.7, p = 0.02; Hilus: 15.9 ± 0.7 cells per 104 μm2 in control, n = 6; 10.7 ± 0.7 cells per 104 μm2 after SE, n = 6, t-test = 5.0, p < 0.001; Figure 1a–c). No significant changes in the cell density were observed in the granular cell layer of the dentate gyrus (35.6 ± 2.4 cells per 104 μm2 in control, n = 6; 36.8 ± 3.5 cells per 104 μm2 after SE, n = 6; t-test = 0.3, p = 0.77; Figure 1d).
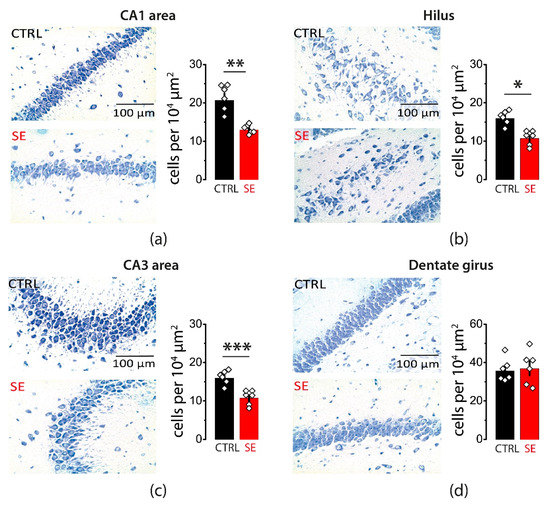
Figure 1.
Neurodegeneration in the hippocampal areas 30 days after PTZ-induced seizures. Nissl staining showing neurodegeneration in the str. pyramidale of CA1 (a), CA3 (b), and hilus (c). No significant neurodegeneration was observed in the granular cell layer of the dentate gyrus (d). Right: illustrations of stained cells in control (top) and post-SE rats (bottom). Left: the summary data from several animals. The cells were counted along the cell layers and normalized to the length of the layers. The circles show values in individual rats. The bars with error bars are means ± standard errors of the means (SEMs). Each rhombus represents a value obtained in an individual animal. t-test * p < 0.05, ** p < 0.01 *** p < 0.001.
2.2. LTP Was Attenuated in the CA1 Hippocampal Area 30 Days after PTZ-Induced SE
Next, we analyzed the delayed effect of PTZ-induced seizures on the LTP value in the CA3-CA1 synapses of the rat hippocampus. High-frequency stimulation (HFS) protocol induced significant LTP in the hippocampal slices from control animals (1.49 ± 0.05, n = 11), while LTP was significantly reduced in post-SE rats (1.29 ± 0.07; n = 13; unpaired t-test, t = 2.36, p < 0.05; Figure 2).
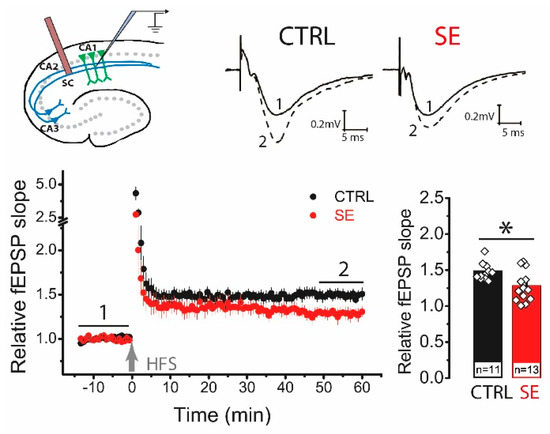
Figure 2.
LTP is attenuated in the CA1 hippocampal area 30 days after PTZ-induced seizures. The schema above shows the positions of electrodes in the hippocampus. At the right are representative examples of field postsynaptic potential (fPSP) before (1) and 60 min after (2) HFS in control (CTRL) and post-SE (SE) groups. The diagram below shows the normalized slope of fPSP in control and post-SE groups before and after HFS. The bar graph illustrates the differences in LTP value between groups. All data are presented as a mean ± SEM. Each rhombus represents a value obtained in an individual animal. Student’s t-test: * p < 0.05.
To determine whether the locus of synaptic plasticity induction changed, we compared the paired ratio of field postsynaptic potential (fPSP) amplitudes before and after the application of the HFS protocol. In control animals, the ratio of amplitudes did not change after HFS (baseline: 1.42 ± 0.04; LTP: 1.38 ± 0.06, n = 11; paired t-test = 1.06, p = 0.32). In the post-SE group, no changes in the amplitude ratio were observed either (BL: 1.32 ± 0.04; LTP: 1.32 ± 0.03; n = 14; paired t-test, t = 0.01, p = 0.99). No changes in the paired amplitude ratio indicate a postsynaptic locus of plasticity induction in both groups [24,25].
2.3. The Impact of Perisynaptic NMDA Receptors on Synaptic Plasticity Is Enhanced in Post-SE Rats
The weakening of LTP can be caused by the disruption of NMDA receptor signaling [26]. These disturbances, in turn, may be triggered by a decrease in the number of NMDA receptors, a change in their subunit composition, or their localization on the postsynaptic membrane.
Receptors localized perisynaptically are thought to be less effective in producing LTP and may even contribute to LTD production [27]. The contribution of extra- and perisynaptic NMDA receptors can be indirectly assessed by applying the use-dependent blocker MK-801 [28]. Since MK-801 blocks the NMDA receptor pore, initial activation and opening of the channel pore are required [29]. It is assumed that low-intensity stimulation activates receptors located mainly in the core part of postsynaptic density (PSD), opposing the presynaptic release site [30]. Thus, MK-801 blocks NMDA receptors located in the PSD mainly, while extra- and perisynaptic receptors remain unblocked for some time. We used this paradigm and compared the effects of MK-801 (10 μM) and the competitive antagonist AP5 (50 μM), which affects all NMDA receptors, on synaptic plasticity. The antagonists were in the bath throughout the experiment.
In control slices, AP5 and MK-801 completely prevented LTP induction (CTRL: 1.49 ± 0.05, n = 11; AP5: 1.02 ± 0.07, n = 6; MK-801: 0.97 ± 0.05, n = 7; one-way ANOVA: F2,21 = 27.76, p < 0.001; Figure 3a). In contrast, in the post-SE group, only the application of AP5 inhibited long-term plasticity, while the application of MK-801 had no effect on the LTP value (SE: 1.29 ± 0.07, n = 13; AP5: 0.97 ± 0.07, n = 8; MK-801: 1.35 ± 0.09, n = 11; one-way ANOVA: F2,29 = 6.05, p < 0.01; Figure 3b).
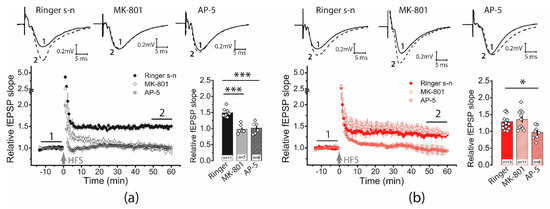
Figure 3.
The NMDAR-dependent mechanism of LTP induction is weakened following PTZ-induced SE. On the left, diagrams show the normalized slope of fPSP in control (a) and post-SE (b) groups. On the right side of each panel are bar graphs (mean ± SEM) showing the effect of NMDAR inhibition with D-AP5 or MK-801 on LTP value in different groups. Each rhombus represents a value obtained in an individual animal. One-way ANOVA followed by Tukey’s post hoc tests: * p < 0.05, *** p < 0.001.
2.4. Subunit Composition of NMDA Receptors Is Unchanged in the Post-SE Group
It has been shown that GluN2A-containing NMDARs are predominantly located in the PSD core and play a major role in the induction of LTP [31,32,33], while GluN2B-containing NMDARs are also located in extrasynaptic regions and regulate LTD or reduce the magnitude of LTP [34,35]. Our previous studies have shown that GluN2B-containing NMDA receptor expression may change during the first week after PTZ-induced seizures [36]. Thus, we can assume that the number of peri- and extrasynaptic GluN2B-containing NMDA receptors increase in the hippocampal synapses, and this, in turn, may cause LTP attenuation. Therefore, we decided to evaluate whether the level of expression of GluN2A and GluN2B subunits changes, as well as how the application of the GluN2B selective antagonist ifenprodil (3 μM) affects LTP induction.
Western blot assay revealed no significant differences in the expression levels of GluN2A and GluN2B subunits between control and post-SE groups in the dorsal hippocampus (Figure 4).
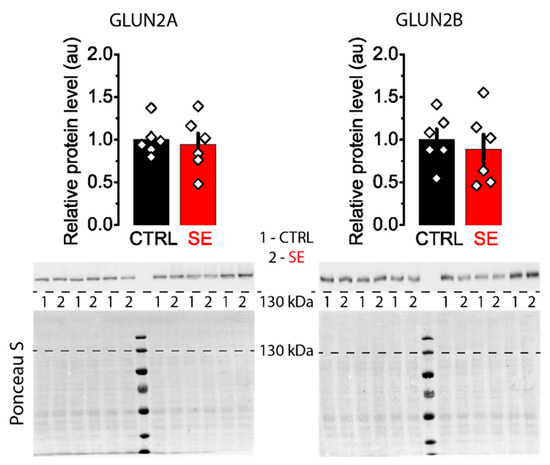
Figure 4.
Representative Western blots images of NMDA receptor subunits GluN2A and GluN2B from the dorsal hippocampus of control (CTRL) and experimental (SE) groups. Bar graphs: data presented as mean ± SEM, which were normalized to total protein. t-test, p > 0.05. Each rhombus represents a value obtained in an individual animal. Images: the upper part shows the chemiluminescent signal, and the lower part shows the Ponceau S.
Ifenprodil decreased LTP in the control group (1.49 ± 0.05, n = 11 vs. ifenprodil: 1.14 ± 0.09, n = 7), but no significant reduction in LTP was observed in the post-SE group (1.29 ± 0.07, n = 13 vs. ifenprodil: 1.14 ± 0.05, n = 8, Figure 5). Together, these results rather reject the hypothesis about an increase of GluN2B-containing NMDA receptors.
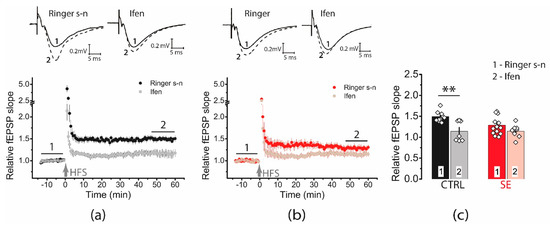
Figure 5.
Diagrams showing the effect of ifenprodil (3 μM), a GluN2B selective antagonist, on the normalized slope of fPSP in control (CTRL) (a) and post-SE (b) groups before and after HFS. (c) The bar graphs (mean ± SEM) showing the effect of ifenprodil on LTP values in different groups. Each rhombus represents a value obtained in an individual animal. Two-way ANOVA: F(seizure)1,35 = 2.15, p = 0.15; F(ifenprodil)1,35 = 12.10, p < 0.001; F(seizure × ifenprodil)1,35 = 2.37, p = 0.13 following with Tukey’s post hoc tests: ** p < 0.01.
2.5. Activation of mGluR1 Is Necessary for Induction of LTP in the Post-SE Group
It is known that the group I mGluRs are preferentially enriched in the perisynaptic domain and seem to be largely excluded from the PSD [30]. Moreover, mGluRs can modulate the activity of nearby NMDA receptors [37]. Since our experimental data suggest a more prominent role of perisynaptic NMDA receptors in the induction of LTP in the post-SE group, we hypothesize that inhibition of mGluRs may affect synaptic plasticity. Previously, we have shown that one day after PTZ-induced seizures, LTP is NMDA-independent and is related to mGluR1 [23]. Therefore, in the present study, we evaluated the role of mGluR1 in LTP induction as well.
We found that the application of FTIDC (5 μM), a mGluR1 antagonist prevented LTP induction in the post-SE group (1.04 ± 0.06, n = 8, Figure 6), whereas the LTP value did not change in the control group (1.40 ± 0.07, n = 6). Thus, our data shows that in the post-SE group, LTP induction depends on the cooperative functioning of NMDA receptors and mGluR1, confirming the hypothesis about the important role of perisynaptic glutamate receptors for LTP induction.
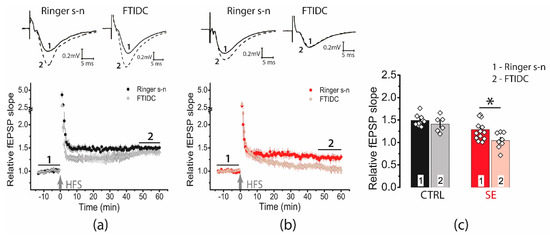
Figure 6.
Activation of mGluR1 is necessary for the induction of LTP in the post-SE group. Diagram showing the effect of FTIDS (5 μM) on the normalized slope of fPSP in control (a) and post-SE (b) groups. (c) Bar graphs (means ± SEM) showing the effect of mGluR1 inhibition by FTIDC on LTP magnitude in different groups. Each rhombus represents a value obtained in an individual animal. Two-way ANOVA: F(seizure)1,34 = 17.4, p < 0.001; F(FTIDC)1,34 = 5.7, p < 0.05; F(seizure × FTIDC)1,34 = 1.3, p = 0.26; following with Tukey’s post hoc tests: * p < 0.05.
2.6. Blockade of Glutamate Transporters Has No Significant Effect on Synaptic Plasticity
The change in the role of NMDA receptors located directly in the PSD and perisynaptically in the induction of plasticity may be due to alterations in the clearance of glutamate from the synaptic cleft. It is known that after epileptic seizures and in epilepsy, glutamate transporters can be disrupted [38], and neuron-glial interactions are impaired [39]. Epilepsy is associated with increased GFAP expression. Up-regulation of GFAP induction has been reported in the hippocampal kindling model [40]. The protein level increases in the pilocarpine model of epilepsy in rats [41]. In human subjects diagnosed with epileptic seizures, serum GFAP level is significantly increased compared to healthy controls [42]. Hence, we evaluated the protein expression levels of GFAP and EAAT2 in hippocampal tissue. Western blot analysis revealed no significant changes in the expression levels of these proteins in the post-SE group (Figure 7).
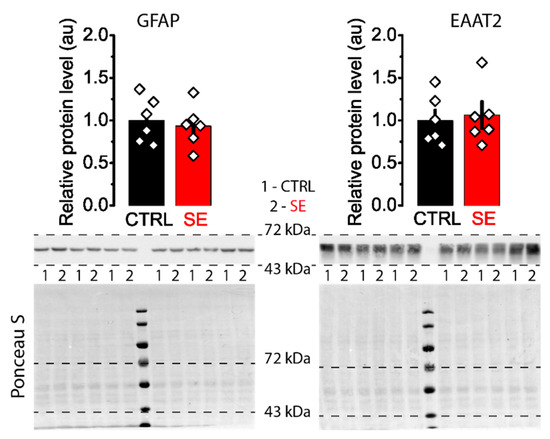
Figure 7.
Representative western blots of GFAP and EAAT2 from the dorsal hippocampus of control (CTRL) and experimental (SE) groups. Bar graphs (means ± SEM) illustrate the expression levels of GFAP and EAAT2, which were normalized to total protein. Each rhombus represents a value obtained in individual animals. Images: the upper part shows the chemiluminescent signal, and the lower part shows the Ponceau S.
Protein expression level does not reveal subcellular protein distribution. Hence, we performed the immunochemical staining of GFAP in slices obtained from control animals and the SE model. We divided all stained GFAP processes into two groups: thick primary processes adjoined to cell soma and more distant thin processes (Figure 8).
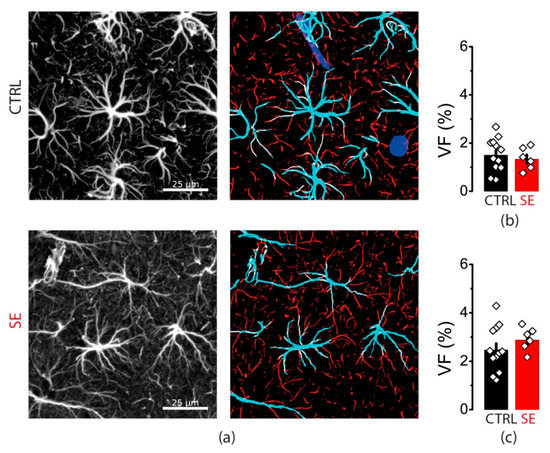
Figure 8.
GFAP immunostaining. (a) Representative examples of GFAP immunostaining from the dorsal hippocampus of control (CTRL) and experimental (SE) groups. Left: maximal projection of GFAP-stained stack. Right: segmentation to thick (cyan) and thin (red) GFAP-positive processes. Volume fractions (VF) of thick (b) and thin (c) astrocyte processes. Data presented as mean ± SEM. Each rhombus represents a value obtained in an individual animal. t-tests, p > 0.05.
There was no difference in the volume fraction of either thick or thin processes between control and PTZ slices (Figure 8). Taken together with Western blot data, this result suggests that there are no changes in GFAP expression or distribution as in human epilepsy or other animal models. However, this result does not exclude that they may occur in the kindling PTZ model with different mechanisms.
In EAAT2 staining, we observed that transporters form bright spots, which we called clusters (Figure 9). These clusters of transporters are typically located in the vicinity of glutamate synapses [43]. We observed a reduction of the mean cluster diameter from 1.11 ± 0.11 to 0.95 ± 0.04 μm (reported as mean ± standard deviation) but not cluster density. These results may indicate that the spatial distribution of EAAT2 is altered in the post-SE group, which may affect glutamate uptake and synaptic plasticity [44]. Therefore, we examined the effect of glutamate transporter blockade on LTP.
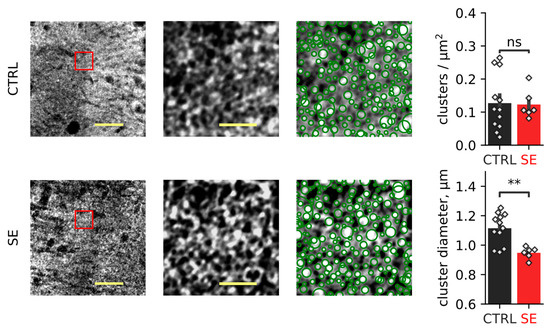
Figure 9.
EAAT2 immunostaining. Representative examples of EAAT2 immunostaining from the dorsal hippocampus of control (CTRL) and experimental (SE) groups. Left: maximal projection of EAAT2-stained stack. Scale bar = 25 µm. Middle: Expanded part of the image boxed in the left image. The expansion shows the structural organization of EAAT2, which forms clusters. Scale bar = 5 µm. Right: detection of EAAT2 clusters. Bar graphs show relative EAAT2 cluster density and the mean cluster diameter. Data presented as mean ± SEM. Each rhombus represents a value obtained in an individual animal. t-test, ** p < 0.01.
Glutamate released during the application of HFS protocols allows prolonged activation of NMDA receptors [45], and it also diffuses out of the synaptic cleft and binds to NMDARs and mGluRs in the peri- or extrasynaptic membrane or at neighboring synapses [46]. EAATs control the degree of glutamate spillover and glutamate access to receptors located at peri- and extrasynaptic sites [44]. Typically, EAATs downregulation leads to a reduction of LTP magnitude and promotes LTD [47,48].
We applied TFB-TBOA (70 μM), which blocks mainly astrocyte transporters EAAT1 and EAAT2 [49]. However, a two-way ANOVA showed no significant effect of transporter blockade on plasticity (F(TBOA)1,38 = 3.14, p = 0.08) or differences in blocker action between the two groups (F(TBOA × seizure)1,38 = 0.47, p = 0.49, Figure 10).
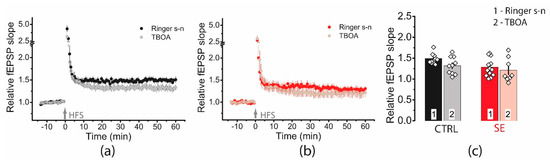
Figure 10.
Blockade of glutamate transporters has no significant effect on synaptic plasticity. Diagram showing the effect of TFB-TBOA (70 μM) on the normalized slope of fPSP in control (a) and post-SE (b) groups. (c). Bar graphs (means ± SEM) showing no effect of TFB-TBOA on LTP magnitude. Each rhombus represents a value obtained in an individual animal.
3. Discussion
Our study showed that a single episode of generalized seizures in three-week-old rats leads to long-term consequences, including neurodegeneration in the hippocampus and impaired synaptic plasticity.
Epileptic seizures significantly affect the functioning of synapses, and alterations have been described at the level of the post- and presynapse, as well as disturbances in the functioning of microglia and astrocytes [50]. One of the most serious consequences of PTZ-induced seizures detected in this study is impaired LTP. In post-SE rats, the magnitude of LTP induced by the HFS protocol was reduced almost twofold compared to the control group. In a previous study, we showed that LTP induction is reduced during a week after PTZ-induced seizures [23], but now we have found that this reduction of LTP lasts for at least a month. The LTP attenuation shown in this work agrees well with other experimental data obtained using various epilepsy models [51,52,53,54,55].
Currently, there is no consensus on the cause of synaptic plasticity impairment following seizures. Since LTP induction is a complex mechanism, disorders of plasticity can be caused by various causes [23,52,56,57,58]. Some studies point to a significant contribution of neurodegenerative changes in brain tissue [59], while other works suggest disturbances in astrocyte function [54] or underline the critical role of neuroinflammation [12].
In this study, we found that not only NMDA receptors but also mGluR1 activation is required for LTP induction in post-SE rats. In contrast, in the control group, mGluR1 inhibition had no effect on LTP value in our experiments. We hypothesized that these changes in the mechanism of LTP induction were due to the prolonged attenuation of NMDA-dependent signaling following seizures. The results of previous studies are generally consistent with this hypothesis. Using c-Fos staining at different time points after PTZ treatment and EEG recordings, it was shown that neuronal activity was maximal at 2 h after injection and diminished at 4 h [60]. One day after PTZ-induced seizures, a decrease in basal excitatory synaptic transmission in CA3-CA1 synapses and a significant increase in the maximum electroshock threshold was detected in rats [22]. A decrease in the amplitude of the field responses in the hippocampal slices was detected even 30 d after PTZ-induced seizures [22].
Therefore, in the post-SE group, enhancement of NMDA-dependent signaling is necessary for LTP induction. Group I mGluRs are known to be involved in the modulation of NMDA receptor activity [61,62]. The effect of mGluRs (activation or inhibition) on NMDA receptors depends on cell type and location. Potentiation of NMDA receptors is mainly observed in dentate gyrus neurons and the CA1 field of the hippocampus, whereas inhibition has been found in cortical neurons and cerebellar cells [30,63]. In the hippocampus, activated group I mGluRs modulate NMDARs simultaneously through Homer- and G-protein-controlled pathways by changing the probability of NMDAR opening [61]. G-protein signaling cascades are the transfer mechanism of this modulation via activation of PLC; at least part of the potentiation is due to a rise in intracellular Ca2+ and stimulation of PKC [64]. The second mechanism is a direct molecular link between mGluRs and NMDARs [61,65]. In this case, mGluRs and NMDARs must be closely located on the neuronal membrane: Homer proteins bind to the mGluRs and to the proteins of the Shank family; the Shank proteins, in turn, connect to NMDARs via the protein PSD-95 [61].
The mGluRs must be closely located to NMDARs to efficiently activate them. It was shown that group I mGluRs were preferentially enriched in the perisynaptic domain [30]. Therefore, we believe that perisynaptic NMDARs are involved in LTP induction. Data from our experiments with an irreversible open-channel blocker MK-801 provide indirect evidence in favor of this assertion. We revealed that bath application of MK-801 completely suppresses LTP in the control group, while it has almost no effect on LTP production in brain slices from post-SE rats. It can be assumed that during the test stimulation, only NMDARs located in the core part of PSD are mainly activated and, consequently, blocked. Since during this type of stimulation, glutamate usually does not reach perisynaptic NMDARs, they remain unblocked.
Previous studies have shown that NMDARs with different subunit compositions are unevenly distributed at the core part of PSD and perisynaptic area [66]. While GluN2A-containing NMDARs are localized mainly at the core part, GluN2B-containing NMDARs are more often observed at the perisynaptic part of the membrane [37,38]. Therefore, it was reasonable to hypothesize that selective inhibition of GluN2B-containing NMDARs would have a greater effect on LTP induction in the group of post-SE rats. Therefore, we compared the effect of ifenprodil, a GluN2B selective antagonist, on LTP induction. However, in the presence of ifenprodil, the HFS protocol caused a small increase in responses (approximately 15%) in both groups. Obviously, GluN2B-containing NMDARs play an important role in LTP induction in both groups, but the preferential contribution of GluN2B-containing NMDARs in LTP induction in the group of post-SE rats was not confirmed by this experiment. We additionally compared the expression levels of GluN2A and GluN2B subunits between control and post-SE groups in the dorsal hippocampus but also found no differences.
One of the causes of dysregulation of NMDA-dependent signaling may be impaired clearing of glutamate in the synaptic cleft due to disturbances in neuron-glial relationships. A decrease in EAAT2 levels in the astrocytes of the sclerotic hippocampus has been found in several studies based on clinical and postmortem data in people with temporal lobe epilepsy [67,68], but conflicting data were obtained in animal epilepsy models. The lithium-pilocarpine model showed an increase in EAAT2 mRNA levels in the medial prefrontal cortex and dorsal hippocampus one week after status epilepticus [69]. However, a decrease in EAAT2 expression at the protein level has been shown in another study on the same model [70].
We did not observe a significant change in the protein level of EAAT2, astrocyte-specific glutamate transporter. However, PTZ-induced SE affected the subcellular redistribution of transporters: EAAT2 clusters became smaller, although their spatial density remained unchanged. The dramatic ultrastructural, molecular, and functional remodeling of astrocytes and CA3-CA1 excitatory synapses of the hippocampus has been shown in the kainate rat model of epilepsy [71]. The authors found increased astrocyte ensheathment around both the presynaptic and postsynaptic elements and reduced perisynaptic astrocyte GLT-1 expression [71]. Another possible mechanism is the disruption of glutamate uptake kinetics. Using the repeated low-dose kainate rat model of epilepsy, Takahashi et al. showed a significant decrease in the decay time kinetics of glutamate transport currents recorded in reactive astrocytes, although there was little concomitant change in the total expression of GLT-1 (EAAT2) [72].
In our animal model, redistribution of EAAT2 expression could also affect glutamate uptake and synaptic plasticity [44]. We have not specifically measured glutamate uptake, but we have examined the effects of transporter blockade on plasticity. Our experiments did not reveal changes in LTP that could be explained by impaired glutamate uptake.
Notably, we did not observe a significant increase in GFAP expression at the level of protein or any changes in its subcellular distribution following PTZ-induced SE. This contrasts with previous reports on the up-regulation of GFAP induction in the hippocampal kindling model [40] and protein level increase in the pilocarpine model of epilepsy in rats [41]. Thus, the PTZ model may recruit different cellular and molecular mechanisms in astrocytes. One month after the seizures, we detected a decrease in the number of neurons by about 30% in the hippocampal regions CA1, CA3, and hilus. In various epilepsy models, the hippocampus is one of the structures in which the strongest neuronal loss is observed. However, the most damaged areas of the hippocampus may vary in different models and at different ages of the animals. PTZ-induced seizures in six-week-old rats lead only to the appearance of dark neurons in CA1, CA3b,c, and hilus but do not cause neuronal death [2]. This may be due to the shorter duration and lower severity of PTZ-induced seizures in adolescent rats [15]. In P10 rats, febrile seizures damaged the neurons in the CA1 and hilus areas, while no apparent changes in the number of cells in CA3 and DG were detected [73]. Pilocarpine-induced seizures in three-week-old rats led to a very rapid neuronal death (about 30% of neurons) induced by an excitotoxic effect of glutamate in the hippocampus and dentate gyrus [58,74]. In mice, kainite-induced seizures led to extensive neuronal loss in the CA1 and CA3c regions and in the hilus of the dentate gyrus. In addition, an enlargement of the dentate gyrus with the dispersion of the granule cells was observed [75].
PTZ-induced seizures, unlike pilocarpine-induced seizures or kainate-induced seizures, do not typically lead to the further development of spontaneous recurrent seizures and the development of acquired drug-resistant temporal lobe epilepsy. However, this model, along with other animal models, may be useful for studying the mechanisms of seizure effects on structural and functional alterations in the cortex and hippocampus, including neurodegeneration, axonal sprouting, synaptic reorganization, astrogliosis, changes in synaptic plasticity and neuron-astrocyte interactions, which are the basis of the “neural network hypothesis” of drug-resistant epilepsy [76,77]. Understanding these mechanisms is a necessary basis for the search and development of new pharmacological agents specifically designed for the prevention of epilepsy [78].
4. Materials and Methods
4.1. PTZ Model of Status Epilepticus
In 3-week-old male Wistar rats, acute seizures were induced by intraperitoneal administration of PTZ (70 mg/kg; Sigma-Aldrich, St. Louis, MO, USA). A characteristic feature of PTZ action on rats at this age is that a single injection causes prolonged convulsions in most animals, which is not common in older rats [15]. The study was conducted only on rats with generalized tonic-clonic seizures lasting at least 45 min. The control rats received a physiological solution.
4.2. Brain Slices Preparation
Hippocampal slices were prepared as previously described [23]. Briefly, at the age of 51–55 days, the rats were decapitated, the brain was rapidly removed, and horizontal brain slices (400 μm) were cut using a vibratome HM 650 V (Microm, Walldorf, Germany) in ice-cold artificial cerebrospinal fluid (ACSF), which was aerated with carbogen (95% O2 and 5% CO2). Composition of ACSF (in mM): 126 NaCl, 2.5 KCl, 1.25 NaH2PO4, 1 MgSO4, 2 CaCl2, 24 NaHCO3, 10 glucose. The sections were then kept in a water bath at 35 °C for 1 h. After incubation, individual sections were transferred to the experimental chamber.
4.3. Field Potential Recordings
Extracellular fPSPs were evoked with a bipolar nichrome electrode placed in the Schaffer collaterals at the CA1–CA2 border and recorded from the CA1 stratum radiatum by glass microelectrodes (0.2–1.0 MΩ). Stimulus intensity was chosen so that the amplitude of fPSPs was between 40–50% of the amplitude at which the population spike first appeared. Paired electrical stimuli with an interstimulus interval of 50 ms and a pulse duration of 0.1 ms were delivered every 20 s through the A365 stimulus isolator (World Precision Instruments, Sarasota, FL, USA). Signals were amplified by a Model 1800 amplifier (A-M Systems, Carlsborg, WA, USA), then digitized with ADC/DAC NI USB-6211 (National Instruments, Austin, TX, USA) and stored on a personal computer using WinWCP v5.x.x software (University of Strathclyde, Glasgow, UK). The electrophysiological records were studied using the Clampfit 10.2 program (Axon Instruments, San Jose, CA, USA).
LTP was induced by HFS protocol (3 trains every 20 s, consisting of 100 pulses at 100 Hz). LTP induction was preceded by a 20-min baseline period. Potentiated fPSPs were recorded for 60 min after HFS. LTP was quantified by calculating the ratio of the mean slope of potentiated fPSPs (50–60 min after HFS) to baseline (10 min before HFS).
4.4. Western Blot Assay
Rats were decapitated 30 days after PTZ-induced SE. After decapitation, brains were quickly removed, frozen, and stored at −80 °C before dissection. The dorsal area of the hippocampus was dissected at −20 °C using OTF5000 Cryostat Microtome (Bright Instrument, Huntingdon, UK) according to the rat brain atlas [79]. Samples were homogenized in 200 µL of lysis buffer [80] containing 100 mM Tris-HCl pH 8.0, 140 mM NaCl, 20 mM EDTA, 5% SDS, 1X protease inhibitor cocktail (Pierce Protease Inhibitor Tablets; Thermo Fisher Scientific, Wilmington, DE, USA), and 1× phosphatase inhibitor cocktail (Phosphatase Inhibitor Cocktail II; Abcam, Cambridge, UK), and then incubated for 1 h at room temperature and centrifuged at 14,000 ×g for 10 min, and the supernatant was used for protein quantification and western blot. Protein concentrations were determined by a modified Lowry assay [81] with BSA as a standard. Protein supernatants were mixed 1:1 with 2× loading buffer (125 mM Tris–HCl pH 6.8, 40% glycerol, 4% SDS, 2.5% β-mercaptoethanol, 0.02% bromophenol blue) and heated at 70 °C for 15 min.
We separated 6 µg of protein using SDS-PAGE [82] in 7% acrylamide gel with Thermo Scientific Page Ruler Prestained Protein Ladder (10–170 kDa; Thermo Fisher Scientific) under 125 V and then transferred to the 45µm nitrocellulose membrane by semi-wet transfer with 1X Power Blotter 1-Step Transfer Buffer (Thermo Fisher Scientific). After transfer, membranes were stained with 0.1% Ponceau (dissolved in 5% acetic acid) and visualized with a ChemiDocMP imager (Bio-Rad, Hercules, CA, USA) for subsequent normalization to total protein. After washing from Ponceau, membranes were blocked in 5% dry milk in PBST for 1 h at room temperature, then incubated in primary antibody solution in PBST containing 0.05% NaN3 and rabbit anti-GluN2A (1:1000, ab169873, Abcam), rabbit anti-GluN2B (1:1000, ab65783, Abcam), rabbit anti-EAAT2 (1:3000, ab205248, Abcam) or rabbit anti-GFAP (1:20,000, ab7260, Abcam) overnight at 4 °C. Subsequently, membranes were washed with PBST 5 times followed by incubation with a secondary antibody solution in PBST containing 5% dry milk (1:60,000 Pierce Goat anti-rabbit IgG-HRP, 31460, Thermo Fisher Scientific) at room temperature for 1 h. After 3 washes of 10 min with PBST, proteins were detected with SuperSignal™ West Pico PLUS Chemiluminescent Substrate (Thermo Fisher Scientific) and visualized with a ChemiDocMP imager (Bio-Rad). Images were analyzed using Image Lab 6.0.1 software (Bio-Rad). Protein expression was normalized to the total protein loading of Ponceau–stained membranes [83] following a total protein normalization method (Bio-Rad). The ratio between the optical densities of the specific protein band to the total protein was calculated and normalized to the mean of the control group.
4.5. Nissl Staining
The animal brains were removed immediately after decapitation and immersed in a fixing solution of zinc-ethanol-formaldehyde [84]. Then, after dehydration, the brain tissues were embedded in paraffin. Paraffin sections (10 μm) were cut in a coronary plane and stained with Nissl’s method to assess the degree of neurodegeneration. Images of CA1, CA3, hilus, and dentate gyrus were obtained using an × 40 magnification. The neurons were counted in a 100 × 100 μm box positioned in the cell layer using the plugin “Cell counter” for ImageJ (U.S. National Institutes of Health, Bethesda, MD, USA).
4.6. Immunocytochemical Method
To detect GFAP and EAAT2 (GLT-1) in astrocytes, we used an immunocytochemical assay. The routinely dewaxed sections were heated in antigen retrieval solution S1700 (Dako, Glostrup, Denmark). Then the sections were incubated in a mixture of primary antibodies of GFAP (1:100; monoclonal mouse antibodies, clone SPM507, E16510; Spring Bioscience, Pleasanton, CA, USA) and glutamate transporters GLT-1 (1:150; polyclonal rabbit antibodies, ab106289; Abcam, Cambridge, UK). The following secondary antibodies were used: monovalent Fab-fragment of anti-rabbit donkey immunoglobulin conjugated with Rhodamine Red™-X (RRX) fluorochrome (1:25, 711-295-152; Jackson ImmunoReaserch, Philadelphia, Pennsylvania, USA) and monovalent Fab-fragment of anti-mouse donkey immunoglobulin conjugated with Cy-2 fluorochrome (1:50, 705-225-147; Jackson ImmunoReaserch, Philadelphia, PA, USA). The sections were mounted in a water-soluble Fluorescence Mounting Medium (Dako, Glostrup, Denmark) and were imaged using an LSM 710 confocal laser microscope (Zeiss, Oberkochen, Germany) with an alpha Plan-Apochromat 100x/1.46 Oil DIC M27 objective, in the z-axis scanning mode in Zen2011 Black. Obtained images were used for further analysis.
4.7. Analysis of Immunostaining Data
Immunostaining data was characterized with custom scripts and Jupyter notebooks written in the Python programming language using NumPy, SciPy, and Scikit-Image libraries. GFAP immunostaining quantification relied on volume segmentation to GFAP-positive astrocytic structures and background. The segmentation was done in two steps: intensity-based, followed by Frangi vesselness contrast [85]. Intensity-based segmentation was made by hysteresis thresholding using 3 and 5 standard deviations of image noise as low and high thresholds, correspondingly. The segmentation was then refined with multiscale Frangi vesselness contrast, which enhances anisotropic filamentous structures at a set of spatial scales defined by convolution with a Gaussian kernel with different sigma values. The spatial scales were split into those corresponding to “thin” astrocytic processes and those corresponding to “thick” processes with a boundary of σ = 0.6 μm, chosen to visually separate the two types of processes. Frangi contrast images were obtained as maximum projections across spatial scales within each spatial scale range (0.1–0.6 μm and > 0.6 μm) and binarized to the foreground and background voxels. Volume fractions of thick and thin astrocyte processes, as well as sizes of process skeletons, were collected for each analyzed Z-stack. Because thicker GFAP-positive processes tend to be brighter in the stain, an independent intensity-based separation between larger and small processes was created from a 3-level Otsu thresholding procedure, where the lowest level corresponded to the background, the intermediate level corresponded to dimmer, thin processes, and the highest level separated larger, brighter processes.
Because EAAT2 immunostaining does not reflect any obvious morphology, its quantification differed from that of GFAP and was based on structural image texture analysis algorithms. In essence, we analyzed individual XY planes within each 3D imaged volume using (i) the Laplacian of Gaussian blob detection algorithm to quantify bright EAAT2-positive granules and (ii) the texture separation to granules and ridges (e.g., stringy aggregates of granules) using the shape index algorithm [86]. Specifically, the relative brightness of EAAT2-positive ridges and granules (“caps” in shape index terminology), as well as relative areas taken by ridges and granules and granule radii, were collected as averaged numbers for the XY-planes within each analyzed volume.
4.8. Drugs
Antagonists of NMDARs: D-2-amino-5-phosphonovalerate (AP5; 50 μM); (5R,10S)-(+)-5-methyl-10,11-dihydro-5H-dibenzo[a,d]cyclohepten-5,10-imine (MK-801; 10 µM); selective antagonist of GluN2B-containing NMDARs: 4-[2-(4-Benzylpiperidin-1-yl)-1-hydroxypropyl]phenol (ifenprodil; 3 μM); selective mGluR1 antagonist: 4-[1-(2-fluoropyridin-3-yl)-5-methyltriazol-4-yl]-N-methyl-N-propan-2-yl-3,6 dihydro-2H-pyridine-1-carboxamide (FTIDS; 5 μM); antagonist of glutamate transporters EAAT1 and EAAT2: (2S,3S)-3-[3-[4-(trifluoromethyl) benzoylamino] benzyloxy] aspartate (TFB-TBOA; 70 μM); co-agonists of NMDARs: D-serine (10 μM).
4.9. Statistical Analysis
The statistical analysis and graphical representation of the results were performed using OriginPro 8 (OriginLab Corporation, Northampton, MA, USA), Statistica 8.0 (StatSoft Inc., Tulsa, OK, USA), and Sigmaplot 12.5 (Systat Software Inc., Palo Alto, CA, USA). Dixon’s Q test (at a 90% confidence level) was used for the identification and rejection of outliers. The normality of the sample data was evaluated using the Kolmogorov–Smirnov test. The equality of variance was assessed using the Levene median test. Statistical significance was assessed using the nonparametric Mann-Whitney test, parametric Student’s t-test, and ANOVA, as stated in the text. All data are presented as mean ± SEM.
Author Contributions
Conceptualization, T.Y.P., A.V.S. and A.V.Z.; methodology, T.Y.P., D.E.K., A.V.S. and A.V.Z.; validation, T.Y.P., A.R.B., D.E.K. and A.V.Z.; formal analysis, T.Y.P., A.M.T., M.V.Z., O.I.N. and A.R.B.; investigation, T.Y.P., A.M.T., M.V.Z., O.I.N. and A.R.B.; writing—original draft preparation, T.Y.P., A.M.T., M.V.Z., O.I.N., A.R.B., D.E.K. and A.V.Z.; writing—review and editing, T.Y.P., A.V.S. and A.V.Z.; supervision, T.Y.P., D.E.K., A.V.S. and A.V.Z.; funding acquisition, A.R.B., A.V.S. and A.V.Z. All authors have read and agreed to the published version of the manuscript.
Funding
Institutional Review Board Statement
The study was conducted according to the EU Directive 2010/63/EU for animal experiments and approved by the Ethics Committee of the Sechenov Institute of Evolutionary Physiology and Biochemistry of the Russian Academy of Sciences (Ethical permit number 13-k-a, 15 February 2018).
Informed Consent Statement
Not applicable.
Data Availability Statement
The data presented in this study are available on request from the corresponding author.
Acknowledgments
Molecular biology experiments were performed using the facilities of the Research Resource Centre for physiological, biochemical, and molecular-biological research of the Sechenov Institute of Evolutionary Physiology and Biochemistry of the Russian Academy of Sciences.
Conflicts of Interest
The authors declare no conflict of interest.
References
- Pitkänen, A.; Lukasiuk, K. Molecular and Cellular Basis of Epileptogenesis in Symptomatic Epilepsy. Epilepsy Behav. 2009, 14, 16–25. [Google Scholar] [CrossRef] [PubMed]
- Vasilev, D.S.; Tumanova, N.L.; Kim, K.K.; Lavrentyeva, V.V.; Lukomskaya, N.Y.; Zhuravin, I.A.; Magazanik, L.G.; Zaitsev, A.V. Transient Morphological Alterations in the Hippocampus after Pentylenetetrazole-Induced Seizures in Rats. Neurochem. Res. 2018, 43, 1671–1682. [Google Scholar] [CrossRef] [PubMed]
- Dudai, Y.; Karni, A.; Born, J. Perspective the Consolidation and Transformation of Memory. Neuron 2015, 88, 20–32. [Google Scholar] [CrossRef] [PubMed]
- Pujar, S.S.; Martinos, M.M.; Cortina-Borja, M.; Chong, W.K.K.; De Haan, M.; Gillberg, C.; Neville, B.G.; Scott, R.C.; Chin, R.F. Long-Term Prognosis after Childhood Convulsive Status Epilepticus: A Prospective Cohort Study. Lancet Child Adolesc. Health 2018, 2, 103. [Google Scholar] [CrossRef]
- Cui, W.; Kobau, R.; Zack, M.M.; Helmers, S.; Yeargin-Allsopp, M. Seizures in Children and Adolescents Aged 6–17 Years—United States, 2010–2014. MMWR. Morb. Mortal. Wkly. Rep. 2015, 64, 1209–1214. [Google Scholar] [CrossRef]
- Massey, S.; Banwell, B. Clinical Implications of Status Epilepticus in Children. Lancet Child Adolesc. Health 2018, 2, 81–83. [Google Scholar] [CrossRef]
- Wu, C.-L.; Huang, L.-T.; Liou, C.-W.; Wang, T.-J.; Tung, Y.-R.; Hsu, H.-Y.; Lai, M.-C. Lithium-Pilocarpine-Induced Status Epilepticus in Immature Rats Result in Long-Term Deficits in Spatial Learning and Hippocampal Cell Loss. Neurosci. Lett. 2001, 312, 113–117. [Google Scholar] [CrossRef]
- Holmes, G.L.; Khazipov, R.; Ben-Ari, Y. New Concepts in Neonatal Seizures. Neuroreport 2002, 13, A3–A8. [Google Scholar] [CrossRef]
- Lynch, M.; Sayin, Ü.; Bownds, J.; Janumpalli, S.; Sutula, T. Long-Term Consequences of Early Postnatal Seizures on Hippocampal Learning and Plasticity. Eur. J. Neurosci. 2000, 12, 2252–2264. [Google Scholar] [CrossRef]
- Squires, R.F.; Saederup, E.; Crawley, J.N.; Skolnick, P.; Paul, S.M. Convulsant Potencies of Tetrazoles Are Highly Correlated with Actions on GABA/Benzodiazepine/Picrotoxin Receptor Complexes in Brain. Life Sci. 1984, 35, 1439–1444. [Google Scholar] [CrossRef]
- Huang, R.Q.; Bell-Horner, C.L.; Dibas, M.I.; Covey, D.F.; Drewe, J.A.; Dillon, G.H. Pentylenetetrazole-Induced Inhibition of Recombinant Gamma-Aminobutyric Acid Type A (GABA(A)) Receptors: Mechanism and Site of Action. J. Pharmacol. Exp. Ther. 2001, 298, 986–995. [Google Scholar] [PubMed]
- Han, T.; Qin, Y.; Mou, C.; Wang, M.; Jiang, M.; Liu, B. Seizure Induced Synaptic Plasticity Alteration in Hippocampus Is Mediated by IL-1β Receptor through PI3K/Akt Pathway. Am. J. Transl. Res. 2016, 8, 4499–4509. [Google Scholar] [PubMed]
- Mao, R.-R.; Tian, M.; Yang, Y.-X.; Zhou, Q.-X.; Xu, L.; Cao, J. Effects of Pentylenetetrazol-Induced Brief Convulsive Seizures on Spatial Memory and Fear Memory. Epilepsy Behav. 2009, 15, 441–444. [Google Scholar] [CrossRef] [PubMed]
- Socała, K.; Wlaź, P. Acute Seizure Tests Used in Epilepsy Research: Step-by-Step Protocol of the Maximal Electroshock Seizure (MES) Test, the Maximal Electroshock Seizure Threshold (MEST) Test, and the Pentylenetetrazole (PTZ)-Induced Seizure Test in Rodents. Neuromethods 2021, 167, 79–102. [Google Scholar]
- Velisek, L.; Kubova, H.; Pohl, M.; Stankova, L.; Mareš, P.; Schickerova, R. Pentylenetetrazol-Induced Seizures in Rats: An Ontogenetic Study. Naunyn. Schmiedebergs. Arch. Pharmacol. 1992, 346, 588–591. [Google Scholar] [CrossRef]
- Aniol, V.A.; Stepanichev, M.Y.; Lazareva, N.A.; Gulyaeva, N.V. An Early Decrease in Cell Proliferation after Pentylenetetrazole-Induced Seizures. Epilepsy Behav. 2011, 22, 433–441. [Google Scholar] [CrossRef]
- Zaitsev, A.V.; Kim, K.K.; Vasilev, D.S.; Lukomskaya, N.Y.; Lavrentyeva, V.V.; Tumanova, N.L.; Zhuravin, I.A.; Magazanik, L.G. N-Methyl-D-Aspartate Receptor Channel Blockers Prevent Pentylenetetrazole-Induced Convulsions and Morphological Changes in Rat Brain Neurons. J. Neurosci. Res. 2015, 93, 454–465. [Google Scholar] [CrossRef]
- Mohamed, H.K.; Eltony, S.A. Effect of Acute Pentylenetetrazol Injection Induced Epileptic Seizures on Rat Dentate Gyrus at Different Postnatal Ages. Anat. Cell Biol. 2020, 53, 84. [Google Scholar] [CrossRef]
- Zhvania, M.G.; Ksovreli, M.; Japaridze, N.J.; Lordkipanidze, T.G. Ultrastructural Changes to Rat Hippocampus in Pentylenetetrazol- and Kainic Acid-Induced Status Epilepticus: A Study Using Electron Microscopy. Micron 2015, 74, 22–29. [Google Scholar] [CrossRef]
- Aniol, V.A.; Ivanova-Dyatlova, A.Y.; Keren, O.; Guekht, A.B.; Sarne, Y.; Gulyaeva, N.V. A Single Pentylenetetrazole-Induced Clonic-Tonic Seizure Episode Is Accompanied by a Slowly Developing Cognitive Decline in Rats. Epilepsy Behav. 2013, 26, 196–202. [Google Scholar] [CrossRef]
- Jandová, K.; Riljak, V.; Pokorný, J.; Langmeier, M. Pentylentetrazol Associated Changes of Hippocampal Neurons in Immature Rats. Prague Med. Rep. 2007, 108, 67–74. [Google Scholar] [PubMed]
- Postnikova, T.Y.; Amakhin, D.V.; Trofimova, A.M.; Smolensky, I.V.; Zaitsev, A.V. Changes in Functional Properties of Rat Hippocampal Neurons Following Pentylenetetrazole-Induced Status Epilepticus. Neuroscience 2019, 399, 103–116. [Google Scholar] [CrossRef] [PubMed]
- Postnikova, T.Y.; Trofimova, A.M.; Ergina, J.L.; Zubareva, O.E.; Kalemenev, S.V.; Zaitsev, A.V. Transient Switching of NMDA-Dependent Long-Term Synaptic Potentiation in CA3-CA1 Hippocampal Synapses to MGluR1-Dependent Potentiation After Pentylenetetrazole-Induced Acute Seizures in Young Rats. Cell. Mol. Neurobiol. 2019, 39, 287–300. [Google Scholar] [CrossRef] [PubMed]
- Zucker, R.S.; Regehr, W.G. Short-Term Synaptic Plasticity. Annu. Rev. Physiol. 2002, 64, 355–405. [Google Scholar] [CrossRef] [PubMed]
- Zaitsev, A.V.; Anwyl, R. Inhibition of the Slow Afterhyperpolarization Restores the Classical Spike Timing-Dependent Plasticity Rule Obeyed in Layer 2/3 Pyramidal Cells of the Prefrontal Cortex. J. Neurophysiol. 2012, 107, 205–215. [Google Scholar] [CrossRef] [PubMed]
- Luscher, C.; Malenka, R.C. NMDA Receptor-Dependent Long-Term Potentiation and Long-Term Depression (LTP/LTD). Cold Spring Harb. Perspect. Biol. 2012, 4, a005710. [Google Scholar] [CrossRef]
- Li, R.; Huang, F.S.; Abbas, A.K.; Wigström, H. Role of NMDA Receptor Subtypes in Different Forms of NMDA-Dependent Synaptic Plasticity. BMC Neurosci. 2007, 8, 55. [Google Scholar] [CrossRef]
- Harris, A.Z.; Pettit, D.L. Extrasynaptic and Synaptic NMDA Receptors Form Stable and Uniform Pools in Rat Hippocampal Slices. J. Physiol. 2007, 584, 509–519. [Google Scholar] [CrossRef]
- Huettner, J.E.; Bean, B.P. Block of N-Methyl-D-Aspartate-Activated Current by the Anticonvulsant MK-801: Selective Binding to Open Channels. Proc. Natl. Acad. Sci. USA 1988, 85, 1307–1311. [Google Scholar] [CrossRef]
- Scheefhals, N.; MacGillavry, H.D. Functional Organization of Postsynaptic Glutamate Receptors. Mol. Cell. Neurosci. 2018, 91, 82–94. [Google Scholar] [CrossRef]
- Liu, L.; Wong, T.P.; Pozza, M.F.; Lingenhoehl, K.; Wang, Y.; Sheng, M.; Auberson, Y.P.; Wang, Y.T. Role of NMDA Receptor Subtypes in Governing the Direction of Hippocampal Synaptic Plasticity. Science 2004, 304, 1021–1024. [Google Scholar] [CrossRef]
- Zhang, L.; Meng, K.; Li, Y.-H.; Han, T.-Z. NR2A-Containing NMDA Receptors Are Required for L-LTP Induction and Depotentiation in CA1 Region of Hippocampal Slices. Eur. J. Neurosci. 2009, 29, 2137–2144. [Google Scholar] [CrossRef] [PubMed]
- Franchini, L.; Carrano, N.; Di Luca, M.; Gardoni, F. Synaptic GluN2A-Containing NMDA Receptors: From Physiology to Pathological Synaptic Plasticity. Int. J. Mol. Sci. 2020, 21, 1538. [Google Scholar] [CrossRef] [PubMed]
- Köhr, G.; Jensen, V.; Koester, H.J.; Mihaljevic, A.L.A.; Utvik, J.K.; Kvello, A.; Ottersen, O.P.; Seeburg, P.H.; Sprengel, R.; Hvalby, Ø. Intracellular Domains of NMDA Receptor Subtypes Are Determinants for Long-Term Potentiation Induction. J. Neurosci. 2003, 23, 10791–10799. [Google Scholar] [CrossRef]
- Gardoni, F.; Mauceri, D.; Malinverno, M.; Polli, F.; Costa, C.; Tozzi, A.; Siliquini, S.; Picconi, B.; Cattabeni, F.; Calabresi, P.; et al. Decreased NR2B Subunit Synaptic Levels Cause Impaired Long-Term Potentiation but Not Long-Term Depression. J. Neurosci. 2009, 29, 669–677. [Google Scholar] [CrossRef]
- Kovalenko, A.A.; Zakharova, M.V.; Zubareva, O.E.; Schwarz, A.P.; Postnikova, T.Y.; Zaitsev, A.V. Alterations in MRNA and Protein Expression of Glutamate Receptor Subunits Following Pentylenetetrazole-Induced Acute Seizures in Young Rats. Neuroscience 2021, 468, 1–15. [Google Scholar] [CrossRef] [PubMed]
- Anwyl, R. Metabotropic Glutamate Receptor-Dependent Long-Term Potentiation. Neuropharmacology 2009, 56, 735–740. [Google Scholar] [CrossRef] [PubMed]
- Zaitsev, A.V.; Smolensky, I.V.; Jorratt, P.; Ovsepian, S.V. Neurobiology, Functions, and Relevance of Excitatory Amino Acid Transporters (EAATs) to Treatment of Refractory Epilepsy. CNS Drugs 2020, 34, 1089–1103. [Google Scholar] [CrossRef]
- Verhoog, Q.P.; Holtman, L.; Aronica, E.; van Vliet, E.A. Astrocytes as Guardians of Neuronal Excitability: Mechanisms Underlying Epileptogenesis. Front. Neurol. 2020, 11, 1541. [Google Scholar] [CrossRef] [PubMed]
- Steward, O.; Torre, E.R.; Tomasulo, R.; Lothman, E. Seizures and the Regulation of Astroglial Gene Expression. Epilepsy Res. Suppl. 1992, 7, 197–209. [Google Scholar]
- Alese, O.O.; Mabandla, M.V. Upregulation of Hippocampal Synaptophysin, GFAP and MGluR3 in a Pilocarpine Rat Model of Epilepsy with History of Prolonged Febrile Seizure. J. Chem. Neuroanat. 2019, 100, 101659. [Google Scholar] [CrossRef] [PubMed]
- Simani, L.; Elmi, M.; Asadollahi, M. Serum GFAP Level: A Novel Adjunctive Diagnostic Test in Differentiate Epileptic Seizures from Psychogenic Attacks. Seizure 2018, 61, 41–44. [Google Scholar] [CrossRef] [PubMed]
- Melone, M.; Bellesi, M.; Ducati, A.; Iacoangeli, M.; Conti, F. Cellular and Synaptic Localization of EAAT2a in Human Cerebral Cortex. Front. Neuroanat. 2011, 4, 151. [Google Scholar] [CrossRef] [PubMed]
- Valtcheva, S.; Venance, L. Control of Long-Term Plasticity by Glutamate Transporters. Front. Synaptic Neurosci. 2019, 11, 10. [Google Scholar] [CrossRef]
- Armbruster, M.; Hanson, E.; Dulla, C.G. Glutamate Clearance Is Locally Modulated by Presynaptic Neuronal Activity in the Cerebral Cortex. J. Neurosci. 2016, 36, 10404–10415. [Google Scholar] [CrossRef]
- Rusakov, D.A.; Kullmann, D.M. Extrasynaptic Glutamate Diffusion in the Hippocampus: Ultrastructural Constraints, Uptake, and Receptor Activation. J. Neurosci. 1998, 18, 3158–3170. [Google Scholar] [CrossRef]
- Katagiri, H.; Tanaka, K.; Manabe, T. Requirement of Appropriate Glutamate Concentrations in the Synaptic Cleft for Hippocampal LTP Induction. Eur. J. Neurosci. 2001, 14, 547–553. [Google Scholar] [CrossRef]
- Scimemi, A.; Tian, H.; Diamond, J.S. Neuronal Transporters Regulate Glutamate Clearance, NMDA Receptor Activation, and Synaptic Plasticity in the Hippocampus. J. Neurosci. 2009, 29, 14581–14595. [Google Scholar] [CrossRef]
- Shimamoto, K.; Sakai, R.; Takaoka, K.; Yumoto, N.; Nakajima, T.; Amara, S.G.; Shigeri, Y. Characterization of Novel L- Threo -β-Benzyloxyaspartate Derivatives, Potent Blockers of the Glutamate Transporters. Mol. Pharmacol. 2004, 65, 1008–1015. [Google Scholar] [CrossRef]
- Zaitsev, A.V.; Amakhin, D.V.; Dyomina, A.V.; Zakharova, M.V.; Ergina, J.L.; Postnikova, T.Y.; Diespirov, G.P.; Magazanik, L.G. Synaptic Dysfunction in Epilepsy. J. Evol. Biochem. Physiol. 2021, 57, 542–563. [Google Scholar] [CrossRef]
- Zhang, Y.; Cai, G.E.; Yang, Q.; Lu, Q.C.; Li, S.T.; Ju, G. Time-Dependent Changes in Learning Ability and Induction of Long-Term Potentiation in the Lithium–Pilocarpine-Induced Epileptic Mouse Model. Epilepsy Behav. 2010, 17, 448–454. [Google Scholar] [CrossRef] [PubMed]
- Cruz Del Angel, Y.; Orfila, J.E.; Herson, P.S.; Brooks-Kayal, A.; González, M.I. Down-Regulation of AMPA Receptors and Long-Term Potentiation during Early Epileptogenesis. Epilepsy Behav. 2021, 124, 108320. [Google Scholar] [CrossRef] [PubMed]
- Kryukov, K.A.; Kim, K.K.; Magazanik, L.G.; Zaitsev, A.V. Status Epilepticus Alters Hippocampal Long-Term Synaptic Potentiation in a Rat Lithium-Pilocarpine Model. Neuroreport 2016, 27, 1191–1195. [Google Scholar] [CrossRef] [PubMed]
- Plata, A.; Lebedeva, A.; Denisov, P.; Nosova, O.; Postnikova, T.Y.; Pimashkin, A.; Brazhe, A.; Zaitsev, A.V.; Rusakov, D.A.; Semyanov, A. Astrocytic Atrophy Following Status Epilepticus Parallels Reduced Ca2+ Activity and Impaired Synaptic Plasticity in the Rat Hippocampus. Front. Mol. Neurosci. 2018, 11, 215. [Google Scholar] [CrossRef]
- Grosser, S.; Buck, N.; Braunewell, K.H.; Gilling, K.E.; Wozny, C.; Fidzinski, P.; Behr, J. Loss of Long-Term Potentiation at Hippocampal Output Synapses in Experimental Temporal Lobe Epilepsy. Front. Mol. Neurosci. 2020, 13, 143. [Google Scholar] [CrossRef]
- Debanne, D.; Thompson, S.M.; Gähwiler, B.H. A Brief Period of Epileptiform Activity Strengthens Excitatory Synapses in the Rat Hippocampus in Vitro. Epilepsia 2006, 47, 247–256. [Google Scholar] [CrossRef]
- Di Maio, R.; Mastroberardino, P.G.; Hu, X.; Montero, L.; Greenamyre, J.T. Pilocapine Alters NMDA Receptor Expression and Function in Hippocampal Neurons: NADPH Oxidase and ERK1/2 Mechanisms. Neurobiol. Dis. 2011, 42, 482–495. [Google Scholar] [CrossRef]
- Postnikova, T.Y.; Diespirov, G.P.; Amakhin, D.V.; Vylekzhanina, E.N.; Soboleva, E.B.; Zaitsev, A.V. Impairments of Long-Term Synaptic Plasticity in the Hippocampus of Young Rats during the Latent Phase of the Lithium-Pilocarpine Model of Temporal Lobe Epilepsy. Int. J. Mol. Sci. 2021, 22, 13355. [Google Scholar] [CrossRef]
- Miltiadous, P.; Stamatakis, A.; Koutsoudaki, P.N.; Tiniakos, D.G.; Stylianopoulou, F. IGF-I Ameliorates Hippocampal Neurodegeneration and Protects against Cognitive Deficits in an Animal Model of Temporal Lobe Epilepsy. Exp. Neurol. 2011, 231, 223–235. [Google Scholar] [CrossRef]
- Yang, H.; Shan, W.; Zhu, F.; Yu, T.; Fan, J.; Guo, A.; Li, F.; Yang, X.; Wang, Q. C-Fos Mapping and EEG Characteristics of Multiple Mice Brain Regions in Pentylenetetrazol-Induced Seizure Mice Model. Neurol. Res. 2019, 41, 749–761. [Google Scholar] [CrossRef]
- O’Neill, N.; McLaughlin, C.; Komiyama, N.; Sylantyev, S. Biphasic Modulation of NMDA Receptor Function by Metabotropic Glutamate Receptors. J. Neurosci. 2018, 38, 9840–9855. [Google Scholar] [CrossRef] [PubMed]
- Lan, J.Y.; Skeberdis, V.A.; Jover, T.; Zheng, X.; Bennett, M.V.L.; Zukin, R.S. Activation of Metabotropic Glutamate Receptor 1 Accelerates NMDA Receptor Trafficking. J. Neurosci. 2001, 21, 6058–6068. [Google Scholar] [CrossRef] [PubMed]
- Reiner, A.; Levitz, J. Glutamatergic Signaling in the Central Nervous System: Ionotropic and Metabotropic Receptors in Concert. Neuron 2018, 98, 1080–1098. [Google Scholar] [CrossRef] [PubMed]
- Skeberdis, V.A.; Lan, J.; Opitz, T.; Zheng, X.; Bennett, M.V.; Zukin, R.S. MGluR1-Mediated Potentiation of NMDA Receptors Involves a Rise in Intracellular Calcium and Activation of Protein Kinase C. Neuropharmacology 2001, 40, 856–865. [Google Scholar] [CrossRef]
- Bertaso, F.; Roussignol, G.; Worley, P.; Bockaert, J.; Fagni, L.; Ango, F. Homer1a-Dependent Crosstalk between NMDA and Metabotropic Glutamate Receptors in Mouse Neurons. PLoS ONE 2010, 5, e9755. [Google Scholar] [CrossRef]
- Paoletti, P.; Bellone, C.; Zhou, Q. NMDA Receptor Subunit Diversity: Impact on Receptor Properties, Synaptic Plasticity and Disease. Nat. Rev. Neurosci. 2013, 14, 383–400. [Google Scholar] [CrossRef]
- Proper, E.A.; Hoogland, G.; Kappen, S.M.; Jansen, G.H.; Rensen, M.G.A.; Schrama, L.H.; van Veelen, C.W.M.; van Rijen, P.C.; van Nieuwenhuizen, O.; Gispen, W.H.; et al. Distribution of Glutamate Transporters in the Hippocampus of Patients with Pharmaco-resistant Temporal Lobe Epilepsy. Brain 2002, 125, 32–43. [Google Scholar] [CrossRef]
- Mathern, G.W.; Mendoza, D.; Lozada, A.; Pretorius, J.K.; Dehnes, Y.; Danbolt, N.C.; Nelson, N.; Leite, J.P.; Chimelli, L.; Born, D.E.; et al. Hippocampal GABA and Glutamate Transporter Immunoreactivity in Patients with Temporal Lobe Epilepsy. Neurology 1999, 52, 453. [Google Scholar] [CrossRef]
- Zubareva, O.E.; Kovalenko, A.A.A.; Kalemenev, S.V.; Schwarz, A.P.; Karyakin, V.B.; Zaitsev, A.V. Alterations in MRNA Expression of Glutamate Receptor Subunits and Excitatory Amino Acid Transporters Following Pilocarpine-Induced Seizures in Rats. Neurosci. Lett. 2018, 686, 94–100. [Google Scholar] [CrossRef]
- Lopes, M.W.; Soares, F.M.S.; De Mello, N.; Nunes, J.C.; Cajado, A.G.; De Brito, D.; De Cordova, F.M.; Da Cunha, R.M.S.; Walz, R.; Leal, R.B. Time-Dependent Modulation of AMPA Receptor Phosphorylation and MRNA Expression of NMDA Receptors and Glial Glutamate Transporters in the Rat Hippocampus and Cerebral Cortex in a Pilocarpine Model of Epilepsy. Exp. Brain Res. 2013, 226, 153–163. [Google Scholar] [CrossRef]
- Clarkson, C.; Smeal, R.M.; Hasenoehrl, M.G.; White, J.A.; Rubio, M.E.; Wilcox, K.S. Ultrastructural and Functional Changes at the Tripartite Synapse during Epileptogenesis in a Model of Temporal Lobe Epilepsy. Exp. Neurol. 2020, 326, 113196. [Google Scholar] [CrossRef] [PubMed]
- Takahashi, D.K.; Vargas, J.R.; Wilcox, K.S. Increased Coupling and Altered Glutamate Transport Currents in Astrocytes Following Kainic-Acid-Induced Status Epilepticus. Neurobiol. Dis. 2010, 40, 573–585. [Google Scholar] [CrossRef] [PubMed]
- Postnikova, T.Y.; Griflyuk, A.V.; Amakhin, D.V.; Kovalenko, A.A.; Soboleva, E.B.; Zubareva, O.E.; Zaitsev, A.V. Early Life Febrile Seizures Impair Hippocampal Synaptic Plasticity in Young Rats. Int. J. Mol. Sci. 2021, 22, 8218. [Google Scholar] [CrossRef] [PubMed]
- Sankar, R.; Shin, D.H.; Liu, H.; Mazarati, A.; Pereira de Vasconcelos, A.; Wasterlain, C.G. Patterns of Status Epilepticus-Induced Neuronal Injury during Development and Long-Term Consequences. J. Neurosci. 1998, 18, 8382–8393. [Google Scholar] [CrossRef] [PubMed]
- Riban, V.; Bouilleret, V.; Pham-Lê, B.T.; Fritschy, J.-M.; Marescaux, C.; Depaulis, A. Evolution of Hippocampal Epileptic Activity during the Development of Hippocampal Sclerosis in a Mouse Model of Temporal Lobe Epilepsy. Neuroscience 2002, 112, 101–111. [Google Scholar] [CrossRef]
- Fang, M.; Xi, Z.-Q.; Wu, Y.; Wang, X.-F. A New Hypothesis of Drug Refractory Epilepsy: Neural Network Hypothesis. Med. Hypotheses 2011, 76, 871–876. [Google Scholar] [CrossRef]
- Fattorusso, A.; Matricardi, S.; Mencaroni, E.; Dell’Isola, G.B.; Di Cara, G.; Striano, P.; Verrotti, A. The Pharmacoresistant Epilepsy: An Overview on Existant and New Emerging Therapies. Front. Neurol. 2021, 12, 1030. [Google Scholar] [CrossRef]
- Schmidt, D.; Sillanpää, M. Prevention of Epilepsy: Issues and Innovations. Curr. Neurol. Neurosci. Rep. 2016, 16, 95. [Google Scholar] [CrossRef]
- Paxinos, G.; Watson, C. The Rat Brain in Stereotaxic Coordinates; Elsevier: Amsterdam, The Netherlands, 2007. [Google Scholar]
- Kopec, A.M.; Rivera, P.D.; Lacagnina, M.J.; Hanamsagar, R.; Bilbo, S.D. Optimized Solubilization of TRIzol-Precipitated Protein Permits Western Blotting Analysis to Maximize Data Available from Brain Tissue. J. Neurosci. Methods 2017, 280, 64–76. [Google Scholar] [CrossRef]
- Harrington, C.R. Lowry Protein Assay Containing Sodium Dodecyl Sulfate in Microtiter Plates for Protein Determinations on Fractions from Brain Tissue. Anal. Biochem. 1990, 186, 285–287. [Google Scholar] [CrossRef]
- Laemmli, U.K. Cleavage of Structural Proteins during the Assembly of the Head of Bacteriophage T4. Nature 1970, 227, 680–685. [Google Scholar] [CrossRef] [PubMed]
- Thacker, J.S.; Yeung, D.H.; Staines, W.R.; Mielke, J.G. Total Protein or High-Abundance Protein: Which Offers the Best Loading Control for Western Blotting? Anal. Biochem. 2016, 496, 76–78. [Google Scholar] [CrossRef] [PubMed]
- Korzhevskii, D.E.; Sukhorukova, E.G.; Kirik, O.V.; Grigorev, I.P. Immunohistochemical Demonstration of Specific Antigens in the Human Brain Fixed in Zinc-Ethanol-Formaldehyde. Eur. J. Histochem. 2015, 59, 5–9. [Google Scholar] [CrossRef] [PubMed]
- Frangi, A.F.; Niessen, W.J.; Vincken, K.L.; Viergever, M.A. Multiscale Vessel Enhancement Filtering. In Lecture Notes in Computer Science (Including Subseries Lecture Notes in Artificial Intelligence and Lecture Notes in Bioinformatics); Springer: Berlin/Heidelberg, Germany, 1998; Volume 1496, pp. 130–137. ISBN 3540651365. [Google Scholar]
- Koenderink, J.J.; van Doorn, A.J. Surface Shape and Curvature Scales. Image Vis. Comput. 1992, 10, 557–564. [Google Scholar] [CrossRef]


Publisher’s Note: MDPI stays neutral with regard to jurisdictional claims in published maps and institutional affiliations. |
© 2022 by the authors. Licensee MDPI, Basel, Switzerland. This article is an open access article distributed under the terms and conditions of the Creative Commons Attribution (CC BY) license (https://creativecommons.org/licenses/by/4.0/).