Abstract
Breast cancer (BC) is a heterogeneous malignancy that still represents the second cause of cancer-related death among women worldwide. Due to the heterogeneity of BC, the correct identification of valuable biomarkers able to predict tumor biology and the best treatment approaches are still far from clear. Although molecular imaging with positron emission tomography/computed tomography (PET/CT) has improved the characterization of BC, these methods are not free from drawbacks. In recent years, radiomics and artificial intelligence (AI) have been playing an important role in the detection of several features normally unseen by the human eye in medical images. The present review provides a summary of the current status of radiomics and AI in different clinical settings of BC. A systematic search of PubMed, Web of Science and Scopus was conducted, including all articles published in English that explored radiomics and AI analyses of PET/CT images in BC. Several studies have demonstrated the potential role of such new features for the staging and prognosis as well as the assessment of biological characteristics. Radiomics and AI features appear to be promising in different clinical settings of BC, although larger prospective trials are needed to confirm and to standardize this evidence.
1. Introduction
Breast cancer (BC) represents the most common malignancy in terms of prevalence and the second cause of cancer-related death among women globally, with increasing incidence over the last decade [1]. BC is a heterogeneous tumor in terms of expression of several different receptors and genomic mutations. In particular, the receptor status classifies BC into four categories, i.e., Luminal A, Luminal B, Human epidermal growth factor receptor 2 (HER-2)+, and triple negative (TNBC), and also influences the choice of treatment options and the prediction of survival [2,3]. Nevertheless, tumor biology characterization is reliant on invasive procedures, such as biopsy sampling of a single lesion, which do not necessarily represent the whole tumor heterogeneity [4,5].
Hybrid imaging by [18F]F-Fluorodeoxyglucose positron emission tomography/computed tomography (FDG PET/CT), combining metabolic and morphological features, is now widely used for diagnosis, staging, assessment of treatment response and survival prediction of several malignancies, including BC [6,7,8]. Indeed, glucose metabolism reflects the biology of malignant cells and metabolic parameters, such as the maximum standardized uptake value (SUVmax), the mean standardized uptake value (SUVmean), the metabolic tumor volume (MTV) and the total lesion glycolysis (TLG), have been found to be associated with hormone receptors status and molecular subtypes in some studies [9,10,11,12]. Nonetheless, also semi-quantitative parameters derived from FDG PET/CT images have their own disadvantages; for example, SUVmax represents only the single hottest pixel, whereas MTV depends on the threshold-based method, and therefore, is not able to fully capture BC heterogeneity [13].
In the context of increasingly personalized medicine, the identification of reliable and non-invasive biomarkers able to predict tumor heterogeneity is fundamental for a patient’s treatment. Radiomics, defined as the process of identifying mineable variables hidden in the pixels of images and routinely not visualized by the human eye, is currently an emerging technique in the field of medical image analysis. Radiomics consists of high-throughput extraction, automated or not, of a large number of quantitative parameters from medical images, based on the hypothesis that such extracted features could be linked to genotypic and molecular characteristics of the tumor lesions. Its non-invasive nature and the possibility to study and to follow all lesions’ distributions over time, avoiding the requirement for repeated biopsies, are the undoubted advantages of radiomics [14,15,16]. In the setting of BC, radiomics data are available from several studies conducted with different medical images, such as ultrasound, mammography, magnetic resonance imaging (MRI), and PET/CT [17,18,19,20].
Artificial intelligence (AI) is a branch of computer sciences [21], which includes machine learning (ML) and deep learning (DL) [22]. ML models are based on a training dataset that is first provided to develop their own logic for answering future questions. DL is the newest class of ML and has been found to be advantageous to other forms of ML [23]. The development of computer science algorithms, tools and applications relevant to medical imaging has rapidly increased in the last years [24,25]. Aktolun [26] in 2019 describes the potential and challenges of radiomics and AI in nuclear medicine.
The aim of our systematic review is to summarize the current role of PET radiomics in BC, and to describe its potential application in clinical practice to assist physicians improve patient management.
2. Results
The literature search identified a total of 239 studies, reduced to 81 after excluding duplicates, non-original articles, and papers relevant to other topics. The number of studies that met the inclusion criteria was 53. Figure 1 illustrates the PRISMA flowchart of the articles included in our systematic review. Among these, 43 (81.1%) studies were retrospective and 10 (18.9%) prospective. Radiomic data were extracted from PET/CT in 43 (81.1%) papers, PET/MRI in 4 (7.6%) and dedicated breast PET (dbPET) in 6 (11.3%) papers. The majority of the studies were performed using [18F]-fluorodeoxyglusoce ([18F]-FDG) (50 studies, 94.3%), but few experiences were reported using [18F]F-Fluorestradiol (18F-FES, 1 study, 1.9%) and [18F]F-Fluorothymidine (18F-FLT, 2 studies, 3.8%).
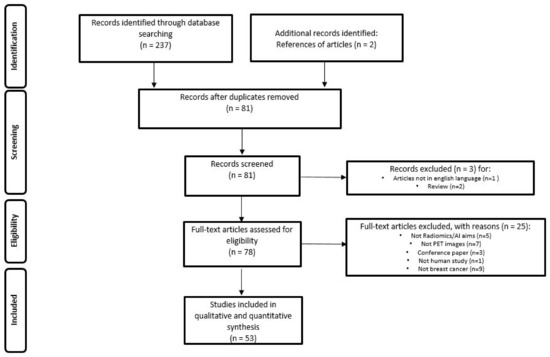
Figure 1.
PRISMA Flowchart of study selection and inclusion in the systematic review.
The papers were divided into six categories according to the clinical context explored and/or the type of study: diagnosis and biological characterization, neoadjuvant chemotherapy (NAC), staging and restaging, prognosis, dbPET, and technical papers. The number of papers included in each category is shown in Table 1. Some papers were included in more than one category, based on the discussed aim.
Overall, 47 out of 53 papers (88.7%) performed texture analysis, using several software packages, mostly open source (n = 26; 49.1%). Data mining was performed in 24 papers (45.3%) using ML and DL in 18 and 6 cases, respectively. In 20 out of 24 (83.3%) studies performing data mining, validation was also performed.

Table 1.
Summary of general characteristics of studies.
Table 1.
Summary of general characteristics of studies.
| Author | Year | Design | Clinical Context/Type of Study | Aim | RP | Scanner | N. Pts. |
|---|---|---|---|---|---|---|---|
| Liu et al. [27] | 2021 | R | Diagnosis and biological characterization | To predict molecular subtype classification of BC | FDG | PET/CT | 273 |
| Krajnc et al. [28] | 2021 | P | Diagnosis and biological characterization | To characterize BC | FDG | PET/CT | 170 |
| Ou et al. [29] | 2020 | R | Diagnosis and biological characterization | To differentiate BC from breast lymphoma | FDG | PET/CT | 44 |
| Ou et al. [30] | 2019 | R | Diagnosis and biological characterization | To differentiate BC from breast lymphoma | FDG | PET/CT | 44 |
| Acar et al. [31] | 2019 | R | Diagnosis and biological characterization | To predict immunochemistry and prognosis in BC | FDG | PET/CT | 72 |
| Antunovic L et al. [12] | 2017 | R | Diagnosis and biological characterization | To predict Immunochemistry and subtypes in BC | FDG | PET/CT | 43 |
| Groheux D et al. [32] | 2015 | P | Diagnosis and biological characterization | To predict immunochemistry, subtypes and pCR in BC | FDG | PET/CT | 146 |
| Yoon HJ et al. [33] | 2015 | R | Diagnosis and biological characterization | To predict invasive components in breast ductal carcinoma in situ | FDG | PET/CT and MRI | 65 |
| Soussan M et al. [34] | 2014 | R | Diagnosis and biological characterization | To predict BC prognosis | FDG | PET/CT | 54 |
| Umutlu et al. [35] | 2022 | R | NAC | To predict response after NAC | FDG | PET/MRI | 73 |
| Fantini et al. [36] | 2021 | P | NAC | To predict response after NAC | FLT | PET/CT | 15 |
| Choi et al. [37] | 2020 | R | NAC | To predict response after NAC | FDG | PET/CT and PET/MRI | 56 |
| Li et al. [38] | 2020 | R | NAC | To predict response after NAC | FDG | PET/CT | 100 |
| Antunovic et al. [39] | 2019 | R | NAC | To predict response after NAC | FDG | PET/CT | 291 |
| Lee H et al. [40] | 2019 | R | NAC | To predict response after NAC | FDG | PET/CT | 435 |
| Willaime J M Y et al. [41] | 2013 | R | NAC | To predict response after NAC | FLT | PET | 15 |
| Cheng et al. [42] | 2022 | R | NAC | To predict ALN mts | FDG | PET/CT | 290 |
| Eifer et al. [43] | 2022 | R | Staging/re-staging | To differentiate between ALN mts and inflammation | FDG | PET/CT | 99 |
| Chen et al. [44] | 2022 | R | Staging/re-staging | To detect occult ALN mts in cN0 | FDG | PET/CT | 180 |
| Araz et al. [45] | 2022 | R | Staging/re-staging | To predict HR positivity | FDG | PET/CT | 153 |
| Moreau et al. [46] | 2022 | P | Staging/re-staging | To detect BC mts and to determine treatment response in metastatic BC | FDG | PET/CT | 60 |
| Lee et al. [47] | 2021 | R | Staging/re-staging | To predict ALN mts | FDG | PET/CT | 326 |
| Li et al. [48] | 2021 | R | Staging/re-staging | To predict ALN mts | FDG | PET/CT | 407 |
| Song et al. [49] | 2021 | R | Staging/re-staging | To predict ALN mts | FDG | PET/CT | 100 |
| Schiano et al. [50] | 2019 | R | Staging/re-staging | To detect early mts | FDG | PET/MRI | 217 |
| Jo et al. [51] | 2022 | R | Prognosis | To evaluate RFS | FDG | PET/CT | 124 |
| Bouron et al. [52] | 2022 | P | Prognosis | To predict prognosis in TNBC | FDG | PET/CT | 111 |
| Weber et al. [53] | 2021 | R | Prognosis | To predict BC prognosis | FDG | PET/CT | 50 |
| Chang et al. [54] | 2019 | R | Prognosis | To predict BC prognosis | FDG | PET/CT | 35 |
| Groheux et al. [55] | 2017 | R | Prognosis | To predict immunochemistry and prognosis in BC | FDG | PET/CT | 143 |
| Satoh et al. [56] | 2022 | R | dbPET | To predict BC | FDG | PET/CT and dbPET | 284 |
| Satoh et al. [57] | 2020 | R | dbPET | To characterize BC | FDG | PET/CT and dbPET | 44 |
| Hathi et al. [58] | 2020 | R | dbPET | To characterize BC | FDG | PET/CT and dbPET | 10 |
| Moscoso A et al. [59] | 2018 | R | dbPET | To predict immunochemistry and subtypes in BC | FDG | dbPET | 127 |
| Satoh et al. [60] | 2020 | R | dbPET | To predict BC | FDG | dbPET | 105 |
| Cheng L et al. [61] | 2017 | R | dbPET | To predict response after NAC | FDG | PET/CT and dbPET | 61 |
| Castaldo et al. [62] | 2022 | P | Technical papers | Framework of analysis to generate a combined radiomic signature in BC | FDG | PET/MRI | 36 |
| Takahashi et al. [63] | 2022 | R | Technical papers | Deep learning to improve diagnostic accuracy in BC | FDG | PET/CT | 500 |
| Aide et al. [64] | 2018 | P | Technical papers | PET/CT acquisition protocol optimization to improve BC diagnosis | FDG | PET/CT | 47 |
| Boughdad S et al. [65] | 2018 | R | Technical papers | Robustness of textural features in BC | FDG | PET/CT | 552 |
| Orlhac F et al. [66] | 2018 | R | Technical papers | Harmonization method for multicenter radiomic study | FDG | PET | 63 |
| Yang Z et al. [67] | 2017 | R | Technical papers | Assessment of estrogen receptor from intratumoral heterogeneity | FES | PET/CT | 46 |
| Orlhac F et al. [68] | 2017 | R | Technical papers | Robustness of textural features in BC | FDG | PET/CT | 54 |
| Hatt M et al. [69] | 2015 | R | Technical papers | Textural features to quantify intratumoral BC heterogeneity | FDG | PET/CT | 555 |
| Orlhac F et al. [70] | 2014 | P | Technical papers | Robustness of textural features in BC | FDG | PET/CT | 106 |
| Chen et al. [71] | 2022 | R | Diagnosis and biological characterization/Staging re-staging | To predict HER2 expression in BC | FDG | PET/CT | 271 |
| Umutlu et al. [72] | 2021 | R | Diagnosis and biological characterization/NAC | Breast cancer phenotyping and tumor decoding | FDG | PET/MRI | 124 |
| Molina Garcia et.al [73] | 2018 | P | Diagnosis and biological characterization/NAC | To predict BC prognosis | FDG | PET/CT | 68 |
| Lemarignier et al. [74] | 2017 | R | Diagnosis and biological characterization/NAC | To characterize BC (T stage, stage and histology) | FDG | PET/CT | 171 |
| Ha et al. [75] | 2017 | R | Diagnosis and biological characterization/NAC/Prognosis | To predict immunochemistry, response after NAC and prognosis in BC | FDG | PET/CT | 73 |
| Aide et al. [76] | 2021 | P | Diagnosis and biological characterization/Prognosis | To predict immunochemistry and prognosis in BC | FDG | PET/CT | 38 |
| Huang et al. [77] | 2018 | R | Diagnosis and Biological Characterization/Prognosis | To predict immunochemistry and prognosis in BC | FDG | PET/CT | 113 |
| Yoon et al. [78] | 2019 | R | NAC/Prognosis | To predict response after NAC | FDG | PET/CT and MRI | 83 |
ALN: axillary lymph nodes; BC: breast cancer; BSGI: breast-specific gamma imaging; dbPET: dedicated breast PET; FDG: [18F]F-Fluorodeoxyglucose; FES: [18F]F-Fluorestradiol; FLT: [18F]F-Fluorothymidine; HR: hormone receptors; HER-2: Human epidermal growth factor receptor 2; MTS: metastases; NAC: neoadjuvant chemotherapy; pCR: pathological complete response; P: prospective; R: retrospective; RFS: relapse free survival; RP: radiopharmaceutical; TNBC: TN breast cancer.
2.1. Diagnosis and Biological Characterization
The wide reach of screening programs allows earlier detection of BC in the population, significantly improving patients’ outcomes [79]. However, BC screening has some limitations and improving radiological performances in this subset is an unmet need of oncology [80,81,82,83]. Indeed, after detecting a lesion with screening programs, a biopsy is usually performed, with a certain number of cases hesitating in benign or uncertain findings. Therefore, several authors have tried to solve this issue by applying radiomics to many imaging modalities, including PET/CT/MRI, to obtain “free” information on newly diagnosed breast lesions from already available imaging data. Krajnc et al. [28] found a high performance of holomic models in BC detection (80% sensitivity, 78% specificity, 80% accuracy, 0.81 area under the curve (AUC)) and TNBC tumor identification (85% sensitivity, 78% specificity, 82% accuracy, 0.82 AUC). For the same purpose, an intermediate result was obtained with the SUVmax model (AUC 0.76 in cancer detection and 0.70 in the prediction of TNBC subtype). Conversely, holomic models demonstrated only low performance for determining receptor status and luminal A/B subtype (0.46–0.68 AUC). Moreover, Lemarignier et al. [74] reported that all the texture features extracted from FDG PET demonstrated significant correlations with tumor size (T2 vs. T3), the American Joint Committee on Cancer stage (stage II vs. stage III) and the histological type (invasive ductal carcinoma vs. invasive lobular carcinoma).
Yoon et al. [33] performed a texture-based analysis of intratumoral metabolic heterogeneity aiming to reveal the presence of tumoral invasive components in a retrospective analysis of 65 patients undergoing FDG PET/CT for ductal carcinoma in situ (DCIS). The authors reported a lower AUC of cumulative SUV histograms (AUC-CSH), a parameter reflecting higher intratumoral metabolic heterogeneity, was associated with an underestimation of invasive components. Thus, sentinel lymph node biopsy should be considered in patients affected by DCIS with low AUC-CSH.
Ou and colleagues [29,30] investigated the ability of FDG PET/CT radiomic features to discriminate BC from breast lymphoma using a ML approach. PETa (based on clinical, SUV and radiomic features from PET images) and CTa (clinical and radiomic features from CT images) models showed the best ability to discriminate between two different breast malignancies, both in training and in validation groups (AUCs of 0.867 and 0.806 for PETa model, AUCs of 0.891 and 0.759 for CTa model, respectively). Moreover, SUV metrics (particularly SUVmax) extracted from FDG PET/CT images showed potential in the differentiation between breast lymphoma and carcinoma as well as for the differentiation of the different subtypes of lymphoma [30].
Another important application of radiomics is in the biological characterization of BC. Indeed, different BC subtypes present very different behaviours in terms of incidence, clinical-pathological features, disease natural history and prognosis [84]. Therefore, several authors applied radiomic features to predict the biologic characterization of BC [12,73,77]. Liu et al. [27] compared conventional PET parameters (SUVmax, SUVmean, SUVpeak, MTV, TLG) and PET-derived radiomic features in the prediction of molecular subtype classification of BC. As a result, PET-derived radiomic features outperformed every individual conventional PET parameter, including luminal vs. non-luminal (AUC = 0.913 vs. AUC = 0.725), HER-2+ vs. HER-2– (AUC = 0.912 vs. AUC = 0.820), and TNBC vs. non-TNBC classification (AUC = 0.968 vs. AUC = 0.901). Similarly, Umutlu et al. [72], in a cohort of 124 patients undergoing FDG PET/MRI, extracted radiomic features from both types of images (PET and MRI). The authors found that texture features extracted from MRI images had the best performance in differentiating luminal A from luminal B cancers (AUC = 0.98; accuracy = 97.3). Moreover, PET-derived radiomic features provided the best accuracy in the grading determination (AUC = 0.71), while both PET and MRI-derived features could predict hormone receptor status (AUC = 0.87 and 0.88 for estrogen receptor (ER) and progesterone receptor (PR), respectively), tumoral proliferation index, expressed in Ki-67 (AUC = 0.997), and lymph nodes and distant metastatic disease (AUC = 0.81 and 0.99, respectively). A similar result was reported by Aide et al. [76]. In a cohort of 38 luminal non-metastatic BC, the authors extracted some radiomic features able to correlate the heterogeneity of metabolic activity on FDG PET with that of ER and PR expressions. Conversely, in 153 patients who underwent preoperative FDG PET/CT, Araz et al. [45] found that only SUVmax, SUVmean, and SUVpeak were significantly higher in HR negative patients, whereas none of the radiomics features were predictors for HR status. This result is consistent with that published by other papers [74], in particular Ha et al. [75], who reported that three tumor clusters obtained by unsupervised clustering based on FDG PET-related texture features were not associated with ER, PR, or HER-2 status, but only with ki-67 index. Likewise, Groheux et al. [32] did not find radiomic features correlated with clinical and histopathological characteristics or with BC subgroups in a cohort of 171 patients with stage II-III BC. Acar et al. [31] reported an intermediate result between the papers described above. In this work, both conventional and radiomic parameters extracted from FDG PET correlated with ER expression, but only conventional PET metrics were able to predict Ki-67 index and the status of PR and HER-2. Chen et al. [71] investigated the ability of ML, based on FDG PET, to predict HER-2 status in BC patients. The best results were obtained by the XGBoost model based on PET/CTmean or PET/CTconcat radiomic fusion features. Finally, Soussan et al. [34] reported that the best performance in identifying TNBC was obtained by combining SUVmax and High-Gray-level Run Emphasis (HGRE), a textural index extracted from delineated tumor volume on FDG PET/CT (AUC = 0.83).
2.2. Neoadjuvant Chemotherapy
The treatment of locally advanced BC (LABC) usually differs from that of early BC (EBC) as in LABC, surgery is usually preceded by neoadjuvant chemotherapy (NAC) [85]. However, NAC indications are have been widely debated in the literature after recent evidence suggested consideration of NAC in TNBC and HER-2-positive BC, regardless of disease extension [86]. The literature underlines the essential value of pathological complete response (pCR) after NAC, which is significantly associated with prolonged disease free survival (DFS) and overall survival (OS) [87,88,89]. In this context, several authors extracted radiomic features to predict pCR from baseline FDG PET/CT. Umutlu et al. [35] recently assessed the potential role of baseline multiparametric FDG PET/MRI-based radiomics to predict pCR after NAC in 73 female patients with newly diagnosed therapy-naïve BC. The combination of all MRI sequences and PET data showed the best results in terms of AUC and negative predictive value (NPV) (0.8 and 79.5%, respectively). Moreover, in a subgroup of HR+/HER-2− patients, the best AUC (0.94) for predicting pCR was obtained by combining all the MRI and PET data. This result is consistent with the previous works by Antunovic et al. [39], Lee et al. [40], Yoon et al. [78] and Ha et al. [75]. Similarly, Li et al. [38] found some baseline FDG PET/CT derived radiomic features able to predict efficacy prior to NAC (prediction accuracy (PA) = 0.857; AUC = 0.844 on the training split set and PA = 0.767; AUC = 0.722 on the independent validation set) in a retrospective analysis of 100 BC patients. Interestingly, incorporating age in the analysis improved PA to 0.857 (AUC = 0.958) and 0.8 (AUC = 0.73) for the split set and independent validation set, respectively, outperforming the clinical prediction model. Similarly, Molina-Garcia et al. [73] reported the usefulness of textural variables obtained from baseline FDG PET/CT before NAC for predicting OS and DFS. Interestingly, radiomic-derived parameters were equally as strong at predicting patient outcomes as PET at the diagnosis stage.
Choi and colleagues [37] in a further step, introduced a breast PET/MRI image deep learning model (convolutional neural network—CNN) and compared it with the conventional parameters. They found that the application of CNN could improve the AUC of conventional parameters, except for baseline diffusion MRI images.
Conversely, in the work by Lemarignier et al. [74] and Cheng et al. [61], radiomic features could not predict pCR. However, the modifications in conventional and radiomic PET features, evaluated between baseline and after two cycles of NAC, resulted in increased predictive strength for pCR.
Investigating the clinical value of [18F]F-fluoroestradiol (FES) in the assessment of the ER status and its intratumoral heterogeneity expression in BC patients was the main aim of the work published by Yang et al. [67]. These authors found a good correlation between FES, FDG uptake (SUVmax and SUVmean), and pathological features (ER, PR, HER-2, Ki67%, and tumor size). Furthermore, they suggest the use of SUVmean instead of SUVmax because it provided a slightly better correlation between quantitative tumor FES uptake and hormone receptor expression (ER, PR) and HER-2 amplification.
Finally, Fantini and colleagues [36] extracted radiomic advanced textural features from [18F]F-FLT (FLT) PET/CT and explored their accuracy in the prediction of response to NAC in a cohort of 15 patients with LABC. A combination of SUVmax and textural feature index IVH_VolumeIntFract_90 was identified as the best combination to classify PET response. Moreover, the combination of PET response, ID range, and ID_Coefficient of Variation was able to classify pathological response to NAC. A similar result was obtained by Willaime et al. [41], who showed a correlation between FLT PET/CT derived radiomic features and both partial pathological response and pCR after NAC in 14 BC patients.
2.3. Staging and Restaging
FDG PET/CT is an imaging modality widely used in oncology to assess the glycolytic metabolism and is based on the so-called “Warburg effect” [90]. Specifically, malignant cells have an increased glucose metabolism in comparison with normal tissues, and this metabolic change can be easily detected by FDG PET/CT in numerous malignancies, including BC [91]. In particular, in patients with BC, axillary lymph node (ALN) metastasis is one of the most significant clinical factors, dictating the treatment strategy and predicting survival [92]. For this reason, in the last years, several papers have focused on the potential diagnostic role of PET radiomics for predicting ALN metastasis [43,44,47,48,49]. Li et al. [48] constructed an AI-assisted diagnosis system using deep-learning technology to improve clinicians’ diagnostic accuracy in the identification of ALN metastasis. They analyzed 404 BC patients who underwent FDG PET/CT before surgery. The AI model did not outperform the clinicians’ image analysis, but the diagnostic accuracies were considerably improved when combining both evaluations. Indeed, the two clinicians’ sensitivities of 59.8% and 57.4% increased to 68.6% and 64.2%, respectively, whereas the clinicians’ specificities of 99.0% and 99.5% remained unchanged. The authors concluded by suggesting a possible assistance role for AI in assisting clinicians in ambiguous cases.
On the other hand, Song and colleagues [49] proposed a ML-based radiomic model developed analysing FDG PET/CT with the aim of predicting ALN metastasis in a cohort of 100 patients with invasive ductal BC. The model showed excellent results (90.9%, 71.4%, and 80% for sensitivity, specificity, and accuracy, respectively), which suggest it as a promising tool for the preoperative detection of ALN metastasis.
Regardless of negative preoperative investigations (including ultrasound imaging, PET/CT, or fine-needle aspiration), some cN0 patients develop metastases. As a consequence, sentinel lymph node biopsy (SLNB) and axillary lymph node dissection (ALND) are frequently performed, although they are invasive procedures not free from complications [93,94]. Therefore, finding a non-invasive tool able to detect occult ALN metastases in cN0 patients would be very useful. In this subset of patients, Chen et al. [44] identified 14 FDG PET/CT-derived radiomics features able to perceive ALN metastasis. Then, random forest (RF), support vector machine (SVM), stochastic gradient descent (SGD), and k-nearest neighbour (KNN) were used to build the prediction models. Among the four models, RF showed the highest accuracy (mean AUC 81.2%, p < 0.001) and could potentially help the clinicians in determining ALN status in patients with cN0.
Furthermore, Lee et al. [47] investigated the role of textural parameters, extracted from peritumoral breast adipose tissue, on pre-operative FDG PET/CT in predicting ALN metastasis in 326 BC patients. Among 38 features extracted, the highest AUC value (0.830) was shown by grey-level co-occurrence matrix (GLCM) entropy, which outperformed visual analysis (0.739, p < 0.05) and was comparable to LN SUVmax (0.793, p < 0.05). Interestingly, GLCM entropy could also predict ALN metastasis in patients with negative findings on visual analysis (AUC: 0.759). This study highlights the importance of tumor microenvironment, such as adipose tissue, in the progression and metastatic spread of BC.
In the era of COVID-19 mRNA vaccination, a new challenge faced by clinicians is the correct differentiation between metastatic and reactive axillary LN. In their retrospective study, Eifer et al. [43] aimed to differentiate between metastatic axillary lymphadenopathy in BC patients and reactive inflammatory LN in those who received anti-COVID-19 vaccine using a radiomics and a ML approach. According to the RF and KNN models, combined PET/CT features had the highest AUC values for differentiating between axillary metastasis and inflammation post-vaccination, followed by CT and PET features. In particular, the first-order, GLRLM, and GLDM features were those with AUC values above 0.9. Based on these results, the authors suggest a potential application in discriminating between benign and malignant LN.
Although most of the studies have been based on PET/CT, Schiano et al. [50] have combined radiomics parameters from hybrid FDG PET/MRI with the expression level of the transcriptional factor Yin Yang 1 (YY1) for the detection of early metastases. YY1 level was significantly overexpressed in the ER+/PR+/HER-2- subtype of BC patients with synchronous metastasis at staging compared with metachronous metastasis and healthy subjects (p < 0.001), and it correlated significantly with SUVmax (r = 0.48). Hence, the combination of functional FDG PET/MRI parameters and molecular determination of YY1 could represent a novel integrated approach to predict synchronous metastatic disease with more accuracy than FDG PET/MRI alone.
In the last decades, several criteria, both morphological and metabolic (e.g., RECIST and PERCIST), have been proposed to assess treatment response in oncology. Nevertheless, manual segmentation of all lesions is time consuming in clinical practice, especially in patients with multiple metastases. For this reason, Moreau and colleagues [46] trained two deep-learning models in order to automatically segment BC metastatic lesions on the baseline and follow-up FDG PET/CT of 60 patients. The authors assessed four imaging biomarkers, i.e., SULpeak, TLG, PET Bone Index, and PET Liver Index, with SULpeak identified as the best biomarker to assess patients’ response (sensitivity 87%, specificity 87%), representing a promising tool for automatic segmentation of metastatc BC lesions.
2.4. Prognosis
Several variables concur in defining BC prognosis, including clinical-pathological features and treatment selection [9,95]. Moreover, new insights in imaging analysis demonstrated an incremental value in stratifying the prognosis of BC patients [81]. Among imaging modalities, several papers have reported the prognostic meaning of FDG PET/CT [8,96]. Bouron et al. [52] aimed to identify the association among metabolic, volumetric and textural parameters extracted from FDG PET/CT at diagnosis and clinical outcomes, expressed by DFS and OS, in 111 TNBC patients. Five metabolic and volumetric parameters (i.e., SUVmax, SUVmean, SUVpeak, MTV, and TLG), and six textural features (i.e., entropy, homogeneity, Short-Run Emphasis, Long-Run Emphasis, Low-Gray-level Zone Emphasis, and High-Gray-level Zone Emphasis) derived from the primary tumor were analysed. While in the univariate analysis, high TLG, MTV and entropy of the primary tumor were associated with DFS and OS, in the multivariate analysis only MTV of the primary tumor, with a threshold value of 9.3, correlated with a shorter OS. Similarly, two more studies reported that, on multivariate analysis, primary tumor MTV was an independent predictor of relapse free survival (RFS) [51] and event free survival (EFS) [55], respectively, whereas textural analysis of PET images did not show any added value. In another study with similar aims, only MTVwb was an independent predictor for shorter progression free survival (PFS) in 35 patients with newly diagnosed invasive ductal BC (HR: 8.29, 95% CI: 2.17–31.64, p = 0.0020) [54]. Moreover, a higher clinical stage was found to be an independent prognostic factor for OS.
A prognostic significance for FDG PET radiomic features was found by Aide et al. [76]. Skewness_ER was identified as a predictor of 8y-EFS using the univariable Kaplan–Meier method, although this was not confirmed by multivariate analysis. Moreover, Yoon et al. [78] found that only high-intensity zone emphasis was a significant predictor of recurrence (p = 0.027) in a cohort of 83 patients with LABC who underwent FDG PET at diagnosis.
Two papers applied AI on FDG PET to obtain prognostic data. In the paper published by Huang et al. [77], the three tumor clusters identified with an unsupervised clustering of FDG PET and MRI-derived parameters showed a significant correlation not only with tumor molecular subtypes and immunohistochemistry, but also with relapse free survival (RFS). This is consistent with the results of Ha et al. [75]. Furthermore, Weber et al. [53] evaluated the accuracy of a neural network, trained for lymphoma and lung cancer, in the correct detection and segmentation of pathological uptakes in patients with advanced BC. Surprisingly, the authors report a high correlation between AI-derived and manually segmented MTV (R2 = 0.91; p < 0.001). Moreover, in multivariate analysis, AI-derived MTV (both whole body and organ-wise) resulted a predictor of OS.
2.5. dbPET
dbPET consists of high resolution molecular imaging acquired on hanging uncompressed breast, using a high resolution full-ring breast-dedicated tomograph [97]. The first experience using dbPET was published by Moliner et al. [98] in 2010. This imaging modality provides a very high detection rate, thanks to its 1.5–2.0 mm spatial resolution [99]. In a few studies, textural features were extracted to make a direct comparison between dbPET and whole-body PET [57,58,59]. Satoh et al. [57], in a retrospective study of 44 patients, compared the two tomographs in classifying tumor characteristics of BC, obtaining similar results for both dbPET and whole-body PET/CT. Conversely, Moscoso et al. [59], demonstrated strong correlations between FDG dbPET-derived radiomic features and both immunohistochemistry and molecular subtypes of BC, stronger than those obtained by whole-body PET. Hathi et al. [58] characterized similarities and differences in the uptake of FDG between bilateral dbPET and wbPET in a cohort of ten patients with biopsy-confirmed LABC before starting NAC. FDG uptake measurements and 20 radiomic features related to morphology, tumor intensity, and texture were calculated and compared to predict the response to NAC. dbPET-derived features outperformed wbPET ones when using SULpeak (five times increased in comparison with wbPET) and spatial heterogeneity features. The authors conclude that dbPET could be useful for prediction of primary tumor response to NAC.
Analysing dbPET images, Satoh et al. [60] developed a ML model with SVM including quantitative parameters that was able to detect early BC using dbPET. They found that SVM outperformed visual assessment for this purpose (0.77 vs. 0.89, 0.57 vs. 0.94, 0.77 vs. 0.77 and 0.71 vs. 0.85, for AUC, sensitivity, specificity, and accuracy, respectively). Cheng et al. [42] aimed to develop a ML model combining dbPET features and clinical variables to predict pathological involvement of ALN in 420 early-stage BC. The AUC of the integrated model, which included six clinical-pathological factors and five dbPET radiomics parameters, was 0.94 in the training set (n = 203) and 0.93 in the validation set (n = 87) (p < 0.05 in both cases). Moreover, in the clinical N0 subgroup, NPV and PPV were 96.9% and 92.7%, respectively. The study highlights the potential positive impact of ML for improving true negative and true positive detection of ALN.
More recently, Satoh et al. [56] attempted to determine the best DL model to predict BC. The model was trained with 458 breasts (including 109 breast and 349 non-breast cancers) and tested with 160 breasts, comprehending 43 cancers and 117 non-breast cancers. The deep learning model showed 93% for both sensitivity and specificity, compared with 77–89% and 79–100% obtained from two expert radiologists. In addition, the diagnostic performance of the model (AUC = 0.937) was not significantly different from that of the experts (AUC = 0.983, p = 0.095; AUC = 0.941, p = 0.907).
2.6. Techincal Papers
The lack of standardization of features calculation and methodology hinders comparisons of the results of radiomic studies in the literature [68,100]. After features extraction, the reproducibility of each features, robustness and sensitivity should be investigated [101]. To allow for texture index value interpretation, Orlhac et al. [68] investigated the changes in value of six texture indices computed from simulated and real patient data. Variability in texture index values as a function of voxel size (variations up to 85.8% for the most homogeneous sphere model) and edge effects (variations up to 29%) was demonstrated.
Boughdad et al. [65] found significant SUVs and textural features differences as a function of age in normal breast tissue and in BC radiomic phenotype with triple-negative tumors being the most affected. Their results suggest that age should be considered as a covariable in radiomic models.
In order to clarify the relationship between texture features and conventional indices (SUV, MTV, TLG), Orlhac et al. [70] studied 31 different TFs in 3 different tumor types. They reported that only 17 of 31 texture indices were robust with respect to the tumor segmentation method. Additionally, they proposed that a resampling formula with at least 32 gray levels should be used to preserve the relationship between textural features and SUV. Moreover, Hatt et al. [69] demonstrated the correlation (Spearman rank correlation rs = 0.74) between tumor heterogeneity (entropy) and metabolic tumor volume in a multi-cancer site BC patient cohort.
A further complexity occurs in multicenter studies. It is necessary to remove the center effect (i.e., scanner, acquisition protocol) while preserving patient-specific effects. Orlhac et al. [66] proposed a post-reconstruction harmonization method efficient at removing multicenter effects for textural features and SUVs. After harmonization, none of the nine features, extracted form healthy liver tissue ROI in BC patients, significantly differed between the two departments (p > 0.1).
The influence of acquisition protocol and reconstruction setting on TFs was investigated by Aide et al. [64]. A prediction model for tumor classification was built using a random forests method. Matrix size and PSF modelling appeared to improve discrimination between immunohistochemical subtypes (luminal versus non-luminal) in breast cancer.
Recently, some authors have developed AI models in order to improve prognosis [62] and increase diagnostic accuracy [63] in BC patients. Castaldo et al. [62], in a pilot study, evaluated different normalization methods on primary component analysis (PCA), both within-subject and between-subjects, in order to generate a combined radiomic signature for a more precise breast cancer prognosis, helping clinicians to achieve improved therapeutic decision-making and make progress towards ever more personalized medicine. The results were compared and validated on twenty-seven patients to investigate the tumor grade, Ki-67 index, and molecular cancer subtypes using classification methods (LogitBoost, random forest, and linear discriminant analysis).
To increase the diagnostic accuracy of PET/CT, deep learning models using images derived from four different degrees (i.e., 0°, 30°, 60°, and 90°) of PET maximum-intensity projection (MIP) were developed by Takahashi et al. [63]. The models were trained with 400 images (200 cancers and 200 non-cancers) and tested on 50 breast and 50 non-breast cancers. The promising sensitivity (80% to 98%) and specificity (76% to 92%) obtained in the different models, suggest that a deep learning model may be able to assist radiologists in their diagnostic work in the future.
2.7. Radiomics Quality Assessment
To assess the overall quality of the considered radiomics studies, we adopted the RQS metric. All the considered studies had an RQS between 5 (13.89%) and 22 (61.11%). The distribution of the RQS scores of the studies in Figure 2 shows that most of the studies are non-compliant with the best-practice procedures. Nevertheless, 15% of the studies have achieved a score that is representative of a study that highly satisfies the research criteria in the radiomics area.
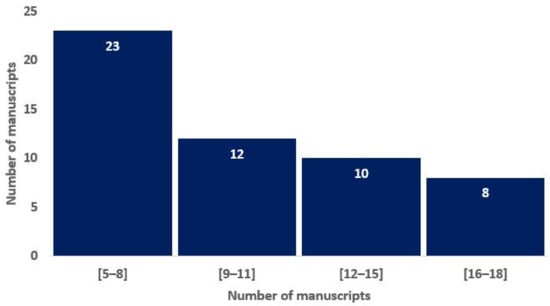
Figure 2.
Histograms of average RQS scores according to the blinded analysis of two authors, based on the previous study of Lambin and colleagues [16].
3. Materials and Methods
3.1. Literature Search Strategy
A search on the most relevant databases and online sources (Pubmed/Medline, Web of Science, Scopus) was performed running the following query string: “(PET OR Positron Emission Tomography OR PET/CT or PET/MRI) AND (Breast OR Breast Cancer) AND (Radiomics OR Texture OR Texture Analysis OR Machine Learning OR Deep Learning OR Artificial Intelligence OR AI) NOT REVIEW”. English-language original articles published before 15 June 2022 were considered.
3.2. Study Selection
Titles and abstracts were independently reviewed by three authors (L.U.; L.M.; and A.C.) to evaluate study inclusion. Full articles were retrieved when the abstract was considered relevant. Inclusion criteria applied during selection were as follows: (a) articles concerning BC; and (b) articles on texture analysis derived from PET/CT, PET/MRI and/or computer science applications. The following papers were considered ineligible: (a) review articles; (b) articles not in the English language; and (c) studies not within the field of interest (i.e., not radiomics/AI aims, not PET images, conference papers, not human studies, and not breast cancer). The data were summarized in a database with the following fields: first author, journal, year, title, exclusion/issues, imaging modality, computer science area, number of patients, training set size, test set size, validation set size, and the setting/purpose of the study (diagnosis and biological characterization, NAC, staging and restaging, prognosis, dbPET and technical papers) for the subsequent data analysis.
For each study, the radiomic analysis was assessed based on the radiomic quality score (RQS) [16]. For a robust calculation, RQS was blindly computed by two of the authors (L.U.and L.M.) and discrepancies were discussed to reach a consensus.
4. Discussion and Conclusions
This systematic review provides a state-of-the-art picture of the application of radiomic features and AI on FDG PET in BC. Due to its high prevalence, BC is a high impact neoplasm. Therefore, the application of radiomics and AI on this type of malignancy can have a very high relevance in terms of precision medicine, patient management and prognosis. However, although much work has been conducted in the last five years, further research is required before these approaches can be implemented in daily clinical practice. Promising results have been obtained in the characterization of the primary tumor characteristics, in particular, the molecular subtypes, although these have not been confirmed by all the studies analyzed. If validated in larger studies, or even through the use of big data, radiomics could provide an additional tool to further explore BC characteristics, alongside what breast biopsy already offers. In this context, the papers comparing dbPET and wbPET suggest the superiority of dbPET-derived radiomic features. Nevertheless, dbPET does not allow exploration of eventual metastases at a distance.
The application of PET radiomics for the prognostic stratification of BC has provided disappointing results to date, with quantitative parameters, particularly MTV, still appearing as the most reliable for this purpose [9]. Currently, the most interesting scenarios for PET radiomic application in BC appear to be the evaluation of ALN status and the prediction of pCR after NAC. The early identification of ALN metastasis has a large impact on a BC patient’s prognosis, as well as on the selection of the invasiveness of the surgical procedure performed (SLNB vs. ALND) [102]. Similarly, identifying patients who will not reach pCR after NAC is essential for offering a second-line therapy in patients requiring it [86]. However, PET radiomic studies are still very inhomogeneous and lack the reproducibility required for introduction into daily clinical practice, as already suggested by previous analyses [20,81,103]. In this context, considering the overview in Table 2 and Table 3, a trend for a rudimentary standardization seems to have started. The newest studies in the top half of the table at least report substantial information regarding the methods used for radiomic analysis, whereas the older studies at the bottom of the table lack methodological data. This might be considered a first step towards the use of solid, recognized radiomic analysis systems, which we hope will allow the widespread use of AI for selected applications in the near future.
Finally, some settings of BC still remain almost unexplored with radiomic analysis. In particular, the prediction of metastasis at distance at baseline PET imaging was performed by only one paper [50], but with encouraging results. Similarly, radiomic-assisted therapy response assessment was only explored by one study [46], which introduced an interesting automatic segmentation of BC lesions using DL. We encourage researchers to investigate the potentialities of radiomic analysis and AI also on these clinical settings of BC.
Table 2.
Summary of studies’ radiomic features analyses (from newest to older).
Table 2.
Summary of studies’ radiomic features analyses (from newest to older).
| Author | TA | FTs n. | FTs Types | Sw TA | Sw Class | Selected FTs | Statistical Test | RQS (%) [16] |
|---|---|---|---|---|---|---|---|---|
| Chen et al. [44] | Yes | 3124 | First-order, GLCM, GLRLM, GLDM, NGTDM, GLSZM, shape | 3D slicer | OS | 14 | t-test, LASSO | 15 (41.67%) |
| Umutlu et al. [35] | Yes | 101 | First-order, GLCM, GLRLM, NGLDM, NGTDM, GLSZM | ITK-SNAP | OS | 6 | elastic net combining Lasso and ridge regression | 13 (36.11%) |
| Eifer et al. [43] | Yes | 110 | First-order, GLCM, GLRLM, GLDM, NGTDM, GLSZM, shape | Python Software | OS | 18 | t-test, Chi square | 12 (33.33%) |
| Jo et al. [51] | Yes | 7 | First-order | Lifex | OS | 7 | ROC, Cox proportional-hazards model | 10 (27.78%) |
| Cheng et al. [42] | Yes | 851 | First-order, GLCM, GLRLM, GLDM, NGTDM, GLSZM, Shape, Wavelat | 3D slicer | OS | 34 | LASSO | 13 (36.11%) |
| Castaldo et al. [62] | Yes | 74 | First- and second-order | PMOD | C | 7 | Spearman correlation, PCA | 18 (50.00%) |
| Bouron et al. [52] | Yes | 6 | Homogeneity, entropy, SRE, LRE, LGZE, HGZE | DOSIsoft | C | 6 | PCA, ROC, log-rank test | 16 (44.44%) |
| Araz et al. [45] | Yes | 42 | First- and higher-order | Lifex | OS | 2 | binary logistic regression analysis | 7 (19.44%) |
| Satoh et al. [56] | No | nd | nd | nd | nd | nd | ICC, ROC | 8 (22.22%) |
| Takahashi et al. [63] | No | nd | nd | nd | nd | nd | ICC, ROC | 5 (13.89%) |
| Moreau et al. [46] | No | nd | nd | nd | nd | nd | Wilcoxon, Kolmogorov–Smirnov, Spearman correlation | 5 (13.89%) |
| Chen et al. [71] | Yes | 2436 | First-order, GLCM, GLRLM, GLDM, GLSZM, shape | 3D slicer | OS | 34 | ICC, variance threshold, Mann–Whitney U test | 12 (33.33%) |
| Lee et al. [47] | Yes | 38 | First-order, GLCM, GLRLM, GLZLM, NGLDM | Lifex | OS | 38 | t-test, Chi square, ROC | 10 (27.78%) |
| Liu et al. [27] | Yes | 1710 | First-order, GLCM, GLRLM, NGLDM, NGTDM, GLSZM | Matlab | C | 1710 | Wilcoxon and LASSO | 12 (33.33%) |
| Fantini et al. [36] | Yes | 148 | First- and higher-order, shape | Matlab | C | 39 | ICC, LASSO | 19 (52.78%) |
| Umutlu et al. [72] | Yes | 101 | First-order, GLCM, GLRLM, NGLDM, NGTDM, GLSZM | CERR | C | 6 | Lasso regression | 14 (38.89%) |
| Krajnc et al. [28] | Yes | 121 | First-order, GLCM, GLSZM, NGTDM, shape | MUW | OS | 77 | Pearson correlation | 22 (61.11%) |
| Weber et al. [53] | Yes | nd | nd | nd | OS | nd | Wilcoxon, Mann–Whitney U test | 5 (13.89%) |
| Aide et al. [76] | Yes | nd | First-order, GLCM, NGLDM | Lifex | OS | nd | Mann–Whitney, ROC | 19 (52.78%) |
| Li et al. [48] | No | nd | nd | nd | OS | nd | nd | 8 (22.22%) |
| Song et al. [49] | Yes | 792 | nd | 3D slicer | OS | 30 | nd | 7 (19.44%) |
| Satoh et al. [57] | Yes | 38 | GLCM, GLRLM, GLZSM, NGLDM | PTexture | OS | 38 | PCA | 8 (22.22%) |
| Hathi et al. [58] | Yes | 20 | First-order, GLCM, NGTDM, shape | 3D slicer | OS | 20 | Wilcoxon | 7 (19.44%) |
| Choi et al. [37] | No | nd | nd | nd | OS | nd | Chi square, Mann–Whitney U | 8 (22.22%) |
| Satoh et al. [60] | No | nd | nd | nd | nd | nd | Chi square, Fischer, Mann–Whitney U | 8 (22.22%) |
| Li et al. [38] | Yes | 104 | First-order, GLCM, NGTDM, GLRLM, GLSZM, GLDLM, shape | 3D slicer | OS | 10 | Wilcoxon | 13 (36.11%) |
| Ou et al. [29] | Yes | 55 | First-order, GLCM, NGLDM, GLRLM, GLZLM, shape | LifeX | OS | 19 | LASSO | 11 (30.56%) |
| Schiano et al. [50] | Yes | 12 | GLCM | PMOD | C | 15 | Spearman correlation, Wilcoxon | 12 (33.33%) |
| Chang et al. [54] | Yes | 15 | GLCM | CGITA | OS | 15 | Spearman correlation, ROC | 9 (25.00%) |
| Ou et al. [30] | Yes | 12 | First-order, GLCM, GLRLM, NGLDM, GLZLM, shape | LifeX | OS | 6 | ROC | 7 (19.44%) |
| Acar et al. [31] | Yes | nd | First-order, GLCM, GLRLM, NGLDM, GLZLM, shape | LifeX | OS | nd | Mann–Whitney U and Kruskal–Wallis | 7 (19.44%) |
| Antunovic et al. [39] | Yes | nd | First-, second- and higher-order | LifeX | OS | nd | ROC, LASSO | 11 (30.56%) |
| Aide et al. [64] | Yes | 20 | GLCM, NGLDM, GLZLM | LifeX | OS | 20 | Spearman correlation | 17 (47.22%) |
| Lee H et al. [40] | Yes | nd | First-order, GLCM, GLRLM | Mazda | OS | 19 | Wilcoxon, Chi square | 10 (27.78%) |
| Huang S Y et al. [77] | Yes | 42 | First-order, shape, texture | Pyradiomics | OS | 10 | Chi square | 11 (30.56%) |
| Boughdad S et al. [65] | Yes | 31 | GLCM, GLRLM, NGLDM, GLZLM | LifeX | OS | 6 | Spearman correlation, Anova | 6 (16.67%) |
| Molina-Garcia D et al. [73] | Yes | 16 | GLCM, GLRLM | Matlab | C | 3 | Kolmogorov–Smirnov, Mann–Whitney, ROC | 17 (47.22%) |
| Yoon HJ et al. [78] | Yes | 46 | First-, second-order | CGITA | OS | 37 | Kolmogorov–Smirnov, Mann–Whitney, ROC | 10 (27.78%) |
| Orlhac et al. [66] | Yes | 9 | GLCM, GLRLM, GLZLM | LifeX | OS | 6 | Wilcoxon | 9 (25.00%) |
| Moscoso A et al. [59] | Yes | nd | First-order, GLCM, GLSZM | Matlab | C | 10 | Spearman correlation, Kruskal–Wallis | 9 (25.00%) |
| Antunovic et al. [12] | Yes | 17 | First-order, shape, size | Matlab | C | 12 | Pearson correlation | 8 (22.22%) |
| Cheng et al. [61] | Yes | 3 | Skewness, entropy, coarseness | Matlab | C | 3 | Chi square, ROC | 9 (25.00%) |
| Ha et al. [75] | Yes | 109 | GLCM, GLRLM, NGLDM, GLZLM, GLSZM | CGITA | OS | 109 | Pearson correlation | 8 (22.22%) |
| Yang et al. [67] | Yes | 5 | Pathological features | nd | nd | 5 | Spearman correlation | 6 (16.67%) |
| Groheux et al. [55] | Yes | nd | GLCM | nd | nd | 3 | Wilcoxon test, Benjamini–Hochberg method | 6 (16.67%) |
| Orlhac et al. [68] | Yes | 6 | Homogeneity, entropy, SRE, LRE, LGZE, HGZE | LifeX | OS | 2 | Wilcoxon | 7 (19.44%) |
| Groheux et al. [32] | Yes | nd | nd | nd | nd | nd | Spearman correlation, ROC | 13 (36.11%) |
| Yoon et al. [33] | Yes | 9 | Clinical PET-MRI/BSGI features | PMOD | C | 9 | Chi square, Kruskal–Wallis, Logistic regression analysis | 6 (16.67%) |
| Hatt et al. [69] | Yes | 15 | GLCM | nd | nd | 4 | Spearman correlation, univariate Cox proportional hazards regression | 5 (13.89%) |
| Soussan et al. [34] | Yes | 31 | First-order, GLCM, GLRLM | nd | nd | 3 | ROC, univariate logistic regression | 9 (25.00%) |
| Orlhac et al. [70] | Yes | 36 | First-order, GLCM, GLRLM, NGLDM, GLZLM | nd | nd | 7 | Pearson correlation | 16 (44.44%) |
| Willaime et al. [41] | Yes | 28 | First-order, GLCM, GLSZM, NGTDM | Matlab | C | 8 | Shapiro–Wilk, ICC | 6 (16.67%) |
| Lemarignier et al. [74] | Yes | 4 | Entropy, homogeneity, contrast and energy | nd | nd | 4 | Spearman correlation | 8 (22.22%) |
BC: breast cancer; BSGI: breast-specific gamma imaging; C: commercial; GLCM: gray-level co-occurrence matrix; GLDM: gray-level difference matrix; GLRLM: gray-level run-length matrix; GLSZM: gray-level size zone matrix; GLZLM: gray-level zone-length matrix; FTs: features; HGZE: high gray-level zone emphasis; ICC: intra-class correlation; LASSO: least absolute shrinkage and selection operator; LGZE: low gray-level zone emphasis; LRE: long-run emphasis; nd: not defined; NGLDM: neighborhood gray-level different matrix; NGTDM: neighborhood gray-tone difference matrix; OS: open source; PCA: principal component analysis; ROC: receiving operating characteristics; RQS: radiomics quality score; SRE: short-run emphasis; Sw: software; TA: texture analysis.
Table 3.
Summary of studies’ data mining (from newest to older).
Table 3.
Summary of studies’ data mining (from newest to older).
| Author | AI Area | AI Sw | Sw Class | Data-Mining Methods | Validated | Validation Test |
|---|---|---|---|---|---|---|
| Chen et al. [44] | ML | Pyton software and Pyradiomics module | OS | RF, SVM, SGD, KNN | Yes | 5-fold cross-validation |
| Umutlu et al. [35] | DL | Matlab | C | SVM | Yes | 5-fold cross-validation |
| Eifer et al. [43] | ML | Pyradiomics, Scikit-learn, TensorFlow libraries | OS | KNN and RF | Yes | 5-fold cross-validation |
| Jo et al. [51] | nd | NA | NA | NA | No | NA |
| Cheng et al. [42] | ML | R-software | OS | Multivariable regression with the Akaike’s information criterion (AIC) | Yes | 10-fold cross-validation |
| Castaldo et al. [62] | ML | R-software | OS | Additive logistic regression (LogitBoost), RF, LDA | Yes | 3-fold cross-validation |
| Araz et al. [45] | ML | WEKA | OS | SVM, Hoeffding tree, J48, and MLP | Yes | 10-fold cross-validation |
| Satoh et al. [56] | DL | Pytorch | OS | CNN based on Xception | No | NA |
| Takahashi et al. [63] | DL | Pytorch | OS | CNN based on Xception | No | NA |
| Moreau et al. [46] | DL | Python and Phytorch | OS | U-Net | Yes | 5-fold cross-validation |
| Chen et al. [71] | ML | Python | OS | MLP, SVM, RF and XGBoost | Yes | 3-fold cross-validation |
| Umutlu et al. [72] | ML | Matlab | C | SVM | Yes | 5-fold cross-validation |
| Krajnc et al. [28] | ML | NA | NA | RF | Yes | 100-fold MC-cross-validation |
| Weber et al. [53] | ML | Matlab | C | CNN | Yes | bootstrap Gauss test |
| Aide et al. [76] | ML | XLSTAT Software | C | RF | Yes | OOB |
| Li et al. [48] | DL | DCNN-based diagnosis method | IH | 3D CNN | Yes | 5-fold cross-validation |
| Song et al. [49] | ML | R | OS | XGBoost | Yes | NA |
| Choi et al. [37] | DL | CNN-based sofware | OS | CNN | Yes | 3-fold cross-validation |
| Satoh et al. [60] | ML | scikit-learn and data mining framework in Pyton | OS | SVM | Yes | 2-fold cross-validation |
| Li et al. [38] | ML | Scikit-learn, numpy, scipy and math packages in Pyton | OS/C | RF | Yes | 10-fold cross-validation |
| Ou et al. [29] | ML | PYTHON and IBM SPSS | OS/C | LDA | Yes | 10-fold cross-validation |
| Antunovic et al. [39] | ML | STATA/R | C/OS | Univariable and multivariable logistic regression | Yes | 10-fold cross-validation |
| Aide et al. [64] | ML | XLSTAT Software | C | RF | Yes | OOB |
| Lee et al. [40] | ML | R | OS | Multivariable logistic regression | Yes | Cross-validation 10-fold, 5-fold, and leave-one-out methods |
| Huang et al. [77] | ML | Python | IH | SVM, RF, logistic regression | Yes | 3-fold cross-validation |
AI: artificial intelligence; BC: breast cancer; CNN: convolutional neural network; DL: deep learning; FTs: features; KNN: k-nearest neighbors; LDA: linear discriminant analysis; IH: in-house; ML: machine learning; MLP: multi-layer perceptron; NA: not applicable; nd: not defined; OOB: Out-Of-Bag; RF: random forest; SGD: stochastic gradient descent; SVM: support vector machine; Sw: software; TA: texture analysis; XGBoost: eXtreme Gradient Boosting.
Author Contributions
Conceptualization, S.P.; methodology and formal analysis, L.M.; validation, L.E., G.G. and A.T.; investigation, A.C., M.C. and L.F.; data curation and writing, L.U., A.C. and L.M.; original draft preparation, L.U.; writing—review and editing, S.P.; visualization, all authors; supervision, S.P., C.C. and M.C.; project administration, S.P. All authors have read and agreed to the published version of the manuscript.
Funding
This research received no external funding.
Institutional Review Board Statement
Not applicable.
Informed Consent Statement
Not applicable.
Data Availability Statement
Not applicable.
Conflicts of Interest
The authors declare no conflict of interest.
References
- Siegel, R.L.; Miller, K.D.; Jemal, A. Cancer statistics, 2020. CA. Cancer J. Clin. 2020, 70, 7–30. [Google Scholar] [CrossRef]
- Holm, J.; Eriksson, L.; Ploner, A.; Eriksson, M.; Rantalainen, M.; Li, J.; Hall, P.; Czene, K. Assessment of Breast Cancer Risk Factors Reveals Subtype Heterogeneity. Cancer Res. 2017, 77, 3708–3717. [Google Scholar] [CrossRef]
- Haque, W.; Verma, V.; Hatch, S.; Klimberg, V.S.; Butler, E.B.; Teh, B.S. Response rates and pathologic complete response by breast cancer molecular subtype following neoadjuvant chemotherapy. Breast Cancer Res. Treat. 2018, 170, 559–567. [Google Scholar] [CrossRef]
- Haynes, B.; Sarma, A.; Nangia-Makker, P.; Shekhar, M.P. Breast cancer complexity: Implications of intratumoral heterogeneity in clinical management. Cancer Metastasis Rev. 2017, 36, 547–555. [Google Scholar] [CrossRef]
- Cajal, S.R.Y.; Sesé, M.; Capdevila, C.; Aasen, T.; Mattos-Arruda, L.; Diaz-Cano, S.J.; Hernández-Losa, J.; Castellví, J. Clinical implications of intratumor heterogeneity: Challenges and opportunities. J. Mol. Med. 2020, 98, 161. [Google Scholar] [CrossRef]
- Kitajima, K.; Miyoshi, Y.; Yamano, T.; Odawara, S.; Higuchi, T.; Yamakado, K. Prognostic value of FDG-PET and DWI in breast cancer. Ann. Nucl. Med. 2017, 32, 44–53. [Google Scholar] [CrossRef]
- Paydary, K.; Seraj, S.M.; Zadeh, M.Z.; Emamzadehfard, S.; Shamchi, S.P.; Gholami, S.; Werner, T.J.; Alavi, A. The Evolving Role of FDG-PET/CT in the Diagnosis, Staging, and Treatment of Breast Cancer. Mol. Imaging Biol. 2019, 21, 1–10. [Google Scholar] [CrossRef]
- Groheux, D.; Cochet, A.; Humbert, O.; Alberini, J.L.; Hindié, E.; Mankoff, D. 18F-FDG PET/CT for staging and restaging of breast cancer. J. Nucl. Med. 2016, 57, 17S–26S. [Google Scholar] [CrossRef]
- Evangelista, L.; Urso, L.; Caracciolo, M.; Stracuzzi, F.; Panareo, S.; Cistaro, A.; Catalano, O. FDG PET/CT Volume-Based Quantitative Data and Survival Analysis in Breast Cancer Patients: A Systematic Review of the Literature. Curr. Med. Imaging Former. 2022. Epub ahead of printing. [Google Scholar] [CrossRef]
- Koolen, B.B.; Vrancken Peeters, M.J.T.F.D.; Wesseling, J.; Lips, E.H.; Vogel, W.V.; Aukema, T.S.; van Werkhoven, E.; Gilhuijs, K.G.A.; Rodenhuis, S.; Rutgers, E.J.T.; et al. Association of primary tumour FDG uptake with clinical, histopathological and molecular characteristics in breast cancer patients scheduled for neoadjuvant chemotherapy. Eur. J. Nucl. Med. Mol. Imaging 2012, 39, 1830–1838. [Google Scholar] [CrossRef]
- Kitajima, K.; Fukushima, K.; Miyoshi, Y.; Nishimukai, A.; Hirota, S.; Igarashi, Y.; Katsuura, T.; Maruyama, K.; Hirota, S. Association between 18F-FDG uptake and molecular subtype of breast cancer. Eur. J. Nucl. Med. Mol. Imaging 2015, 42, 1371–1377. [Google Scholar] [CrossRef]
- Antunovic, L.; Gallivanone, F.; Sollini, M.; Sagona, A.; Invento, A.; Manfrinato, G.; Kirienko, M.; Tinterri, C.; Chiti, A.; Castiglioni, I. [18F]FDG PET/CT features for the molecular characterization of primary breast tumors. Eur. J. Nucl. Med. Mol. Imaging 2017, 44, 1945–1954. [Google Scholar] [CrossRef]
- Im, H.-J.; Bradshaw, T.; Solaiyappan, M.; Cho, S.Y. Current Methods to Define Metabolic Tumor Volume in Positron Emission Tomography: Which One is Better? Nucl. Med. Mol. Imaging 2018, 52, 5. [Google Scholar] [CrossRef]
- Castello, A.; Castellani, M.; Florimonte, L.; Urso, L.; Mansi, L.; Lopci, E. The Role of Radiomics in the Era of Immune Checkpoint Inhibitors: A New Protagonist in the Jungle of Response Criteria. J. Clin. Med. 2022, 11, 1740. [Google Scholar] [CrossRef]
- Ibrahim, A.; Primakov, S.; Beuque, M.; Woodruff, H.C.; Halilaj, I.; Wu, G.; Refaee, T.; Granzier, R.; Widaatalla, Y.; Hustinx, R.; et al. Radiomics for precision medicine: Current challenges, future prospects, and the proposal of a new framework. Methods 2021, 188, 20–29. [Google Scholar] [CrossRef]
- Lambin, P.; Leijenaar, R.T.H.; Deist, T.M.; Peerlings, J.; de Jong, E.E.C.; van Timmeren, J.; Sanduleanu, S.; Larue, R.T.H.M.; Even, A.J.G.; Jochems, A.; et al. Radiomics: The bridge between medical imaging and personalized medicine. Nat. Rev. Clin. Oncol. 2017, 14, 749–762. [Google Scholar] [CrossRef]
- Cho, N. Molecular subtypes and imaging phenotypes of breast cancer. Ultrasonography 2016, 35, 281–288. [Google Scholar] [CrossRef]
- Ma, W.; Zhao, Y.; Ji, Y.; Guo, X.; Jian, X.; Liu, P.; Wu, S. Breast Cancer Molecular Subtypes Prediction by Mammographic Radiomics Features. Acad. Radiol. 2019, 26, 196. [Google Scholar] [CrossRef]
- Chang, R.F.; Chen, H.H.; Chang, Y.C.; Huang, C.S.; Chen, J.H.; Lo, C.M. Quantification of breast tumor heterogeneity for ER status, HER2 status, and TN molecular subtype evaluation on DCE-MRI. Magn. Reson. Imaging 2016, 34, 809–819. [Google Scholar] [CrossRef]
- Sollini, M.; Cozzi, L.; Ninatti, G.; Antunovic, L.; Cavinato, L.; Chiti, A.; Kirienko, M. PET/CT radiomics in breast cancer: Mind the step. Methods 2021, 188, 122–132. [Google Scholar] [CrossRef]
- Ranschaert, E.R.; Morozov, S.; Algra, P.R. Artificial Intelligence in Medical Imaging: Opportunities, Applications and Risks; Springer: Cham, Switzerland, 2019. [Google Scholar] [CrossRef]
- Lee, J.G.; Jun, S.; Cho, Y.W.; Lee, H.; Kim, G.B.; Seo, J.B.; Kim, N. Deep Learning in Medical Imaging: General Overview. Korean J. Radiol. 2017, 18, 570–584. [Google Scholar] [CrossRef] [PubMed]
- Min, S.; Lee, B.; Yoon, S. Deep learning in bioinformatics. Brief. Bioinform. 2017, 18, 851–869. [Google Scholar] [CrossRef] [PubMed]
- Manco, L.; Maffei, N.; Strolin, S.; Vichi, S.; Bottazzi, L.; Strigari, L. Basic of machine learning and deep learning in imaging for medical physicists. Phys. Medica 2021, 83, 194–205. [Google Scholar] [CrossRef]
- Maffei, N.; Manco, L.; Aluisio, G.; D’Angelo, E.; Ferrazza, P.; Vanoni, V.; Meduri, B.; Lohr, F.; Guidi, G. Radiomics classifier to quantify automatic segmentation quality of cardiac sub-structures for radiotherapy treatment planning. Phys. Medica 2021, 83, 278–286. [Google Scholar] [CrossRef]
- Aktolun, C. Artificial intelligence and radiomics in nuclear medicine: Potentials and challenges. Eur. J. Nucl. Med. Mol. Imaging 2019, 46, 2731–2736. [Google Scholar] [CrossRef]
- Liu, J.; Bian, H.; Zhang, Y.; Gao, Y.; Yin, G.; Wang, Z.; Li, X.; Ma, W.; Xu, W. Molecular subtype classification of breast cancer using established radiomic signature models based on 18F-FDG PET/CT images. Front. Biosci.-Landmark 2021, 26, 475–484. [Google Scholar] [CrossRef]
- Krajnc, D.; Papp, L.; Nakuz, T.S.; Magometschnigg, H.F.; Grahovac, M.; Spielvogel, C.P.; Ecsedi, B.; Bago-Horvath, Z.; Haug, A.; Karanikas, G.; et al. Breast tumor characterization using [18F]FDG-PET/CT imaging combined with data preprocessing and radiomics. Cancers 2021, 13, 1249. [Google Scholar] [CrossRef]
- Ou, X.; Zhang, J.; Wang, J.; Pang, F.; Wang, Y.; Wei, X.; Ma, X. Radiomics based on 18F-FDG PET/CT could differentiate breast carcinoma from breast lymphoma using machine-learning approach: A preliminary study. Cancer Med. 2020, 9, 496–506. [Google Scholar] [CrossRef]
- Ou, X.; Wang, J.; Zhou, R.; Zhu, S.; Pang, F.; Zhou, Y.; Tian, R.; Ma, X. Ability of 18 F-FDG PET/CT radiomic features to distinguish breast carcinoma from breast lymphoma. Contrast Media Mol. Imaging 2019, 2019, 4507694. [Google Scholar] [CrossRef]
- Acar, E.; Turgut, B.; Yiǧit, S.; Kaya, G.C. Comparison of the volumetric and radiomics findings of 18F-FDG PET/CT images with immunohistochemical prognostic factors in local/locally advanced breast cancer. Nucl. Med. Commun. 2019, 40, 764–772. [Google Scholar] [CrossRef]
- Groheux, D.; Majdoub, M.; Tixier, F.; Le Rest, C.C.; Martineau, A.; Merlet, P.; Espié, M.; de Roquancourt, A.; Hindié, E.; Hatt, M.; et al. Do clinical, histological or immunohistochemical primary tumour characteristics translate into different 18F-FDG PET/CT volumetric and heterogeneity features in stage II/III breast cancer? Eur. J. Nucl. Med. Mol. Imaging 2015, 42, 1682–1691. [Google Scholar] [CrossRef] [PubMed]
- Yoon, H.J.; Kim, Y.; Kim, B.S. Intratumoral metabolic heterogeneity predicts invasive components in breast ductal carcinoma in situ. Eur. Radiol. 2015, 25, 3648–3658. [Google Scholar] [CrossRef] [PubMed]
- Soussan, M.; Orlhac, F.; Boubaya, M.; Zelek, L.; Ziol, M.; Eder, V.; Buvat, I. Relationship between tumor heterogeneity measured on FDG-PET/CT and pathological prognostic factors in invasive breast cancer. PLoS ONE 2014, 9, e94017. [Google Scholar] [CrossRef] [PubMed]
- Umutlu, L.; Kirchner, J.; Bruckmann, N.M.; Morawitz, J.; Antoch, G.; Ting, S.; Bittner, A.K.; Hoffmann, O.; Häberle, L.; Ruckhäberle, E.; et al. Multiparametric18F-FDG PET/MRI-Based Radiomics for Prediction of Pathological Complete Response to Neoadjuvant Chemotherapy in Breast Cancer. Cancers 2022, 14, 1727. [Google Scholar] [CrossRef] [PubMed]
- Fantini, L.; Belli, M.L.; Azzali, I.; Loi, E.; Bettinelli, A.; Feliciani, G.; Mezzenga, E.; Fedeli, A.; Asioli, S.; Paganelli, G.; et al. Exploratory Analysis of 18F-3′-deoxy-3′-fluorothymidine (18F-FLT) PET/CT-Based Radiomics for the Early Evaluation of Response to Neoadjuvant Chemotherapy in Patients With Locally Advanced Breast Cancer. Front. Oncol. 2021, 11, 2315. [Google Scholar] [CrossRef]
- Choi, J.H.; Kim, H.A.; Kim, W.; Lim, I.; Lee, I.; Byun, B.H.; Noh, W.C.; Seong, M.K.; Lee, S.S.; Kim, B.I.; et al. Early prediction of neoadjuvant chemotherapy response for advanced breast cancer using PET/MRI image deep learning. Sci. Rep. 2020, 10, 21149. [Google Scholar] [CrossRef]
- Li, P.; Wang, X.; Xu, C.; Liu, C.; Zheng, C.; Fulham, M.J.; Feng, D.; Wang, L.; Song, S.; Huang, G. 18F-FDG PET/CT radiomic predictors of pathologic complete response (pCR) to neoadjuvant chemotherapy in breast cancer patients. Eur. J. Nucl. Med. Mol. Imaging 2020, 47, 1116–1126. [Google Scholar] [CrossRef]
- Antunovic, L.; De Sanctis, R.; Cozzi, L.; Kirienko, M.; Sagona, A.; Torrisi, R.; Tinterri, C.; Santoro, A.; Chiti, A.; Zelic, R.; et al. PET/CT radiomics in breast cancer: Promising tool for prediction of pathological response to neoadjuvant chemotherapy. Eur. J. Nucl. Med. Mol. Imaging 2019, 46, 1468–1477. [Google Scholar] [CrossRef]
- Lee, H.; Lee, D.E.; Park, S.; Kim, T.S.; Jung, S.Y.; Lee, S.; Kang, H.S.; Lee, E.S.; Sim, S.H.; Park, I.H.; et al. Predicting response to neoadjuvant chemotherapy in patients with breast cancer: Combined statistical modeling using clinicopathological factors and FDG PET/CT texture parameters. Clin. Nucl. Med. 2019, 44, 21–29. [Google Scholar] [CrossRef]
- Willaime, J.M.Y.; Turkheimer, F.E.; Kenny, L.M.; Aboagye, E.O. Quantification of intra-tumour cell proliferation heterogeneity using imaging descriptors of 18F fluorothymidine-positron emission tomography. Phys. Med. Biol. 2013, 58, 187–203. [Google Scholar] [CrossRef]
- Cheng, J.; Ren, C.; Liu, G.; Shui, R.; Zhang, Y.; Li, J.; Shao, Z. Development of High-Resolution Dedicated PET-Based Radiomics Machine Learning Model to Predict Axillary Lymph Node Status in Early-Stage Breast Cancer. Cancers 2022, 14, 950. [Google Scholar] [CrossRef] [PubMed]
- Eifer, M.; Pinian, H.; Klang, E.; Alhoubani, Y.; Kanana, N.; Tau, N.; Davidson, T.; Konen, E.; Catalano, O.A.; Eshet, Y.; et al. FDG PET/CT radiomics as a tool to differentiate between reactive axillary lymphadenopathy following COVID-19 vaccination and metastatic breast cancer axillary lymphadenopathy: A pilot study. Eur. Radiol. 2022, 31, 5921–5929. [Google Scholar] [CrossRef] [PubMed]
- Chen, K.; Yin, G.; Xu, W. Predictive Value of18 F-FDG PET/CT-Based Radiomics Model for Occult Axillary Lymph Node Metastasis in Clinically Node-Negative Breast Cancer. Diagnostics 2022, 12, 997. [Google Scholar] [CrossRef] [PubMed]
- Araz, M.; Soydal, Ç.; Gündüz, P.; Kırmızı, A.; Bakırarar, B.; Sak, S.D.; Özkan, E. Can Radiomics Analyses in18F-FDG PET/CT Images of Primary Breast Carcinoma Predict Hormone Receptor Status? Mol. Imaging Radionucl. Ther. 2022, 31, 49–56. [Google Scholar] [CrossRef] [PubMed]
- Moreau, N.; Rousseau, C.; Fourcade, C.; Santini, G.; Brennan, A.; Ferrer, L.; Lacombe, M.; Guillerminet, C.; Colombié, M.; Jézéquel, P.; et al. Automatic segmentation of metastatic breast cancer lesions on18f-fdg pet/ct longitudinal acquisitions for treatment response assessment. Cancers 2022, 14, 101. [Google Scholar] [CrossRef]
- Lee, J.W.; Kim, S.Y.; Han, S.W.; Lee, J.E.; Hong, S.H.; Lee, S.M.; Jo, I.Y. Clinical significance of peritumoral adipose tissue PET/CT imaging features for predicting axillary lymph node metastasis in patients with breast cancer. J. Pers. Med. 2021, 11, 1029. [Google Scholar] [CrossRef]
- Li, Z.; Kitajima, K.; Hirata, K.; Togo, R.; Takenaka, J.; Miyoshi, Y.; Kudo, K.; Ogawa, T.; Haseyama, M. Preliminary study of AI-assisted diagnosis using FDG-PET/CT for axillary lymph node metastasis in patients with breast cancer. EJNMMI Res. 2021, 11, 10. [Google Scholar] [CrossRef]
- Song, B.-I. A machine learning-based radiomics model for the prediction of axillary lymph-node metastasis in breast cancer. Breast Cancer 2021, 28, 664–671. [Google Scholar] [CrossRef]
- Schiano, C.; Franzese, M.; Pane, K.; Garbino, N.; Soricelli, A.; Salvatore, M.; de Nigris, F.; Napoli, C. Hybrid18f-fdg-pet/mri measurement of standardized uptake value coupled with yin yang 1 signature in metastatic breast cancer. A preliminary study. Cancers 2019, 11, 1444. [Google Scholar] [CrossRef]
- Jo, J.H.; Chung, H.W.; So, Y.; Yoo, Y.B.; Park, K.S.; Nam, S.E.; Lee, E.J.; Noh, W.C. FDG PET/CT to Predict Recurrence of Early Breast Invasive Ductal Carcinoma. Diagnostics 2022, 12, 694. [Google Scholar] [CrossRef]
- Bouron, C.; Mathie, C.; Seegers, V.; Morel, O.; Jézéquel, P.; Lasla, H.; Guillerminet, C.; Girault, S.; Lacombe, M.; Sher, A.; et al. Prognostic Value of Metabolic, Volumetric and Textural Parameters of Baseline [18 F]FDG PET/CT in Early Triple-Negative Breast Cancer. Cancers 2022, 14, 637. [Google Scholar] [CrossRef] [PubMed]
- Weber, M.; Kersting, D.; Umutlu, L.; Schäfers, M.; Rischpler, C.; Fendler, W.P.; Buvat, I.; Herrmann, K.; Seifert, R. Just another “Clever Hans”? Neural networks and FDG PET-CT to predict the outcome of patients with breast cancer. Eur. J. Nucl. Med. Mol. Imaging 2021, 48, 3141–3150. [Google Scholar] [CrossRef] [PubMed]
- Chang, C.C.; Chen, C.J.; Hsu, W.L.; Chang, S.M.; Huang, Y.F.; Tyan, Y.C. Prognostic Significance of Metabolic Parameters and Textural Features on 18F-FDG PET/CT in Invasive Ductal Carcinoma of Breast. Sci. Rep. 2019, 9, 10946. [Google Scholar] [CrossRef] [PubMed]
- Groheux, D.; Martineau, A.; Teixeira, L.; Espié, M.; de Cremoux, P.; Bertheau, P.; Merlet, P.; Lemarignier, C. 18FDG-PET/CT for predicting the outcome in ER+/HER2- breast cancer patients: Comparison of clinicopathological parameters and PET image-derived indices including tumor texture analysis. Breast Cancer Res. 2017, 19, 3. [Google Scholar] [CrossRef] [PubMed]
- Satoh, Y.; Imokawa, T.; Fujioka, T.; Mori, M.; Yamaga, E.; Takahashi, K.; Takahashi, K.; Kawase, T.; Kubota, K.; Tateishi, U.; et al. Deep learning for image classification in dedicated breast positron emission tomography (dbPET). Ann. Nucl. Med. 2022, 36, 401–410. [Google Scholar] [CrossRef]
- Satoh, Y.; Hirata, K.; Tamada, D.; Funayama, S.; Onishi, H. Texture Analysis in the Diagnosis of Primary Breast Cancer: Comparison of High-Resolution Dedicated Breast Positron Emission Tomography (dbPET) and Whole-Body PET/CT. Front. Med. 2020, 7, 603303. [Google Scholar] [CrossRef]
- Hathi, D.K.; Li, W.; Seo, Y.; Flavell, R.R.; Kornak, J.; Franc, B.L.; Joe, B.N.; Esserman, L.J.; Hylton, N.M.; Jones, E.F. Evaluation of primary breast cancers using dedicated breast PET and whole-body PET. Sci. Rep. 2020, 10, 21930. [Google Scholar] [CrossRef]
- Moscoso, A.; Ruibal, Á.; Domínguez-Prado, I.; Fernández-Ferreiro, A.; Herranz, M.; Albaina, L.; Argibay, S.; Silva-Rodríguez, J.; Pardo-Montero, J.; Aguiar, P. Texture analysis of high-resolution dedicated breast 18 F-FDG PET images correlates with immunohistochemical factors and subtype of breast cancer. Eur. J. Nucl. Med. Mol. Imaging 2018, 45, 196–206. [Google Scholar] [CrossRef]
- Satoh, Y.; Tamada, D.; Omiya, Y.; Onishi, H.; Motosugi, U. Diagnostic Performance of the Support Vector Machine Model for Breast Cancer on Ring-Shaped Dedicated Breast Positron Emission Tomography Images. J. Comput. Assist. Tomogr. 2020, 44, 413–418. [Google Scholar] [CrossRef]
- Cheng, L.; Zhang, J.; Wang, Y.; Xu, X.; Zhang, Y.; Zhang, Y.; Liu, G.; Cheng, J. Textural features of 18F-FDG PET after two cycles of neoadjuvant chemotherapy can predict pCR in patients with locally advanced breast cancer. Ann. Nucl. Med. 2017, 31, 544–552. [Google Scholar] [CrossRef]
- Castaldo, R.; Garbino, N.; Cavaliere, C.; Incoronato, M.; Basso, L.; Cuocolo, R.; Pace, L.; Salvatore, M.; Franzese, M.; Nicolai, E. A Complex Radiomic Signature in Luminal Breast Cancer from a Weighted Statistical Framework: A Pilot Study. Diagnostics 2022, 12, 499. [Google Scholar] [CrossRef] [PubMed]
- Takahashi, K.; Fujioka, T.; Oyama, J.; Mori, M.; Yamaga, E.; Yashima, Y.; Imokawa, T.; Hayashi, A.; Kujiraoka, Y.; Tsuchiya, J.; et al. Deep Learning Using Multiple Degrees of Maximum-Intensity Projection for PET/CT Image Classification in Breast Cancer. Tomography 2022, 8, 131–141. [Google Scholar] [CrossRef] [PubMed]
- Aide, N.; Salomon, T.; Blanc-Fournier, C.; Grellard, J.M.; Levy, C.; Lasnon, C. Implications of reconstruction protocol for histo-biological characterisation of breast cancers using FDG-PET radiomics. EJNMMI Res. 2018, 8, 114. [Google Scholar] [CrossRef]
- Boughdad, S.; Nioche, C.; Orlhac, F.; Jehl, L.; Champion, L.; Buvat, I. Influence of age on radiomic features in 18F-FDG PET in normal breast tissue and in breast cancer tumors. Oncotarget 2018, 9, 30855–30868. [Google Scholar] [CrossRef]
- Orlhac, F.; Boughdad, S.; Philippe, C.; Stalla-Bourdillon, H.; Nioche, C.; Champion, L.; Soussan, M.; Frouin, F.; Frouin, V.; Buvat, I. A postreconstruction harmonization method for multicenter radiomic studies in PET. J. Nucl. Med. 2018, 59, 1321–1328. [Google Scholar] [CrossRef] [PubMed]
- Yang, Z.; Sun, Y.; Xu, X.; Zheng, Y.; Zhang, J.; Xue, J.; Wang, M.; Yuan, H.; Hu, S.; Shi, W.; et al. The assessment of estrogen receptor status and its intratumoral heterogeneity in patients with breast cancer by using 18F-fluoroestradiol PET/CT. Clin. Nucl. Med. 2017, 42, 421–427. [Google Scholar] [CrossRef] [PubMed]
- Orlhac, F.; Nioche, C.; Soussan, M.; Buvat, I. Understanding changes in tumor texture indices in PET: A comparison between visual assessment and index values in simulated and patient data. J. Nucl. Med. 2017, 58, 387–392. [Google Scholar] [CrossRef]
- Hatt, M.; Majdoub, M.; Vallières, M.; Tixier, F.; Le Rest, C.C.; Groheux, D.; Hindié, E.; Martineau, A.; Pradier, O.; Hustinx, R.; et al. 18F-FDG PET uptake characterization through texture analysis: Investigating the complementary nature of heterogeneity and functional tumor volume in a multi-cancer site patient cohort. J. Nucl. Med. 2015, 56, 38–44. [Google Scholar] [CrossRef]
- Orlhac, F.; Soussan, M.; Maisonobe, J.A.; Garcia, C.A.; Vanderlinden, B.; Buvat, I. Tumor texture analysis in 18F-FDG PET: Relationships between texture parameters, histogram indices, standardized uptake values, metabolic volumes, and total lesion glycolysis. J. Nucl. Med. 2014, 55, 414–422. [Google Scholar] [CrossRef]
- Chen, Y.; Wang, Z.; Yin, G.; Sui, C.; Liu, Z.; Li, X.; Chen, W. Prediction of HER2 expression in breast cancer by combining PET/CT radiomic analysis and machine learning. Ann. Nucl. Med. 2022, 36, 172–182. [Google Scholar] [CrossRef]
- Umutlu, L.; Kirchner, J.; Bruckmann, N.M.; Morawitz, J.; Antoch, G.; Ingenwerth, M.; Bittner, A.K.; Hoffmann, O.; Haubold, J.; Grueneisen, J.; et al. Multiparametric integrated18f-fdg pet/mri-based radiomics for breast cancer phenotyping and tumor decoding. Cancers 2021, 13, 2928. [Google Scholar] [CrossRef] [PubMed]
- Molina-García, D.; García-Vicente, A.M.; Pérez-Beteta, J.; Amo-Salas, M.; Martínez-González, A.; Tello-Galán, M.J.; Soriano-Castrejón, Á.; Pérez-García, V.M. Intratumoral heterogeneity in 18F-FDG PET/CT by textural analysis in breast cancer as a predictive and prognostic subrogate. Ann. Nucl. Med. 2018, 32, 379–388. [Google Scholar] [CrossRef] [PubMed]
- Lemarignier, C.; Martineau, A.; Teixeira, L.; Vercellino, L.; Espié, M.; Merlet, P.; Groheux, D. Correlation between tumour characteristics, SUV measurements, metabolic tumour volume, TLG and textural features assessed with 18F-FDG PET in a large cohort of oestrogen receptor-positive breast cancer patients. Eur. J. Nucl. Med. Mol. Imaging 2017, 44, 1145–1154. [Google Scholar] [CrossRef] [PubMed]
- Ha, S.; Park, S.; Bang, J.I.; Kim, E.K.; Lee, H.Y. Metabolic Radiomics for Pretreatment 18F-FDG PET/CT to Characterize Locally Advanced Breast Cancer: Histopathologic Characteristics, Response to Neoadjuvant Chemotherapy, and Prognosis. Sci. Rep. 2017, 7, 1556. [Google Scholar] [CrossRef] [PubMed]
- Aide, N.; Elie, N.; Blanc-Fournier, C.; Levy, C.; Salomon, T.; Lasnon, C. Hormonal Receptor Immunochemistry Heterogeneity and 18F-FDG Metabolic Heterogeneity: Preliminary Results of Their Relationship and Prognostic Value in Luminal Non-Metastatic Breast Cancers. Front. Oncol. 2021, 10, 599050. [Google Scholar] [CrossRef]
- Huang, S.; Franc, B.L.; Harnish, R.J.; Liu, G.; Mitra, D.; Copeland, T.P.; Arasu, V.A.; Kornak, J.; Jones, E.F.; Behr, S.C.; et al. Exploration of PET and MRI radiomic features for decoding breast cancer phenotypes and prognosis. Npj Breast Cancer 2018, 4, 24. [Google Scholar] [CrossRef]
- Yoon, H.J.; Kim, Y.; Chung, J.; Kim, B.S. Predicting neo-adjuvant chemotherapy response and progression-free survival of locally advanced breast cancer using textural features of intratumoral heterogeneity on F-18 FDG PET/CT and diffusion-weighted MR imaging. Breast J. 2019, 25, 373–380. [Google Scholar] [CrossRef]
- Niell, B.L.; Freer, P.E.; Weinfurtner, R.J.; Arleo, E.K.; Drukteinis, J.S. Screening for Breast Cancer. Radiol. Clin. N. Am. 2017, 55, 1145–1162. [Google Scholar] [CrossRef]
- van den Ende, C.; Oordt-Speets, A.M.; Vroling, H.; van Agt, H.M.E. Benefits and harms of breast cancer screening with mammography in women aged 40–49 years: A systematic review. Int. J. Cancer 2017, 141, 1295–1306. [Google Scholar] [CrossRef]
- Tagliafico, A.S.; Piana, M.; Schenone, D.; Lai, R.; Massone, A.M.; Houssami, N. Overview of radiomics in breast cancer diagnosis and prognostication. Breast 2020, 49, 74–80. [Google Scholar] [CrossRef]
- Bi, W.L.; Hosny, A.; Schabath, M.B.; Giger, M.L.; Birkbak, N.J.; Mehrtash, A.; Allison, T.; Arnaout, O.; Abbosh, C.; Dunn, I.F.; et al. Artificial intelligence in cancer imaging: Clinical challenges and applications. CA. Cancer J. Clin. 2019, 69, 127–157. [Google Scholar] [CrossRef] [PubMed]
- Panareo, S.; Urso, L.; Nieri, A.; Caracciolo, M.; Valpiani, G.; Torricelli, P.; Frassoldati, A.; Cittanti, C.; Rollo, M.; Bartolomei, M. Clinical-Diagnostic Relevance of Breast “Incidentaloma” Detected During 18F-Fluoro-2-Deoxy-D-Glucose Positron Emission Tomography/Computed Tomography: Correlation with Radiological Imaging and Histopathology. Indian J. Nucl. Med. 2021, 36, 385. [Google Scholar] [CrossRef] [PubMed]
- Tsang, J.Y.S.; Tse, G.M. Molecular Classification of Breast Cancer. Adv. Anat. Pathol. 2020, 27, 27–35. [Google Scholar] [CrossRef] [PubMed]
- Evangelista, L.; Cervino, A.R.; Ghiotto, C.; Saibene, T.; Michieletto, S.; Fernando, B.; Orvieto, E.; Guarneri, V.; Conte, P. Could semiquantitative FDG analysis add information to the prognosis in patients with stage II/III breast cancer undergoing neoadjuvant treatment? Eur. J. Nucl. Med. Mol. Imaging 2015, 42, 1648–1655. [Google Scholar] [CrossRef] [PubMed]
- Montemurro, F.; Nuzzolese, I.; Ponzone, R. Neoadjuvant or adjuvant chemotherapy in early breast cancer? Expert Opin. Pharmacother. 2020, 21, 1071–1082. [Google Scholar] [CrossRef]
- Orsaria, P.; Grasso, A.; Ippolito, E.; Pantano, F.; Sammarra, M.; Altomare, C.; Cagli, B.; Costa, F.; Perrone, G.; Soponaru, G.; et al. Clinical Outcomes Among Major Breast Cancer Subtypes After Neoadjuvant Chemotherapy: Impact on Breast Cancer Recurrence and Survival. Anticancer Res. 2021, 41, 2697–2709. [Google Scholar] [CrossRef] [PubMed]
- von Minckwitz, G.; Untch, M.; Blohmer, J.-U.; Costa, S.D.; Eidtmann, H.; Fasching, P.A.; Gerber, B.; Eiermann, W.; Hilfrich, J.; Huober, J.; et al. Definition and Impact of Pathologic Complete Response on Prognosis After Neoadjuvant Chemotherapy in Various Intrinsic Breast Cancer Subtypes. J. Clin. Oncol. 2012, 30, 1796–1804. [Google Scholar] [CrossRef]
- Chen, S.-C.; Yu, C.-C.; Chang, H.-K.; Lin, Y.-C.; Lo, Y.-F.; Shen, S.-C.; Kuo, W.-L.; Tsai, H.-P.; Chou, H.-H.; Chu, C.-H.; et al. Discrepancy of Breast and Axillary Pathologic Complete Response and Outcomes in Different Subtypes of Node-positive Breast Cancer after Neoadjuvant Chemotherapy. J. Cancer 2021, 12, 5365. [Google Scholar] [CrossRef]
- Ngo, H.; Tortorella, S.M.; Ververis, K.; Karagiannis, T.C. The Warburg effect: Molecular aspects and therapeutic possibilities. Mol. Biol. Rep. 2015, 42, 825–834. [Google Scholar] [CrossRef]
- Weinhouse, S.; Warburg, O.; Burk, D.; Schade, A.L. On respiratory impairment in cancer cells. Science 1956, 124, 267–272. [Google Scholar] [CrossRef]
- Brackstone, M.; Baldassarre, F.G.; Perera, F.E.; Cil, T.; Mac Gregor, M.C.; Dayes, I.S.; Engel, J.; Horton, J.K.; King, T.A.; Kornecki, A.; et al. Management of the Axilla in Early-Stage Breast Cancer: Ontario Health (Cancer Care Ontario) and ASCO Guideline. J. Clin. Oncol. 2021, 39, 3056–3082. [Google Scholar] [CrossRef] [PubMed]
- Van Der Noordaa, M.E.M.; Van Duijnhoven, F.H.; Cuijpers, F.N.E.; Van Werkhoven, E.; Wiersma, T.G.; Elkhuizen, P.H.M.; Winter-Warnars, G.; Dezentje, V.; Sonke, G.S.; Groen, E.J.; et al. Toward omitting sentinel lymph node biopsy after neoadjuvant chemotherapy in patients with clinically node-negative breast cancer. Br. J. Surg. 2021, 108, 667–674. [Google Scholar] [CrossRef] [PubMed]
- Peristeri, D.V.; Harissis, H.V. Axillary lymph node dissection vs sentinel biopsy only among women with early-stage breast cancer and sentinel node metastasis: A systematic review and meta-analysis. Breast J. 2021, 27, 158–164. [Google Scholar] [CrossRef]
- Li, J.; Chen, Z.; Su, K.; Zeng, J. Clinicopathological classification and traditional prognostic indicators of breast cancer. Int. J. Clin. Exp. Pathol. 2015, 8, 8500. [Google Scholar] [PubMed]
- Urso, L.; Quartuccio, N.; Caracciolo, M.; Evangelista, L.; Schirone, A.; Frassoldati, A.; Arnone, G.; Panareo, S.; Bartolomei, M. Impact on the long-term prognosis of FDG PET/CT in luminal-A and luminal-B breast cancer. Nucl. Med. Commun. 2022, 43, 212–219. [Google Scholar] [CrossRef] [PubMed]
- Teixeira, S.C.; Rebolleda, J.F.; Koolen, B.B.; Wesseling, J.; Jurado, R.S.; Stokkel, M.P.M.; Del Puig CózarSantiago, M.; Van Der Noort, V.; Rutgers, E.J.T.; Olmos, R.A.V. Evaluation of a Hanging-Breast PET System for Primary Tumor Visualization in Patients With Stage I-III Breast Cancer: Comparison With Standard PET/CT. AJR. Am. J. Roentgenol. 2016, 206, 1307–1314. [Google Scholar] [CrossRef] [PubMed]
- Moliner, L.; Benlloch, J.M.; Carles, M.; Correcher, C.; Gonzalez, A.J.; Orero, A.; Sanchez, F.; Soriano, A. Performance characteristics of the MAMMI PEMT scanner based on NEMA NU 2-2007. IEEE Nucl. Sci. Symp. Conf. Rec. 2010, 2591–2594. [Google Scholar] [CrossRef]
- O’Connor, M.K.; Tran, T.D.; Swanson, T.N.; Ellingson, L.R.; Hunt, K.N.; Whaley, D.H. Improved visualization of breast tissue on a dedicated breast PET system through ergonomic redesign of the imaging table. EJNMMI Res. 2017, 7, 100. [Google Scholar] [CrossRef]
- Zwanenburg, A.; Vallières, M.; Abdalah, M.A.; Aerts, H.J.W.L.; Andrearczyk, V.; Apte, A.; Ashrafinia, S.; Bakas, S.; Beukinga, R.J.; Boellaard, R.; et al. The Image Biomarker Standardization Initiative: Standardized Quantitative Radiomics for High-Throughput Image-based Phenotyping. Radiology 2020, 295, 328–338. [Google Scholar] [CrossRef]
- Koo, T.K.; Li, M.Y. A Guideline of Selecting and Reporting Intraclass Correlation Coefficients for Reliability Research. J. Chiropr. Med. 2016, 15, 155–163. [Google Scholar] [CrossRef]
- Veronesi, P.; Corso, G. Standard and controversies in sentinel node in breast cancer patients. Breast 2020, 48, S53–S56. [Google Scholar] [CrossRef]
- Hustinx, R.; Pruim, J.; Lassmann, M.; Visvikis, D. An EANM position paper on the application of artificial intelligence in nuclear medicine. Eur. J. Pediatr. 2022, 1–6. [Google Scholar] [CrossRef] [PubMed]


Publisher’s Note: MDPI stays neutral with regard to jurisdictional claims in published maps and institutional affiliations. |
© 2022 by the authors. Licensee MDPI, Basel, Switzerland. This article is an open access article distributed under the terms and conditions of the Creative Commons Attribution (CC BY) license (https://creativecommons.org/licenses/by/4.0/).